
Indoor Air Quality Improvement in Public Toilets at Railway Stations in China: A Field and Numerical Study

Abstract
:1. Introduction
2. Literature Review
3. Indoor Air Quality of Toilet
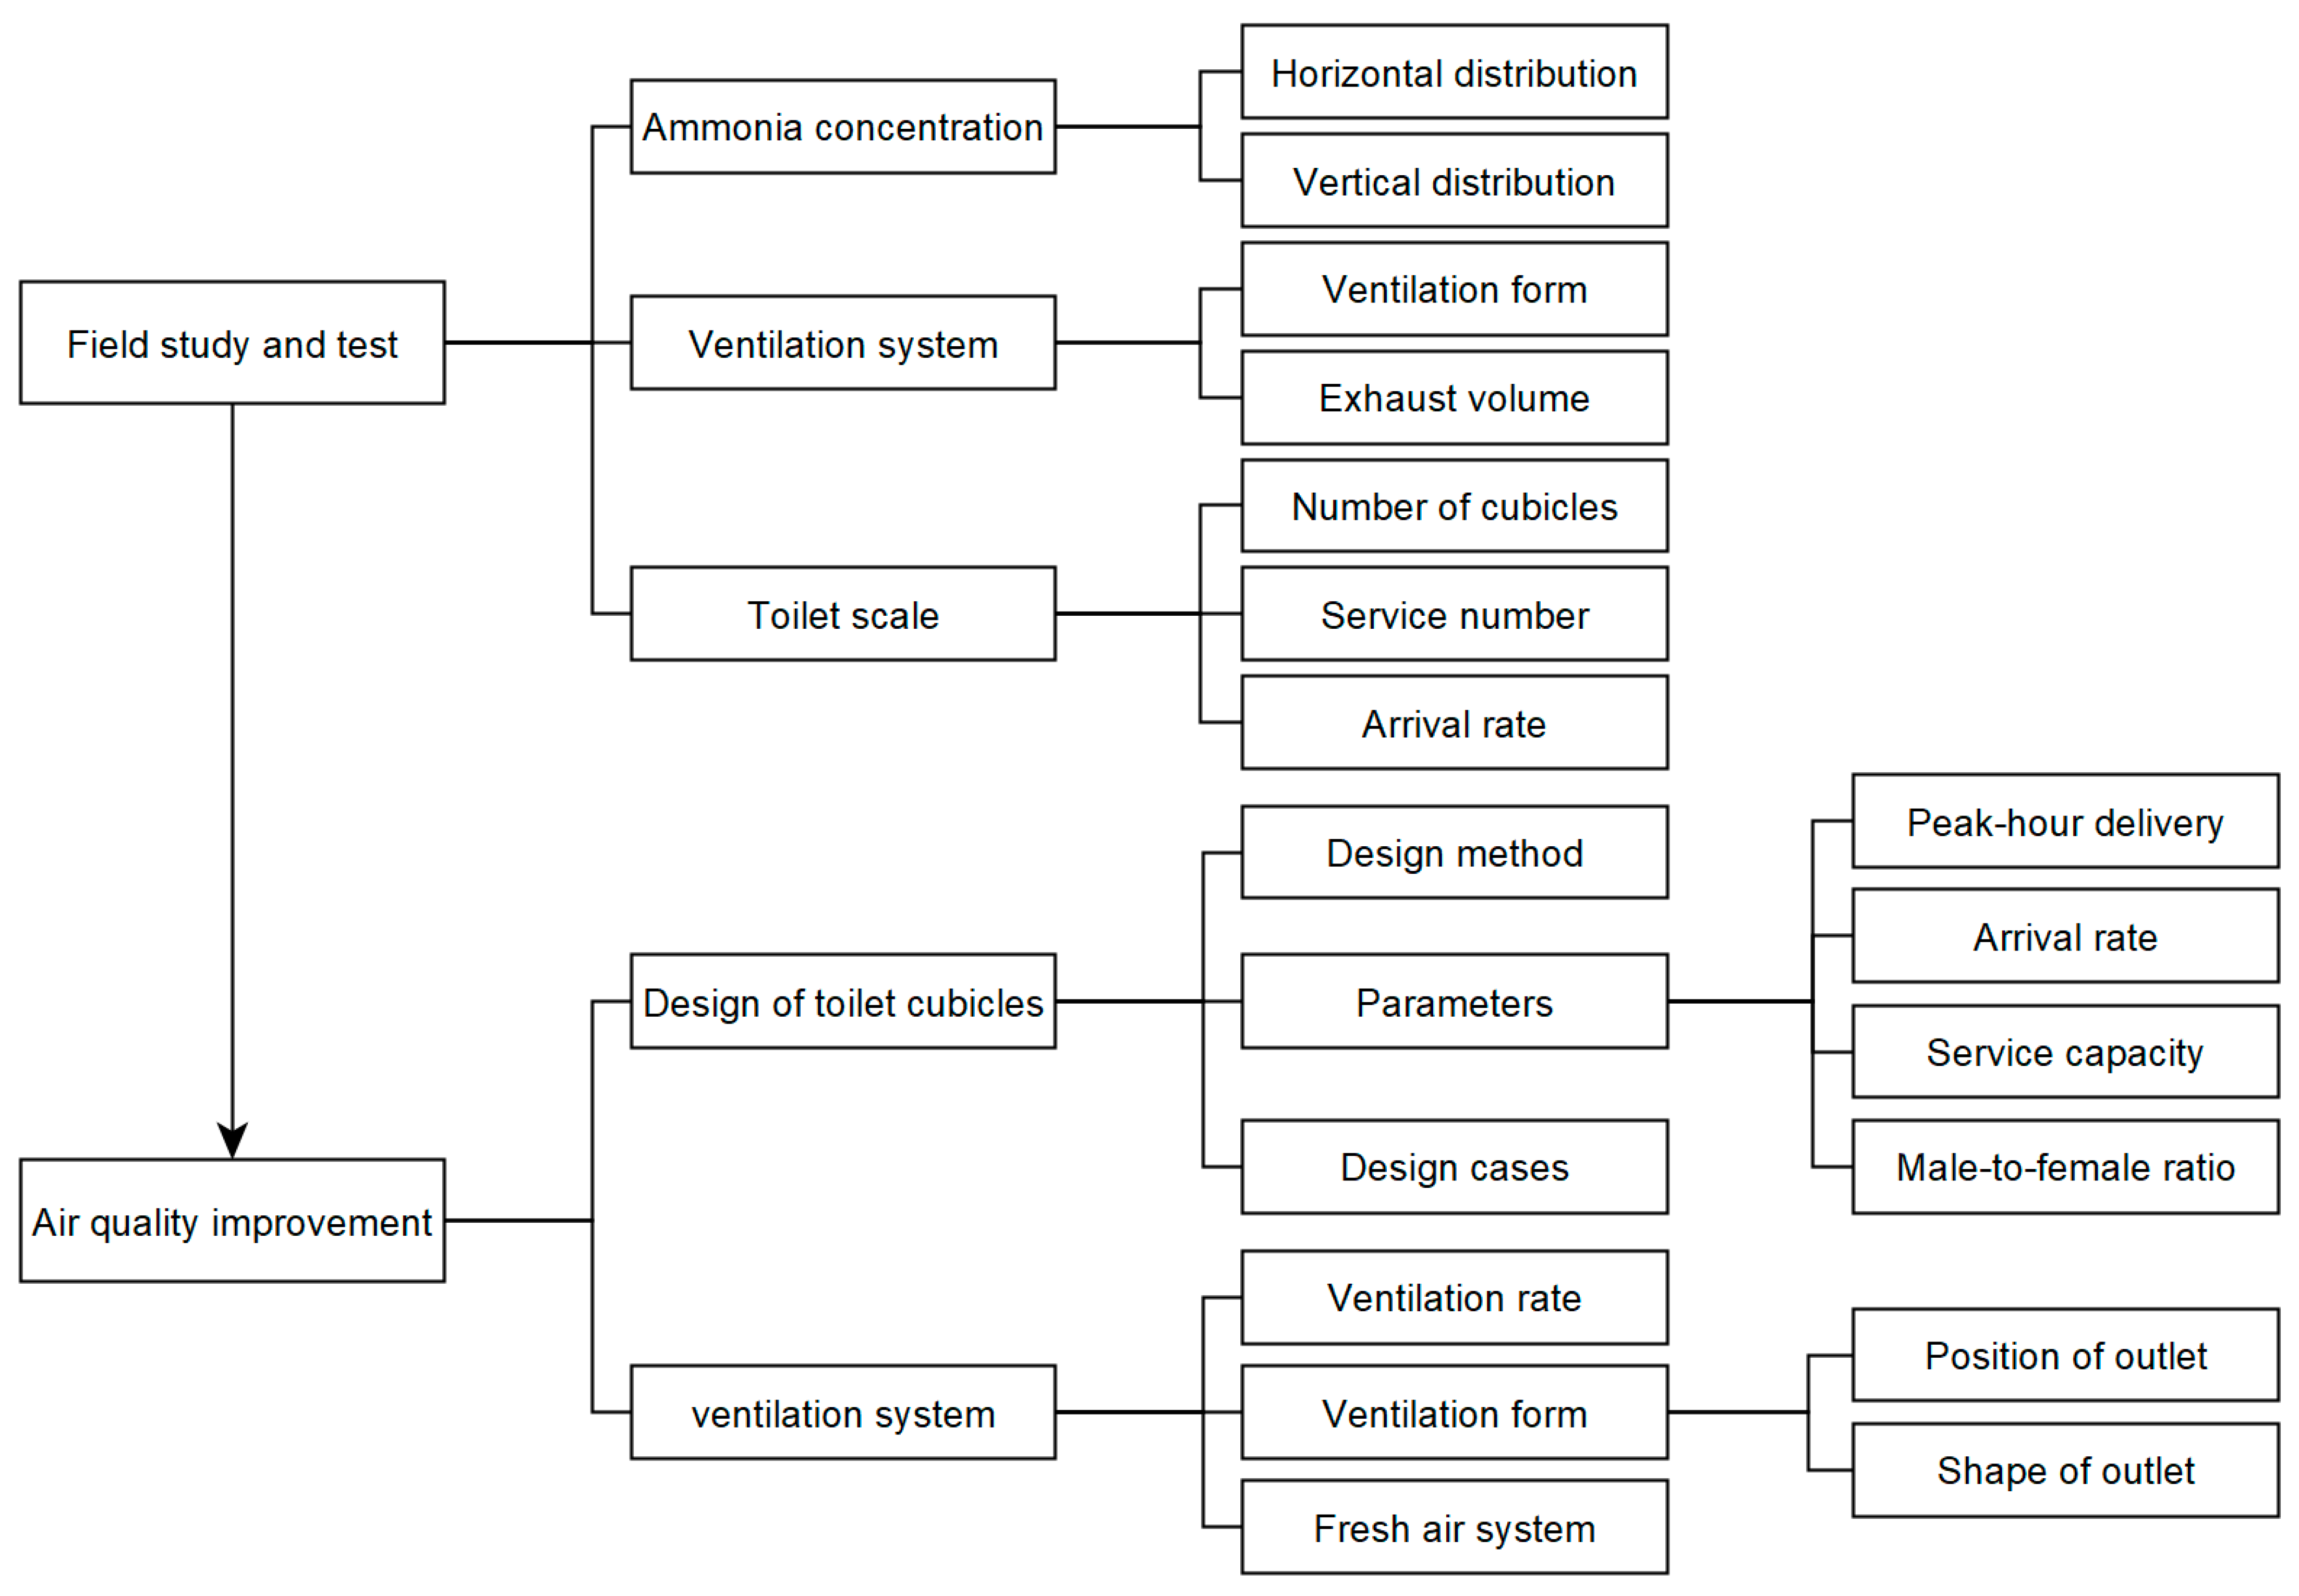
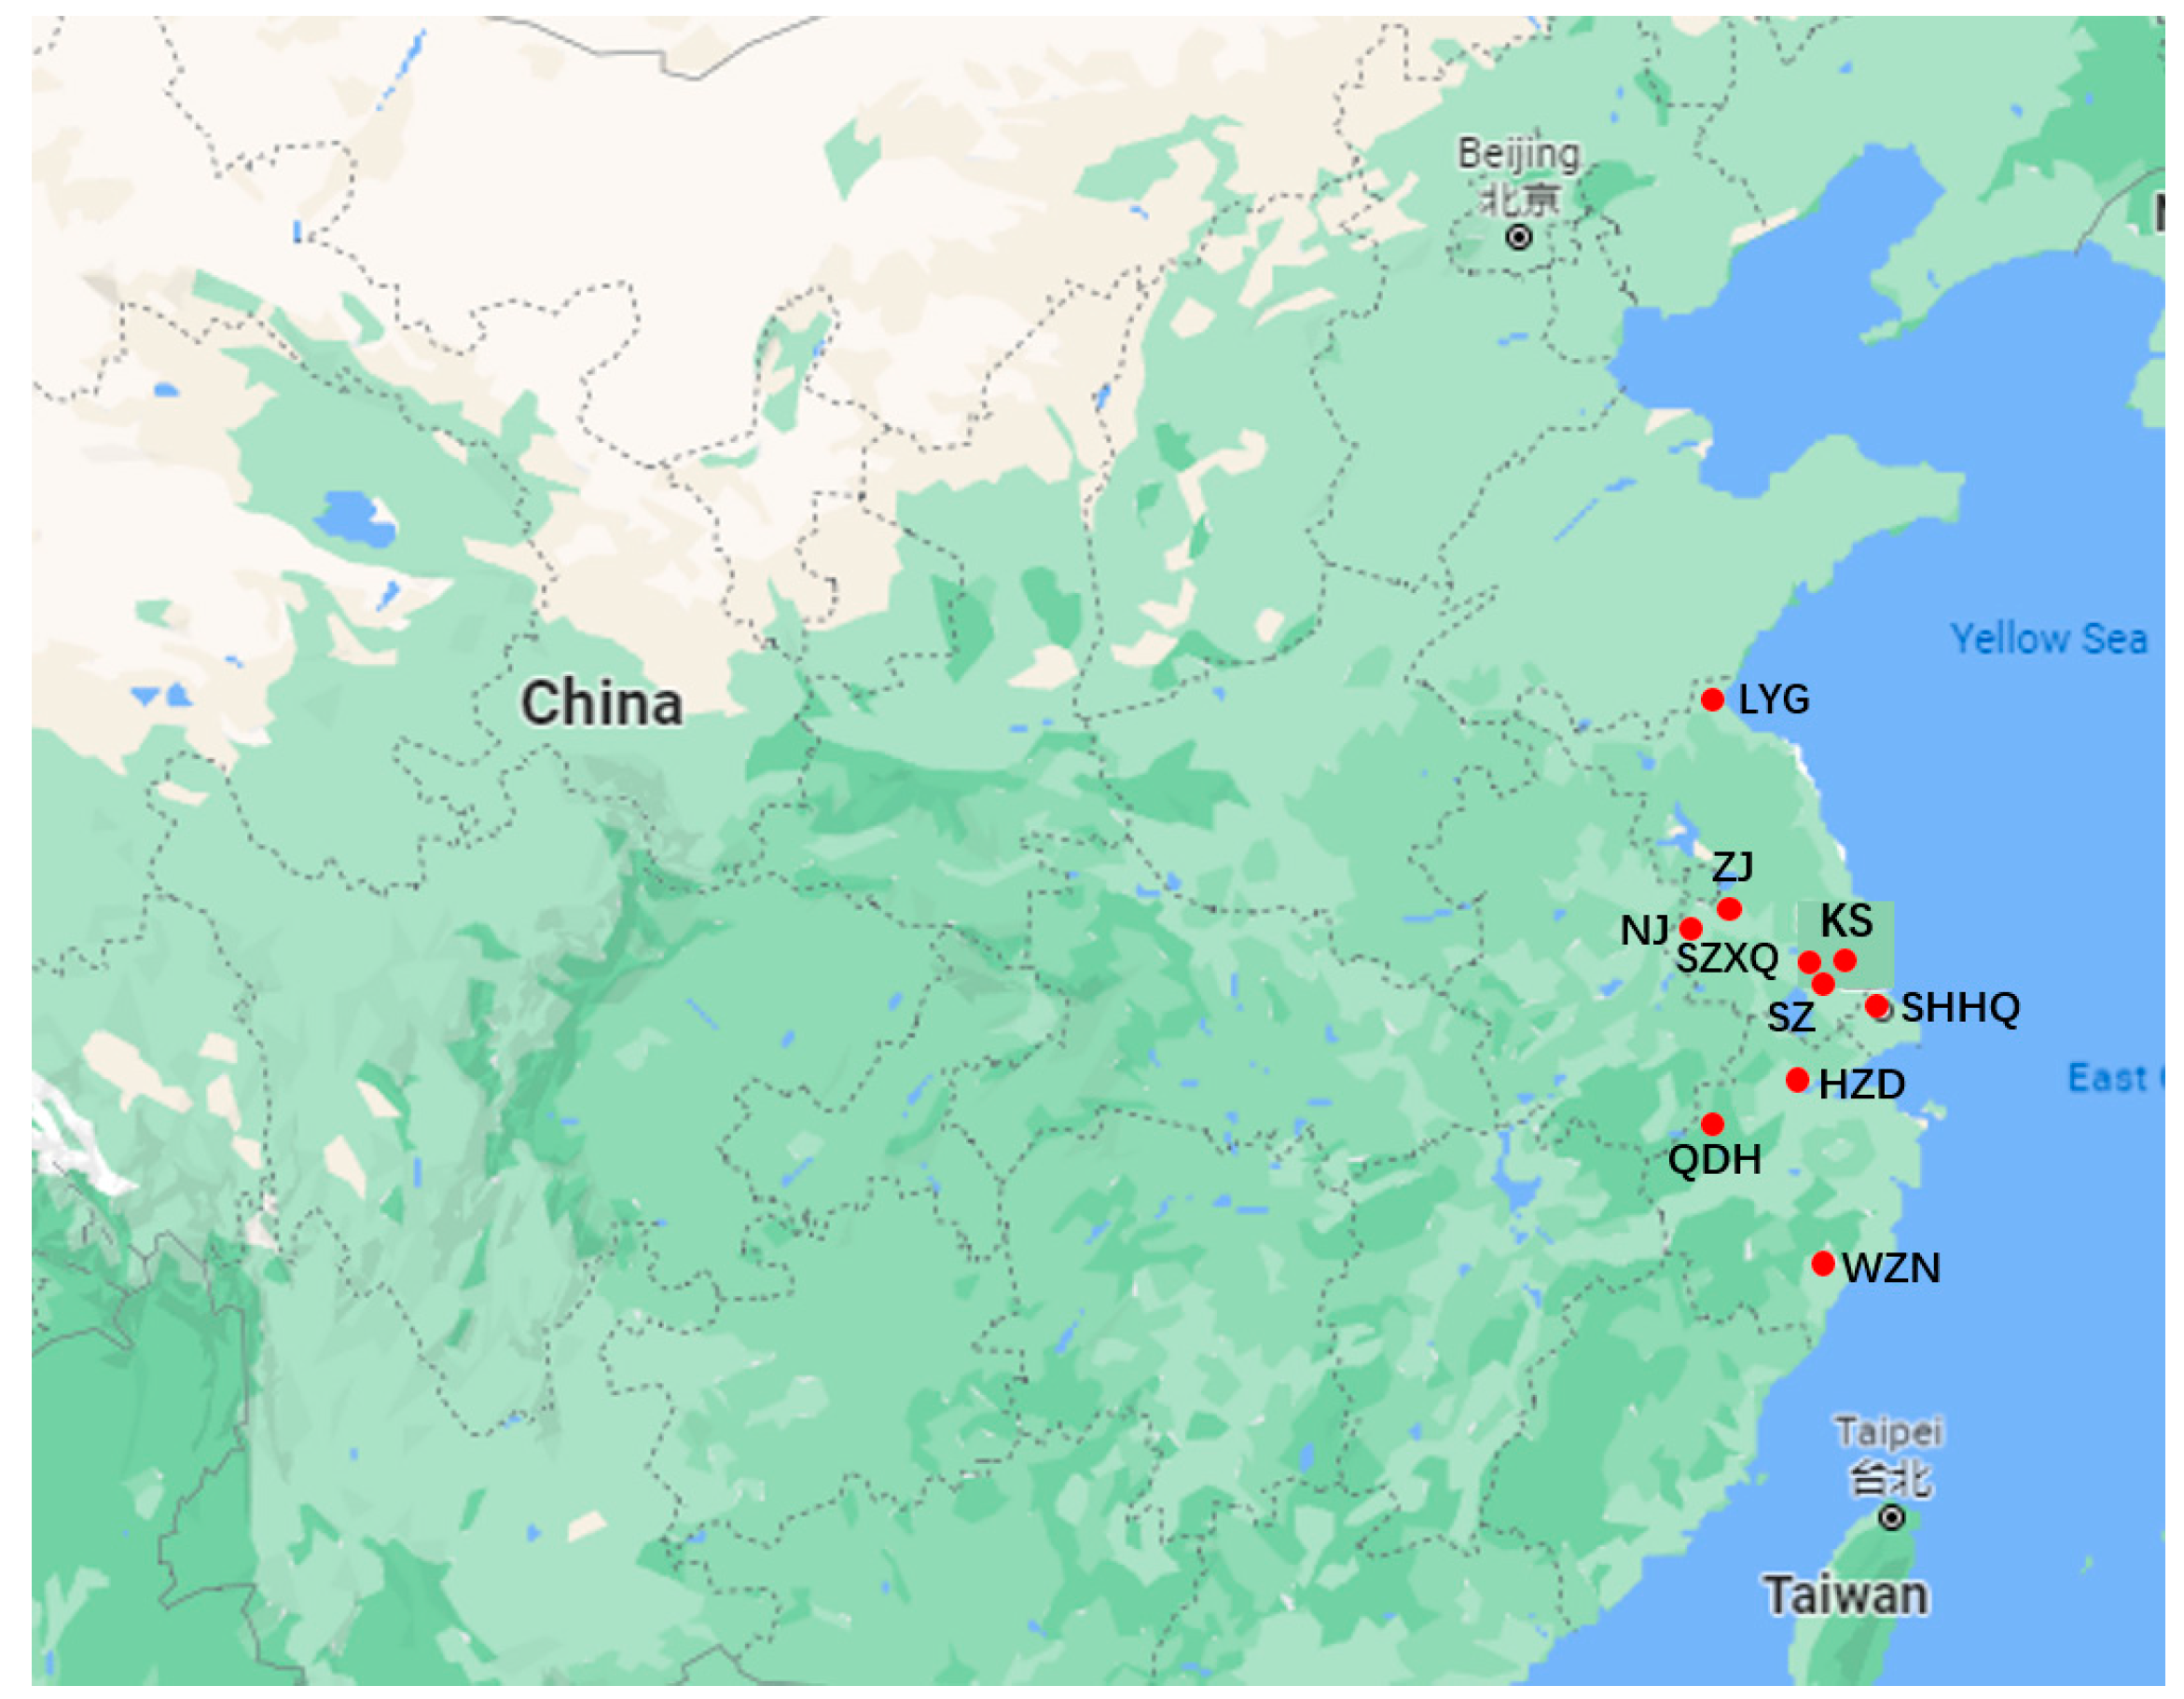
3.1. Research Subjects
3.2. Field Study
3.3. Results and Disicussion of Air Quality Status Survey
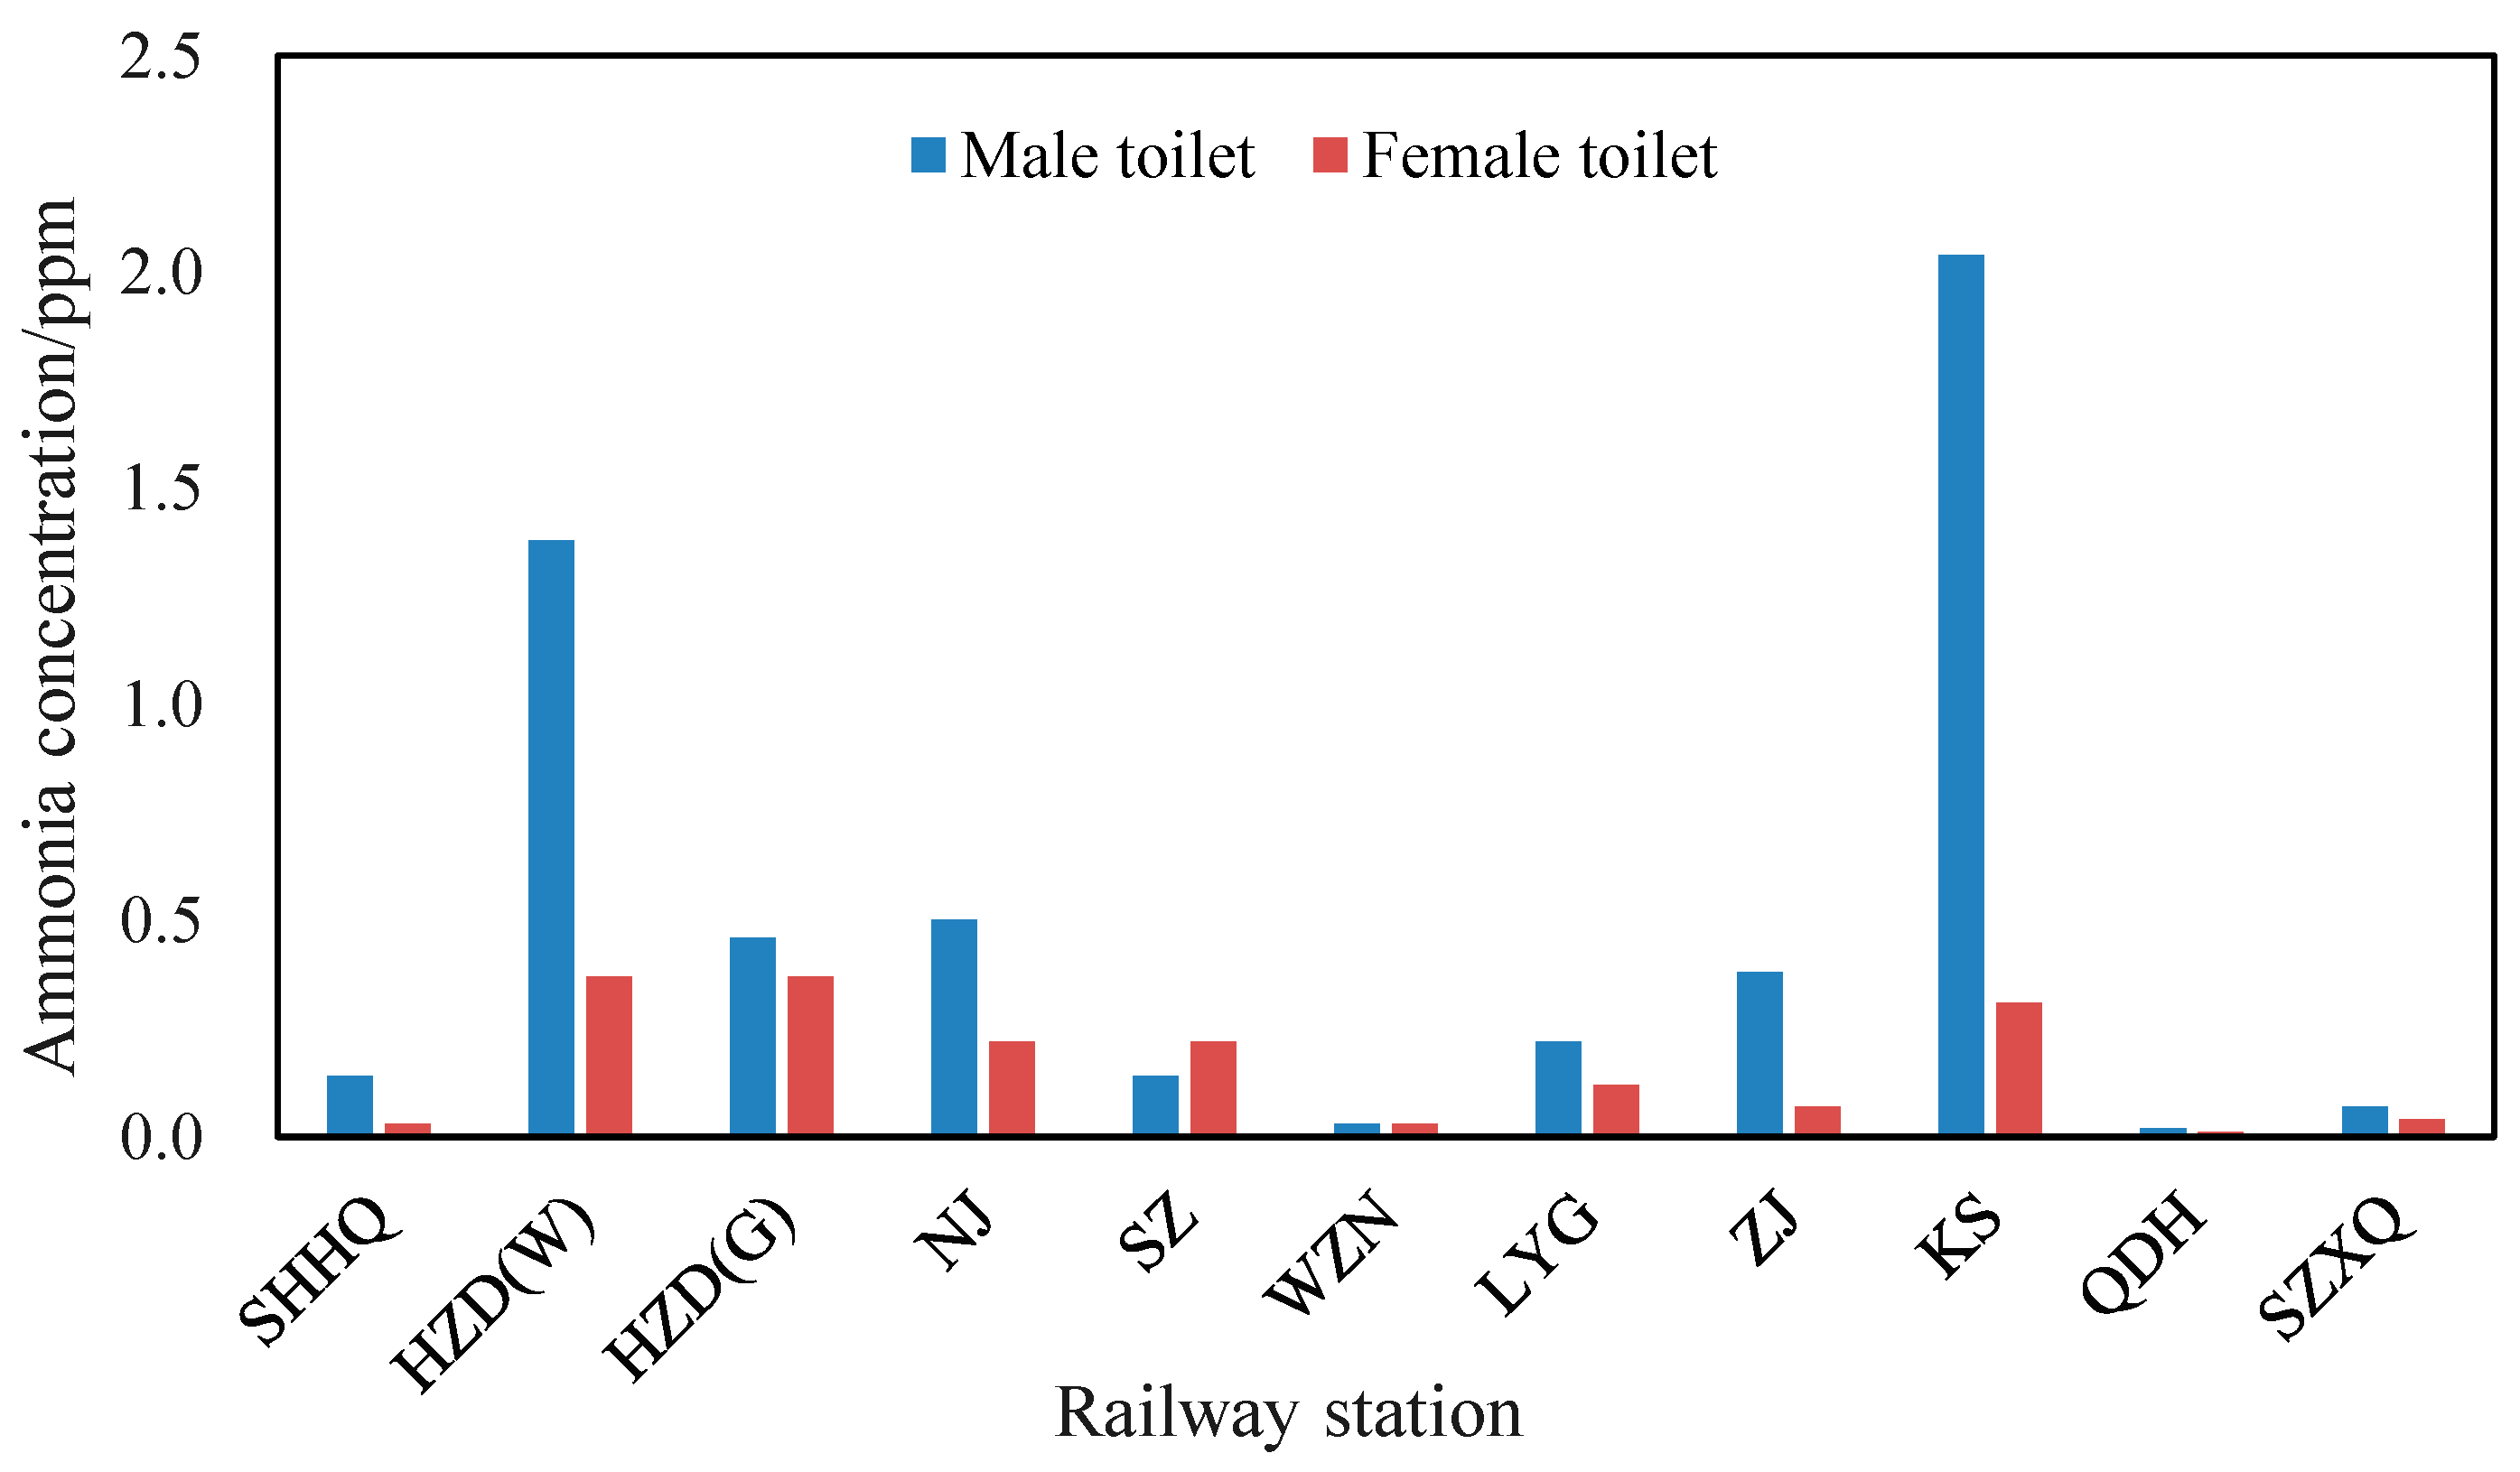
3.3.1. Ammonia Concentration
3.3.2. Ventilation System
4. Air Quality Improvement
4.1. Toilet Scale
4.1.1. Service Capacity
4.1.2. Design of the Number of Toilets
4.1.3. Recommended RMFC
4.2. Ventilation Optimization
4.2.1. Method and Basic Model
4.2.2. Mesh Generation and Independence Analysis
4.2.3. Verification of Turbulence Models
4.2.4. Solution Methodology and Boundary Conditions
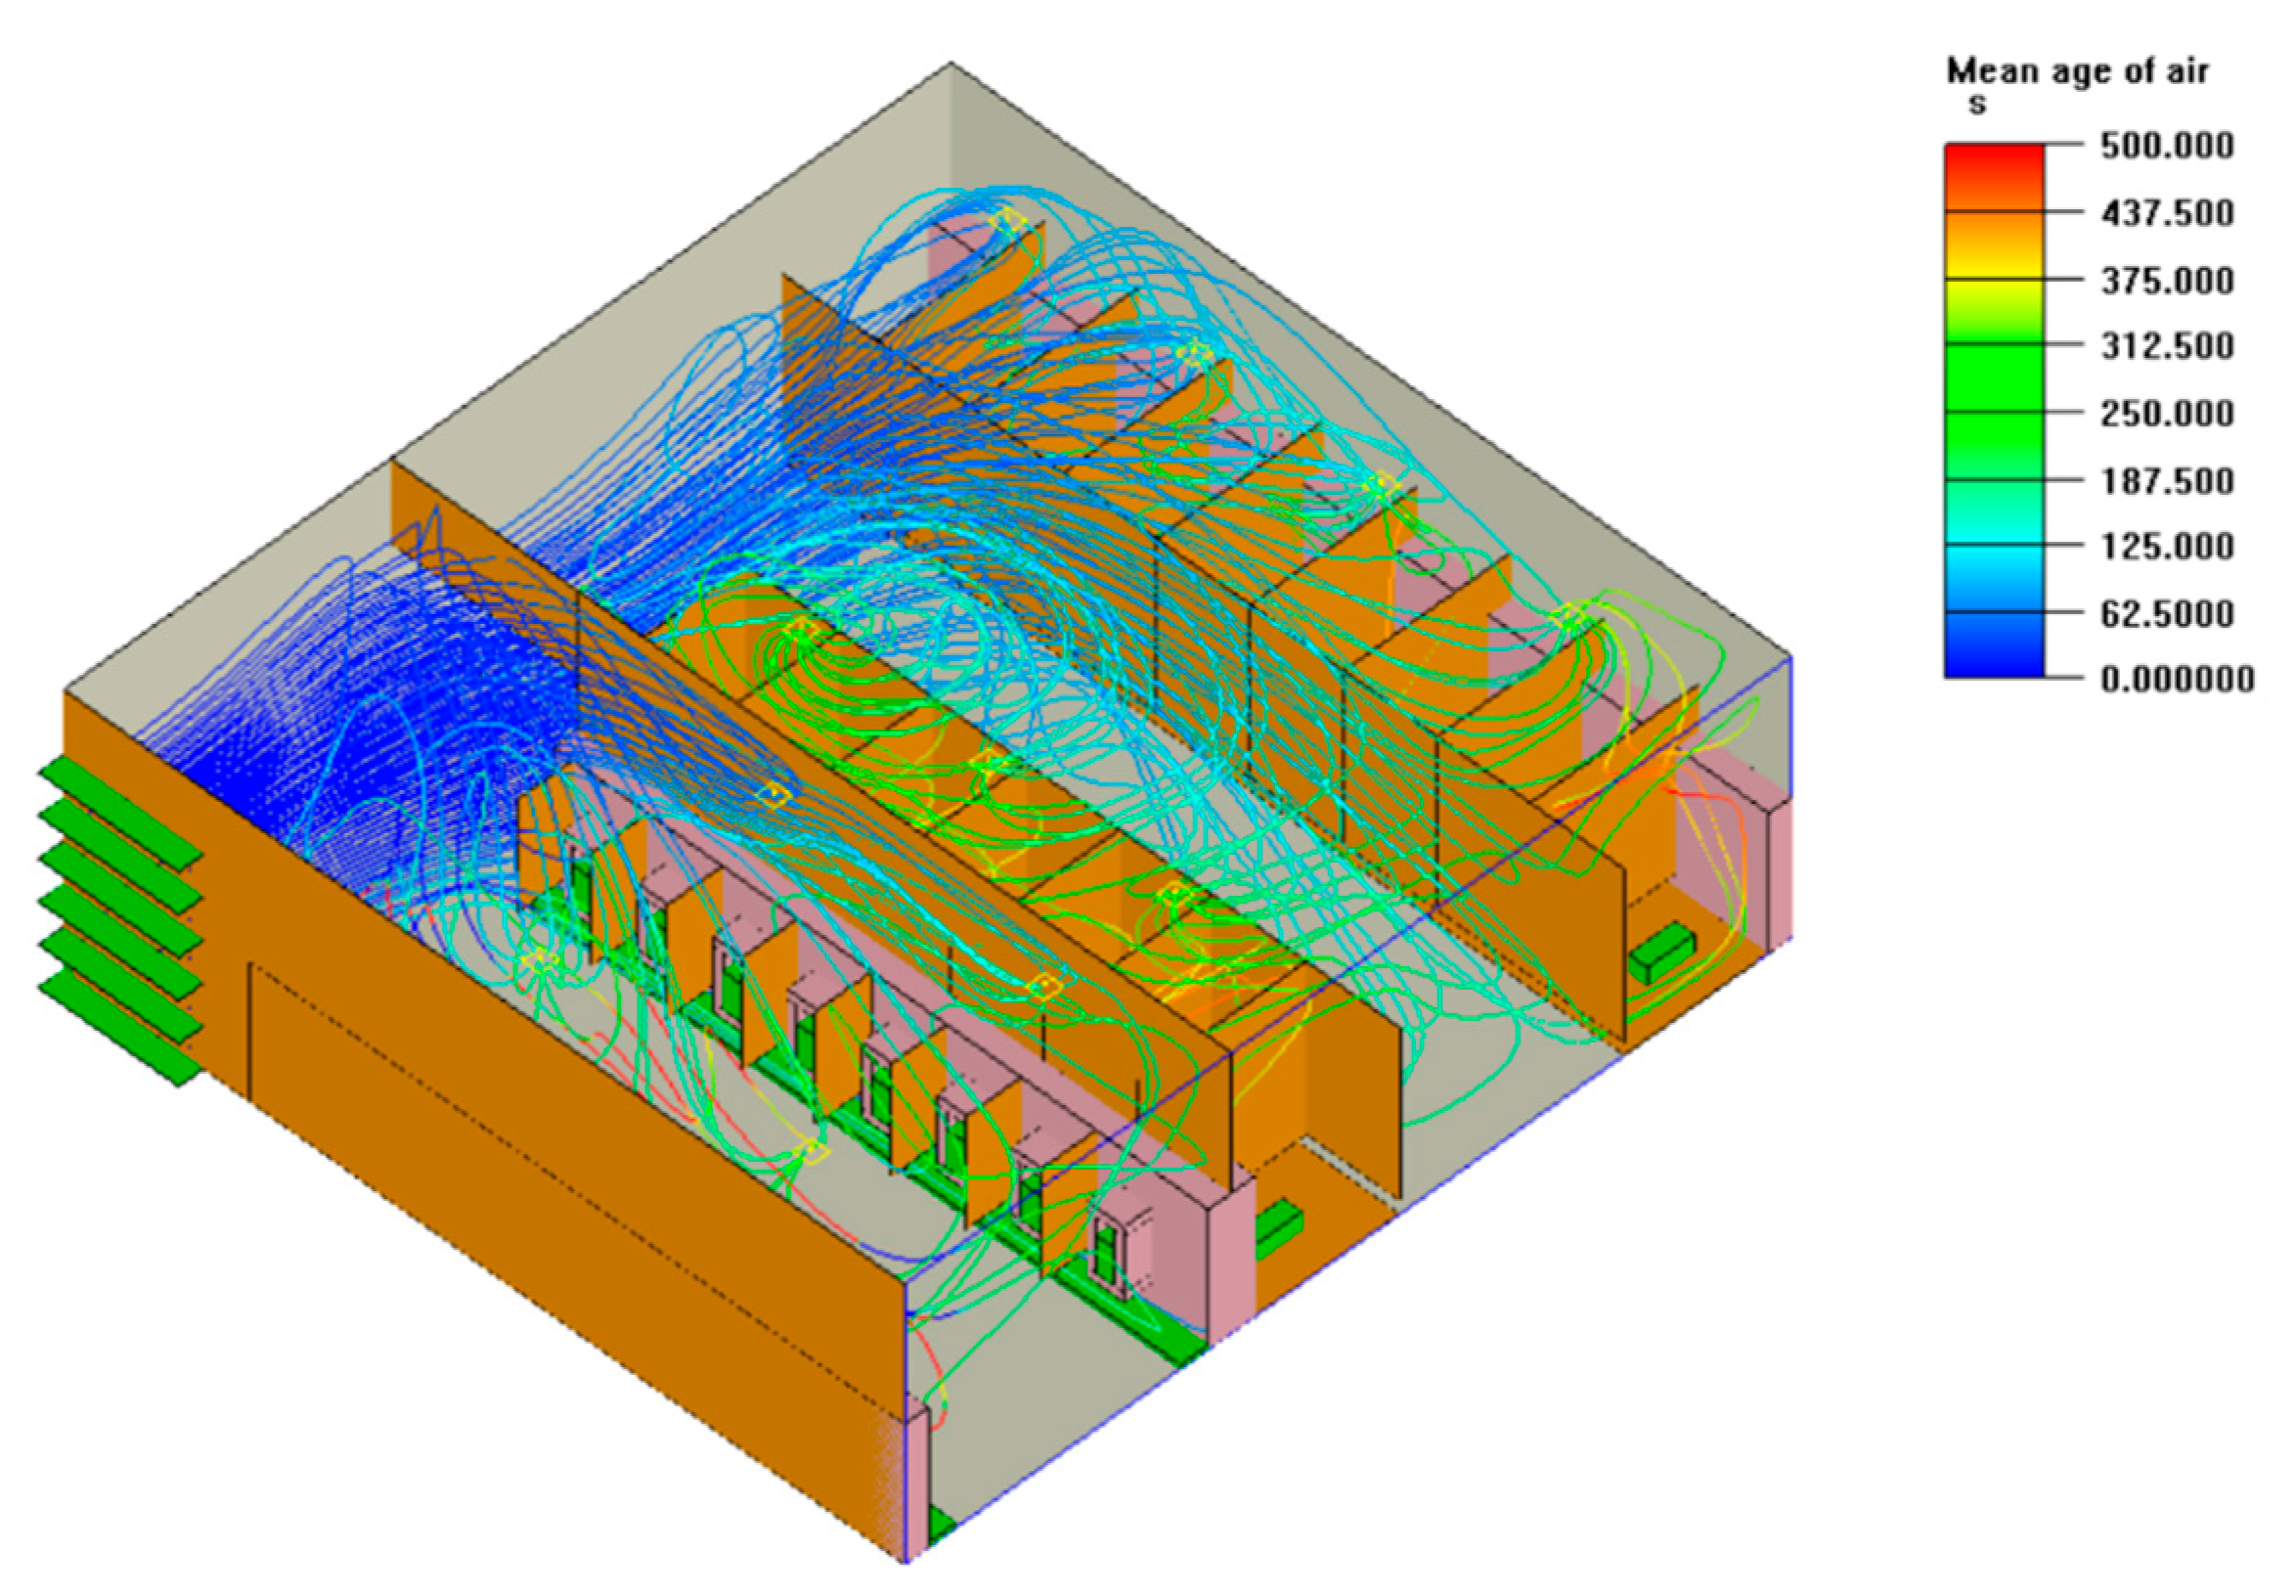
4.2.5. Ventilation Volume
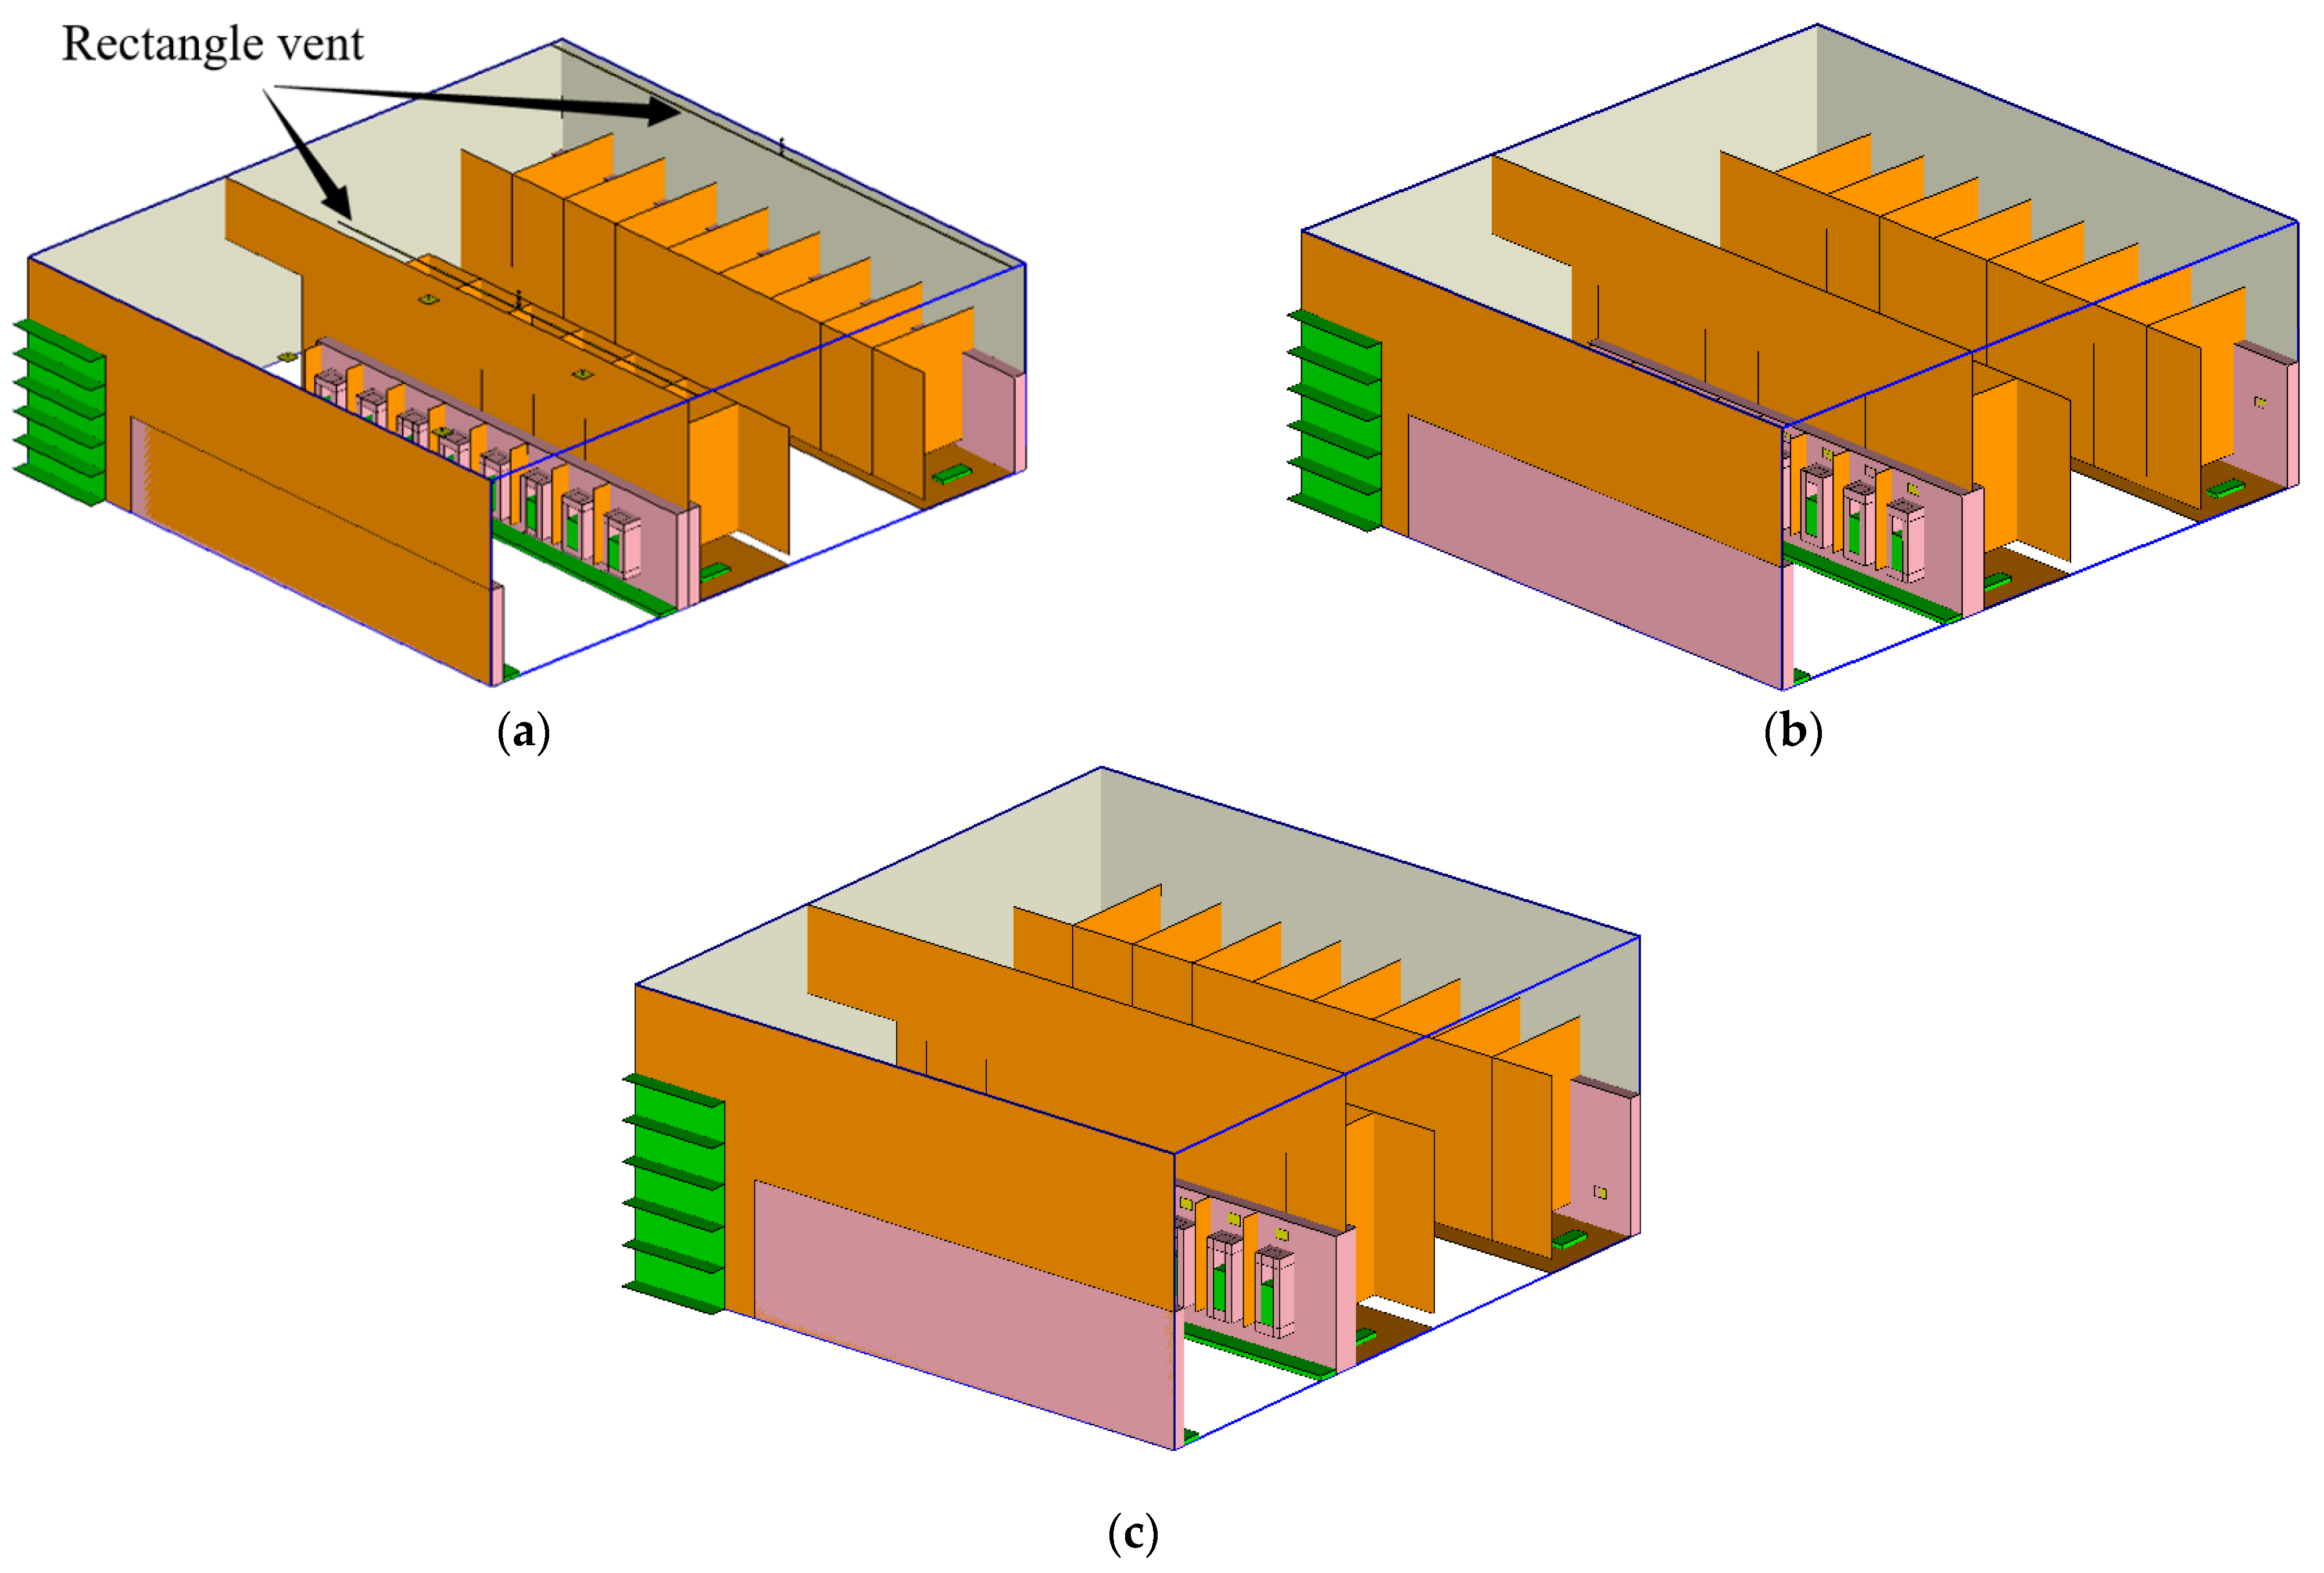
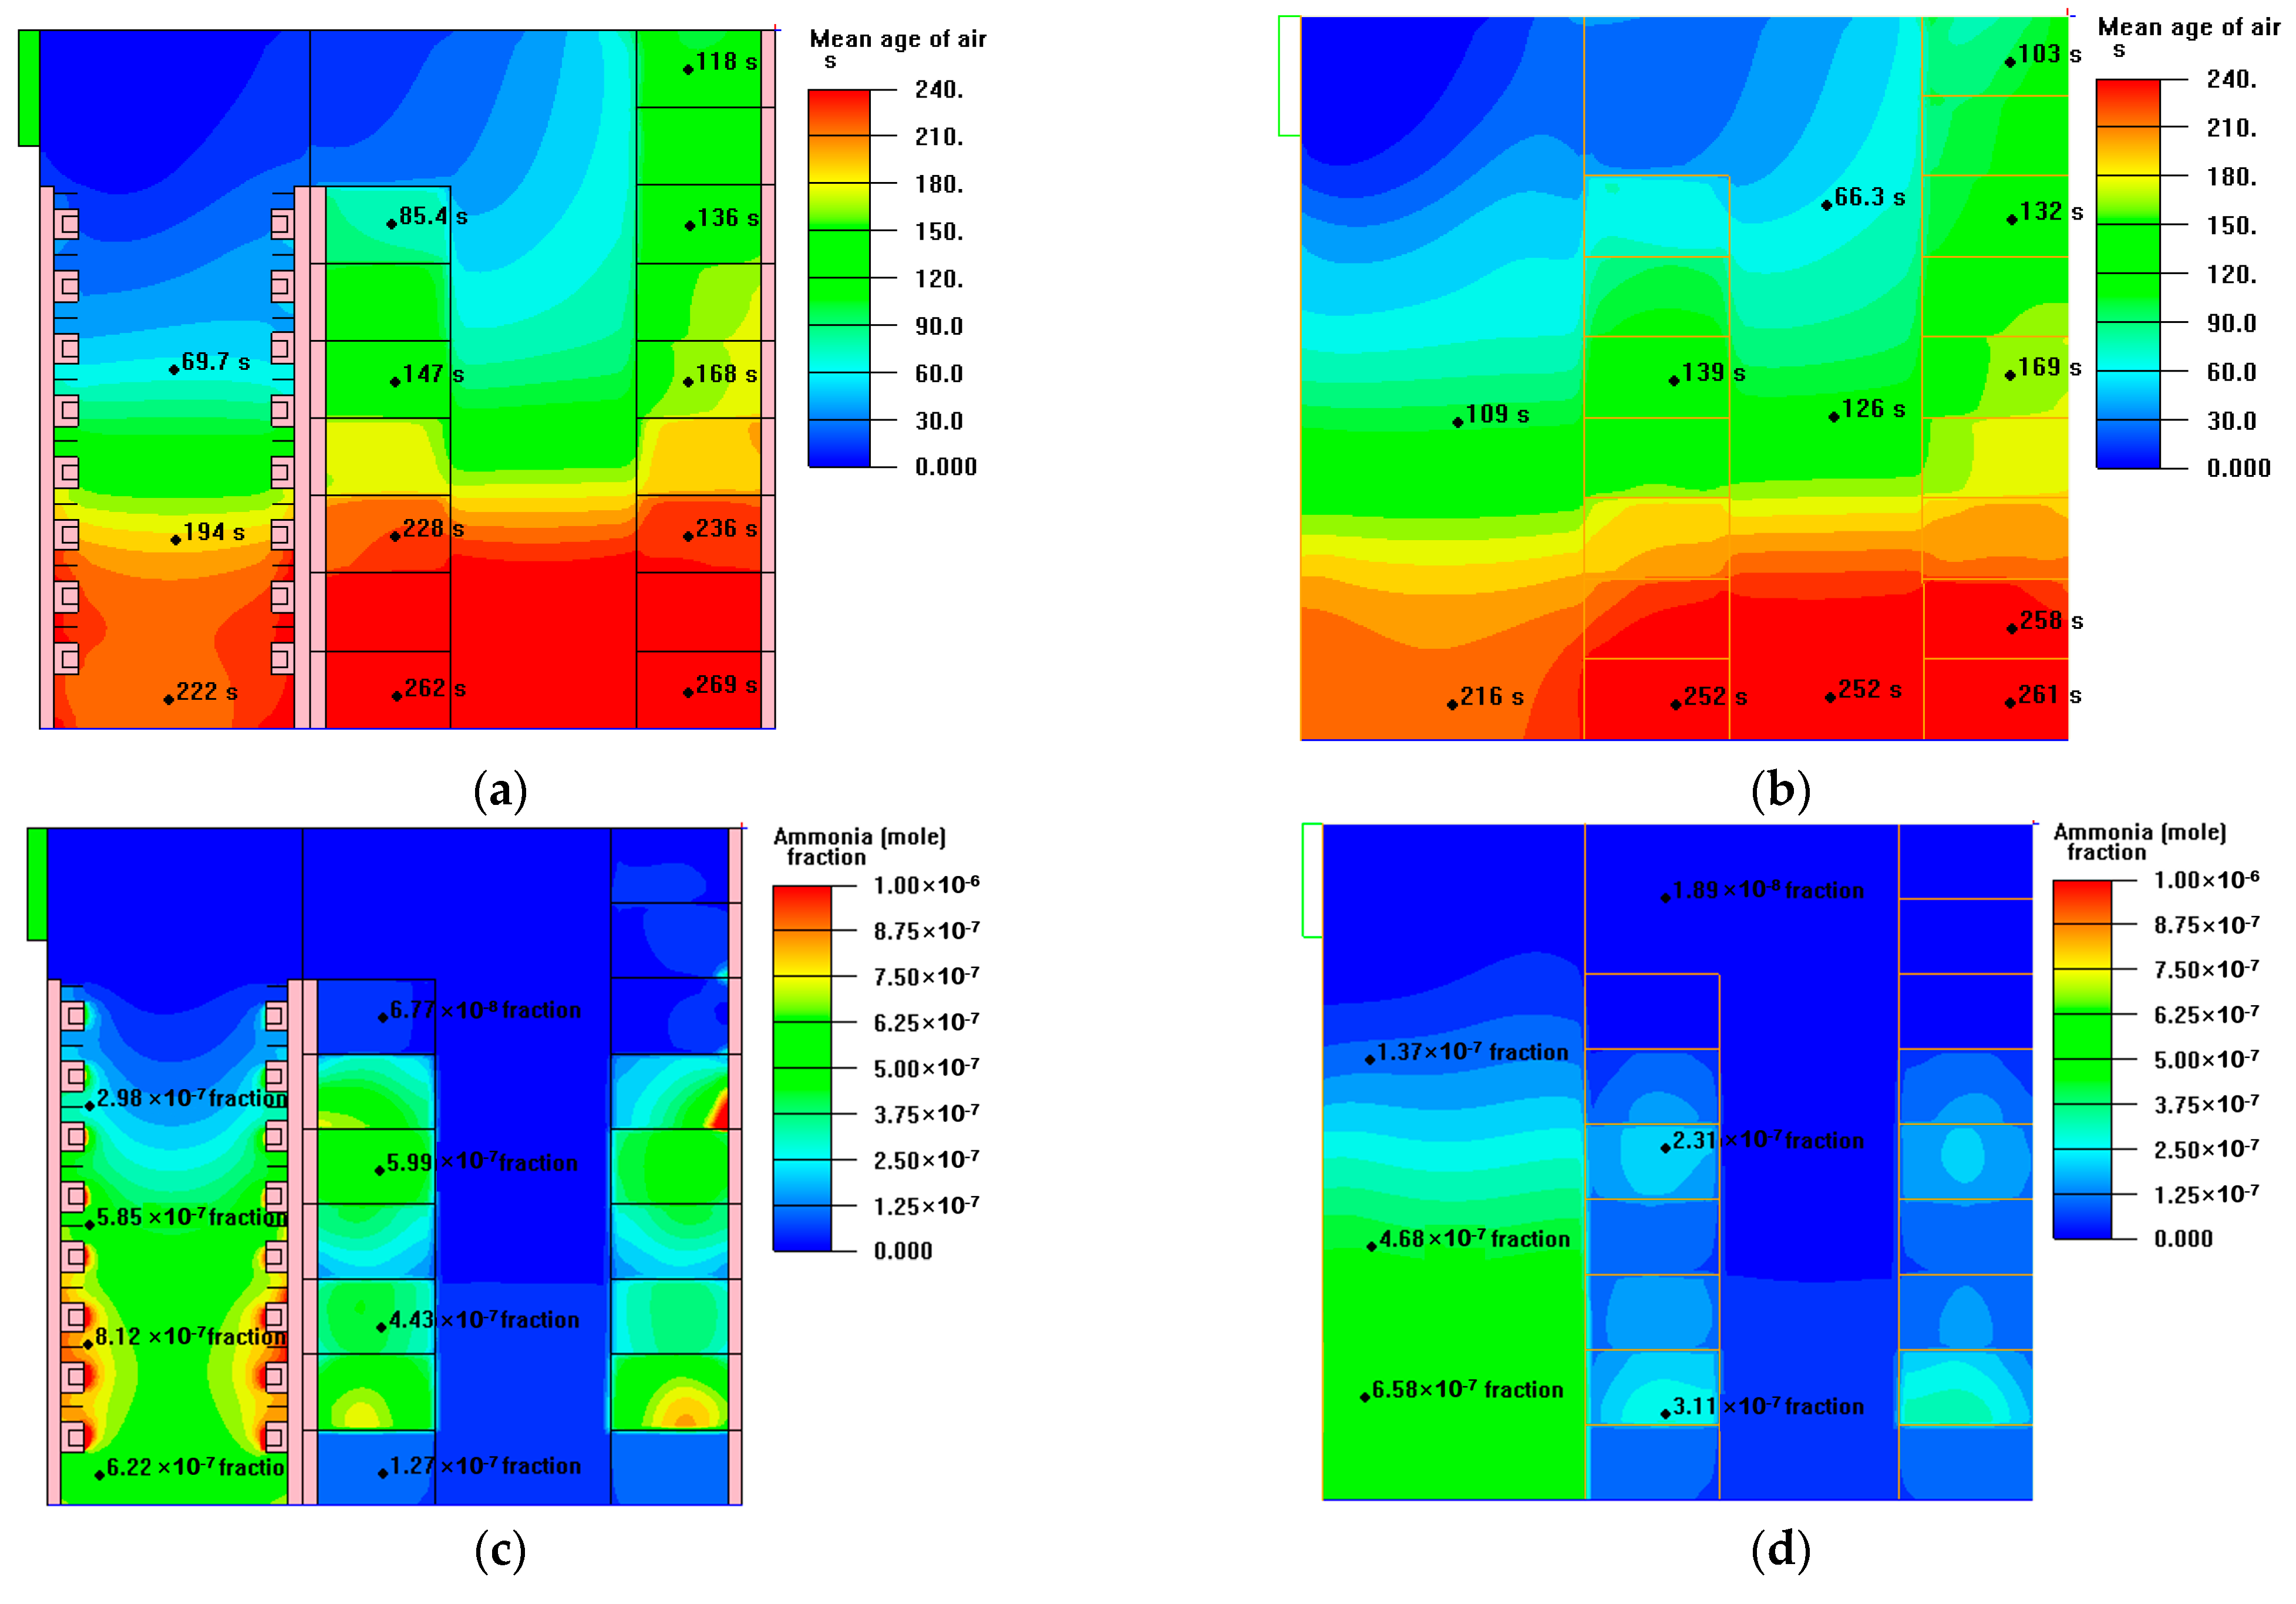
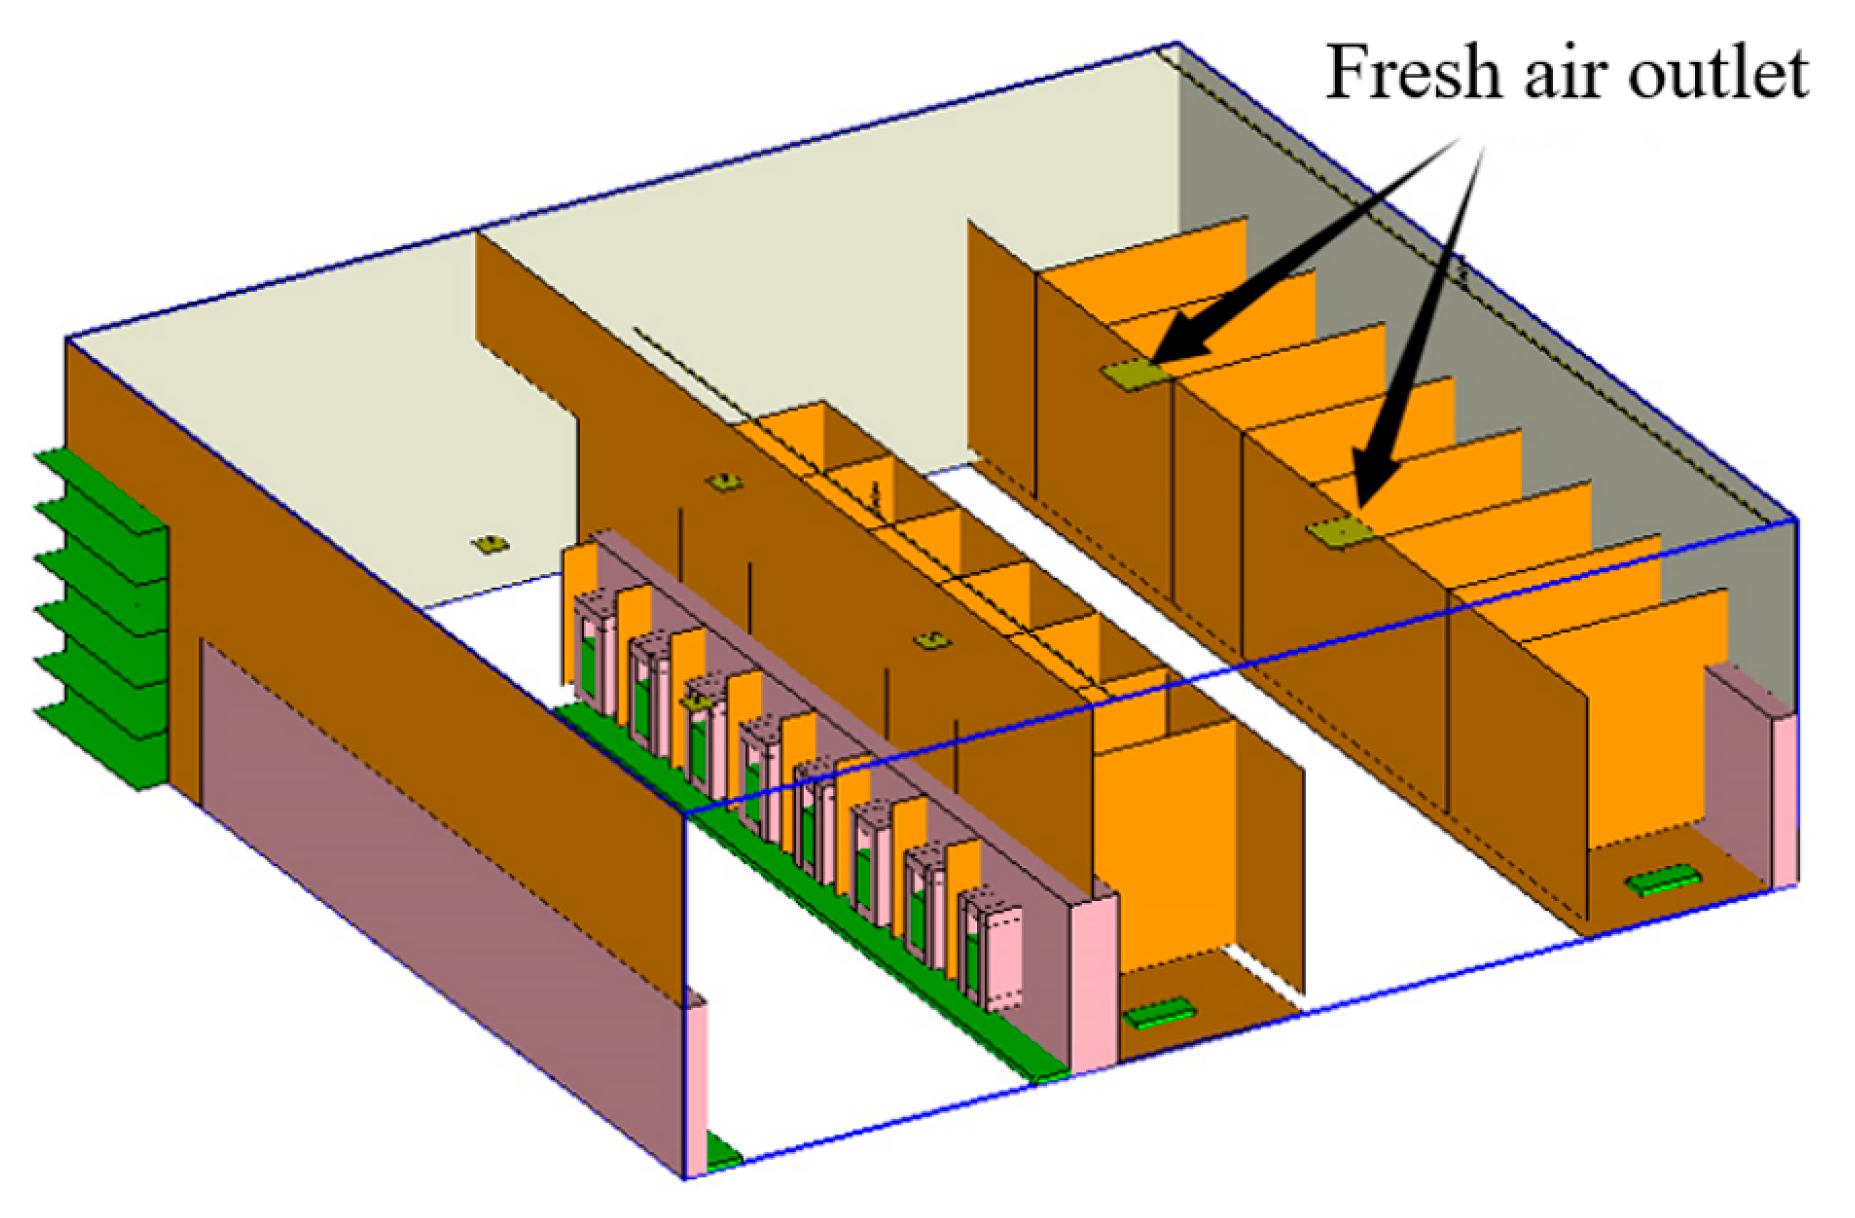
4.2.6. Ventilation System
4.3. Discussion of the Air Quality Improvement
5. Conclusions
- (1)
- The main pollutant in public toilets is ammonia, which averaged between 0.01 and 2.04 ppm in the toilets tested. Approximately 80% of the surveyed toilets meet the standard of ammonia concentration (0.395 ppm) in Class I toilets, while 20% of toilets with poor ventilation exceed the standard. The ammonia concentration is mainly affected by the service number, ventilation rate, and cleaning frequency.
- (2)
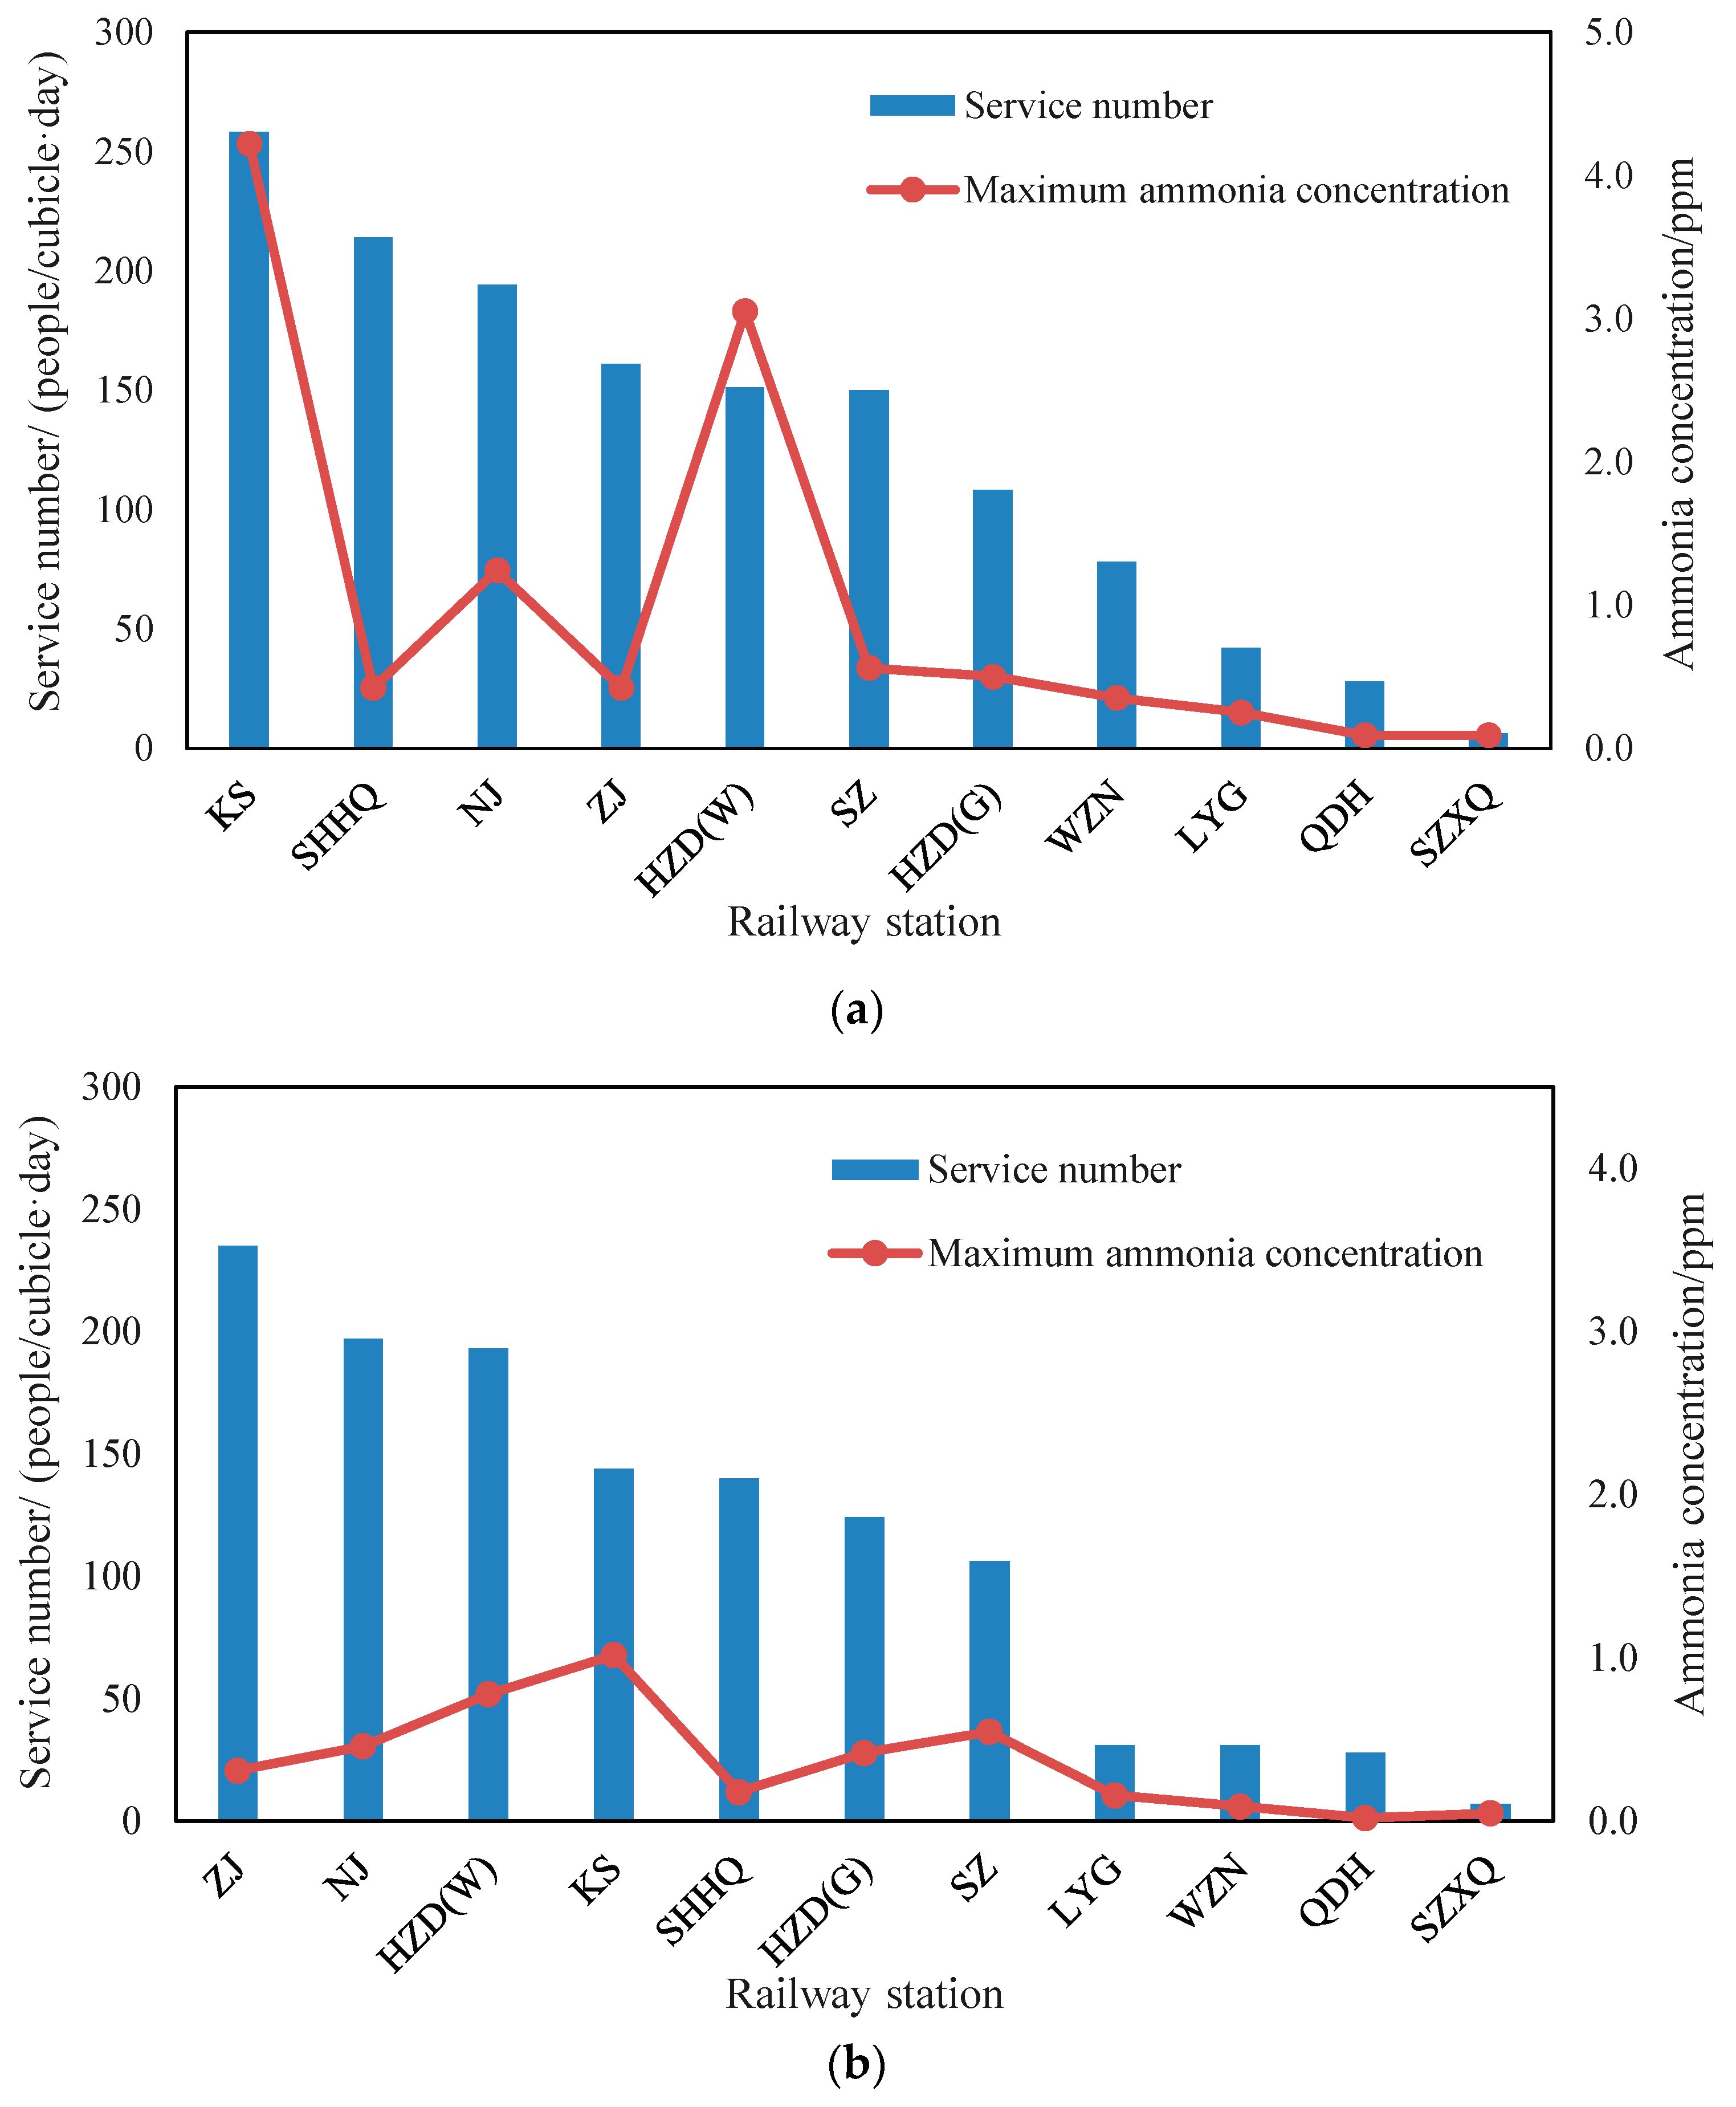
- For toilets with good ventilation, the ammonia concentration decreases with the decrease in service number when service number is less than 100 people/(cubicle · day). As service number increases, the influence of service number becomes smaller, and the maximum ammonia concentration is mainly affected by ventilation rate and cleaning frequency. In 20% of public toilets, the change in ammonia concentration was delayed by about 1 to 2 h with the change of hourly service number.
- (3)
- The public toilets at large and medium stations generally appear to have queues during peak hours. The recommended SCCH for female toilets is 12. The SCCH of male toilets is related to the RSU, which is suggested to be 1:1~1:0.8, and the corresponding SCCH is 16~20.
- (4)
- The method for calculating the number of toilet cubicles was proposed, and the optimal RMFC with different RSUs was investigated. This design is more suitable for public toilets at railway stations, which can effectively prevent queuing.
- (5)
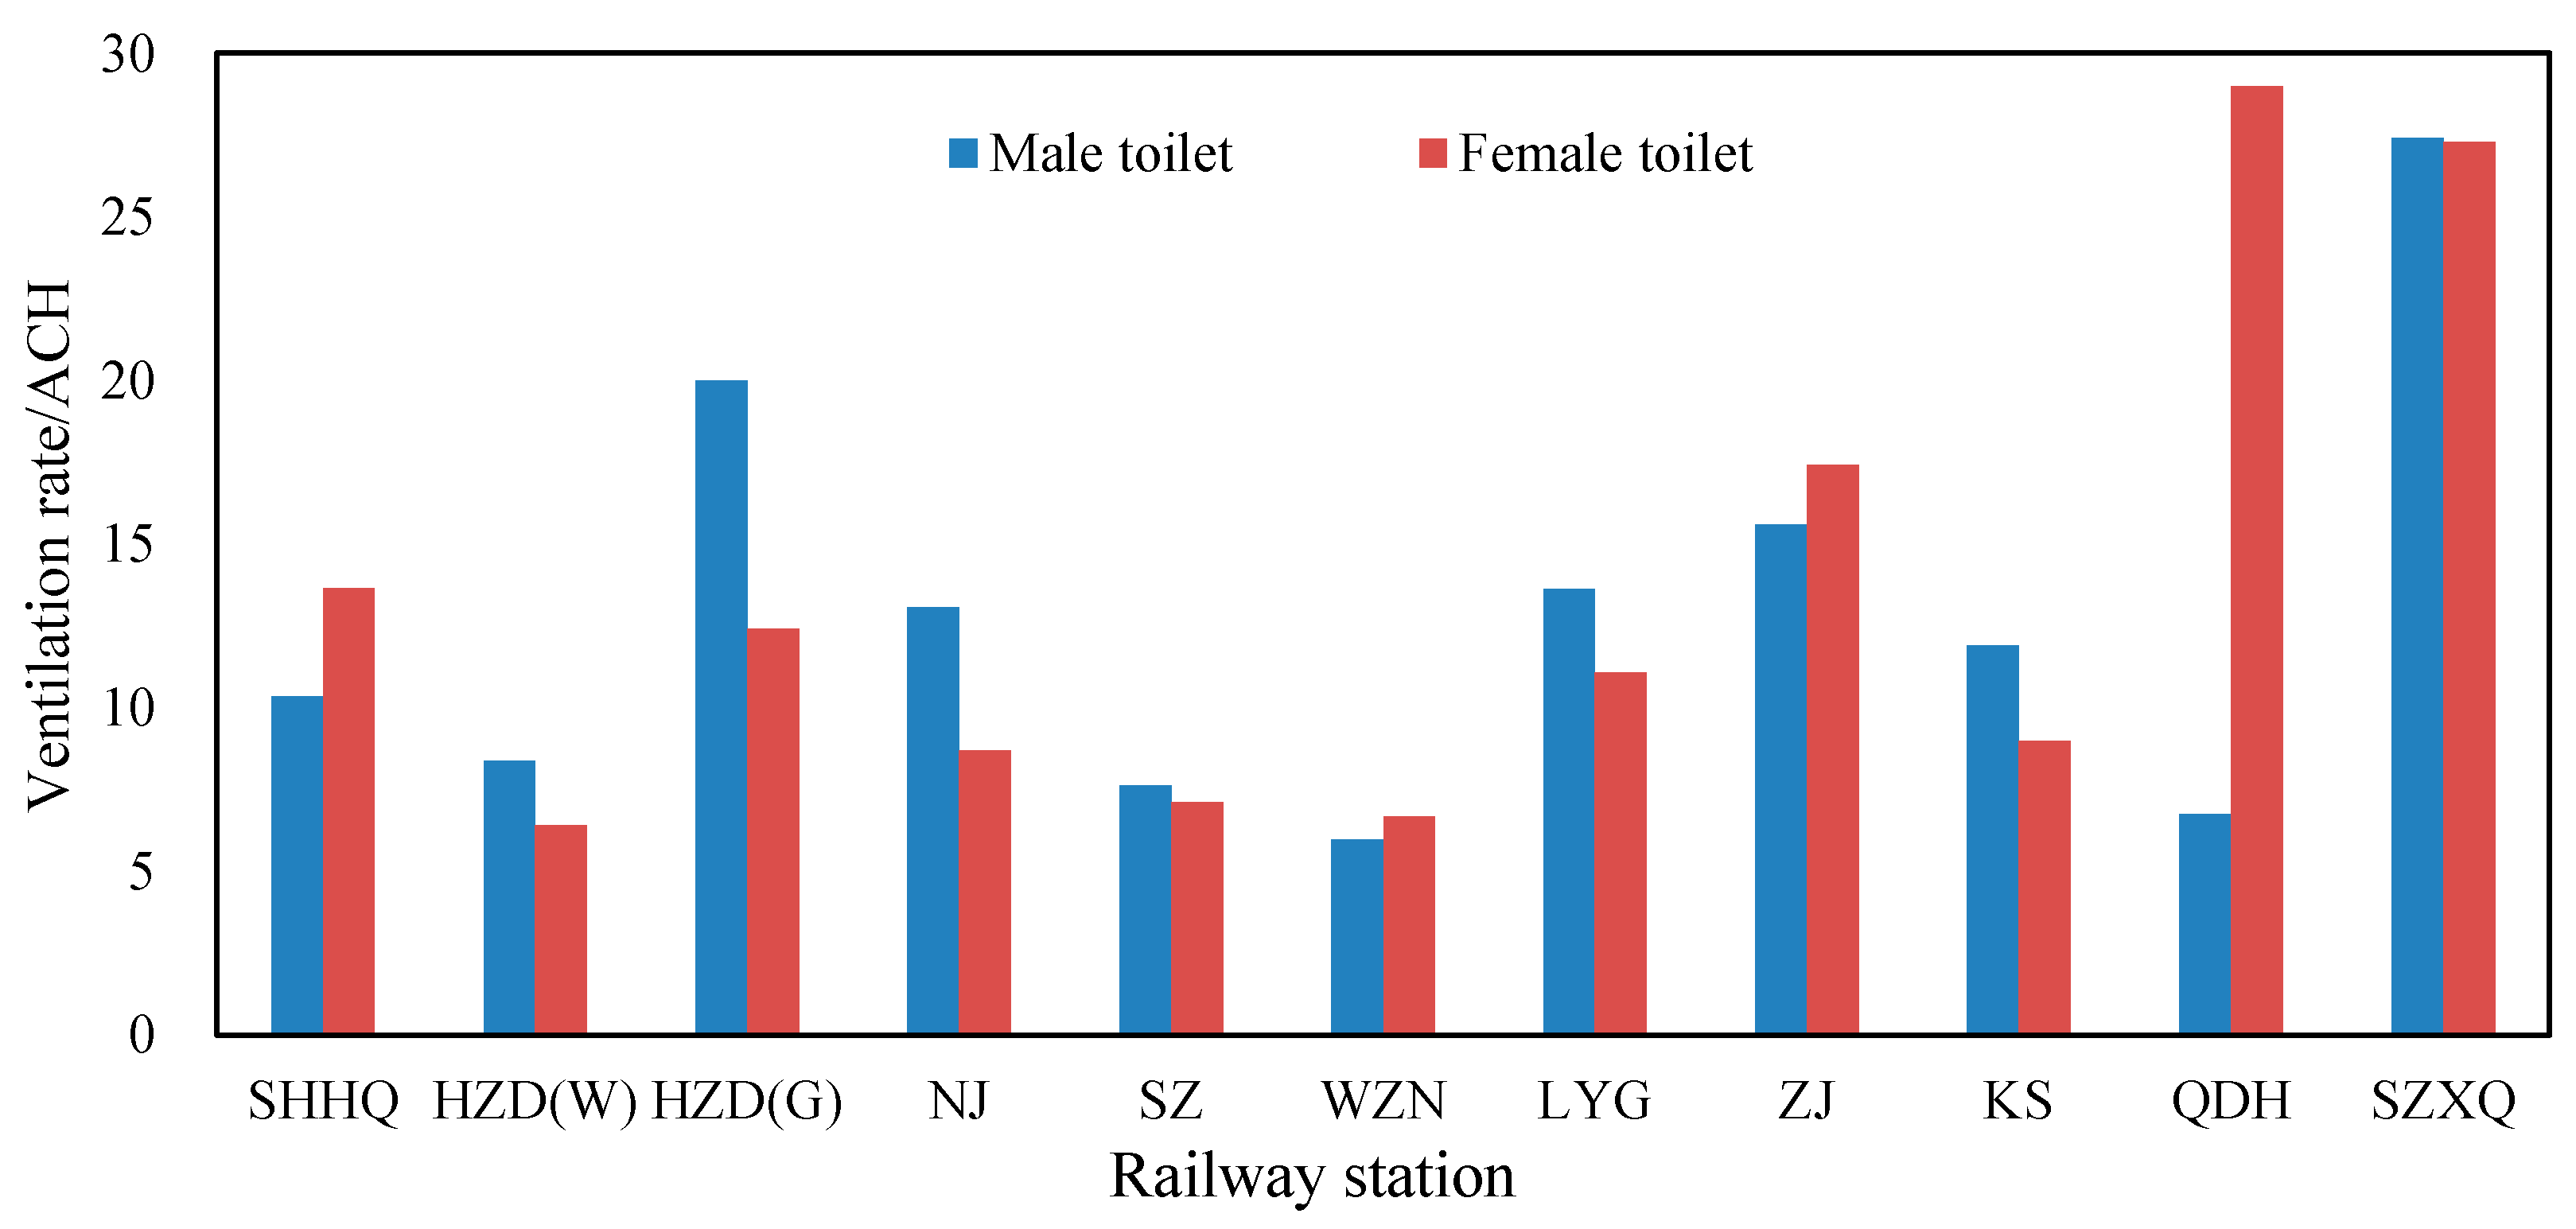
- Eighty percent of toilets use the top exhaust system, and twenty percent of toilets use the up-supply and down-return systems. The ventilation rates for the 22 surveyed toilets are between 6.0 and 29 ACH. The recommended ventilation rate for a toilet is 20 ACH. There are 18 toilets with ventilation rates below 20 ACH. The increase in ventilation rate can effectively improve the indoor air quality of toilets.
- (6)
- The bottom exhaust system is better than the upper exhaust. It is suggested to set the bottom exhaust outlet in the stool area at 0.3 m and to add auxiliary upper exhaust outlets in the innermost part of the toilet. The fresh air system basically has no influence on the ammonia concentration.
Author Contributions
Funding
Institutional Review Board Statement
Informed Consent Statement
Data Availability Statement
Acknowledgments
Conflicts of Interest
References
- Lunardon, A.; Vladimirova, D.; Boucsein, B. How railway stations can transform urban mobility and the public realm: The stakeholders’ perspective. J. Urban Mobil. 2023, 3, 100047. [Google Scholar] [CrossRef]
- Garmendia, M.; Ribalaygua, C.; Ureña, J.M. High speed rail: Implication for cities. Cities 2012, 29, S26–S31. [Google Scholar] [CrossRef]
- Irfan, S.M.; Kee, D.M.H.; Shahbaz, S. Service quality and rail transport in Pakistan: A passenger perspective. World Appl. Sci. J. 2012, 18, 361–369. [Google Scholar]
- Ghosh, P.; Ojha, M.K.; Geetika. Determining passenger satisfaction out of platform-based amenities: A study of Kanpur Central Railway Station. Transp. Policy 2017, 60, 108–118. [Google Scholar] [CrossRef]
- Cheng, S.K.; Li, Z.F.; Uddin, S.M.N.; Mang, H.P.; Zhou, X.Q.; Zhang, J.; Zheng, L.; Zhang, L.L. Toilet revolution in China. J. Environ. Manag. 2018, 216, 347–356. [Google Scholar] [CrossRef]
- Wang, Y.; Zhu, Y.; Qi, C.; Li, L. Potential barriers in implementing the rural toilet retrofitting project: A qualitative study in Jiaozuo, China. Front. Public Health 2022, 10, 965150. [Google Scholar] [CrossRef]
- Zhou, X.; Simha, P.; Perez-Mercado, L.F.; Barton, M.A.; Lyu, Y.; Guo, S.; Nie, X.; Wu, F.; Li, Z. China should focus beyond access to toilets to tap into the full potential of its Rural Toilet Revolution. Resour. Conserv. Recycl. 2022, 178, 106100. [Google Scholar] [CrossRef]
- Li, J.; Liu, X.; Li, L.; Zhu, C.; Luo, L.; Qi, Y.; Tian, L.; Chen, Z.; Qi, J.; Geng, B. Performance exploration and microbial dynamics of urine diverting composting toilets in rural China. J. Environ. Manag. 2022, 321, 115964. [Google Scholar] [CrossRef]
- Fan, B.; Hu, M.; Wang, H.; Xu, M.; Qu, B.; Zhu, S. Get in sanitation 2.0 by opportunity of rural China: Scheme, simulating application and life cycle assessment. J. Clean. Prod. 2017, 147, 86–95. [Google Scholar] [CrossRef]
- Gao, Y.; Tan, L.; Zhang, C.; Li, Q.; Wei, X.; Yang, B.; Chen, P.; Zheng, X.; Xu, Y. Assessment of Environmental and Social Effects of Rural Toilet Retrofitting on a Regional Scale in China. Front. Environ. Sci. 2022, 10, 812710–812727. [Google Scholar] [CrossRef]
- Pearce, D. Economic valuation and health damage from air pollution in the developing world. Energy Policy 1996, 24, 627–630. [Google Scholar] [CrossRef]
- Molhave, L.; Krzyzanowski, M. The right to healthy indoor air: Status by 2002. Indoor Air 2003, 136, 50–53. [Google Scholar] [CrossRef]
- Hoskins, J.A. Health Effects due to Indoor Air Pollution; Springer: Nicosia, Cyprus, 2011; pp. 665–676. [Google Scholar]
- Logue, J.M.; McKone, T.E.; Sherman, M.H.; Singer, B.C. Hazard assessment of chemical air contaminants measured in residences. Indoor Air 2011, 21, 92–109. [Google Scholar] [CrossRef] [PubMed]
- Paleologos, K.E.; Selim, M.Y.E.; Mohamed, A.O. Chapter 8—Indoor air quality: Pollutants, health effects, and regulations. In Pollution Assessment for Sustainable Practices in Applied Sciences and Engineering; Mohamed, A.O., Paleologos, E.K., Howari, F.M., Eds.; Butterworth-Heinemann: Oxford, UK, 2021; pp. 405–489. [Google Scholar]
- Luo, D.; Huang, J.; Zheng, X.; Liu, F.; Li, Y.; Wang, Y.; Qian, H. Spread of flushing-generated fecal aerosols in a squat toilet cubicle: Implication for infection risk. Sci. Total Environ. 2023, 859, 160212. [Google Scholar] [CrossRef] [PubMed]
- Tung, Y.C.; Hu, S.C.; Tsai, T.Y. Influence of bathroom ventilation rates and toilet location on odor removal. Build. Environ. 2009, 44, 1810–1817. [Google Scholar] [CrossRef]
- Carrer, P.; Wargocki, P.; Fanetti, A.; Bischof, W.; De Oliveira Fernandes, E.; Hartmann, T.; Kephalopoulos, S.; Palkonen, S.; Seppänen, O. What does the scientific literature tell us about the ventilation–health relationship in public and residential buildings? Build. Environ. 2015, 94, 273–286. [Google Scholar] [CrossRef]
- Wen, S.; Liu, J.; Zhang, F.; Xu, J. Numerical and experimental study towards a novel torque damper with minimized air flow instability. Build. Environ. 2022, 217, 109114. [Google Scholar] [CrossRef]
- Wang, Q.; Liu, L. On the Critical Role of Human Feces and Public Toilets in the Transmission of COVID-19: Evidence from China. Sustain. Cities Soc. 2021, 75, 103350. [Google Scholar] [CrossRef]
- Verani, M.; Bigazzi, R.; Carducci, A. Viral contamination of aerosol and surfaces through toilet use in health care and other settings. Am. J. Infect. Control. 2014, 42, 758–762. [Google Scholar] [CrossRef]
- Lee, M.C.J.; Tham, K.W. Public toilets with insufficient ventilation present high cross infection risk. Sci. Rep. 2021, 11, 20623. [Google Scholar] [CrossRef]
- Ye, W.; Zhang, X.; Gao, J.; Cao, G.Y.; Zhou, X.; Su, X. Indoor air pollutants, ventilation rate determinants and potential control strategies in Chinese dwellings: A literature review. Sci. Total Environ. 2017, 586, 696–729. [Google Scholar] [CrossRef] [PubMed]
- Zhang, Z.; Zeng, L.; Shi, H.; Liu, H.; Yin, W.; Gao, J.; Wang, L.; Zhang, Y.; Zhou, X. CFD studies on the spread of ammonia and hydrogen sulfide pollutants in a public toilet under personalized ventilation. J. Build. Eng. 2022, 46, 103728. [Google Scholar] [CrossRef]
- Tung, Y.; Shih, Y.; Hu, S.; Chang, Y. Experimental performance investigation of ventilation schemes in a private bathroom. Build. Environ. 2010, 45, 243–251. [Google Scholar] [CrossRef]
- Chung, K.C.; Chiang, C.M.; Wang, W.A. Predicting contaminant particle distributions to evaluate the environment of lavatories with floor exhaust ventilation. Build. Environ. 1997, 32, 149–159. [Google Scholar] [CrossRef]
- Yu, S.; Zhang, G.; Ma, Y.; Yu, Z.; Feng, G. Numerical Simulation Study on Concentration Distribution of Indoor pollutions by Different Natural Ventilation Strategies in Shenyang. Procedia Eng. 2017, 205, 1389–1396. [Google Scholar] [CrossRef]
- Zhou, C.; Wang, Z.; Chen, Q.; Jiang, Y.; Pei, J. Design optimization and field demonstration of natural ventilation for high-rise residential buildings. Energy Build. 2014, 82, 457–465. [Google Scholar] [CrossRef]
- Hiyama, K.; Glicksman, L. Preliminary design method for naturally ventilated buildings using target air change rate and natural ventilation potential maps in the United States. Energy 2015, 89, 655–666. [Google Scholar] [CrossRef]
- Lin, Y. Natural Ventilation of Toilet Units in K-12 School Restrooms Using CFD. Energies 2021, 14, 4792. [Google Scholar] [CrossRef]
- Ao, Y.; Wang, L.; Jia, X.; Gu, C. Numerical simulation of pollutant diffusion law in bathroom and optimization of the locations and ways of exhaust outlet and makeup air. J. Shenyang Jianzhu Univ. 2011, 27, 720–724. [Google Scholar]
- Zhao, L.; Zhang, H.; Wang, Q.; Sun, B.; Liu, W.; Qu, K.; Shen, X. Digital Twin Evaluation of Environment and Health of Public Toilet Ventilation Design Based on Building Information Modeling. Buildings 2022, 12, 470. [Google Scholar] [CrossRef]
- Li, R.; Liu, G.; Xia, Y.; Bantserova, O.L.; Li, W.; Zhu, J. Pollution Dispersion and Predicting Infection Risks in Mobile Public Toilets Based on Measurement and Simulation Data of Indoor Environment. Processes 2022, 10, 2466. [Google Scholar] [CrossRef]
- Anthony, K.H.; Dufresne, M. Potty Parity in Perspective: Gender and Family Issues in Planning and Designing Public Restrooms. J. Plan. Lit. 2007, 21, 267–294. [Google Scholar] [CrossRef]
- Moreira, F.D.; Rezende, S.; Passos, F. On-street toilets for sanitation access in urban public spaces: A systematic review. Util. Policy 2021, 70, 101186. [Google Scholar] [CrossRef]
- Bliss, D.Z.; Park, Y.S. Public toilets in parklands or open spaces in international cities using geographic information systems. Int. Urogynecol. J. 2020, 31, 939–945. [Google Scholar] [CrossRef] [PubMed]
- Fu, B.; Xiao, X.; Li, J. Big Data-Driven Measurement of the Service Capacity of Public Toilet Facilities in China. Appl. Sci. 2022, 12, 4659. [Google Scholar] [CrossRef]
- Yan, R.; Cheng, S.; Chen, J.; Li, X.; Sharma, S.; Nazim Uddin, S.M.; Mang, H.P.; Chen, C.; Li, Z.; Li, T.; et al. Operating status of public toilets in the Hutong neighborhoods of Beijing: An empirical study. J. Environ. Manag. 2021, 287, 112252. [Google Scholar] [CrossRef]
- Afacan, Y.; Gurel, M.O. Public Toilets: An Exploratory Study on the Demands, Needs, and Expectations in Turkey. Environ. Plan. B Plan. Des. 2015, 42, 242–262. [Google Scholar] [CrossRef]
- Greed, C.H. Public toilet provision for women in britain. Women’s Stud. Int. Forum 1995, 18, 573–584. [Google Scholar] [CrossRef]
- Sun, X.; You, H.; Huang, Z.; Wang, H. Study on the proportion of public toilet seats in crowded places and countermeasures. Anhui Arch. 2017, 24, 52–54. (In Chinese) [Google Scholar]
- Huh, W.T.; Lee, J.; Park, H.; Park, K.S. The potty parity problem: Towards gender equality at restrooms in business facilities. Socio Econ. Plan. Sci. 2019, 68, 100666. [Google Scholar] [CrossRef]
- TB10100-2018; Code for Design of Railway Passenger Stations. National Railway Administration of the People’s Republic of China: Beijing, China, 2018.
- GB/T 17217-1998; Hygienic Standard for Communal Toilet in City. National Patriotic Health Committee: Beijing, China, 1998.
- CJJ 14-2016; Standard for Design of Urban Public Toilets. Ministry of Housing and Urban-Rural Development of the People’s Republic of China: Beijing, China, 2016.
- GB50226-2007; Code for design of railway passenger station buildings. Standardization Administration of China (SAC): Beijing, China, 2007.
- Gao, X. Higher Hydromechanics; Tianjin University Publishing House: Tianjin, China, 2005. [Google Scholar]
- Li, C.; Wang, R.; Lu, Z.; Zhai, X. Study on Ventilation Airflow Organization and Indoor Environment of Public Restrooms; Chinese Association of Refrigeration: Tianjin, China, 2009; p. 5. Available online: https://kns.cnki.net/kcms/detail/detail.aspx?FileName=ZGZM200911001026&DbName=CPFD2009 (accessed on 22 May 2023). (In Chinese)
- Ji, S.; Mao, J. Study on the Concentration of Pollutants in Bathrooms under Natural Ventilation Conditions. Contamination Control & Air-Conditioning Technology. 2012, pp. 22–24. Available online: https://kns.cnki.net/kcms/detail/detail.aspx?FileName=KTJS201204007&DbName=CJFQ2012 (accessed on 22 May 2023). (In Chinese).


| Scale | Large Station | Medium Station | Small Station | |||||||
|---|---|---|---|---|---|---|---|---|---|---|
| Station | SHHQ | HZD | NJ | SZ | WZN | LYG | ZJ | KS | QDH | SZXQ |
| Peak hour departing quantum | 17,395 | 18,653 | 6569 | 6016 | 4209 | 1381 | 1320 | 763 | 206 | <200 |
| Standards | Parameters | Values | |||
|---|---|---|---|---|---|
| Hygienic standard for communal toilet in city (GB/T17217-1998) [44] | Type of water-flush public toilet | Class I | Class II | Class III | |
| Ammonia concentration (ppm) | 0.395 | 1.318 | 3.95 | ||
| Hydrogen sulfide concentration (ppm) | 0.0066 | 0.0066 | 0.0066 | ||
| Standard for design of urban public toilets (CJJ14-2016) [45] | Type | Male toilet | Female toilet | ||
| Service number (people/cubicle · day) | 150 | 100 | |||
| Number of cubicles | 2 (<100 males); 1 for every additional 60 males | 4 (<100 females); 1 for every additional 30 females | |||
| Ventilation | 40 m3/h for each squatting pan; 20 m3/h for each urinal; Ventilation rate is not less than 5 ACH | ||||
| Code for design of railway passenger stations (TB10100-2018) [43] | Number of cubicles | 2.5 cubicles for every 100 people; RMFC should be 1:2 | |||
| Ventilation rate | 15~20 ACH | ||||
| Instruments | Parameter | Precision (Measuring Range) |
|---|---|---|
| TSI 9565 anemometer | Air velocity | ±0.06 m/s (0–3.0 m/s); ±0.2 m/s (3.1–30 m/s) |
| Air temperature | ±0.3 °C | |
| PLT400-2 composite gas detector | Ammonia concentration | 0.01 ppm (0–10 ppm) |
| Passenger flow counter | Number of people | - |
| Type | Service Number (People/Cubicle · Day) | Ventilation Rate (ACH) | Maximum Ammonia Concentration (ppm) | |
|---|---|---|---|---|
| Male toilet | Unrenovated | 151 | 8.4 | 3.05 |
| Renovated | 108 | 20.0 | 0.5 | |
| Female toilet | Unrenovated | 193 | 6.4 | 0.78 |
| Renovated | 124 | 12.4 | 0.42 | |
| Station | Large Station | Medium Station | Small Station | |||||||
|---|---|---|---|---|---|---|---|---|---|---|
| SHHQ | HZD | NJ | SZ | WZN | LYG | ZJ | KS | QDH | SZXQ | |
| Number of male cubicles (Including urinals and squatting pans) | 293 | 207 | 185 | 167 | 150 | 65 | 53 | 56 | 31 | 10 |
| Number of female cubicles | 235 | 144 | 125 | 130 | 116 | 46 | 36 | 40 | 29 | 7 |
| Total cubicles | 528 | 351 | 310 | 297 | 266 | 111 | 89 | 106 | 60 | 17 |
| RMFC | 1.25 | 1.44 | 1.48 | 1.28 | 1.29 | 1.41 | 1.47 | 1.4 | 1.06 | 1.43 |
| Station | SHHQ | HZD (U) | HZD (R) | NJ (S) | NJ (N) | SZ | WZN | LYG | ZJ | KS | QDH | SZXQ |
|---|---|---|---|---|---|---|---|---|---|---|---|---|
| Male toilet | 20.2 | 13.2 | 9.5 | 12.4 | 18.8 | 9.4 | 9.4 | 8.8 | 16.8 | 23.5 | 3.3 | 1.8 |
| Female toilet | 12.7 | 15.5 | 10.4 | 15.8 | 9.3 | 7.5 | 2.9 | 6.2 | 26 | 11.7 | 3.4 | 3.1 |
| Station | Service Number (People/(Cubicle · Hour)) | Queuing Situation |
|---|---|---|
| HZD(R) | 14.67 (15:00~16:00) | Sometimes |
| 14.96 (16:00~17:00) | Sometimes | |
| 15.08 (13:00~14:00) | Frequently | |
| 15.50 (14:00~15:00) | Frequently | |
| NJ(S) | 12.17 (19:00~20:00) | Sometimes |
| 13.92 (11:00~12:00) | Sometimes | |
| 15.75 (14:00~15:00) | Frequently | |
| SHHQ | <12.7 | NO |
| HZD(U) | <10.2 | NO |
| NJ(N) | <9.3 | NO |
| KS | <11.7 | NO |
| Station | RSU | Service Number (People/(Cubicle · Hour)) | Queuing Situation |
|---|---|---|---|
| HZD(U) | 1:1.6 | 10.81 (13:00~14:00) | Sometimes (in stool area) |
| 13.22 (14:00~15:00) | Sometimes (in stool area) | ||
| KS | 1:1 | 16.6 (12:00~13:00) | Sometimes (in stool area) |
| 16.7 (11:00~12:00) | Sometimes (in stool area) | ||
| 17.4 (22:00~23:00) | Sometimes (in stool area and urinal area) | ||
| 18.8 (23:00~24:00) | Sometimes (in stool area and urinal area) | ||
| NJ(N) | 1:1 | 18.8 (12:00~13:00) | Sometimes (in stool area) |
| SHHQ | 1:0.82 | 20.19 | Sometimes (in stool area) |
| HZD(R) | 1:2 | <9.55 | No |
| NJ(S) | 1:1 | <12 | No |
| others | - | <9.43 | No |
| Parameters | RSU | SCCH |
|---|---|---|
| Male toilet | 1:1 | 16 |
| 1:0.9 | 18 | |
| 1:0.8 | 20 | |
| Female toilet | - | 12 |
| Station | Large Station | Medium Station | Small Station | ||||||
|---|---|---|---|---|---|---|---|---|---|
| SHHQ | HZD | NJ | SZ | WZN | LYG | ZJ | KS | QDH | |
| Peak hour departure quantum | 17,395 | 18,653 | 6569 | 6016 | 4209 | 1381 | 1320 | 763 | 206 |
| Peak hour service number | 7480 | 8021 | 2825 | 2587 | 1726 | 566 | 541 | 649 | 175 |
| SCCH (male) | 16 | ||||||||
| SCCH (female) | 12 | ||||||||
| Number of male cubicles (actual) | 293 | 207 | 185 | 167 | 150 | 65 | 53 | 16 | 31 |
| Number of female cubicles (actual) | 235 | 144 | 125 | 130 | 116 | 46 | 36 | 11 | 29 |
| RMF is 1:1 | |||||||||
| Peak hour service number (male) | 3740 | 4010 | 1412 | 1293 | 863 | 283 | 271 | 324 | 88 |
| Peak hour service number (female) | 3740 | 4010 | 1412 | 1293 | 863 | 283 | 271 | 324 | 88 |
| Number of male cubicles (calculated) | 234 | 251 | 88 | 81 | 54 | 18 | 17 | 20 | 5 |
| Number of female cubicles (calculated) | 312 | 334 | 118 | 108 | 72 | 24 | 23 | 27 | 7 |
| RMF is 2:1 | |||||||||
| Peak hour service number (male) | 4987 | 5347 | 1883 | 1725 | 1150 | 377 | 361 | 432 | 136 |
| Peak hour service number (female) | 2493 | 2674 | 942 | 862 | 575 | 189 | 180 | 216 | 58 |
| Number of male cubicles (calculated) | 312 | 334 | 118 | 108 | 72 | 24 | 23 | 27 | 9 |
| Number of female cubicles (calculated) | 208 | 223 | 78 | 72 | 48 | 16 | 15 | 18 | 5 |
| Station | Male Cubicles | Female Cubicles |
|---|---|---|
| Large station | y = 0.0122x | y = 0.0179x |
| Medium station | y = 0.0125x | y = 0.0172x |
| Small station | y = 0.0266x | y = 0.0354x |
| RSU | SCCH | RMFC | ||||
|---|---|---|---|---|---|---|
| RMF of 1:1 | RMF of 1.5:1 | RMF of 2:1 | RMF of 2.5:1 | RMF of 3:1 | ||
| 1:1 | 16 | 1: 1.33 | 1: 0.89 | 1: 0.67 | 1: 0.53 | 1: 0.44 |
| 1:0.9 | 18 | 1: 1.50 | 1: 1.0 | 1: 0.75 | 1: 0.60 | 1: 0.50 |
| 1:0.8 | 20 | 1: 1.67 | 1: 1.11 | 1: 0.83 | 1: 0.67 | 1: 0.56 |
| Meshing | Number of Cells | Averaged Ammonia Concentration | Mean Age of Air | ||
|---|---|---|---|---|---|
| Concentration (ppm) | Relative Error | Age of Air (s) | Relative Error | ||
| Coarse | 501,326 | 3.65 | 5.49% | 223 | −9.72% |
| Middle | 712,383 | 3.26 | −5.78% | 231 | −6.48% |
| Fine | 979,409 | 3.53 | 2.02% | 253 | 2.43% |
| Finest | 1,274,488 | 3.46 | - | 247 | - |
| Ventilation Rate (ACH) | Total Air Volume (m3/h) | Urinal Area | Stool Area | ||
|---|---|---|---|---|---|
| Air Volume (m3/h) | Air Velocity of Vent (m/s) | Air Volume (m3/h) | Air Velocity of Vent (m/s) | ||
| 5 | 1282 | 466 | 0.81 | 816 | 0.81 |
| 10 | 2565 | 932 | 1.62 | 1632 | 1.62 |
| 15 | 3848 | 1398 | 2.43 | 2448 | 2.43 |
| 20 | 5130 | 1864 | 3.24 | 3264 | 3.24 |
| 25 | 6413 | 2330 | 4.05 | 4080 | 4.05 |
| 30 | 7698 | 2796 | 4.85 | 4896 | 4.86 |
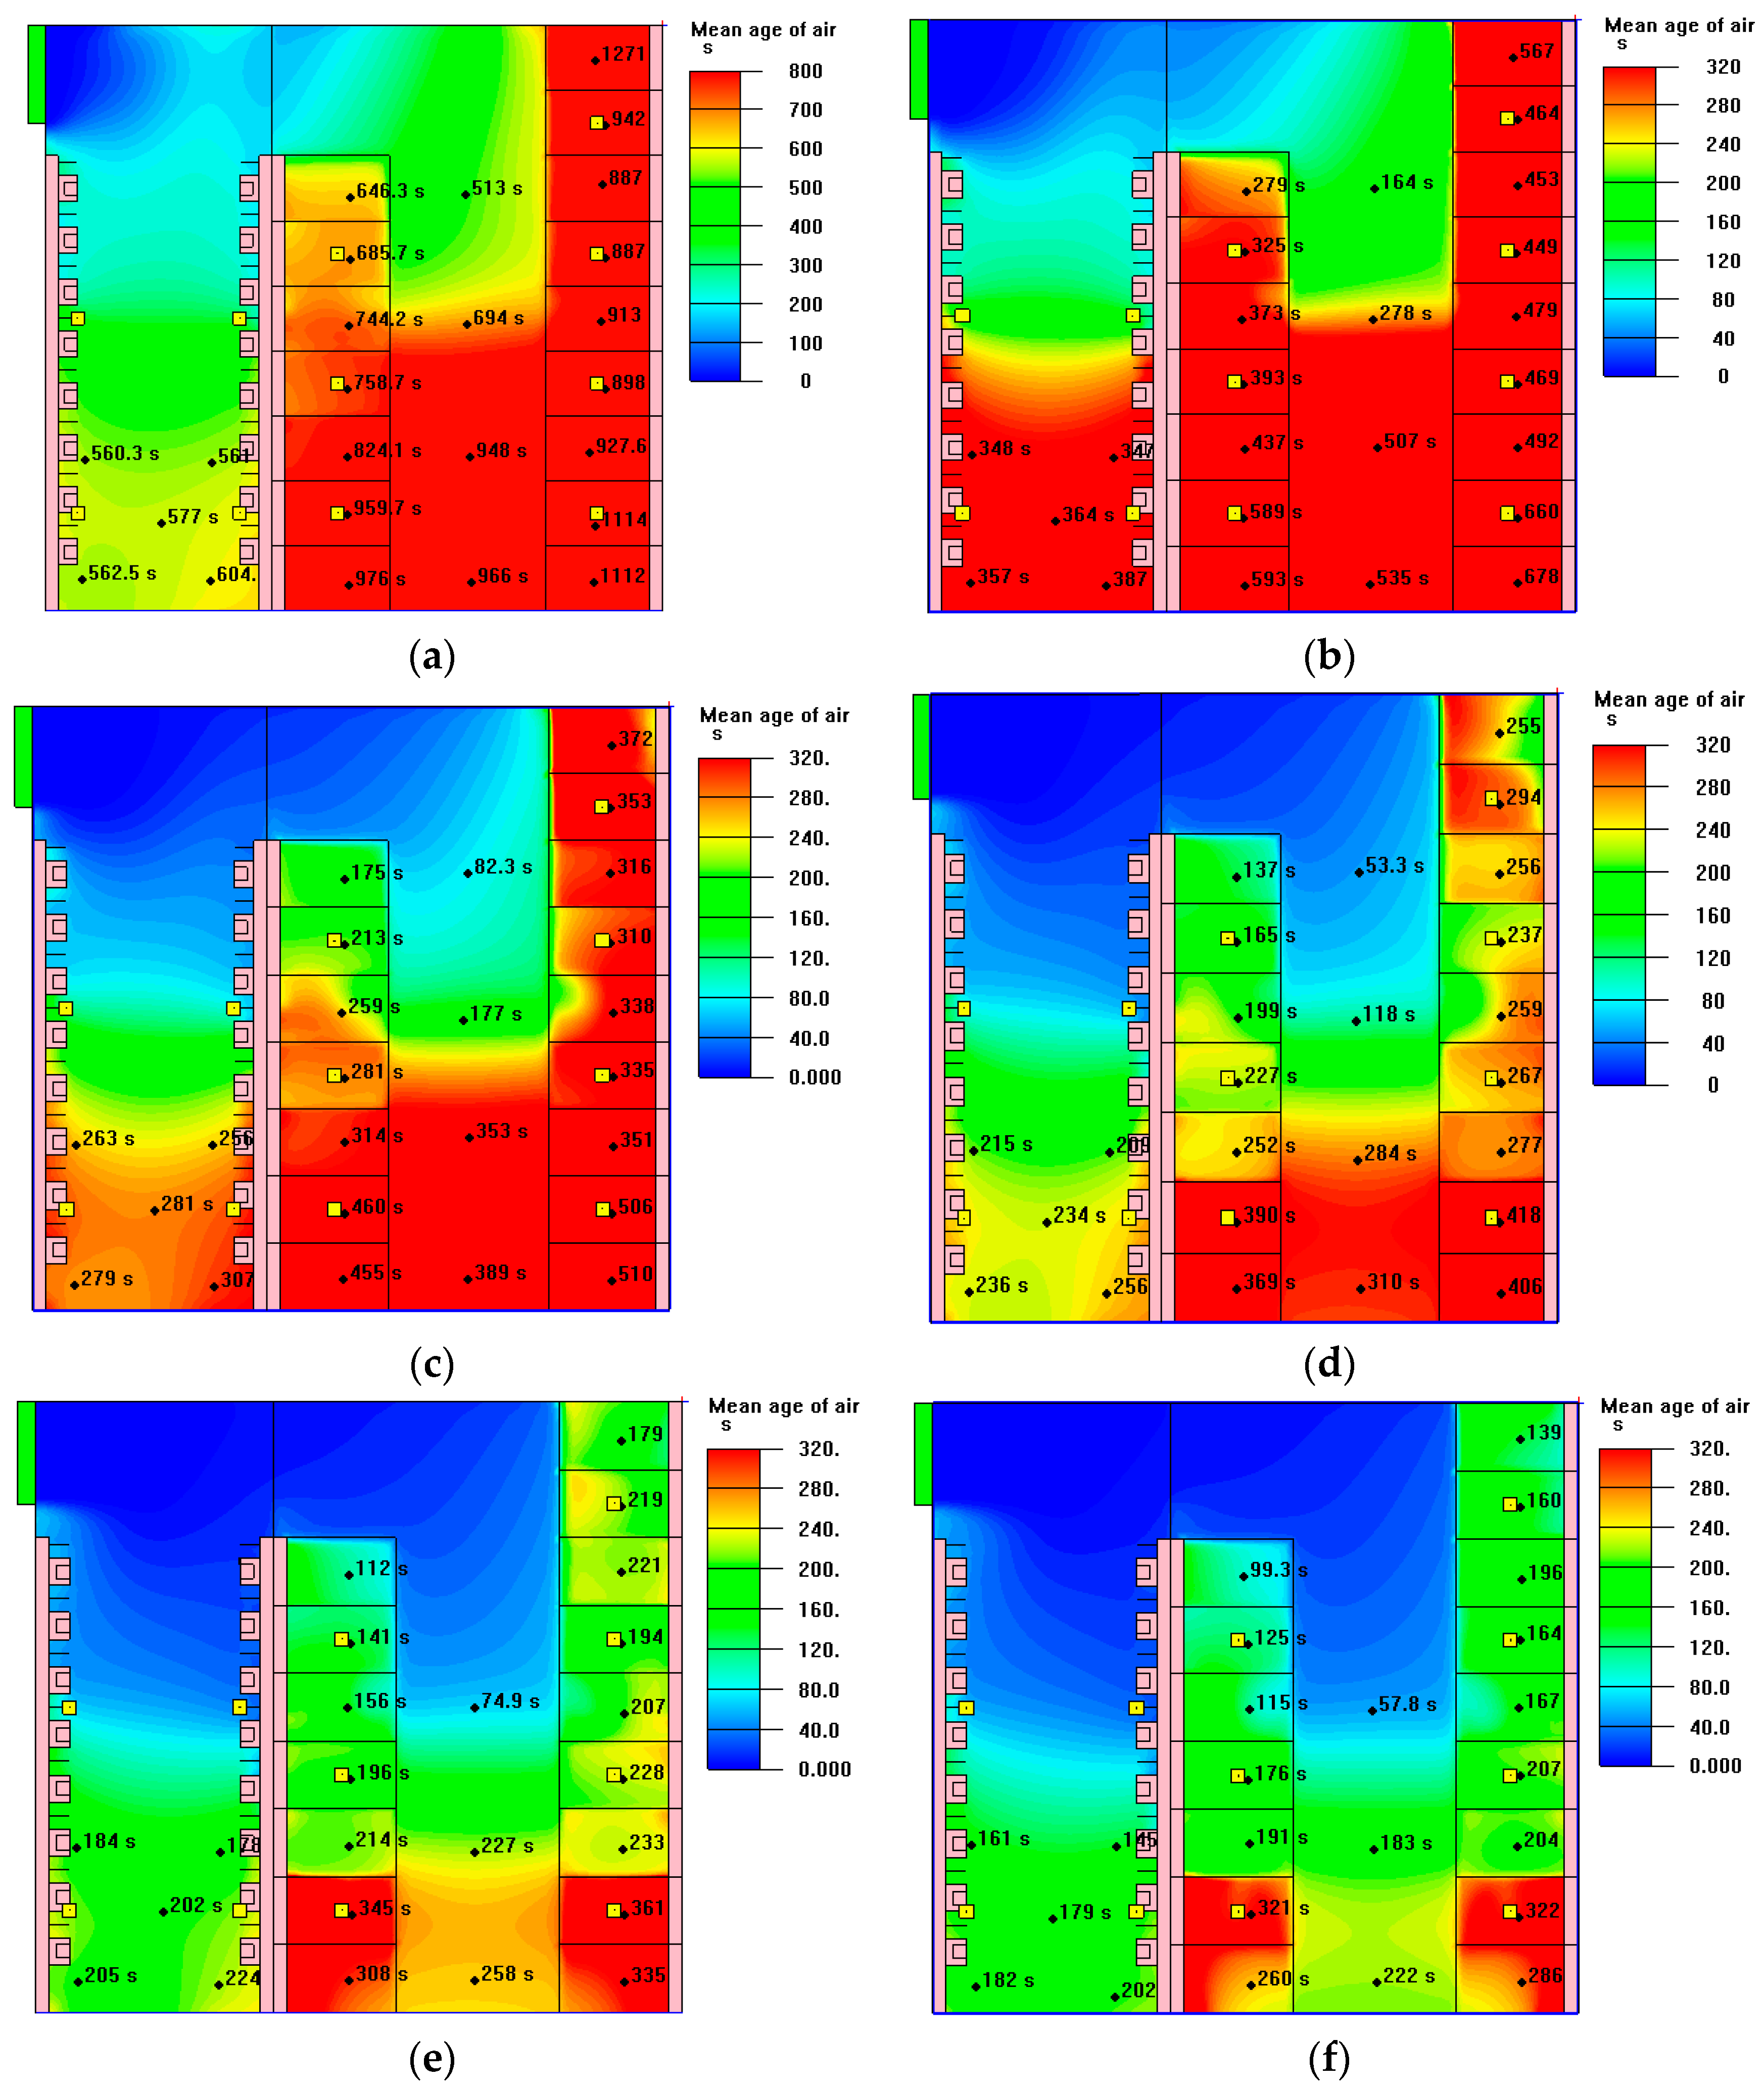
| Ventilation Rate (ACH) | Maximum Air Age in Toilet (s) | Median (Average Value in Toilet) | Median (0.9 m) | Median (1.7 m) | |||
|---|---|---|---|---|---|---|---|
| Mean Age of Air (s) | Ventilation Efficiency | Mean Age of Air (s) | Ventilation Efficiency | Mean Age of Air (s) | Ventilation Efficiency | ||
| 5 | 1492 | 626 | 57.69% | 883 | 40.77% | 860 | 41.86% |
| 10 | 801 | 312 | 57.51% | 459 | 39.22% | 437 | 41.19% |
| 15 | 639 | 215 | 55.81% | 347 | 34.58% | 318 | 37.74% |
| 20 | 576 | 165 | 54.55% | 276 | 32.61% | 252 | 35.71% |
| 25 | 522 | 135 | 53.33% | 228 | 31.58% | 205 | 35.12% |
| 30 | 442 | 115 | 52.17% | 195 | 30.77% | 175 | 34.29% |
| Cases | Exhaust Vent | Size of Vent (mm × mm) | Number of Vents | Ventilation Rate (ACH) | Air Velocity (m/s) |
|---|---|---|---|---|---|
| 1 | Square vent at the top (Stool area) | 200 × 200 | 7 | 20 | 3.24 |
| Square vent at the top (Urinal area) | 200 × 200 | 4 | 20 | 3.24 | |
| 2 | Rectangle vent at the top (Stool area) | 7000 × 20; 9000 × 20 | 2 | 20 | 2.83 |
| Square vent at the top (Urinal area) | 200 × 200 | 4 | 20 | 3.24 | |
| 3 | Rectangle vent at the bottom (0.8 m above the ground in stool area) | 100 × 200 (0.8 m) | 16 | 20 | 2.83 |
| Rectangle vent at the bottom (1.2 m above the ground in urinal area) | 100 × 200 (1.2 m) | 8 | 20 | 3.24 | |
| 4 | Rectangle vent at the bottom (0.3 m above the ground in stool area) | 100 × 200 (0.3 m) | 16 | 20 | 2.83 |
| Rectangle vent at the bottom (1.2 m above the ground in urinal area) | 100 × 200 (1.2 m) | 8 | 20 | 3.24 |
| Cases | Median Air Age (s) | Ventilation Efficiency | Ammonia Concentration Distribution (ppm) | Class of Toilet | ||||
|---|---|---|---|---|---|---|---|---|
| Height of Stool Area | Height of Urinal Area | Whole Toilet | ||||||
| 0.9 m | 1.7 m | 0.9 m | 1.7 m | |||||
| 1 | 168 | 53.57% | 1.98 | 1.45 | 0.50 | 0.39 | 1.11 | II |
| 2 | 156 | 57.69% | 1.45 | 1.09 | 0.50 | 0.39 | 0.90 | II |
| 3 | 140 | 64.29% | 0.81 | 0.24 | 0.47 | 0.34 | 0.39 | I |
| 4 | 138 | 65.22% | 0.21 | 0.10 | 0.47 | 0.34 | 0.26 | I |
| Case | Ventilation | Median Mean Age of Air (s) | Ventilation Efficiency | Ammonia Concentration Distribution (ppm) | Class of Toilets | ||||
|---|---|---|---|---|---|---|---|---|---|
| Stool Area | Urinal Area | Whole Toilet | |||||||
| 0.9 m | 1.7 m | 0.9 m | 1.7 m | ||||||
| 2 | Top exhaust | 156 | 57.69% | 1.45 | 1.09 | 0.50 | 0.39 | 0.90 | II |
| 4 | Bottom exhaust | 138 | 65.22% | 0.21 | 0.10 | 0.47 | 0.34 | 0.26 | I |
| 5 | Top exhaust + fresh air supply | 149 | 60.40% | 1.49 | 1.04 | 0.49 | 0.39 | 0.89 | II |
| 6 | Bottom exhaust + fresh air supply | 136 | 66.18% | 0.18 | 0.086 | 0.48 | 0.34 | 0.25 | I |
Disclaimer/Publisher’s Note: The statements, opinions and data contained in all publications are solely those of the individual author(s) and contributor(s) and not of MDPI and/or the editor(s). MDPI and/or the editor(s) disclaim responsibility for any injury to people or property resulting from any ideas, methods, instructions or products referred to in the content. |
© 2023 by the authors. Licensee MDPI, Basel, Switzerland. This article is an open access article distributed under the terms and conditions of the Creative Commons Attribution (CC BY) license (https://creativecommons.org/licenses/by/4.0/).
Share and Cite
Yu, J.; Qian, C.; Zhao, J.; Tao, J.; Leng, K.; Xu, X. Indoor Air Quality Improvement in Public Toilets at Railway Stations in China: A Field and Numerical Study. Sustainability 2023, 15, 8720. https://doi.org/10.3390/su15118720
Yu J, Qian C, Zhao J, Tao J, Leng K, Xu X. Indoor Air Quality Improvement in Public Toilets at Railway Stations in China: A Field and Numerical Study. Sustainability. 2023; 15(11):8720. https://doi.org/10.3390/su15118720
Chicago/Turabian StyleYu, Jinghua, Congcong Qian, Jingang Zhao, Junwei Tao, Kangxin Leng, and Xinhua Xu. 2023. "Indoor Air Quality Improvement in Public Toilets at Railway Stations in China: A Field and Numerical Study" Sustainability 15, no. 11: 8720. https://doi.org/10.3390/su15118720