Article

Multi-Response Optimization of Semi-Lightweight Concrete Incorporating Expanded Polystyrene Beads

1
Department of Civil and Environmental Engineering, University of Balamand, Al Koura P.O. Box 100, Lebanon
2
Department of Civil and Environmental Engineering, UAE University, Al Ain P.O. Box 15551, United Arab Emirates
*
Author to whom correspondence should be addressed.
Sustainability 2023, 15(11), 8757; https://doi.org/10.3390/su15118757
Submission received: 10 April 2023 / Revised: 6 May 2023 / Accepted: 23 May 2023 / Published: 29 May 2023

Abstract

:
The utilization of expanded polystyrene (EPS) beads in semi-lightweight concrete (SLC) intended for repair and building applications has gained great attention in recent years. This study examines the effect of mix design parameters including binder content, water-to-binder ratio (w/b), EPS content, and silica fume (SF) additions on the mechanical properties and durability of SLC mixtures. The experimental program was carried out following the Taguchi approach for four parameters, each having three levels, to produce an L9 orthogonal array. The performance criteria under investigation were the superplasticizer demand, density, compressive strength, splitting tensile strength, ultrasonic pulse velocity, water absorption, sorptivity, and abrasion resistance. Test results showed that the w/b and EPS content were the most contributing parameters that altered the SLCs performance. The multi-response optimization method (TOPSIS) revealed that superior performance could be achieved using a binder content of 375 kg/m3, a w/b of 0.45, an EPS content of 3 kg/m3, and a SF replacement rate of 8%. The mix design parameters were utilized to create multivariate regression models to predict the SLCs mechanical and durability properties. Such data can be of particular benefit to engineers seeking the use of lightweight materials for sustainable construction with optimized durability and a reduced cement carbon footprint.

1. Introduction

Concrete is widely used in the building industry; its strength and durability make it suitable for a wide range of applications requiring resistance to heavy loads and harsh weather conditions [1,2]. In fact, extending the service life of concrete structures is an essential strategy to meet the requirements of the construction sector [3]. Yet, the weight of concrete, typically varying from 2200–2400 kg/m3, poses practical challenges with direct implications for the load-bearing capacity of the buildings’ foundations and other support structures. Offshore construction and mass-produced precast concrete necessitate large-capacity trucks and cranes for transportation, which also pose costs and environmental concerns for sustainable concrete construction in the future [4,5]. Compared to traditional concrete, lightweight concrete offers several advantages, such as high energy dissipation under impact loading and a high tensile strength-to-weight ratio [6]. As such, the use of lightweight materials has considerably increased in concrete production, particularly in cases where reducing the weight of structures is deemed a strategic solution [7,8]. According to the American Concrete Institute (ACI) 213R, lightweight concrete is characterized by a density that falls within 1350 to 1900 kg/m3 with a minimum compressive strength of 17 MPa [9]. The British standard defines lightweight concrete as a material with a density of 800 to 2000 kg/m3 and a minimum compressive strength of 8 MPa [10].
Lightweight concrete containing expanded polystyrene (EPS) materials experienced significant growth in structural, precast, and repair applications [11,12]. EPS is a lightweight artificial aggregate derived from petroleum and made by expanding polystyrene beads with steam or chemical treatment and then molding them into various shapes and sizes. These small and interconnected beads are 95–98% air, with a unit weight ranging from 15 to 35 kg/m3. They are non-absorbent and hydrophobic in nature, thereby mitigating the need for water saturation prior to concrete production [13,14]. EPS aggregates have lower mechanical properties and stiffness, causing lightweight concrete with EPS to have a higher drying shrinkage compared to normal-weight concrete [15]. This material is commonly used in packaging, insulation, and building construction. Indeed, EPS containing a high air percentage is characterized by excellent insulating properties together with superior resistance to moisture and chemical attack [16,17,18]. Particular EPS advantages over other commonly used lightweight aggregates (i.e., clay, perlite, shale, and kaolin) include the potential for on-site production, uniformity of particle size distribution, and reduced costs.
The existing research indicates that incorporating EPS into concrete reduces its stiffness and resistance to external loads, leading to reduced mechanical performance and overall durability [19,20]. Nikbin and Golshekan examined the fracture response of lightweight concrete containing 0 to 40% EPS by volume and observed a significant decrease in fracture toughness with increasing EPS content [21]. The fracture characteristics of EPS-modified concrete could be explained by the principles of non-linear fracture mechanics, thus necessitating particular attention during the development of mixtures intended for structural applications. Chung et al. found strong relationships between the EPS size and concentration with respect to the thermal and strength properties of concrete mixtures [22]. Bakhshi and Shahbeyk noticed that replacing the mixing water with EPS could enhance the strength up to a certain volume content [23]. According to Babu et al., the proportion of EPS utilized in concrete has a significant influence on the percolation of moisture and water. Specifically, large-sized EPS beads were found to increase water migration, which in turn led to higher rates of chloride diffusion when exposed to salt solutions. This increase in chloride diffusion accelerated the corrosion rate and contributed to the deterioration of steel reinforcement in EPS-modified concrete structures [7]. It is worth noting that limited studies attempted to assess the capacity of EPS-modified concrete to resist wear due to impact and friction, known as abrasion resistance [24]. Rubbing actions and induced friction can heavily damage concrete surfaces, making abrasion resistance a valuable indicator of potential longevity. The impact resistance is affected by the strength of the aggregate and cementitious paste, in addition to the bonding strength of their interfaces.
The reduction of the water-to-binder ratio (w/b) and use of supplementary cementitious materials are common techniques for proportioning EPS concrete, thus contributing to improved strength while reducing the cement carbon footprint [25]. The density and mechanical properties of lightweight concrete are directly influenced by the mixture proportions, including the type and quantity of EPS, binder content, and w/b [26,27]. Chen et al. found that the addition of silica fume (SF) improved the bond properties between the cement paste and EPS beads [28]. The compressive strength dropped from 24 to 8 MPa when 40% EPS was incorporated by volume. The experimental results revealed micro-cracking and debonding at the interface between the EPS and cement paste, which increased the susceptibility to aggressive ion attacks. Assaad and El-Mir found that incorporating styrene-butadiene rubber in lightweight concrete benefits the bonding strength of composite slabs, particularly when subjected to freeze-thaw cycles [25].
Achieving optimal performance in lightweight concrete is a challenging task that involves an extensive amount of trial-and-error testing to evaluate the effects of various mixture parameters such as binder type and content, w/b, SF additions, and EPS content. The Taguchi method is an integrated approach for sustainable development and analysis of how different parameters may affect the quality of a product [29]. The method uses orthogonal arrays to optimize these experiments systematically and efficiently, thus reducing the number of experiments needed to obtain meaningful results [30]. Although the Taguchi method has been effective in determining the required performance criteria while minimizing the number of developed mixtures, it is incapable of considering multiple criteria concurrently. As such, multicriteria optimization methods, such as the technique for order of preference by similarity to the ideal solution (TOPSIS), have been successful in finding the optimal scenarios for designing engineering materials while considering various operation criteria and saving testing costs and time [31,32,33]. Despite the effectiveness of these methods, no research has yet explored the optimization and performance of lightweight concrete incorporating EPS as an aggregate material.
This study aims to examine the effect of various mix design parameters on the mechanical properties and durability of EPS-modified semi-lightweight concrete (SLC) mixtures possessing up to 45 MPa compressive strength and a density varying from 1950 to 2250 kg/m3. Four parameters, each with three levels, were analyzed, including the binder content, w/b, EPS content, and SF replacement rate. Using the Taguchi method, nine SLC mixtures were formulated and assessed based on the superplasticizer (SP) demand, density, compressive strength, splitting tensile strength, ultrasonic pulse velocity, water absorption, sorptivity, and abrasion resistance. The results were used to identify an optimal mixture that exhibits superior performance with the least density. These findings can be of interest to civil engineers and contractors as they showcase the advanced performance of EPS-modified SLC, thus promoting its use for sustainable construction with optimized durability and a reduced cement carbon footprint.

2. Experimental Program

2.1. Materials

The cement used in this study conformed to ASTM C150 Type I [34], with a median particle size of 21.2 μm, Blaine surface area of 3750 cm2/g, and a specific gravity of 3.03. Commercially available SF conforming to ASTM C1240 was employed [35]. The siliceous sand, used as fine aggregate, complied with the requirements of ASTM C33 [36]; its fineness modulus, absorption rate, and bulk specific gravity were 2.54, 1.01%, and 2.65, respectively. Crushed limestone with a nominal maximum size of 12.5 mm was utilized as the coarse aggregate; it had a dry bulk density of 1780 kg/m3, a fineness modulus of 6.7, a water absorption of 0.75%, and a specific gravity of 2.7.
The concrete was made lighter by incorporating commercially available EPS materials. These were produced by heating thermoplastic polystyrene beads to 140 °C, which caused them to expand into spherical shapes measuring 2.5 to 3 mm in diameter. The EPS had a specific gravity of 0.02, a density of 20 kg/m3, and nearly no water absorption. The ASTM C165 compressive strength test performed at 10% deformation revealed a value of 62.5 kPa [37]. A superplasticizer (SP) based on naphthalene sulphonate complying with ASTM C494 Type F was employed [38]; its maximum dosage by cement mass was 3.5%, while its solid content and specific gravity were 39% and 1.19, respectively.

2.2. Mixture Proportioning

The SLC mixtures were designed using the Taguchi method, which employs orthogonal arrays with pre-determined levels to reduce the variance of experiments and the number of required samples [33,39]. In this study, an L9 orthogonal array was used consisting of four parameters with three levels each, as presented in Table 1. Hence, the nine mixtures with different levels of binder content (325, 375, and 425 kg/m3), EPS content (1, 2, and 3 kg/m3), w/b (0.55, 0.50, and 0.45), and SF replacement percentages (0, 4%, and 8%, by mass) were developed and investigated in this study. The determination of the appropriate levels of binder content, w/b content, and EPS content to achieve an SLC was based on prior research [25]. Meanwhile, the w/b in SLC was reduced from 0.55 to 0.45 to restore the drop in compressive strength caused by the EPS addition. It is worth mentioning that SF was used in this study to ensure the proper distribution and stability of EPS beads in the freshly mixed concrete until the onset of hardening [40].
The proportions of SLC mixtures are summarized in Table 2; the mixtures are labeled xC-yW-vE-zS, where x is the binder content (kg/m3), y is w/b, v is EPS content (kg/m3), and z is the SF replacement rate (% of cement mass). For instance, mix 3 (325C-0.45W-3E-8S) represents a concrete mix made with a binder content of 325 kg/m3, a w/b of 0.45, an EPS content of 3 kg/m3, and a SF replacement rate of 8%. Mix 10, prepared with 325 kg/m3 binder, 0.55 w/b, and without EPS or SF additions, is considered the control mixture. It is important to note that the SP demand was adjusted in all mixtures to ensure the S4 workability class, having slump values in the range of 180 ± 25 mm [10,41].

2.3. Batching and Test Methods

A 50-L open-pan mixer was used for concrete batching. Initially, the fine and coarse aggregates were mixed with approximately 40% of the mixing water. The cement, SF, and EPS particles were then introduced. Following one minute of mixing, the remaining 50% of the water and SP, which was diluted in 10% of the remaining water, were added. The concrete was then mixed for an additional two minutes. The ambient temperature and relative humidity during mixing and testing remained within 24 ± 2 °C and 50 ± 5%, respectively. The SLC was cast into 100 mm × 200 mm (diameter × height) cylinders, thoroughly compacted, and covered with a plastic sheet during the first 24 h. The specimens were demolded after 24 h, immersed in water for seven days, and then conserved in a room where ambient temperature and relative humidity remained within 23 ± 3 °C and 50 ± 10%, respectively.
The workability of fresh concrete was evaluated using the slump cone, as per ASTM C143 [42]. The compressive (fc) and splitting tensile (fsp) strengths were determined in accordance with ASTM C39 [43] and C496 [44], respectively. Each measurement was based on the average of three cylindrical specimens. In addition, the hardened 28-day concrete densities were determined as per ASTM C138 [45].
To evaluate the quality of the 28-day concrete, a non-destructive ultrasonic pulse velocity (UPV) test was performed in accordance with ASTM C597 [46]. The water absorption and sorptivity were determined following ASTM C642 [47] and C1585 [48], respectively. The 100-mm × 200-mm cylinders were dried in an oven, then submerged in water for 48 h to measure the percentage increase in specimen weight. The water absorption (Wabs) was calculated using Equation (1):
W abs ,   % = SSD   mass   g   Dry   mass   ( g ) Dry   mass   ( g ) × 100
In the sorptivity test, the exposed surfaces of concrete discs (100 mm diameter × 50 mm height) were placed in contact with water and weighed at different time intervals for a period of 6 h. The rate of water absorption, or sorptivity, was determined as the slope of the linear relationship between the absorption (I, mm) and the square root of time. The I value is computed using Equation (2):
I ,   mm = Change   in   mass   at   given   time   ( g ) Exposed   area   ( mm 2 )   ×   density   of   water   in   ( g / mm 3 )
The Los Angeles abrasion machine, following the procedure outlined in ASTM C1747 [49], was used to measure the mass loss resulting from impact and abrasion. The mass of each specimen was recorded before and after the test, and the resistance to abrasion was expressed as the percentage of mass loss after 500 evolutions [24].

3. Test Results and Discussion
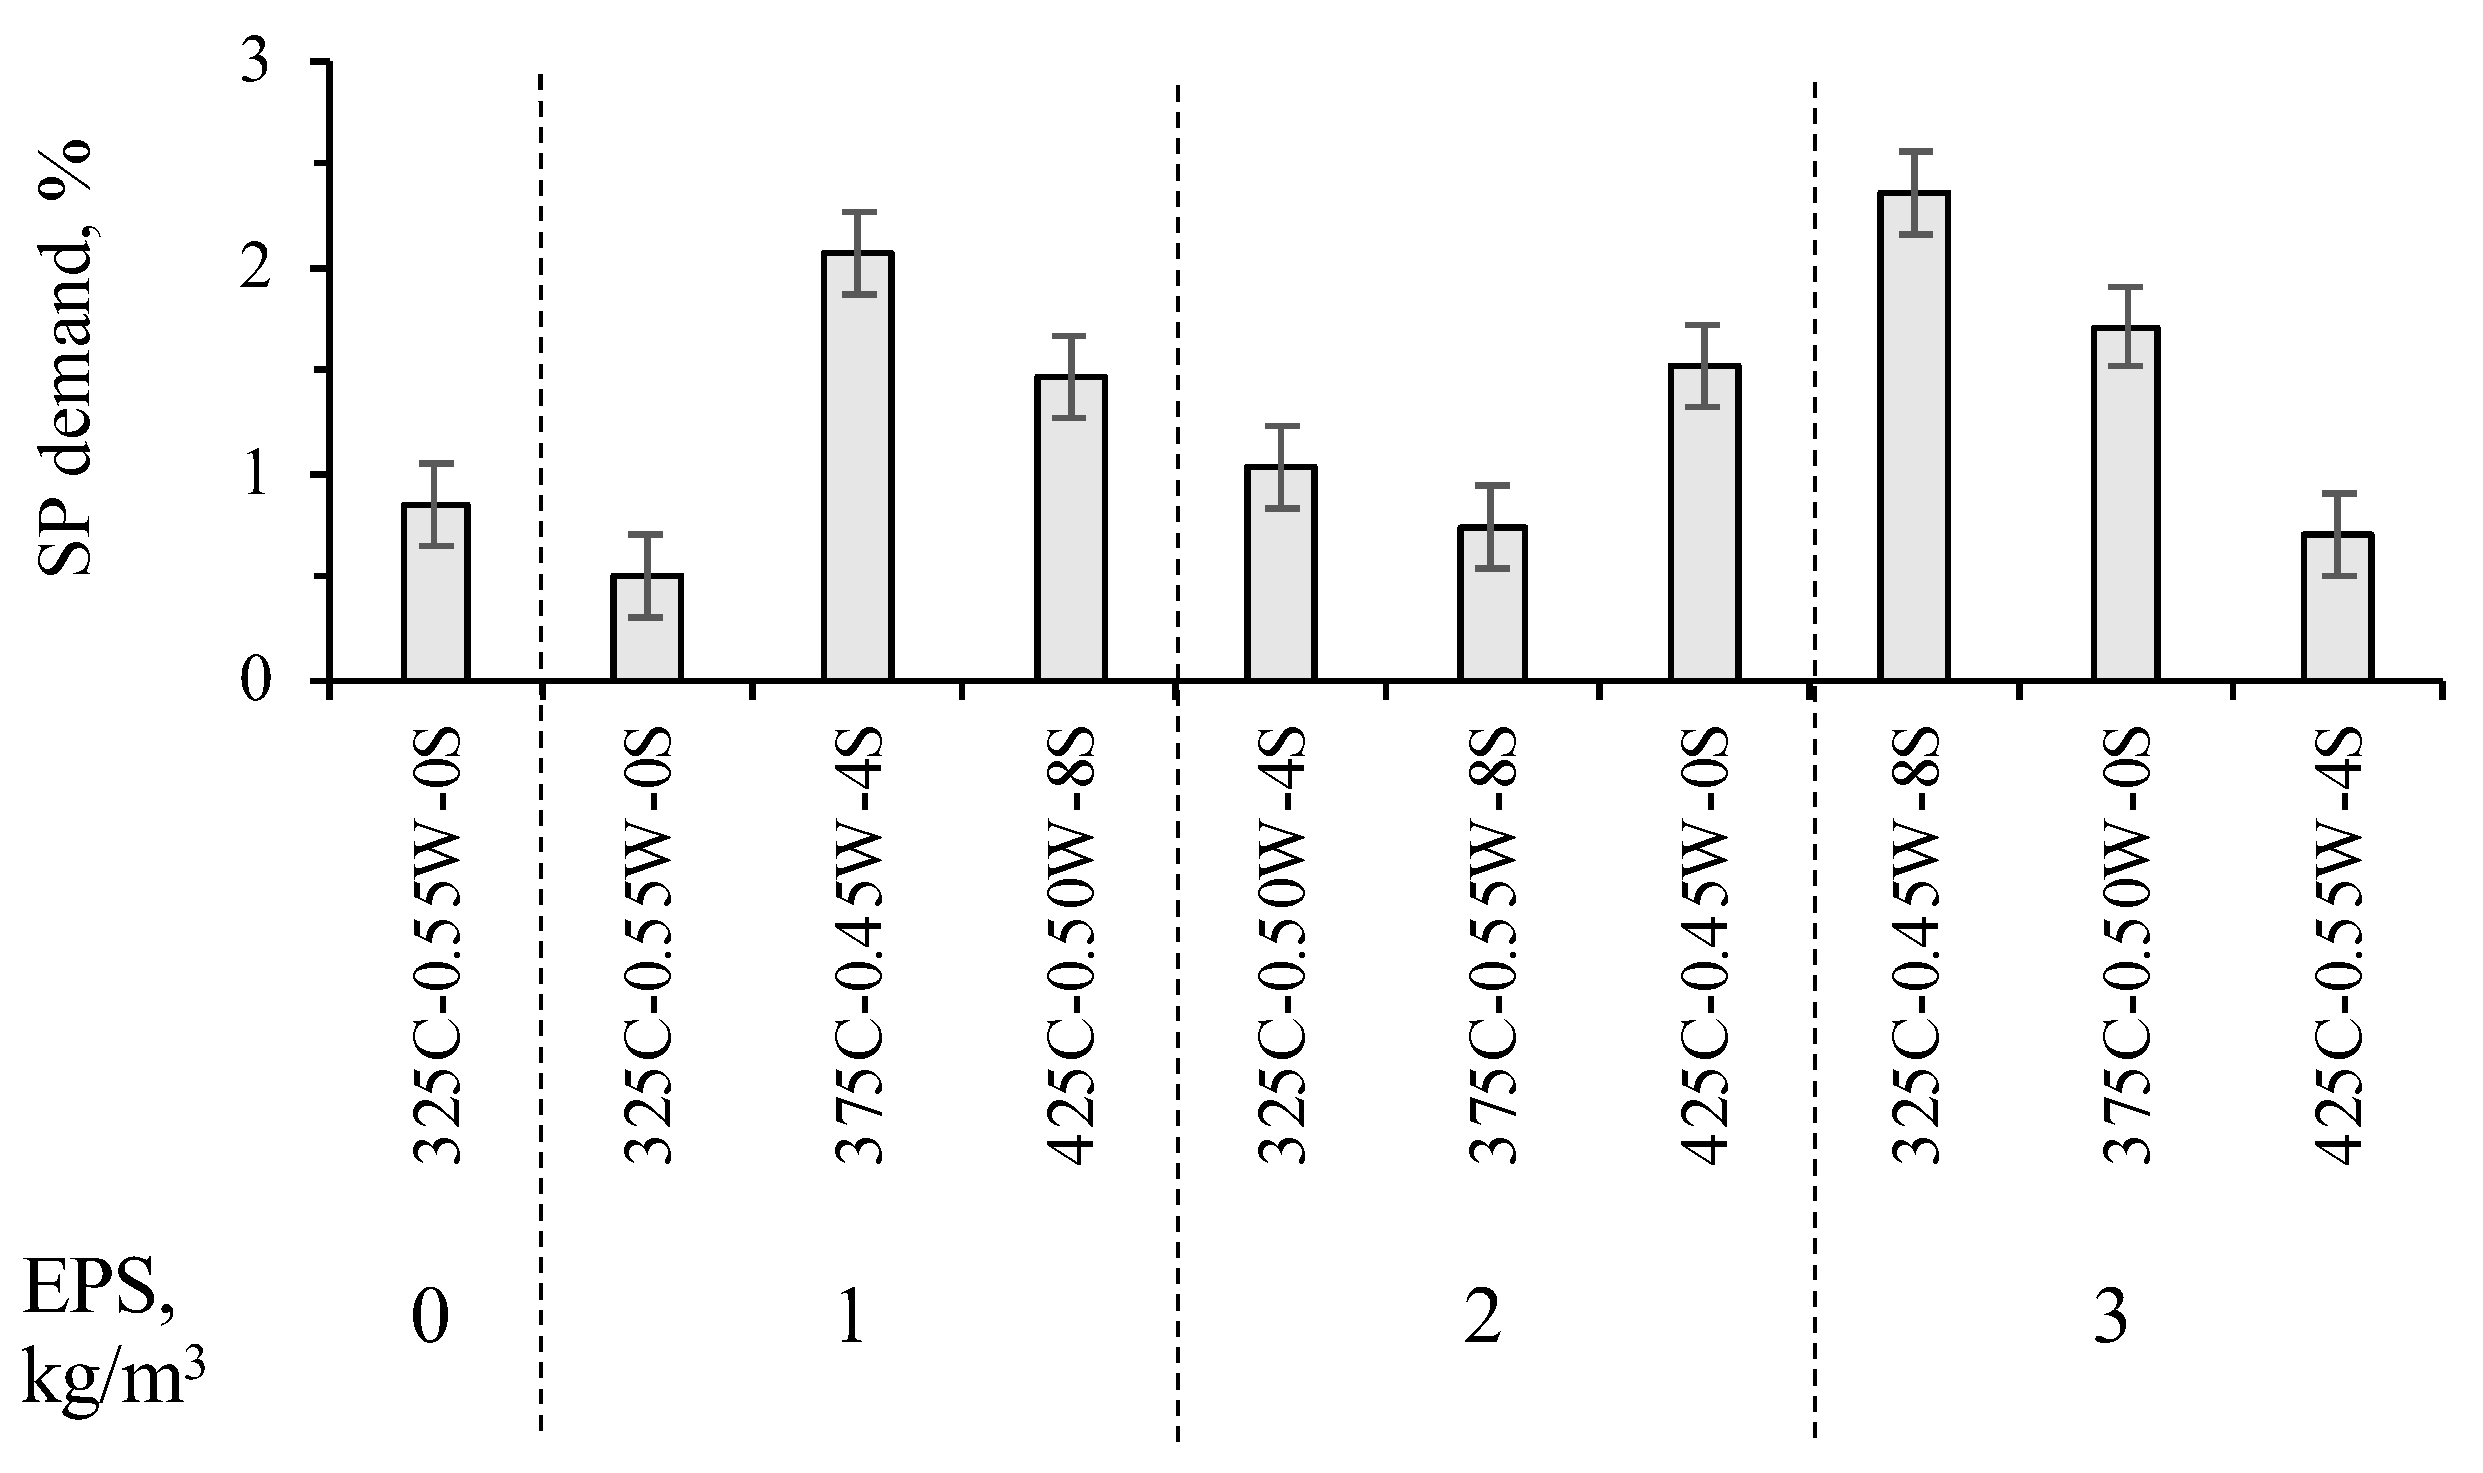
The SP demand, density, fc, fsp, and durability responses for tested SLC mixtures prepared with different EPS contents are summarized in Table 3.

3.1. SP Deamand

Mixtures prepared with reduced w/b required higher SP demand, given the reduced free mixing water that necessitated higher superplasticizer molecules to achieve the targeted slump class (Figure 1). Such a response is in line with previous studies performed on concrete containing EPS additions [8,50]. On the other hand, mixtures made with similar w/b and incorporating EPS exhibited relatively less SP demand. For instance, this varied from 0.85% for the control mix to 0.51% and 0.74% for 325C-0.55W-1E-0S and 325C-0.55W-2E-8S mixtures containing 1 and 2 kg/m3 of EPS, respectively. This can be explained by the decrease in the level of internal friction within the concrete skeleton, leading to improved workability [51,52].
It is interesting to note that mixtures prepared with increased w/b (i.e., 0.55) and high EPS content (i.e., 3 kg/m3) yielded the lowest SP demand, which can be related to the concurrent effects of additional mixing water and EPS beads that lubricate the cementitious matrix [15,25]. This reflects the fact that the SP demand is remarkably influenced by the w/b, as justified by its high contribution percentage shown in the ANOVA section later on. Regardless of EPS addition, the incorporation of SF increased the SP demand; for example, this varied from 2.06% to 2.36 % for the 375C-0.45W-1E-4S and 325C-0.45W-3E-8S mixtures, respectively. This can be attributed to the high fineness of SF, which requires extra SP molecules to lubricate the binding materials and secure the targeted consistency [53].

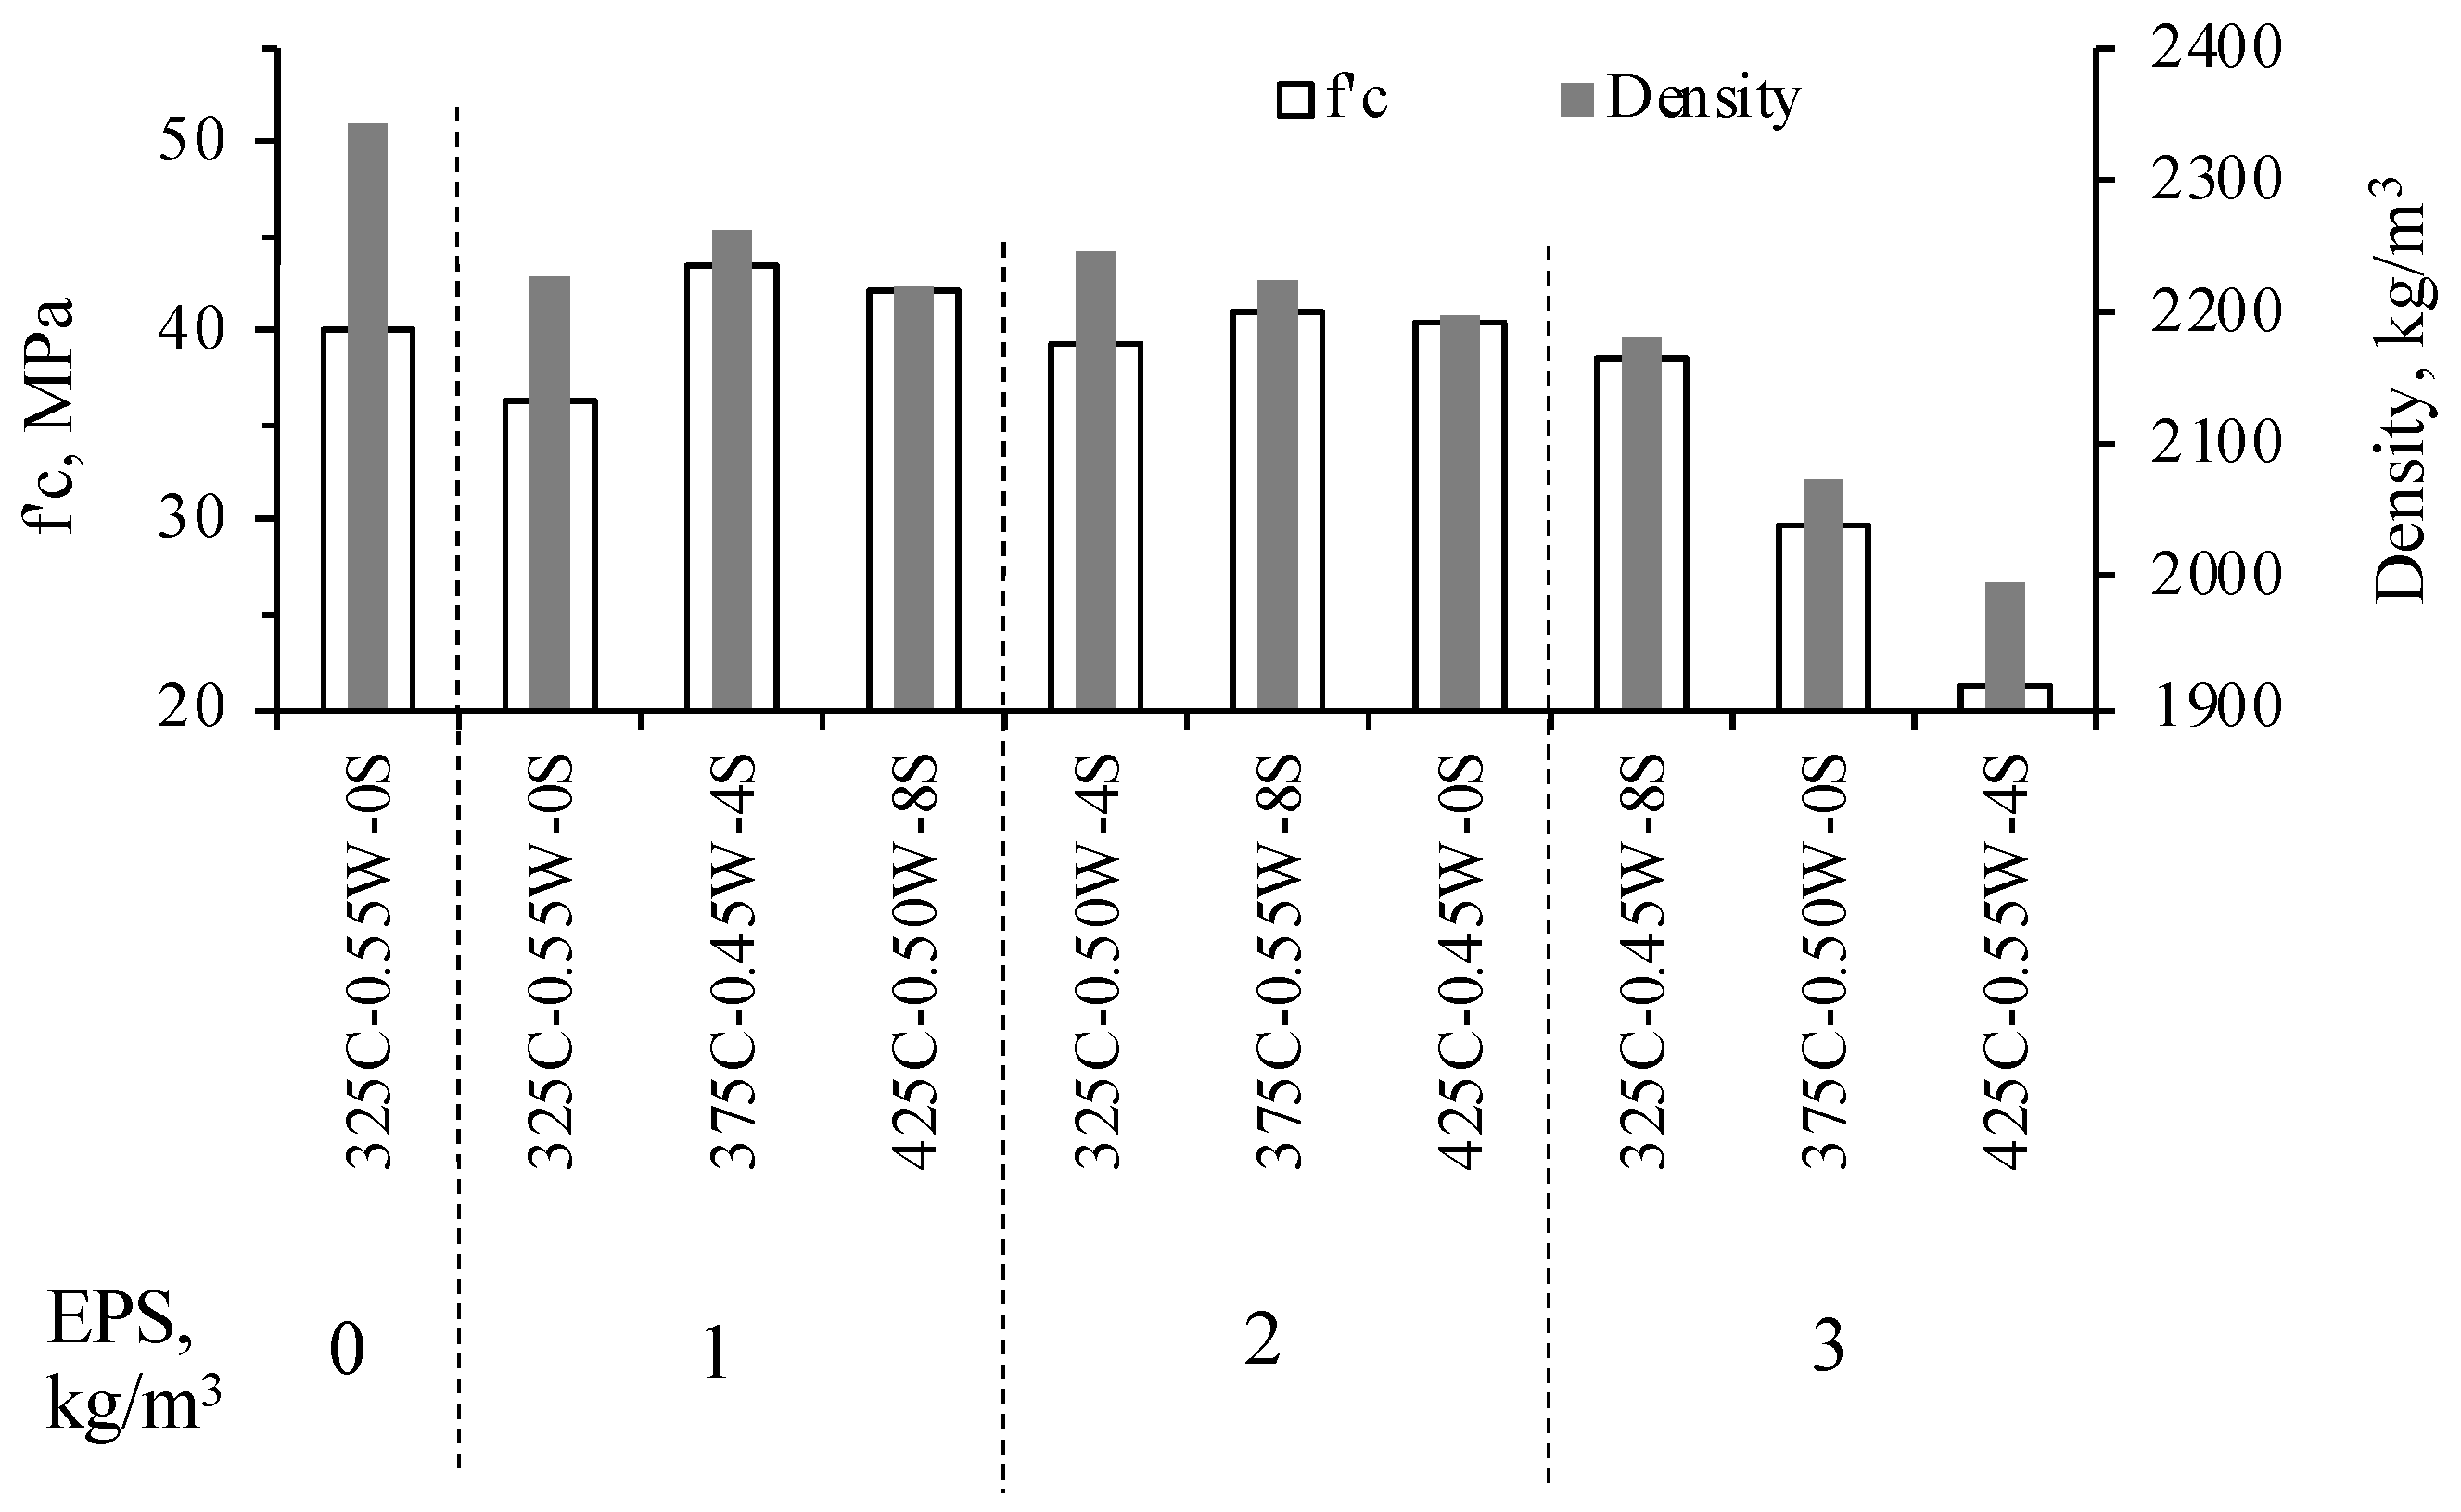
3.2. Density and Strength

Figure 2 plots the variation in the density and fc of SLC mixtures. As observed, the control mix (325C-0.55W-0E-0S) yielded the highest density of 2342 kg/m3, while the addition of EPS decreased such values by 3.4% to 14.8%. The lowest density of 1996 kg/m3 was obtained for the 425C-0.55W-3E-4S mix made with 3 kg/m3 of EPS and a w/b of 0.55. This can be attributed to the lightweight nature of the EPS fraction together with increased mixing water (i.e., higher porosity) that could collectively reduce the density [54]. It is to be noted that the density is mainly affected by the EPS content, as demonstrated later using ANOVA analysis.
Generally, the fc values remained almost unaltered with EPS additions at relatively low rates of 1 to 2 kg/m3, i.e., the strength responses varied within 10% of the control value (Figure 2). Mixtures prepared with reduced w/b, higher binder content, and SF additions exhibited slight improvements in strength, despite the EPS additions. For instance, the fc attained 43.3 and 40.3 MPa at 1 to 2 kg/m3 EPS for SLC mixtures proportioned with a w/b of 0.45, respectively. This reflects the importance of controlling the w/b to maintain the concrete’s compressive strength despite the reduced density. Such results corroborate other studies evaluating the effect of EPS on hardened concrete properties [7,25].
At similar w/b, the use of a relatively high EPS rate of 3 kg/m3 led to a noticeable drop in strength, as justified by their high contribution toward this property in the ANOVA section later. For instance, fc decreased from 40.1 to 21.2 MPa for mixtures prepared with 0 and 3 kg/m3 EPS, respectively, at a similar w/b of 0.55. Yet, the simultaneous reduction in w/b to 0.45 and inclusion of 8% SF in the 325C-0.45W-3E-8S mixture were efficient in restoring the strength to 38.6 MPa. Earlier studies have shown that the incorporation of SF and fine cementitious materials plays a determinate role in improving the interfacial transition zone between the cement paste and EPS beads, leading to enhanced ductility and reduced crack propagation [2,3,4,5,6,7,8,9,10,11,12,13,14,15,16,17,18,19,20,21,22,23,24,25,26,27,28,29,30,31,32,33,34,35,36,37,38,39,40]. Thus, it could be stated that SLC made with a relatively high EPS of 3 kg/m3 can still be considered in designing structural concrete, despite the reduced density. A high coefficient of correlation (R2) of 0.92 exists between the density and fc results, reflecting the ability to predict the compressive strength with high accuracy.
f c = 0.0002   ( Density ) 2 + 1 . 1004   ( Density ) 1216 . 7 ,
The fsp values plotted in Figure 3 for various SLC mixtures followed an analogous trend to the fc responses. For each EPS addition rate, mixes 375C-0.45W-1E-4S, 425C-0.45W-2E-0S, and 325C-0.45W-3E-8S having EPS content of 1, 2, and 3 kg/m3 yielded the highest fsp of 4.0, 3.8, and 3.7 MPa, respectively. Obviously, the reduction in w/b mitigated the drop in strength caused by the addition of EPS. Such results corroborate the contributions of these two parameters, as reported in the ANOVA section later. The incorporation of SF can be particularly beneficial to enhance the interfacial zones and strengthen the adhesion to the EPS beads [27]. It is worth noting that all tested mixtures exhibited proper homogeneity with no signs of segregation or floating of EPS particles, as can be observed in Figure 4. An accurate relationship exists between the fsp and fc responses, signifying the ability to predict fsp with high accuracy (i.e., R2 of 0.99).
f s p = 0.903   f c + 1.98 ,

3.3. Ultrasonic Pulse Velocity Measurements

The UPV variations for SLC mixtures prepared with different EPS rates are illustrated in Figure 5. The responses varied within 4332 ± 50 m/s for mixtures prepared with EPS content varying from 0 to 2 kg/m3 and within 4063 ± 200 m/s for SLC prepared with 3 kg/m3 of EPS. In general, the mixtures can be ranked as good to excellent [55,56]. This confirms that EPS-modified SLC mixtures can be as long-lasting as regular concrete, provided a decrease in w/b enhances its density and maintains similar strength responses. The UPV responses yielded similar trends as the fc and fsp; hence, the 375C-0.45W-1E-4S%, 325C-0.50W-2E-4S, and 325C-0.45W-3E-8S mixtures containing 1, 2, and 3 kg/m3 EPS contents exhibited the highest UPV responses of 4347, 4357, and 4280 m/s, respectively. In contrast, the impact of SF replacement percentages was insignificant compared to w/b and EPS content, as evidenced by their low contributions toward the UPV response (see the ANOVA section later).
The UPV responses can be well correlated to the compressive strength and density, as shown in Equations (5) and (6), respectively. The resulting R2 values are higher than 0.91, reflecting the ability to predict the UPV from the fc and density with high accuracy. It is to be noted that the corresponding equations are limited to SLC mixtures having fc and density values varying from 20 to 45 MPa and from 1900 to 2300 kg/m3, respectively.
UPV = 260.33   f c + 2671.3
UPV = 1.624 Density + 684.4

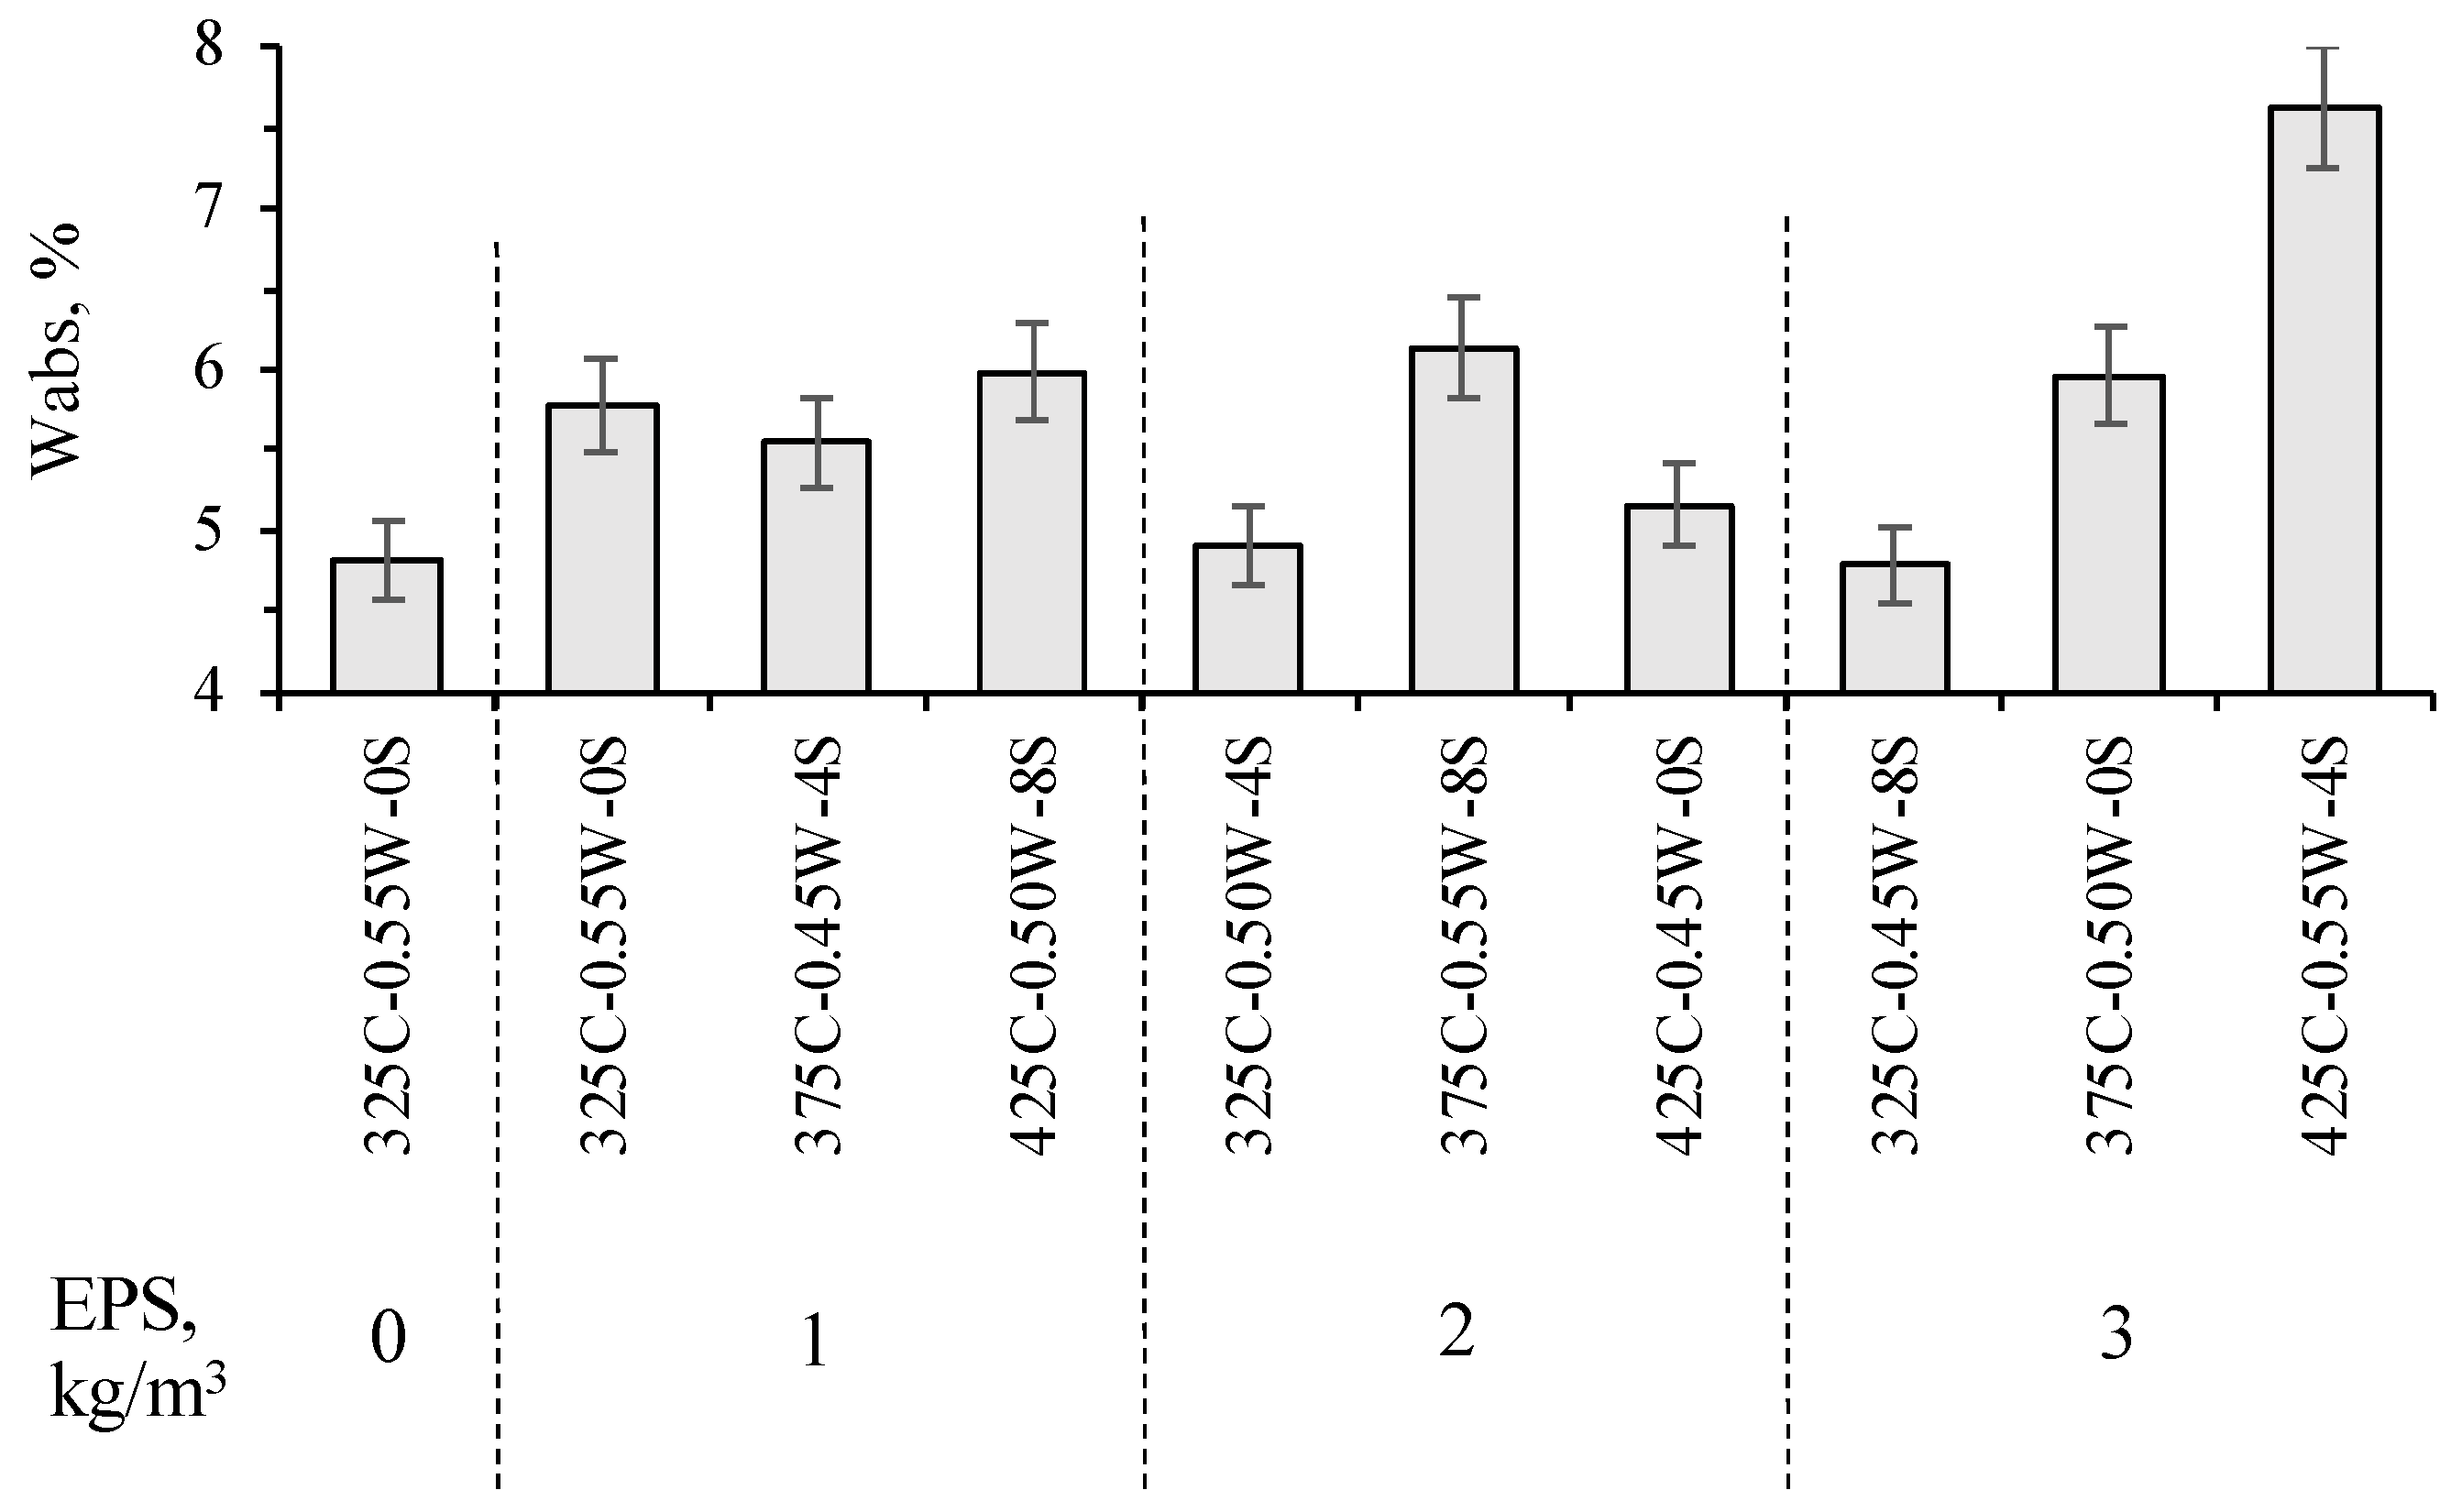
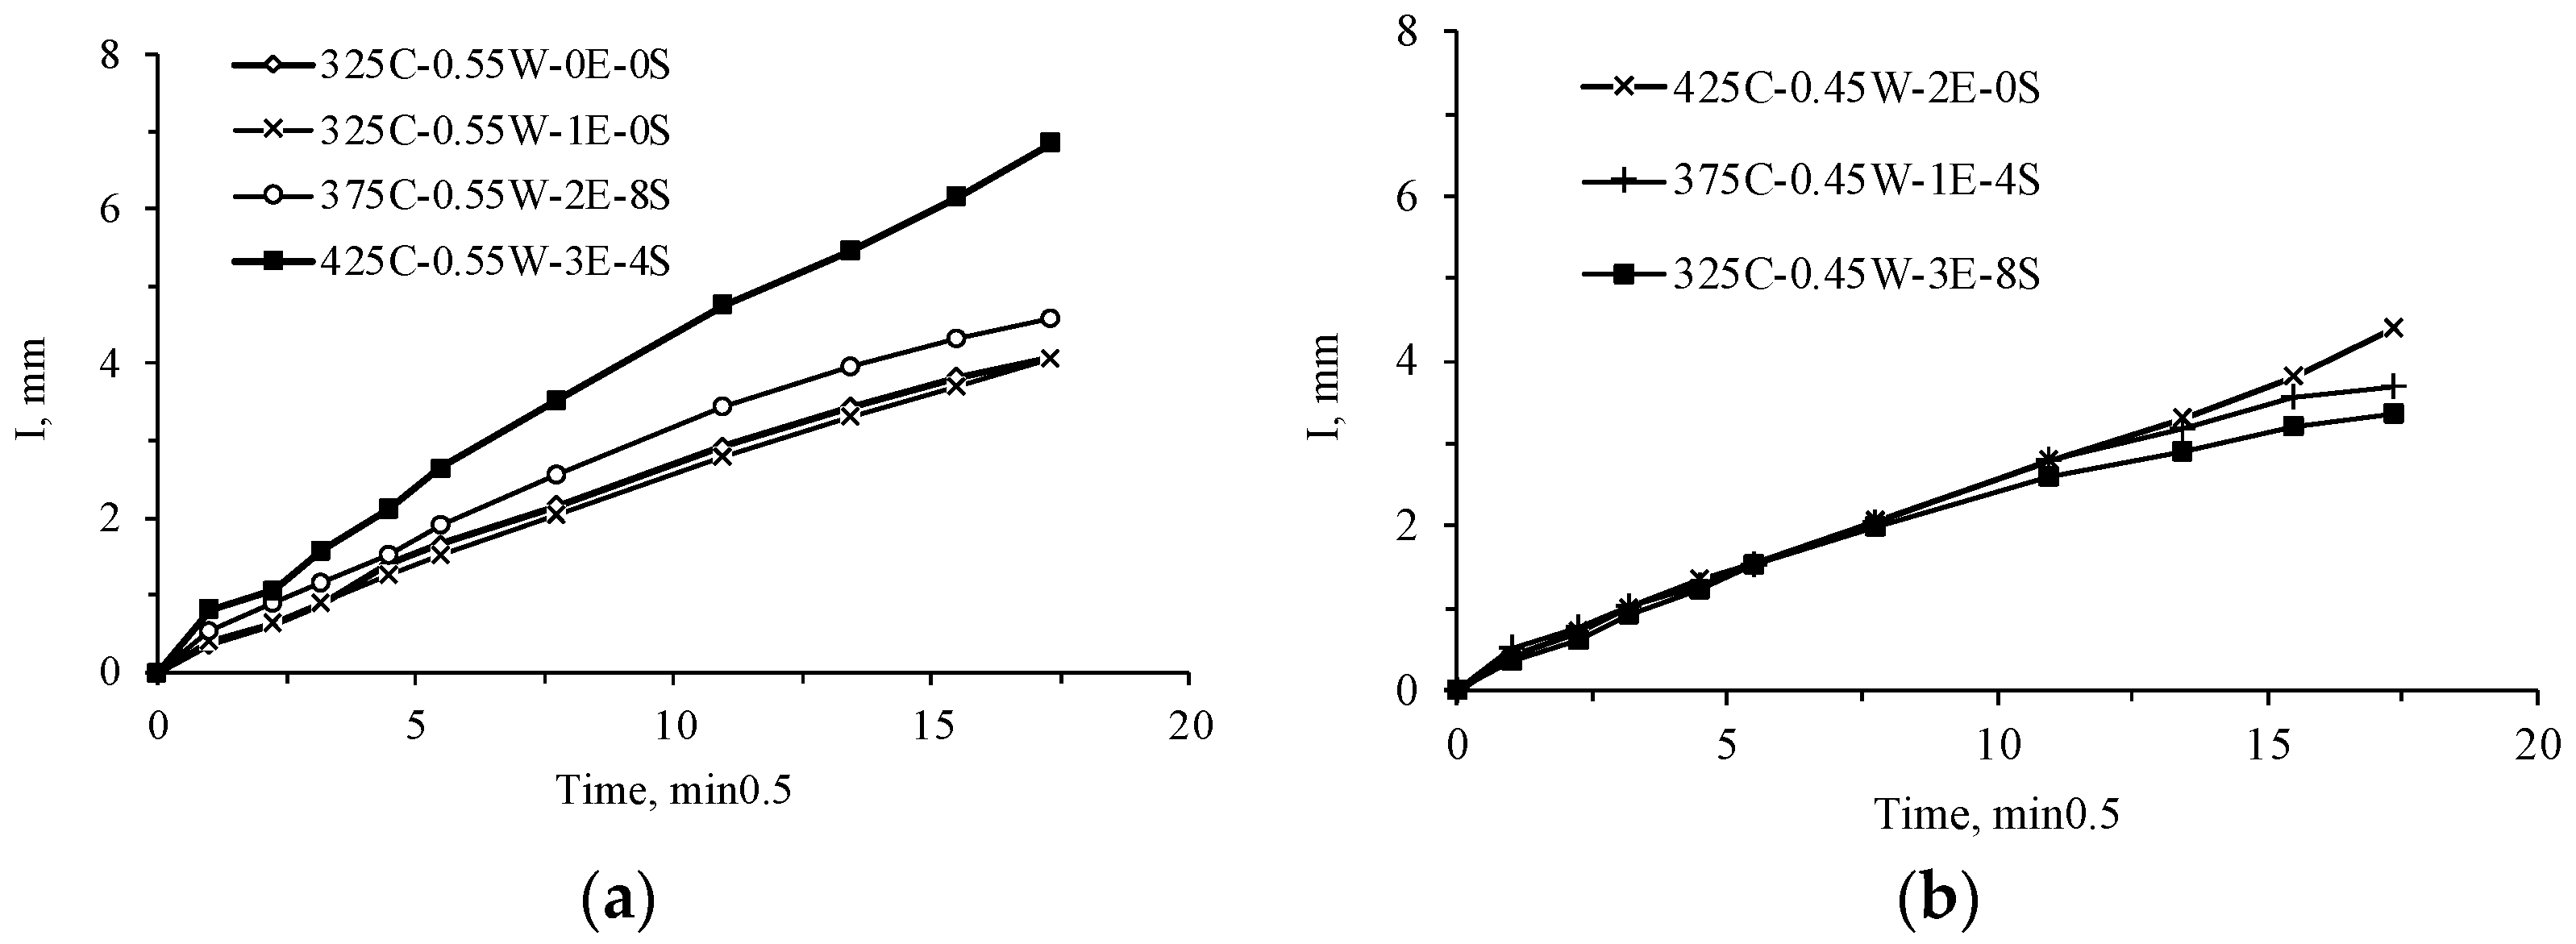
3.4. Water Absorption and Sorptivity

The Wabs variations of various concrete mixtures are illustrated in Figure 6. Generally, the use of reduced w/b and incorporation of SF led to denser structures with lower proneness to water absorption [7,25]. Hence, mixes 375C-0.45W-1E-4S, 325C-0.50W-2E-4S, and 325C-0.45W-3E-8S made with EPS additions of 1, 2, and 3 kg/m3 exhibited the lowest Wabs responses, which varied from 4.7 to 5.5%. Such results are in agreement with the hardened density and fc. In contrast, the 425C-0.55W-3E-4S mixture proportioned with 3 kg/m3 EPS content and a relatively high w/b exhibited the highest Wabs of 7.6%, revealing that the w/b is the key component to secure a refined pore structure to hinder the ease of water penetration. A moderate correlation with R2 of 0.71 can be developed between Wabs and fc, as expressed in Equation (7).
W abs = 1.1024   f c 13.4   f c + 46.07
As shown in Figure 7, the water absorption varied almost linearly over time; the sorptivity responses determined from the slopes of the regression lines are summarized in Table 3. At a similar w/b of 0.55, the sorptivity remarkably increased from 0.237 to 0.385 mm/min0.5 when 3 kg/m3 EPS was added to the mix. Such additions weaken the concrete skeleton and facilitate the ease of permeation by capillarity [12,57]. Conversely, the use of relatively low w/b yielded almost similar responses to the control mix, despite the high EPS content. Hence, for instance, the sorptivity varied from 0.237 to 0.196 mm/min0.5 for mixtures 325C-0.55W-0E-0S and 325C-0.45W-3E-8S prepared with 0 and 3 kg/m3 EPS, respectively. Additionally, the incorporation of SF in the cement matrix led to decreased sorptivity due to the densification of the concrete microstructure. In fact, the sorptivity reached a value of 0.203 mm/min0.5 for the 425C-0.50W-1E-8S mixture. A moderate correlation with R2 of 0.72 exists between the sorptivity responses and fc, as expressed in Equation (8).
Sorptivity = −0.07 fc + 0.502

3.5. Abrasion Mass Loss

Figure 8 plots the mass losses due to abrasion for typical SLC mixtures as a function of the number of revolutions, with the values recorded after 500 revolutions summarized in Table 3. In general, the incorporation of EPS beads should be coupled with reduced w/b to maintain proper resistance against abrasion; for example, the 375C-0.45W-1E-4S, 325C-0.50W-2E-4S, and 325C-0.45W-3E-8S mixtures containing 1, 2, or 3 kg/m3 EPS yielded superior abrasion resistance among each EPS addition category, varying from 18.0% to 19.6% after 500 revolutions. Conversely, mixtures prepared with higher w/b and EPS content (i.e., 425C-0.55W-3E-4S) exhibited a 38.6% mass loss. Hence, the reduction in w/b in SLC seems essential to reduce abrasion mass loss, irrespective of the EPS content, reflecting the importance of reducing the free mixing water to enhance the hardened concrete skeleton [25,40]. Additionally, the incorporation of SF enhanced the abrasion resistance; for instance, this decreased from 25.4% to 23.7% for 375C-0.55W-0E-0S and 375C-0.55W-3E-8S mixtures made with 0% and 8% SF, respectively. The results of abrasion mass loss followed a similar trend to fc, which resulted in a moderate correlation with an R2 of 0.69, as expressed in Equation (9).
Abrasion   mass   loss = 8.715   f c   78.55 ,

3.6. Multicriteria Optimization

3.6.1. TOPSIS Optimization

The Taguchi method is typically utilized to determine the best combination of proportions and assess numerous key parameters while focusing on a single performance criterion. However, in recent material engineering research, a range of cutting-edge multicriteria performance optimization techniques have been embraced to identify the optimal solution [30,31]. The TOPSIS method was chosen in this study to optimize the SLC mixtures and ensure the best output from the experimental results of mechanical and durability properties [29,32]. When dealing with multi-response optimization problems, TOPSIS is a multi-criteria decision-making technique that assesses options based on multiple criteria and then ranks them according to their similarity to the ideal solution [58]. The selected performance criteria were the SP demand, hardened density, compressive strength, splitting tensile strength, water absorption, sorptivity, and abrasion mass loss, which were denoted as C1 to C9, respectively (Table 4). The ranking (or weight) of each criterion varied from 1 to 9 based on its impact on the specific property; hence, the highest weights were assigned to density and compressive strength, whereas the other properties received lower weights.
The optimal SLC proportions were determined by evaluating the signal-to-noise ratios (S/N) and closeness coefficients of each factor, following the Taguchi-TOPSIS integration method for decision-making and optimization. More detailed steps can be found elsewhere [33]. It is important to mention that the optimal level of each factor corresponds to the “larger is better” approach. Figure 9 displays the relationship between the levels of parameters and S/N. Apparently, the binder content, EPS content, and SF replacement rate revealed a limited effect on S/N, while the effect of w/b was more significant. Such results highlight that the performance of optimum SLC mixtures relies mainly on w/b, given its direct impact on the porosity and strength development of cementitious materials. Hence, the optimum mix was found to be prepared with a binder content of 375 kg/m3, a w/b of 0.45, an EPS content of 3 kg/m3, and a SF replacement rate of 8%.

3.6.2. Analysis of Variance (ANOVA)

The contribution of each mixture parameter to a specific criterion was computed through the analysis of variance (ANOVA) to gain a deeper understanding of their effect on the mechanical and durability responses [29,32]. At a confidence interval of 95%, Table 5 summarizes the contribution of each parameter toward a specific performance criterion. Apparently, the EPS addition rate and w/b represented the key parameters of the mechanical and durability properties (i.e., density, fc, fsp, UPV, water absorption, and abrasion resistance), with a cumulative contribution greater than 65.97%. Contrary to this, the other factors attained lower contributions, varying from 3.86% to 22.99%. Such findings corroborate the experimental results presented earlier. For instance, the highest contribution to the density is the EPS content, with 68.15%. The binder content, w/b ratio, and SF replacement percentage had lower contributions of 16.09%, 10.28%, and 5.48%, respectively. Conversely, the impact of EPS content was less significant on water absorption, sorptivity, and abrasion resistance than on the mechanical properties (density, fc, and fsp) and UPV. This highlights the ability to add EPS to concrete without deteriorating its durability. On the other hand, the influence of w/b becomes more significant on the fc, fsp, UPV, water absorption, sorptivity, and abrasion resistance compared to its effect on the density. It is important to note that the SP demand was mainly influenced by the w/b, reflecting a high contribution of 85.82%. This can be directly attributed to the controlling effect of w/b on the SP demand that overshadows other parameters, including the EPS content.

3.6.3. Multivariate Regression

By developing multivariable regression models, the effect of binder content, w/b, EPS content, and SF replacement percentage on the performance criteria of SLC mixtures (i.e., SP demand, fc, fsp, UPV, water absorption, sorptivity, and abrasion mass loss) could be predicted. With different parameter boundaries, including 325 to 425 kg/m3 for binder content, 0.45 to 0.55 for w/b, 1 to 3 kg/m3 for EPS content, and 0 to 8% for SF replacement, the proposed model’s generalized form is expressed as follows:
Performance criterion = β0(Binder) + β1(w/b) + β2(EPS) + β3(SF) + β4
The coefficients utilized in the developed models are listed in Table 6. Good relationships were reflected in the predicted-to-actual responses, which demonstrated R2 values varying from 0.70 to 0.89 and standard error (SE) ranging from 0.32 to 42.3 [59,60]. It is worth noting that the positive or negative signs of the coefficients indicate the corresponding positive or negative effect on the performance criterion; for example, an increase in EPS content causes the strength and density responses to decrease, while a decrease in w/b could increase strength and density.

4. Conclusions

This study assesses the influence of different parameters on the fresh and hardened properties of SLC mixtures prepared with different EPS contents. The design of experiments was completed following the Taguchi approach, while the multi-response optimization technique (TOPSIS) was employed to determine the optimum mix parameters for best performance. Based on the foregoing, the following conclusions can be drawn:
  • The concrete density gradually decreased by 3.4% to 14.8% with EPS additions. The lowest value of 1996 kg/m3 was recorded for the mixture containing 3 kg/m3 EPS and a w/b of 0.55, which can be attributed to the lightweight nature of EPS and the increased amount of mixing water that could collectively reduce the concrete density.
  • Despite the drop in density, the strength of SLC mixtures can still be maintained by proper mixture proportioning, including the reduction of w/b and the incorporation of higher binder content, or SF. Hence, the fc, fsp, and UPV responses are comparable to the control concrete prepared without any EPS addition.
  • The reduction in w/b and incorporation of SF seem to play a determinate role in improving the SLCs durability, including its resistance against water permeation and abrasion. This was mainly attributed to reduced porosity and an enhanced interfacial transition zone between the cement paste and EPS beads. Such practices confirm the suitability of SLC mixtures for durable applications, despite the decrease in density.
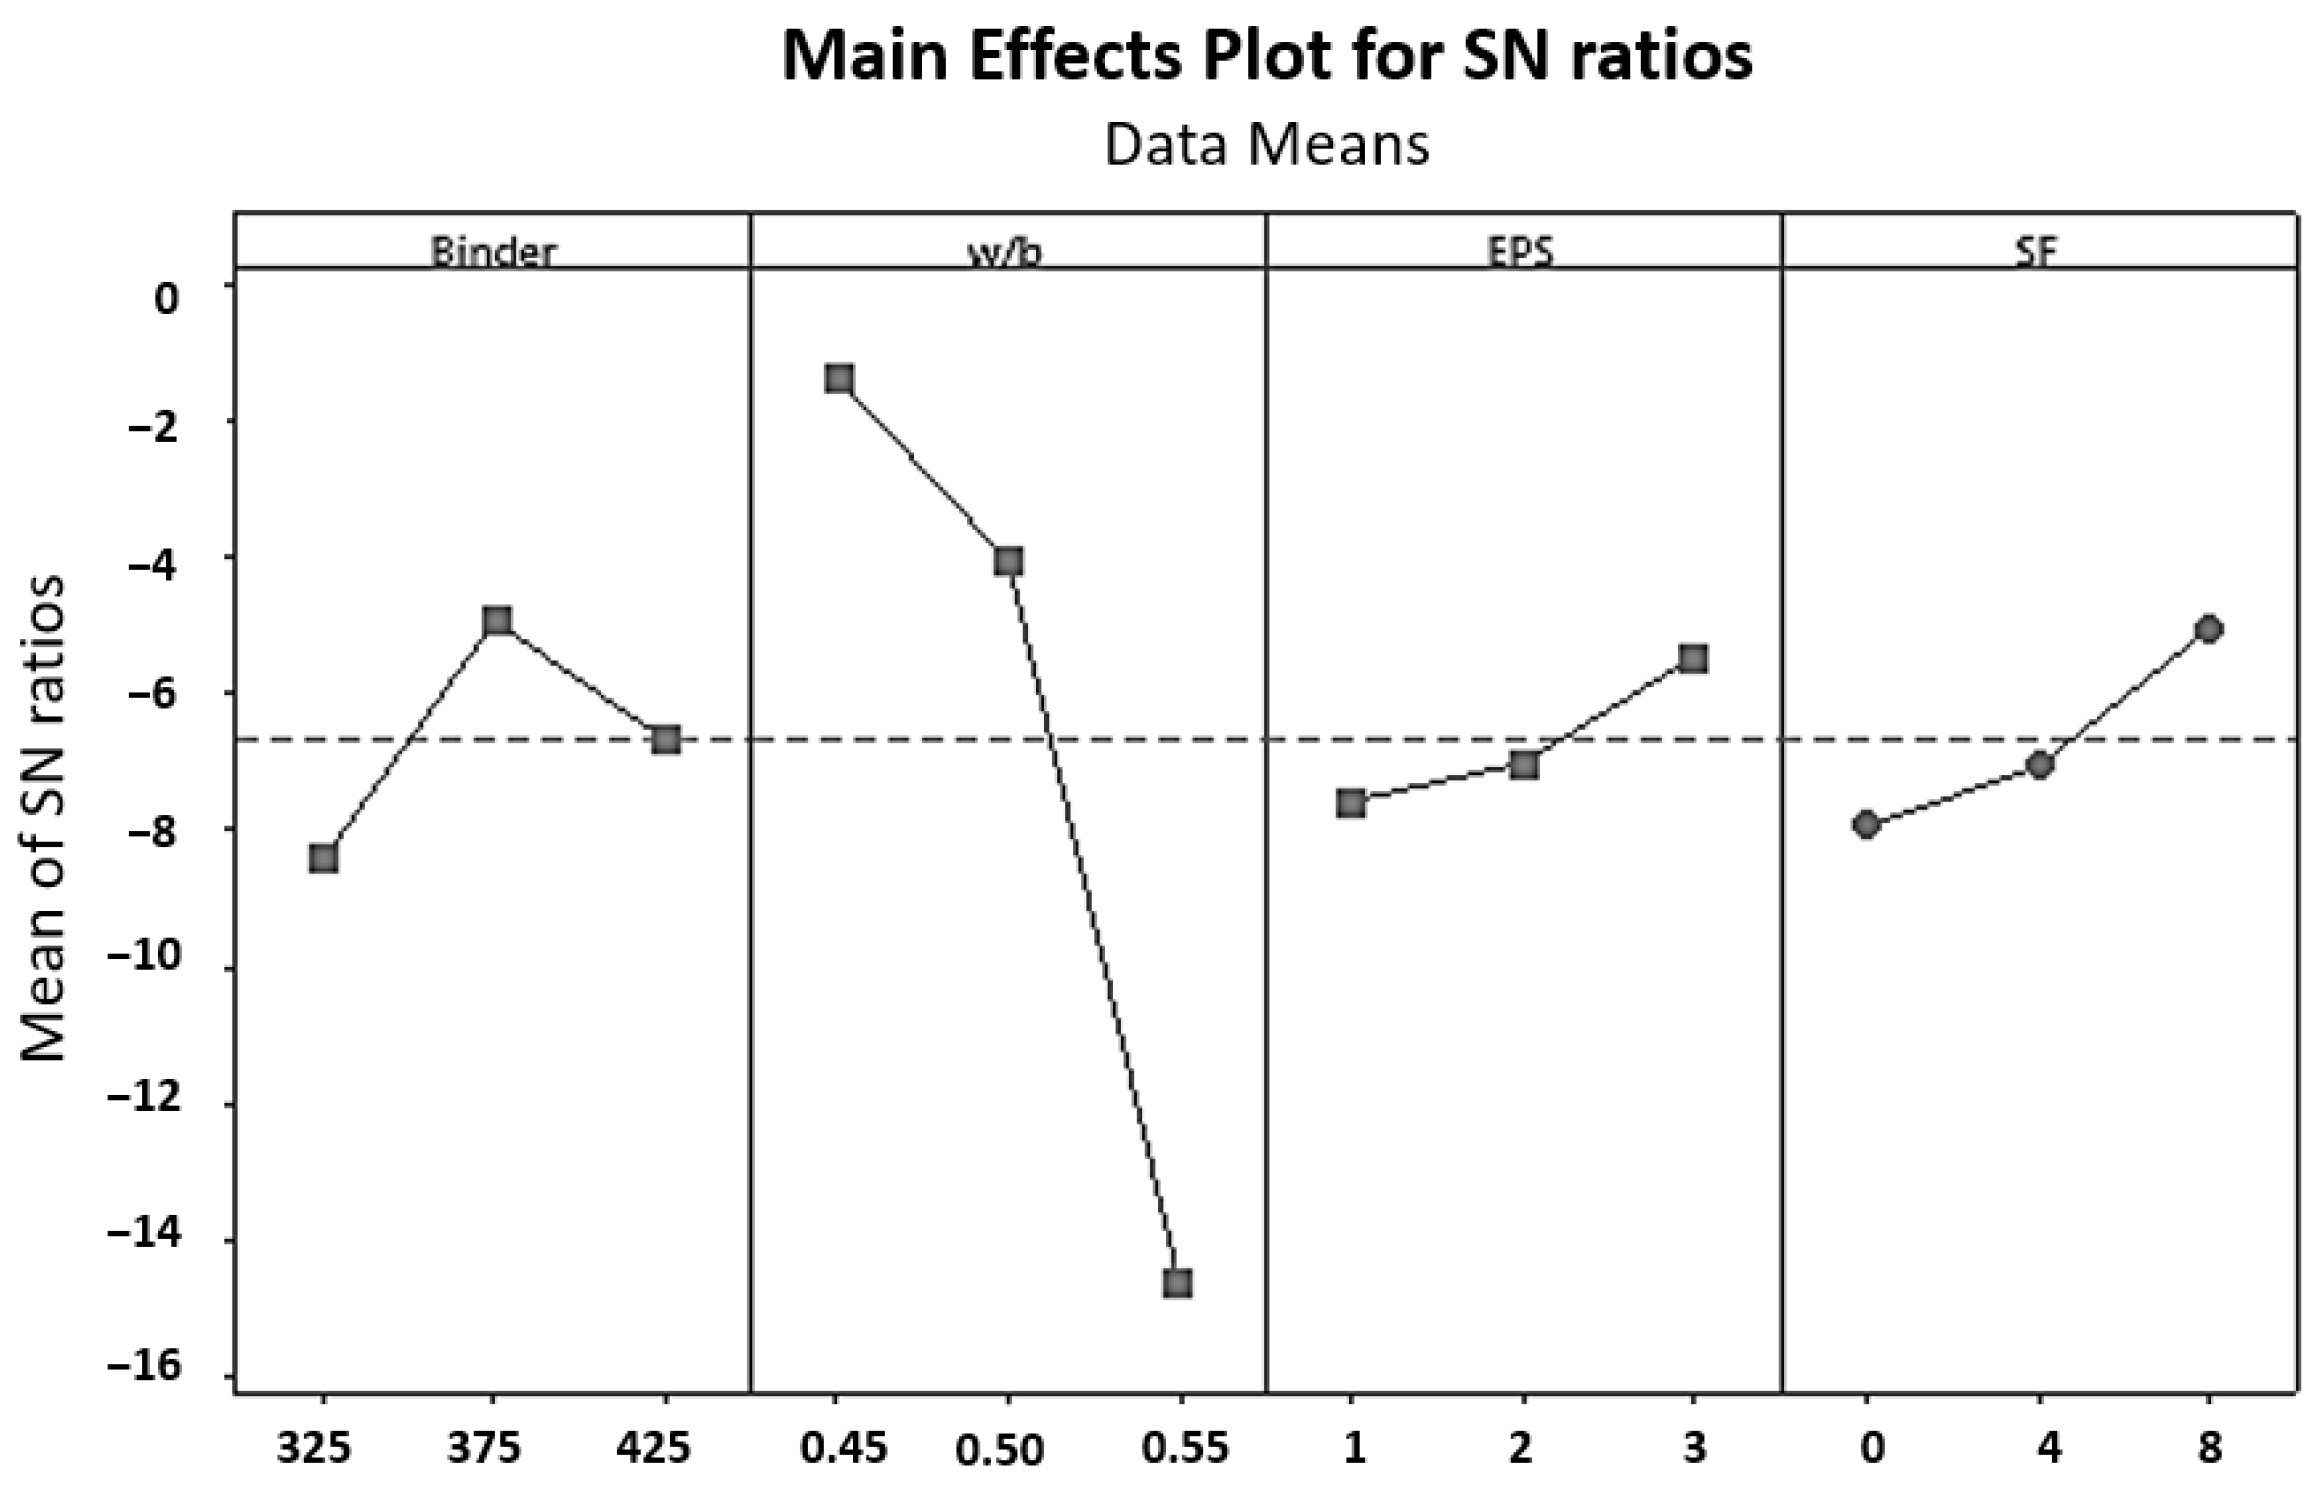
  • The ANOVA results showed that the w/b and EPS content were the controlling parameters of the mechanical and durability properties of SLC mixtures. Meanwhile, binder content and SF replacement percentages were the least influential parameters.
  • The multi-response optimization approach revealed that the optimum concrete performance can be achieved when the binder content, w/b, EPS content, and SF replacement percentages are set to 375 kg/m3, 0.45, 3 kg/m3, and 8%, respectively.
  • Predictions for the mechanical and durability properties of SLC are made using the mix design parameters through the development of multivariable regression models. The predicted-to-actual responses exhibited strong relationships, with R2 values ranging from 0.70 to 0.89.

Author Contributions

Conceptualization, A.E.-M. and J.J.A.; methodology, E.F.; software, A.E.-M.; validation, E.F., J.J.A. and H.E.-H.; formal analysis, J.J.A.; investigation, A.E.-M.; resources, E.F.; data curation, J.J.A.; writing—original draft preparation, A.E.-M.; writing—review and editing, E.F., J.J.A. and H.E.-H.; visualization, J.J.A.; supervision, A.E.-M.; project administration, A.E.-M.; funding acquisition, A.E.-M. All authors have read and agreed to the published version of the manuscript.

Funding

This research was funded by University of Balamand staff and lab personnel.

Data Availability Statement

Data may be provided by the corresponding author upon request.

Acknowledgments

The authors acknowledge the support of the University of Balamand staff and lab personnel.

Conflicts of Interest

The authors declare no conflict of interest.

Nomenclature

ACIAmerican Concrete Institute
EPSExpanded Polystyrene
SLCSemi-Lightweight Concrete
TOPSISTechnique for Order of Preference by Similarity to Ideal Solution
SFSilica Fume
w/bWater-to-Binder Ratio
S/NSignal-to-Noise Ratio
SPSuperplasticizer
UPVUltrasonic Pulse Velocity
f’cCompressive Strength
fspSplitting Tensile Strength
WabsWater Absorption

References

  1. Shi, X.; Xie, N.; Fortune, K.; Gong, J. Durability of Steel Reinforced Concrete in Chloride Environments: An Overview. Constr. Build. Mater. 2012, 30, 125–138. [Google Scholar] [CrossRef]
  2. El-Mir, A.; Assaad, J.J.; Nehme, S.G.; El-Hassan, H. Correlating Strength and Durability to Time-Temperature Profiles of High-Performance Mass Concrete. Case Stud. Constr. Mater. 2022, 16, e01055. [Google Scholar] [CrossRef]
  3. Li, C.; Li, J.; Ren, Q.; Zheng, Q.; Jiang, Z. Durability of Concrete Coupled with Life Cycle Assessment: Review and Perspective. Cem. Concr. Compos. 2023, 139, 105041. [Google Scholar] [CrossRef]
  4. Li, X.J.; Zheng, Y. Using LCA to Research Carbon Footprint for Precast Concrete Piles during the Building Construction Stage: A China Study. J. Clean. Prod. 2020, 245, 118754. [Google Scholar] [CrossRef]
  5. Li, Z.; Shen, G.Q.; Xue, X. Critical Review of the Research on the Management of Prefabricated Construction. Habitat Int. 2014, 43, 240–249. [Google Scholar] [CrossRef]
  6. Bakhshi, M.; Soheili, H.; Dalalbashi, A. Optimization of a Structural Lightweight Fiber-Reinforced Concrete for Best Performance under Impact Loading. Cem. Concr. Compos. 2023, 136, 104875. [Google Scholar] [CrossRef]
  7. Babu, D.S.; Ganesh Babu, K.; Wee, T.H. Properties of Lightweight Expanded Polystyrene Aggregate Concretes Containing Fly Ash. Cem. Concr. Res. 2005, 35, 1218–1223. [Google Scholar] [CrossRef]
  8. Prasittisopin, L.; Termkhajornkit, P.; Kim, Y.H. Review of Concrete with Expanded Polystyrene (EPS): Performance and Environmental Aspects. J. Clean. Prod. 2022, 366, 132919. [Google Scholar] [CrossRef]
  9. ACI 213R-03; Guide for Structural Lightweight-Aggregate Concrete. American Concrete Institute: Farmington Hills, MI, USA, 2003.
  10. BS En 206:2013; Concrete—Specification, Performance, Production and Conformity. BSI Standards Publication: London, UK, 2013.
  11. Allahverdi, A.; Azimi, S.A.; Alibabaie, M. Development of Multi-Strength Grade Green Lightweight Reactive Powder Concrete Using Expanded Polystyrene Beads. Constr. Build. Mater. 2018, 172, 457–467. [Google Scholar] [CrossRef]
  12. Adhikary, S.K.; Ashish, D.K.; Sharma, H.; Patel, J.; Rudžionis, Ž.; Al-Ajamee, M.; Thomas, B.S.; Khatib, J.M. Lightweight Self-Compacting Concrete: A Review. Resour. Conserv. Recycl. Adv. 2022, 15, 200107. [Google Scholar] [CrossRef]
  13. Sadrmomtazi, A.; Sobhani, J.; Mirgozar, M.A.; Najimi, M. Properties of Multi-Strength Grade EPS Concrete Containing Silica Fume and Rice Husk Ash. Constr. Build. Mater. 2012, 35, 211–219. [Google Scholar] [CrossRef]
  14. Assaad, J.; Chakar, E.; Zéhil, G.P. Testing and Modeling the Behavior of Sandwich Lightweight Panels against Wind and Seismic Loads. Eng. Struct. 2018, 175, 457–466. [Google Scholar] [CrossRef]
  15. Maghfouri, M.; Alimohammadi, V.; Gupta, R.; Saberian, M.; Azarsa, P.; Hashemi, M.; Asadi, I.; Roychand, R. Drying Shrinkage Properties of Expanded Polystyrene (EPS) Lightweight Aggregate Concrete: A Review. Case Stud. Constr. Mater. 2022, 16, e00919. [Google Scholar] [CrossRef]
  16. Pecce, M.; Ceroni, F.; Bibbò, F.A.; Acierno, S. Steel–concrete Bond Behaviour of Lightweight Concrete with Expanded Polystyrene (EPS). Mater. Struct. Constr. 2015, 48, 139–152. [Google Scholar] [CrossRef]
  17. Cui, C.; Huang, Q.; Li, D.; Quan, C.; Li, H. Stress-Strain Relationship in Axial Compression for EPS Concrete. Constr. Build. Mater. 2016, 105, 377–383. [Google Scholar] [CrossRef]
  18. Mohammed, H.J.; Aayeel, O.K. Flexural Behavior of Reinforced Concrete Beams Containing Recycled Expandable Polystyrene Particles. J. Build. Eng. 2020, 32, 101805. [Google Scholar] [CrossRef]
  19. Liu, N.; Chen, B. Experimental Study of the Influence of EPS Particle Size on the Mechanical Properties of EPS Lightweight Concrete. Constr. Build. Mater. 2014, 68, 227–232. [Google Scholar] [CrossRef]
  20. Laoubi, H.; Djoudi, A.; Dheilly, R.M.; Bederina, M.; Goullieux, A.; Quéneudéc, M. Durability of a Lightweight Construction Material Made with Dune Sand and Expanded Polystyrene. J. Adhes. Sci. Technol. 2019, 33, 2157–2179. [Google Scholar] [CrossRef]
  21. Nikbin, I.M.; Golshekan, M. The Effect of Expanded Polystyrene Synthetic Particles on the Fracture Parameters, Brittleness and Mechanical Properties of Concrete. Theor. Appl. Fract. Mech. 2018, 94, 160–172. [Google Scholar] [CrossRef]
  22. Chung, S.Y.; Abd Elrahman, M.; Stephan, D. Effects of Expanded Polystyrene (EPS) Sizes and Arrangements on the Properties of Lightweight Concrete. Mater. Struct. Constr. 2018, 51, 57. [Google Scholar] [CrossRef]
  23. Bakhshi, M.; Shahbeyk, S. Experimental and Microstructural Study of the Compressive Strength of Concrete Samples Containing Low Volumes of Expanded Polystyrene Beads. Struct. Concr. 2019, 20, 1379–1390. [Google Scholar] [CrossRef]
  24. Kachouh, N.; El-Hassan, H.; El-Maaddawy, T. Effect of Steel Fibers on the Performance of Concrete Made with Recycled Concrete Aggregates and Dune Sand. Constr. Build. Mater. 2019, 213, 348–359. [Google Scholar] [CrossRef]
  25. Assaad, J.J.; El Mir, A. Durability of Polymer-Modified Lightweight Flowable Concrete Made Using Expanded Polystyrene. Constr. Build. Mater. 2020, 249, 118764. [Google Scholar] [CrossRef]
  26. Li, C.; Miao, L.; You, Q.; Hu, S.; Fang, H. Effects of Viscosity Modifying Admixture (VMA) on Workability and Compressive Strength of Structural EPS Concrete. Constr. Build. Mater. 2018, 175, 342–350. [Google Scholar] [CrossRef]
  27. Fathi, M.; Yousefipour, A.; Hematpoury Farokhy, E. Mechanical and Physical Properties of Expanded Polystyrene Structural Concretes Containing Micro-Silica and Nano-Silica. Constr. Build. Mater. 2017, 136, 590–597. [Google Scholar] [CrossRef]
  28. Chen, B.; Liu, J.; Chen, L.Z. Experimental Study of Lightweight Expanded Polystyrene Aggregate Concrete Containing Silica Fume and Polypropylene Fibers. J. Shanghai Jiaotong Univ. 2010, 15, 129–137. [Google Scholar] [CrossRef]
  29. Şimşek, B.; Pakdil, F.; Iç, Y.T.; Güvenç, A.B. Building a Graphical User Interface for Concrete Production Processes: A Combined Application of Statistical Process Control and Design of Experiment. Arab. J. Sci. Eng. 2019, 44, 4373–4393. [Google Scholar] [CrossRef]
  30. Rashid, K.; Rehman, M.U.; de Brito, J.; Ghafoor, H. Multi-Criteria Optimization of Recycled Aggregate Concrete Mixes. J. Clean. Prod. 2020, 276, 124316. [Google Scholar] [CrossRef]
  31. Fantous, T.; Yahia, A. Effect of Viscosity and Shear Regime on Stability of the Air-Void System in Self-Consolidating Concrete Using Taguchi Method. Cem. Concr. Compos. 2020, 112. [Google Scholar] [CrossRef]
  32. El-Mir, A.; Hwalla, J.; El-Hassan, H.; Assaad, J.J.; El-Dieb, A.; Shehab, E. Valorization of Waste Perlite Powder in Geopolymer Composites. Constr. Build. Mater. 2023, 368, 130491. [Google Scholar] [CrossRef]
  33. Korucu, H.; Şimşek, B.; Yartaşı, A. A TOPSIS-Based Taguchi Design to Investigate Optimum Mixture Proportions of Graphene Oxide Powder Synthesized by Hummers Method. Arab. J. Sci. Eng. 2018, 43, 6033–6055. [Google Scholar] [CrossRef]
  34. ASTM C150/C150M-19; Standard Specification for Portland Cement. ASTM International: West Conshohocken, PA, USA, 2019.
  35. ASTM C1240-20; Standard Specification for Silica Fume Used in Cementitious Mixtures. ASTM International: West Conshohocken, PA, USA, 2020.
  36. ASTM C33/C33M-16; Standard Specification for Concrete Aggregates. ASTM International: West Conshohocken, PA, USA, 2016.
  37. ASTM C165-23; Standard Test Method for Measuring Compressive Properties of Thermal Insulations. ASTM International: West Conshohocken, PA, USA, 2023.
  38. ASTM C494/C494M-19; Standard Specification for Chemical Admixtures for Concrete. ASTM International: West Conshohocken, PA, USA, 2019.
  39. Sharifi, E.; Sadjadi, S.J.; Aliha, M.R.M.; Moniri, A. Optimization of High-Strength Self-Consolidating Concrete Mix Design Using an Improved Taguchi Optimization Method. Constr. Build. Mater. 2020, 236, 117547. [Google Scholar] [CrossRef]
  40. Siddique, R. Utilization of Silica Fume in Concrete: Review of Hardened Properties. Resour. Conserv. Recycl. 2011, 55, 923–932. [Google Scholar] [CrossRef]
  41. El-Mir, A.; Nehme, S.; Assaad, J.J. Feasibility of Concrete Mixtures Containing Coarse and/or Fine Recycled Brick Aggregates. Mag. Civ. Eng. 2022, 116, 11603. [Google Scholar] [CrossRef]
  42. ASTM C143/C143M-20; Standard Test Method for Slump of Hydraulic-Cement Concrete. ASTM International: West Conshohocken, PA, USA, 2020.
  43. ASTM C39/C39M-03; Standard Test Method for Compressive Strength of Cylindrical Concrete Specimens. ASTM International: West Conshohocken, PA, USA, 2003.
  44. ASTM C496/C496M-17; Standard Test Method for Splitting Tensile Strength of Cylindrical Concrete Specimens. ASTM International: West Conshohocken, PA, USA, 2017.
  45. ASTM C138/C138M-01a; Standard Test Method for Density (Unit Weight), Yield, and Air Content (Gravimetric) of Concrete. ASTM International: West Conshohocken, PA, USA, 2001.
  46. ASTM C597-22; Standard Test Method for Ultrasonic Pulse Velocity through Concrete. ASTM International: West Conshohocken, PA, USA, 2022.
  47. ASTM C642-13; Standard Test Method for Density, Absorption, and Voids in Hardened Concrete. ASTM International: West Conshohocken, PA, USA, 2013.
  48. ASTM C1585-20; Standard Test Method for Measurement of Rate of Absorption of Water by Hydraulic-Cement Concretes. ASTM International: West Conshohocken, PA, USA, 2020.
  49. ASTM C1747/C1747M-11; Standard Test Method for Determining Potential Resistance to Degradation of Pervious Concrete by Impact and Abrasion. ASTM International: West Conshohocken, PA, USA, 2011.
  50. El-Mir, A.; Nehme, S.G.; Assaad, J.J. Effect of Binder Content and Sand Type on Mechanical Characteristics of Ultra-High Performance Concrete. Arab. J. Sci. Eng. 2022, 47, 13021–13034. [Google Scholar] [CrossRef]
  51. Madandoust, R.; Ranjbar, M.M.; Yasin Mousavi, S. An Investigation on the Fresh Properties of Self-Compacted Lightweight Concrete Containing Expanded Polystyrene. Constr. Build. Mater. 2011, 25, 3721–3731. [Google Scholar] [CrossRef]
  52. Assaad, J.J. Influence of Recycled Aggregates on Dynamic/static Stability of Self-Consolidating Concrete. J. Sustain. Cem. Mater. 2017, 6, 345–365. [Google Scholar] [CrossRef]
  53. El Mir, A.; Nehme, S.G. Utilization of Industrial Waste Perlite Powder in Self-Compacting Concrete. J. Clean. Prod. 2017, 156, 507–517. [Google Scholar] [CrossRef]
  54. Boquera, L.; Castro, J.R.; Fernandez, A.G.; Navarro, A.; Laura, A.; Cabeza, L.F. Thermo-Mechanical Stability of Concrete Containing Steel Slag as Aggregate after High Temperature Thermal Cycles. Sol. Energy 2022, 239, 59–73. [Google Scholar] [CrossRef]
  55. Saint-Pierre, F.; Philibert, A.; Giroux, B.; Rivard, P. Concrete Quality Designation Based on Ultrasonic Pulse Velocity. Constr. Build. Mater. 2016, 125, 1022–1027. [Google Scholar] [CrossRef]
  56. Nogueira, C.L.; Rens, K.L. Ultrasonic Wave Propagation in EPS Lightweight Concrete and Effective Elastic Properties. Constr. Build. Mater. 2018, 184, 634–642. [Google Scholar] [CrossRef]
  57. Assaad, J.J.; Mikhael, C.; Hanna, R. Recycling of Waste Expanded Polystyrene Concrete in Lightweight Sandwich Panels and Structural Applications. Clean. Mater. 2022, 4, 100095. [Google Scholar] [CrossRef]
  58. Chokkalingam, P.; El-Hassan, H.; El-Dieb, A.; El-Mir, A. Multi-Response Optimization of Ceramic Waste Geopolymer Concrete Using BWM and TOPSISbased Taguchi Methods. J. Mater. Res. Technol. 2022, 21, 4824–4845. [Google Scholar] [CrossRef]
  59. Amlashi, A.T.; Abdollahi, S.M.; Goodarzi, S.; Ghanizadeh, A.R. Soft Computing Based Formulations for Slump, Compressive Strength, and Elastic Modulus of Bentonite Plastic Concrete. J. Clean. Prod. 2019, 230, 1197–1216. [Google Scholar] [CrossRef]
  60. Revilla-Cuesta, V.; Skaf, M.; Serrano-López, R.; Ortega-López, V. Models for Compressive Strength Estimation through Non-Destructive Testing of Highly Self-Compacting Concrete Containing Recycled Concrete Aggregate and Slag-Based Binder. Constr. Build. Mater. 2021, 280. [Google Scholar] [CrossRef]
Figure 1. Variations of SP demand for different SLC mixtures.
Sustainability 15 08757 g001
Figure 2. Effect of EPS content on density and compressive strength.
Sustainability 15 08757 g002
Figure 3. Effect of EPS content on splitting tensile strength.
Sustainability 15 08757 g003
Figure 4. Photos of split cylindrical specimens made with different EPS contents.
Sustainability 15 08757 g004
Figure 5. Effect of EPS content on the ultrasonic pulse velocity measurements.
Sustainability 15 08757 g005
Figure 6. Effect of EPS content on Wabs of SLC mixtures.
Sustainability 15 08757 g006
Figure 7. Effect of EPS on sorptivity of SLC made with 0.55 w/b (a) and (b) 0.45 w/b.
Sustainability 15 08757 g007
Figure 8. Effect of EPS content on abrasion mass loss of SLC mixtures made with (a) 0.55 w/b and (b) 0.45 w/b.
Sustainability 15 08757 g008
Figure 9. Effect of control parameters on the mean S/N ratio of TOPSIS.
Sustainability 15 08757 g009
Table 1. Parameters and levels selected for developing the SLC mixtures.
Parameter, PLevel 1Level 2Level 3
P1: Binder content, kg/m3325375425
P2: water-to-binder ratio (w/b)0.550.500.45
P3: EPS content, kg/m3123
P4: SF replacement rate, %048
Table 2. Proportions of investigated SLC mixtures.
Mix No.Mix
Codification *
Binder
Content, kg/m3
w/bEPS Content, kg/m3SF Replacement
Rate, %
1325C-0.55W-1E-0S3250.5510
2325C-0.50W-2E-4S3250.5024
3325C-0.45W-3E-8S3250.4538
4375C-0.55W-2E-8S3750.5528
5375C-0.50W-3E-0S 3750.5030
6375C-0.45W-1E-4S3750.4514
7425C-0.55W-3E-4S 4250.5534
8425C-0.50W-1E-8S 4250.5018
9425C-0.45W-2E-0S 4250.4520
10325C-0.55W-0E-0S 3250.5500
* Binder content (kg/m3)—w/b—EPS content (kg/m3)—SF replacement percentage (%).
Table 3. SP demand, density, and mechanical properties for SLC mixtures.
Mix
Codification
SP,
%
Density, kg/m3fc, MPafsp,
MPa
UPV, m/sWabs,
%
Sorptivity, mm/min 0.5Abrasion Mass Loss, %
325C-0.55W-1E-0S0.51222936.23.7042645.80.23229.9
325C-0.50W-2E-4S1.03224539.23.7443574.90.19619.4
325C-0.45W-3E-8S2.36218138.63.7342804.80.19519.7
375C-0.55W-2E-8S0.74222441.13.5743016.10.26423.7
375C-0.50W-3E-0S1.71207429.62.7240206.00.26330.5
375C-0.45W-1E-4S2.06226243.34.0843475.60.21218.0
425C-0.55W-3E-4S0.71199621.22.2138907.60.38538.7
425C-0.50W-1E-8S1.47221842.03.5843296.00.20328.4
425C-0.45W-2E-0S1.52219840.33.8843195.20.24022.4
325C-0.55W-0E-0S0.85234340.13.7644154.80.23725.5
Table 4. Contribution of parameters towards different SLC properties.
Performance CriterionCodeS/N Target ValueWeights (w)Normalized w
SP demandC1Larger is better80.131
DensityC2Smaller is better90.148
fcC3Larger is better90.148
fspC4Larger is better50.082
UPVC5Larger is better60.098
Water absorptionC6Smaller is better80.131
SorptivityC7Smaller is better80.131
Abrasion mass lossC8Smaller is better80.131
Table 5. Contribution percentage of parameters towards different mechanical properties.
Performance CriterionBinder Content (%)w/b (%)EPS Content (%)SF (%)
SP demand4.285.86.33.5
Density16.010.268.15.4
fc8.623.152.415.7
fsp14.227.451.96.3
UPV10.618.660.510.1
Water absorption12.149.734.23.8
Sorptivity22.943.022.811.0
Abrasion mass loss21.749.621.07.6
Table 6. Regression models for predicting the SLC properties.
Propertiesβ0
(Binder)
β1
(w/b)
β2
(EPS)
β3
(SF)
β4
(Intercept)
SER2
SP demand−0.00147−12.5130.04680.02467.980.330.84
Density−0.83806−611.615−79.4524.6732942.0642.300.89
fc−0.03086−83.139−4.9840.69397.084.060.80
fsp−0.00443−7.9414−0.39250.031359.73840.3200.70
UPV−1.214−1631.71−125.4912.7295705.81394.010.81
Water absorption0.011912.350.28220.0134−5.5550.510.80
Sorptivity0.057948.6882.196−0.2623−26.8582.620.80
Abrasion mass loss0.068107.142.09−0.4578−56.0204.380.79
Disclaimer/Publisher’s Note: The statements, opinions and data contained in all publications are solely those of the individual author(s) and contributor(s) and not of MDPI and/or the editor(s). MDPI and/or the editor(s) disclaim responsibility for any injury to people or property resulting from any ideas, methods, instructions or products referred to in the content.

