Article

Measurement Indicators and an Evaluation Approach for Assessing the Sustainable Development Capacity of Tropical Agriculture: A Case Study for Hainan Province, China

1
International Research Center of Big Data for Sustainable Development Goals, Beijing 100094, China
2
Key Laboratory of Digital Earth Science, Aerospace Information Research Institute, Chinese Academy of Sciences, Beijing 100094, China
3
State Key Laboratory of Remote Sensing Science, Aerospace Information Research Institute, Chinese Academy of Sciences, Beijing 100094, China
4
Key Laboratory of Earth Observation of Hainan Province, Hainan Aerospace Information Research Institute, Sanya 572029, China
5
Cultivated Land Quality Monitoring and Protection Center, Ministry of Agriculture and Rural Affairs, Beijing 100125, China
6
School of Forestry, Hainan University, Haikou 570228, China
7
Hainan State Farms Design Institute Co., Ltd., Haikou 570226, China
*
Author to whom correspondence should be addressed.
Sustainability 2023, 15(11), 8778; https://doi.org/10.3390/su15118778
Submission received: 13 April 2023 / Revised: 18 May 2023 / Accepted: 25 May 2023 / Published: 29 May 2023

Abstract

:
Agriculture is increasingly facing major challenges, such as climate change, the scarcity of natural resources, environmental degradation, labor shortages, and changing societal demands. To meet these challenges, there is an urgent need to move towards more sustainable agricultural practices. The aim of this research was to construct the evaluation index system for the sustainable development of tropical agriculture and evaluate the sustainable development level of tropical agriculture in China’s Hainan Province from 1988 to 2020. Eighteen indicators were selected from the four aspects of agricultural resources, the ecological environment, economic conditions, and social conditions to establish an evaluation index system for the sustainable development of tropical agriculture. A combination of the Coefficient of Variation Method (CVM) and the Index Weighted Method (IWM) was applied to evaluate the comprehensive index of the sustainable development of tropical agriculture. The results of our research indicate that there were significant differences in the level of sustainable agricultural development in Hainan in 2020 across counties and cities, with a downward trend from the central mountainous areas to the surrounding coastal areas. The cities and counties of Wuzhishan, Lingshui, and Qiongzhong had a high level of sustainable development, while Sanya, Dongfang, Wenchang, Qionghai, Ding’an, Danzhou, and Haikou had a low level. From 1988 to 2020, the sustainable development level of tropical agriculture in the province gradually improved, with the highest improvement value of the sustainability index (SI) in Wuzhishan, Wanning, Chengmai, Linggao, and Lingshui and the lowest improvement value of the SI in Baisha, Haikou, and Sanya. Indicators such as the use of agricultural mechanization, construction of farmland infrastructure, improvement of crop productivity, investment in science and technology, and investment in agricultural insurance played a positive role in promoting sustainable development. However, the high use of fertilizers, pesticides, and agricultural films per unit area and the increase in agricultural input prices were not conducive to the sustainable development of tropical agriculture. It is suggested to strengthen the construction and protection of farmland quality, improve the farmland ecological environment, promote agricultural scientific and technological innovation, and formulate feasible policies for the sustainable development of tropical agriculture. The results provide a basic theoretical and methodological reference for achieving Hainan’s sustainable development goals and for assessing the sustainable development capacity of tropical agriculture in similar regions.

1. Introduction

Agriculture is a main economic activity, both as a source of food and as a raw material for industry. Since the industrial revolution, people’s living standards have been greatly improved by large-scale urban construction, mineral resource exploitation, arable land development, forest exploitation, etc. However, in the meantime, due to the excessive consumption of natural resources, such as land, water, and energy, a number of environmental problems have become increasingly prominent, such as environmental pollution, land degradation, soil loss, and global warming [1,2,3]. This has led to extensive reflection on the interaction between economic growth and the environment. In 1987, the World Commission on Environment and Development (WCED) issued the report Our Common Future, which, for the first time, introduced the idea of “sustainable development” and defined it as “development that meets the needs of the present without compromising the ability of future generations to meet their own needs” [4]. In 1992, the United Nations Conference on Environment and Development (UNCED) was held in Rio, resulting in the Rio Declaration and Agenda 21, which reaffirmed the importance of sustainable development [5]. Since then, the concept of sustainable development has been rapidly popularized and recognized around the world. In 2015, the United Nations Summit on Sustainable Development adopted Transforming Our World: the 2030 Agenda for Sustainable Development, with 17 Sustainable Development Goals (SDGs) and 169 targets, marking that sustainable development has entered a new stage of development [6]. Some indicators among the 17 SDGs can be valuable for measuring and evaluating sustainability in agriculture, including land, water resources, climate conditions, and sustainable production and consumption [7].
China is a populous country where food and agricultural production are of the utmost importance for the survival and development of the nation. Tropical areas have high temperatures and rainfall, long summers, no winters throughout the year, and abundant water and heat resources, making them very suitable for developing high-efficiency tropical agriculture. In China, the tropical areas account for 5.6% of the country’s land area, providing about 70% of the country’s winter melons and vegetables [8]. Hainan is China’s largest special economic zone and the only tropical island province, covering an area of 33,920 km2 and accounting for 42.5% of the country’s tropical land area [9]. Here, the crops’ growing season lasts for 9.5 months, or even the whole year, so the rice can be harvested three times a year, maize three to five times a year, and vegetables three to five times a year [8]. However, Hainan’s agricultural production has generally faced some problems, such as the excessive use of chemical fertilizers and pesticides, a high detection rate of pesticide residues in agricultural products, and insufficient investment in agricultural science and technology. These have led to the lagging development of the agricultural industry, the backwardness of the rural economy, and the low income of farmers, which also seriously hinder the sustainable development of tropical agriculture [10]. Therefore, there is an urgent need to change the agricultural development model to realize the transformation of the current agriculture with high resource consumption and high environmental costs into sustainable tropical agriculture with high productivity, high resource-use efficiency, and low environmental impact [11]. In 2018, the Chinese government proposed that Hainan should build a free-trade port and emphasized that it should make full use of its tropical climate advantages, strengthen and optimize its tropical characteristics and efficient agriculture, and build a national base for modern tropical agriculture [12]. It was also emphasized that Hainan should pay attention to the protection of the ecological environment while developing its economy, which is, in fact, to achieve sustainable development.
In recent years, many scholars have conducted in-depth research on the assessment of sustainable agricultural development in different countries and regions by constructing different models [13]. Since the early 1990s, the Pressure–State–Response (PSR) framework has been developed by the Organization for Economic Cooperation and Development (OECD) and the United Nations Environment Program (UNEP) to study environmental issues [14,15]. Subsequently, the United Nations Commission on Sustainable Development (UNCSD) modified the PSR framework and named it the Driving Force–State–Response (DSR) [16], which was then widely used in agriculture, water resources, tourism, and many other industries [17]. Based on these frameworks, some scholars constructed an agroecosystem health model using 12 indicators from four aspects, including sound structure, stable function, safe service, and sustainable development, for conducting an agroecosystem health assessment [18]. At the farm level, some studies have also used the Initiative for Sustainable Productive Agriculture (INSPIA) model to assess the sustainability of agriculture from social, economic, and environmental perspectives [19,20]. Furthermore, the agro-environmental sources, socio-economic systems, input systems, and various farming systems were also considered in terms of agricultural sustainability [21,22]. Moreover, regional sustainability was assessed using four separate subsystems of the regional population, resources, environment, and socio-economics [23,24]. All of the above existing studies have indicated the importance and complexity of assessing the sustainable development capacity of agriculture, which includes all aspects of the economy, resources, environment, and society [13].
Currently, there is limited research on the comprehensive assessment of sustainable development in tropical agriculture. The objectives of this study were: (1) to construct the evaluation index system for the sustainable development of tropical agriculture from four dimensions of agricultural resources, the ecological environment, economic conditions, and social conditions; (2) to evaluate the sustainable development level of tropical agriculture in China’s Hainan Province from 1988 to 2020; (3) to analyze its main influencing factors and to propose measures and suggestions to promote the sustainable development of tropical agriculture. The research results will provide a scientific basis for the realization of SDGs in Hainan.

2. Materials and Methods

2.1. Study Area

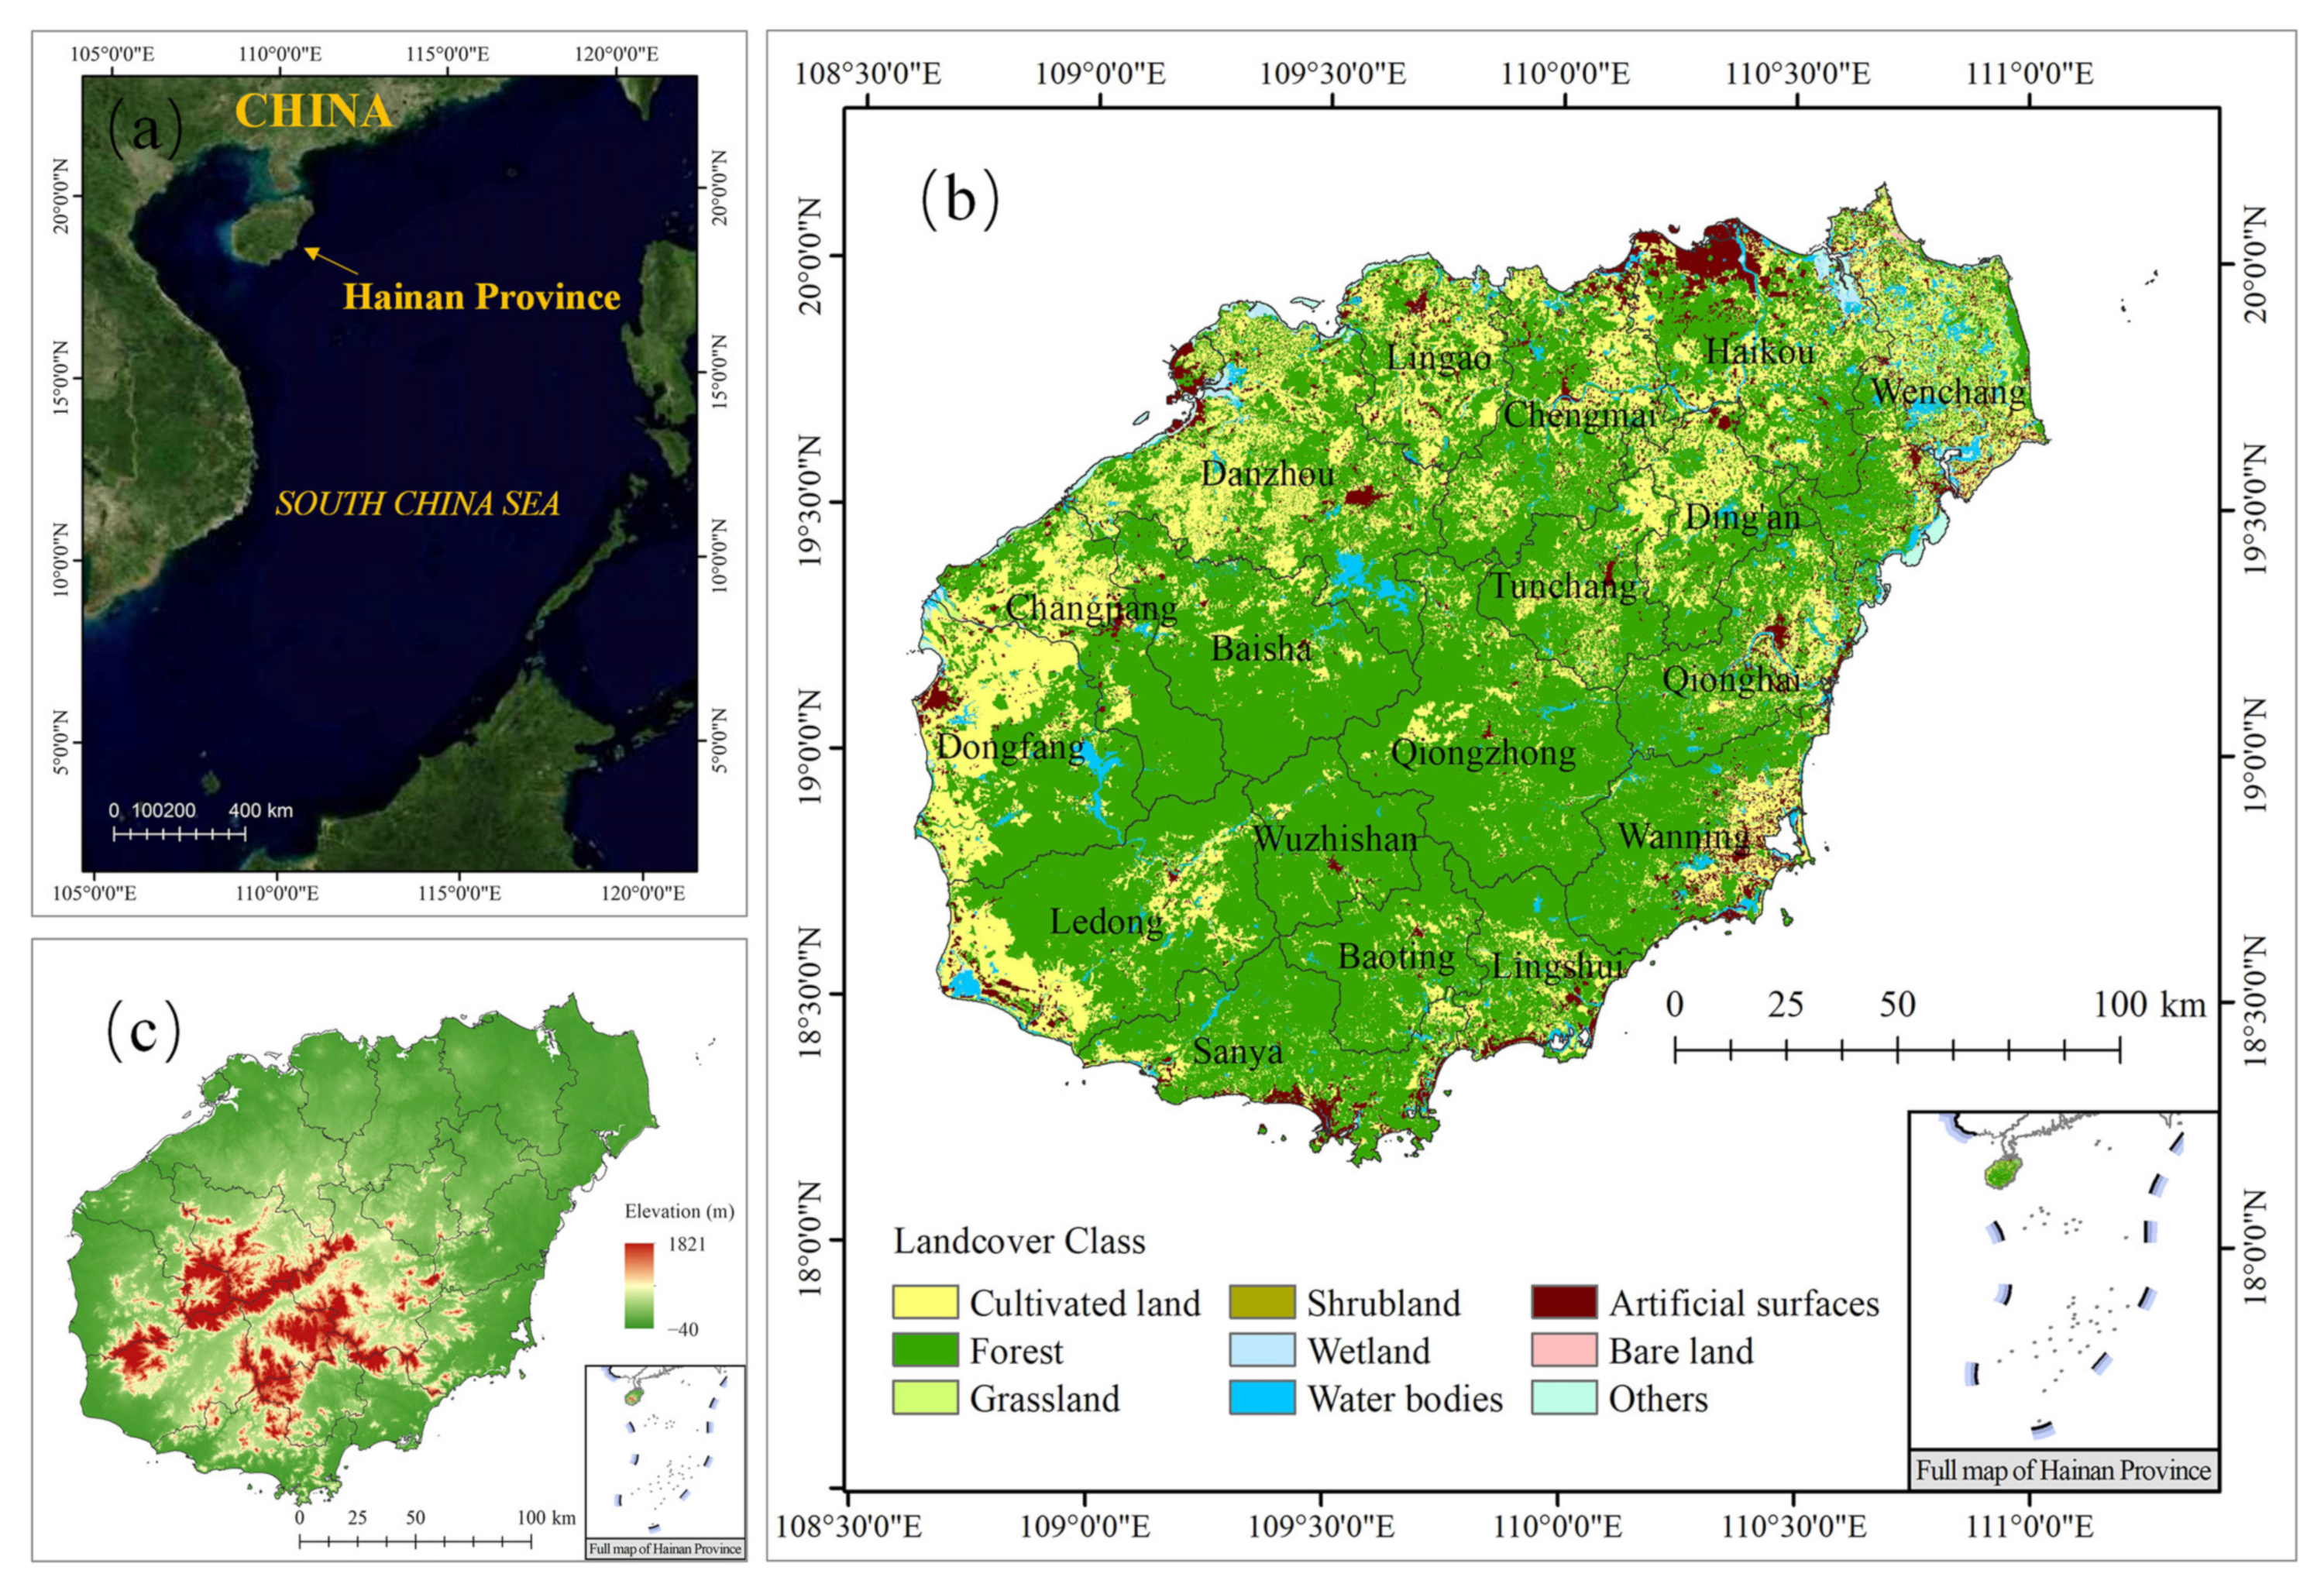
The study area was the Hainan Province of China, which is China’s largest special economic zone and largest pilot free-trade zone. Hainan Province is located in the southernmost part of China (18°10′–20°18′ N, 108°37′–111°03′ E) and covers a land area of 3.54 × 10⁴ km2 (Figure 1). The administrative area of Hainan Province includes the islands and reefs of Hainan Island, the Paracel Islands, the Zhongsha Islands, and the Nansha Islands and their sea areas. It is the largest tropical province in China, accounting for 42.5% of the country’s tropical land area [25]. The climate in this region is tropical monsoon with an average annual rainfall of 1600–2500 mm and an average annual temperature of 23–25 °C [26]. Situated on the same latitude as Hawaii in the USA, Hainan is the wettest place in the world at this latitude. The region is blessed with abundant sunshine and warmth, creating a spring-like climate throughout the year. Tropical crops, such as rice, sugarcane, palm oil, cinnamon, sisal, betel nuts, coffee, tea, sweet potatoes, peanuts, and tobacco, thrive all year round. It is also renowned for the sheer variety of its tropical fruits, including coconut, jackfruit, pineapple, mango, lychee, longan, banana, rambutan, durian, olives, guava fruit, wampee, and Chinese gooseberry. These rich tropical agricultural resources make the tropical agriculture industry the core industry for Hainan Province’s economic development, with its total agricultural output accounting for 20% of the province’s total output, far exceeding the national average level [27]. In recent years, Hainan has been vigorously developing high-efficiency tropical agriculture to maximize the comprehensive benefits of agriculture, striving to build a national winter vegetable basket base, tropical fruit base, and seed breeding base. Therefore, the quantitative assessment of Hainan’s sustainable agricultural development capability will be conducive to the effective implementation of the sustainable agricultural development strategy.

2.2. Evaluation Index System for the Sustainable Development Level of Tropical Agriculture

Based on the theoretical framework of the sustainable development of agroecosystems and the United Nations Sustainable Development Goals (SDGs), this study selected 18 indicators from the four aspects of agricultural resources, the ecological environment, economic conditions, and social conditions to build an index system to evaluate the sustainable development level of the tropical agriculture in Hainan (Table 1). Accordingly, the evaluation system correspondingly includes four subsystems: a resource subsystem, an environmental subsystem, an economic subsystem, and a social subsystem.
(1)
Resource subsystem. As the main raw materials of agricultural production, agricultural resources are the basic natural resources that support and guarantee the ability of agricultural ecosystem development. Land resources and water resources have been irreplaceably important resources for agricultural activities since ancient times. However, the development of urbanization and industrialization has led to a continuous reduction in the area under cultivation. Multi-cropping improves grain yield to a certain extent and alleviates the contradiction between food security and economic development in Hainan. The level of agricultural mechanization is an important measure of the degree of agricultural modernization. Therefore, the per capita area of tropical agricultural land (C1), the multiple cropping index of cultivated land (C2), agricultural machinery power (C3), and the proportion of effectively irrigated areas of cultivated land (C4) were selected as indicators of the resource subsystem in this study.
(2)
Environmental subsystem. The protection of the agroecological environment is the fundamental basis for sustainable agricultural production. The use of chemical fertilizers, pesticides, and agricultural films not only increases crop yields but also causes agricultural non-point source pollution, which to some extent, hinders the sustainable development of agriculture. Increasing forest coverage can improve the ability of the agroecosystem to conserve water and soil and regulate the climate, especially in Hainan, where frequent typhoons are frequent. In addition, Hainan suffers from frequent tropical disasters, including droughts and typhoons, which have caused huge losses to agricultural production. Therefore, in this study, pesticide use intensity (C5), chemical fertilizer use intensity (C6), agricultural film use intensity (C7), forest coverage (C8), the proportion of the area of cultivated land to ensure stable yields in drought and waterlogging (C9), and the proportion of the disaster area of tropical agricultural land (C10) were selected as indicators of the environmental system.
(3)
Economic subsystem. Agricultural economic conditions are the support and guarantee of sustainable agricultural development, which can affect the sustainable development of the agricultural system by acting on the agricultural resource ecosystem and the social system. The most direct agricultural economic conditions, namely the agricultural output value and crop productivity, can directly reflect the economic benefits of the agricultural system. In addition to their own economic benefits, but also need to consider the price of agricultural means of production and rural consumer price fluctuations. The price index of agricultural means of production is a relative number that reflects the trend and degree of the price change of agricultural means of production in a given period. The rural consumer price index is a relative number that reflects the trend and degree of the price change of consumer goods and services purchased by rural households. These fluctuations have an impact on the psychology of the population. Therefore, the index of the total agricultural output value (C11), the average yield of tropical fruits and vegetables (C12), the price index of agricultural means of production (C13), and the rural consumer price index (C14) were selected as indicators of the economic system in this study.
(4)
Social subsystem. The harmony and stability of rural society are the prerequisite for ensuring the sustainable development of local agriculture and also the powerful embodiment of rural development. With the continuous acceleration of the modern urbanization process, the rural population structure has changed significantly. Many farmers have turned to part-time work and part-time farming or completely abandoned farming altogether, affecting the development of agriculture. Scientific and technological innovation can greatly improve the efficiency and precision of agriculture and is the core driving force and fundamental way to achieve sustainable agricultural development. The input of agricultural insurance can compensate for the losses caused by agricultural risks to a certain extent so as to stabilize the income of agricultural producers, expand the scale of ecological agricultural production, and ensure the sustainable stability of agricultural production. Therefore, the input intensity of research and development (C15), input intensity of agricultural insurance premiums (C16), the rural population density (C17), and the proportion of rural-employed persons (C18) were selected as indicators of the social system in this study.

2.3. Method of Data Standardization and Indicator Weighting

The data were obtained from publicly available databases provided by the statistical department of China or remote sensing products. Among the 18 indicators, forest coverage (C8) data were calculated by 30-m Landsat-derived land cover products (CLCD) [28]. Other indicator data were obtained from the China Rural Statistical Yearbook [29] and the Hainan Statistical Yearbook [30].
In order to eliminate the effects of the dimensions of different indicator data, data standardization is an important basic work for the assessment of sustainable agricultural development. In this study, all indicators were divided into two categories: positive indicators and negative indicators (Table 1). For positive indicators (the larger the value, the higher the system evaluation score), forward normalization processing was carried out according to Formula (1), while for negative indicators (the larger the value, the lower the system evaluation score), forward normalization processing was carried out according to Formula (2) [13].
Positive   indicator :   d i = x i m i n ( x i ) m a x ( x i ) m i n ( x i )   ,   ( i = 1 ,   2 ,   ,   n )
Negative   indicator :   d i = m a x ( x i ) x i m a x ( x i ) m i n ( x i )   ,   ( i = 1 ,   2 ,   ,   n )
where xi is the value of indicator i, di is the dimensionless value of xi, and min (xi) and max (xi) represent the minimum and maximum values of xi, respectively. After dimensionless processing, the values of all indicator data were between 0 and 1 (Figure 2).
Then, the weight of each indicator was determined by the Coefficient of Variation Method [29] (CVM) [30], and the calculation formula is as follows:
W i = C V i i = 1 n C V i   ,   ( i = 1 ,   2 ,   ,   n )
where Wi is the weight of indicator i, CVi is the coefficient of variation of indicator i, and n is the total number of evaluation indicators. The final weights of the assessment indicators for the sustainable development of tropical agriculture are shown in Table 1.

2.4. Methods for Assessing the Sustainable Development Level of Tropical Agriculture

The level of sustainable development in tropical agriculture and its subsystems can be measured using the sustainability index (SI), which was calculated using the Index Weighted Method (IWM) shown in Formula (4).
U j = i = 1 n d i W i
where Uj is the SI value of tropical agriculture or its subsystems in year j between 1988 and 2020, Wi is the weight of each indicator, i, di is the dimensionless value of xi of indicator i, and n is the total number of evaluation indicators. The greater the Uj, the higher the level of sustainable development.

3. Results

3.1. Comprehensive Evaluation of Sustainable Development Level of Tropical Agriculture

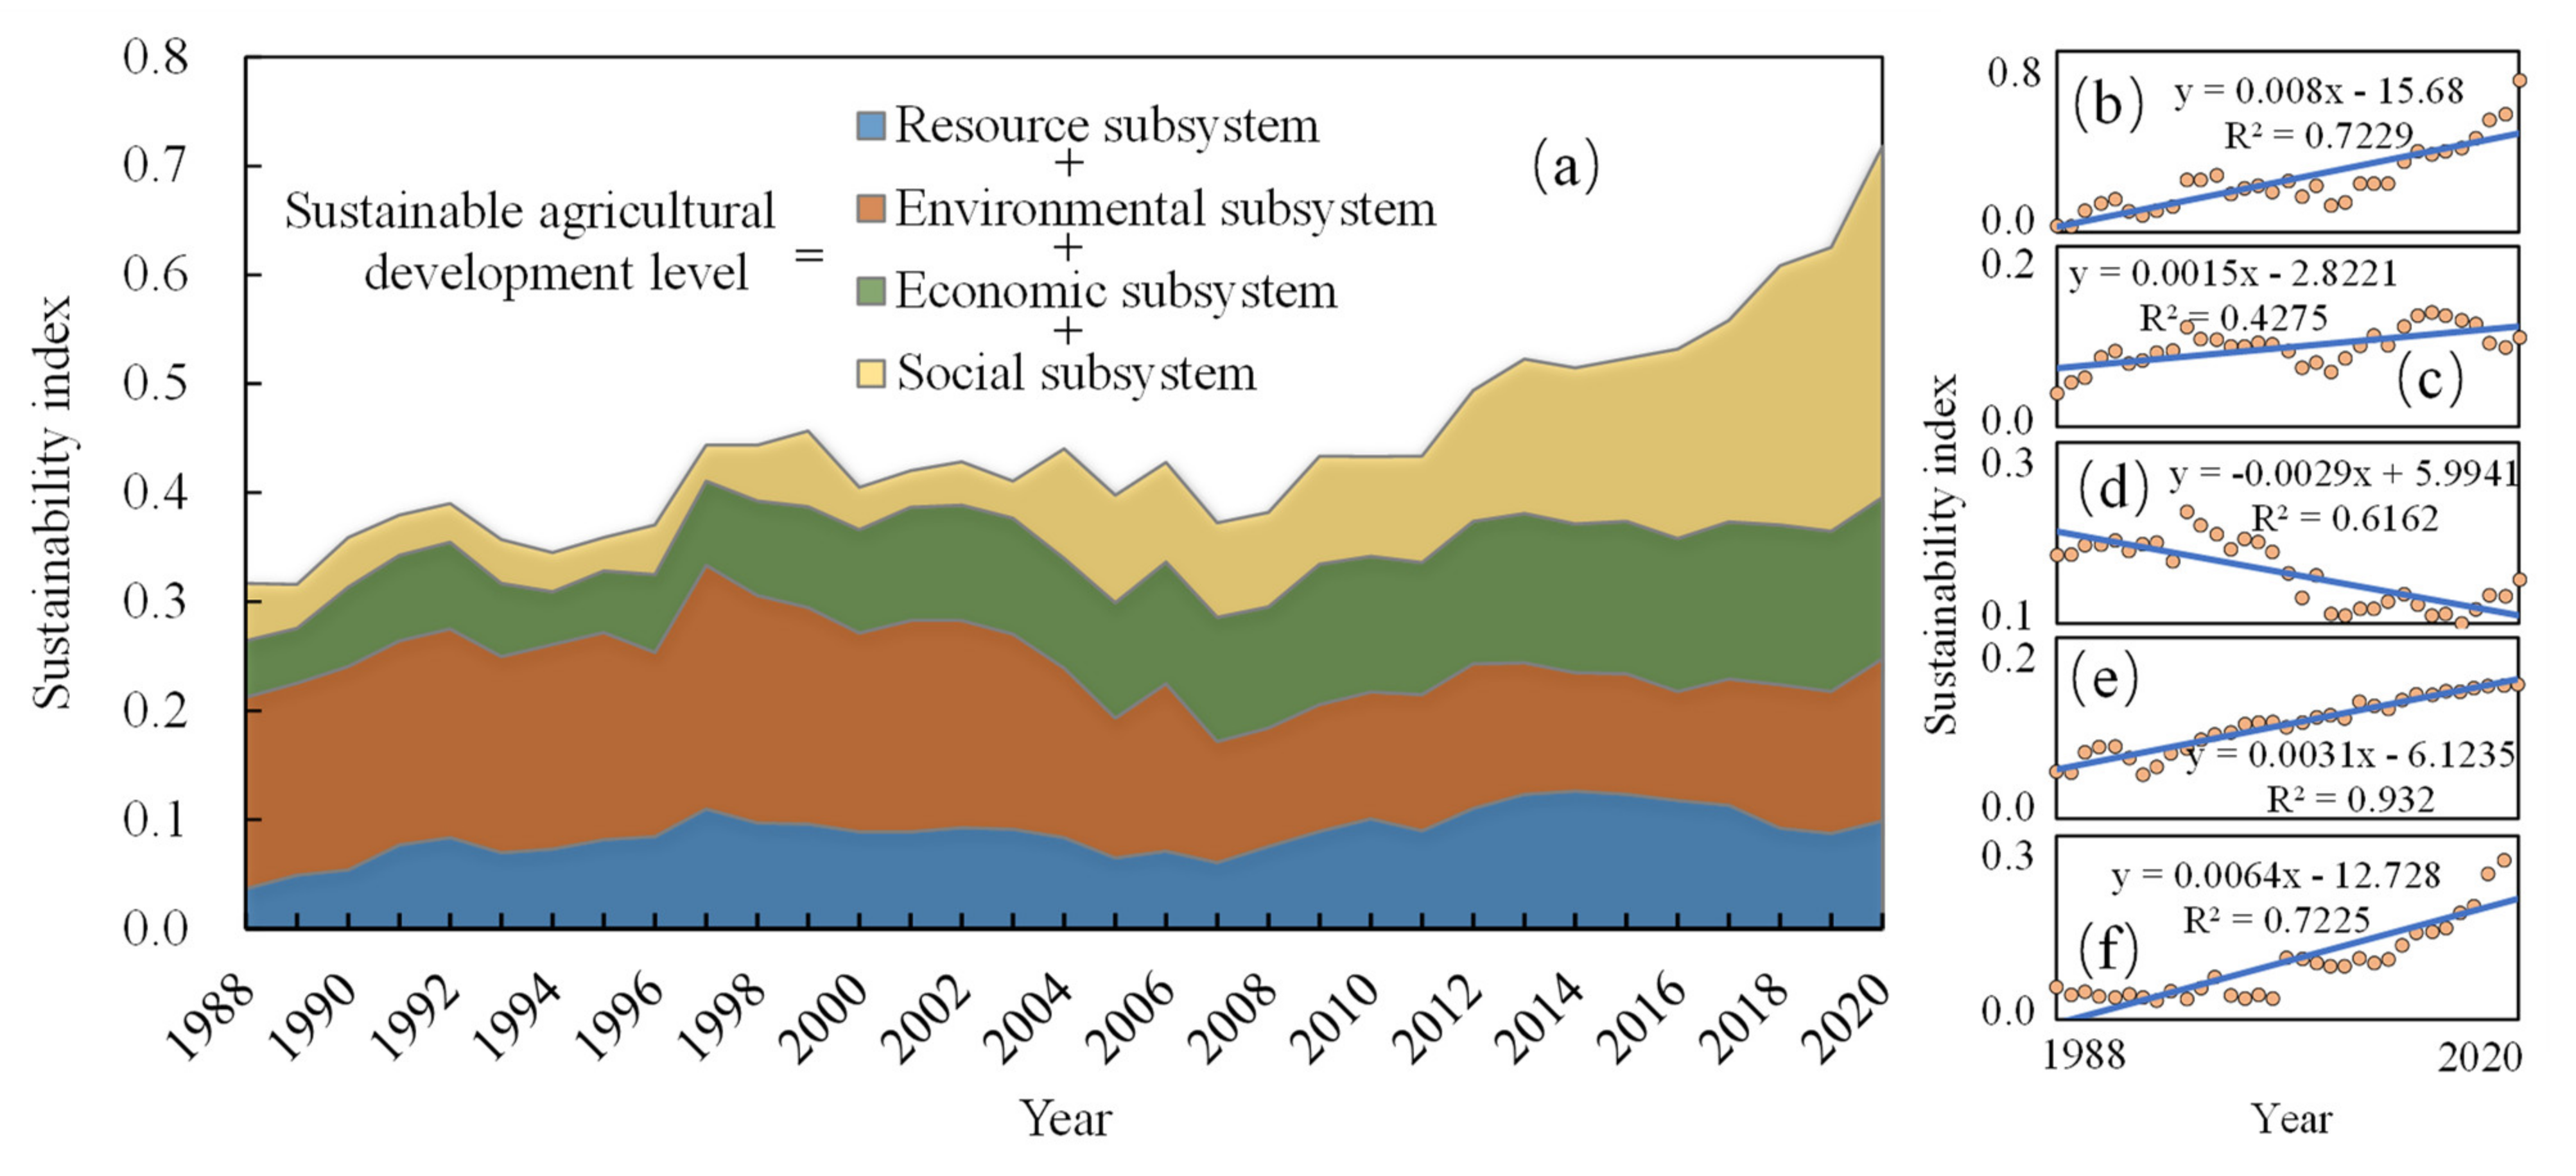
Figure 3 shows the sustainable development level of tropical agriculture in Hainan Province since its establishment as a province in 1988. The sustainability index (SI) of tropical agriculture increased from 0.318 in 1988 to 0.718 in 2020, with a linearly fitted growth rate of 0.0080 per year (Figure 3a). This growth was mainly driven by improvements in economic sustainability and social sustainability. For the agricultural economy, the sustainable development level of the economic subsystem increased yearly (Figure 3e). The economic SI increased from 0.052 in 1988 to 0.148 in 2020, with a linearly fitted growth rate of 0.0031 per year. This was due to the good momentum of Hainan’s overall economic development in the past 30 years. Many agricultural economic indicators have grown rapidly, such as the index of the total agricultural output value (C11) and average yield of tropical fruits and vegetables (C12). The social subsystem had the highest growth rate at the sustainable development level (Figure 3f). The social SI increased from 0.053 in 1988 to 0.322 in 2020, with a linear fitting growth rate of 0.0064 per year. This was largely due to the increasing input intensity of research and development (C15), input intensity of agricultural insurance premiums (C16), and the declining proportion of rural-employed persons (C18). The sustainable development level of the agricultural resources subsystem has been stable and increasing over the last 30 years, with a linear fitting growth rate of 0.0015 per year (Figure 3b). However, the sustainable development level of the environmental subsystem showed a slight downward trend, with a trend growth rate of −0.0029 per year. This was mainly due to the increased load of pesticides, fertilizers, and agricultural films, which reduced the sustainability of the agro-environment (Figure 3c).
There were differences in the level of sustainable agricultural development in Hainan at different periods (Figure 3a). The period of 1988–1997 was the first decade after the establishment of Hainan Province. The sustainability of resources, the environment, the economy, and society increased steadily. The SI increased from 0.318 in 1988 to 0.444 in 1997, with a linear fitting growth rate of 0.0084 per year. The period of 1998–2007 was the second decade of the establishment of Hainan Province. During this period, with the rapid development of the economy and science, a large amount of cultivated land was developed for construction purposes, and the per capita area of cultivated land has continuously reduced. Meanwhile, pesticides, fertilizers, and agricultural films have also been used in large quantities, leading to increasingly serious environmental pollution. As a result, agricultural sustainability has shown a slight downward trend. The period of 2008–2017 was a decade in which the sustainable development level of tropical agriculture improved very rapidly. The SI increased from 0.382 in 2008 to 0.558 in 2017, with a linear fitting growth rate of 0.0181 per year. This is because Hainan has been actively promoting the construction of an international tourism island since 2008, including building Hainan into a national tropical modern agricultural base. Since 2018, the country has made efforts to build a free-trade pilot zone and a free-trade port with Chinese characteristics in the whole of Hainan Province. In the development of efficient agriculture with tropical characteristics, the country has paid more attention to all-around high-quality sustainable development. Therefore, the sustainability of agricultural resources has been significantly improved, from 0.609 in 2018 to 0.718 in 2020, with a linearly fitted growth rate of 0.0548 per year.

3.2. Spatial Pattern of Sustainability Index of Tropical Agriculture

The SI of tropical agriculture in the counties or cities of Hainan Province was assessed (Figure 4). As shown in Figure 4a, the SI of tropical agriculture in different counties or cities in 2020 ranged from 0.554 to 0.724, with a coefficient of variation (CV) of 6.3%. The spatial distribution of the sustainable level generally showed a decreasing trend from the central mountainous areas to the surrounding coastal areas, with the highest SI in Wuzhishan and the lowest in Haikou. According to the value of the SI, the sustainable development level of tropical agriculture was classified into three types: a low sustainable level (0.554–0.620), medium sustainable level (0.621–0.680), and high sustainable level (0.681–0.724). The counties or cities with a high level of sustainability included Wuzhishan (0.724), Lingshui (0.700), and Qiongzhong (0.686), and the counties or cities with a medium level of sustainability included Baoting (0.665), Baisha (0.657), Wanning (0.652), Chengmai (0.651), Ledong (0.645), Tunchang (0.640), Changjiang (0.628), and Lingao (0.629). The counties or cities with a low level of sustainability included Sanya (0.617), Dongfang (0.610), Wenchang (0.608), Qionghai (0.607), Ding’an (0.607), Danzhou (0.600), and Haikou (0.554).
From different periods, there are differences in the level of sustainable agricultural development in Hainan’s counties or cities (Figure 4b). From 1988 to 2020, the SI of all the counties or cities increased significantly, with the SI value increase ranging from 0.296 to 0.391, and the percentage increase ranging from 81.80% to 141.35%. Among all the cities and counties, the SI increase ranges of Baisha, Haikou, and Sanya were the lowest (≤0.300), with values of 0.296, 0.297, and 0.300, respectively, while the SI growth ranges of Wuzhishan, Wanning, Chengmai, Linggao, and Lingshui were higher (≥0.360), with values of 0.360, 0.367, 0.368, 0.368, and 0.391, respectively. For the other cities or counties, the SI increase ranged between 0.300 and 0.360. Viewed from different time periods, the SI changes of all the counties and cities showed an increase from 1988 to 1997, a slight decrease from 1998 to 2007, and a significant increase from 2008 to 2017 and 2018 to 2020. From 1988 to 2020, the coefficients of variation (CV) of the SI of the counties or cities ranged from 0.281 to 0.392. The smallest variations in the SI (CV < 0.300) were found in Baisha and Sanya, with CV values of 0.281 and 0.288, respectively. The largest variations in the SI (CV > 0.380) were found in Lingao and Wanning, with CV values of 0.392 and 0.383, respectively. The CV of the SI in Wuzhishan was 0.315, and that in Haikou was 0.346.

3.3. Analysis of the Factors Influencing the Sustainability Index of Tropical Agriculture

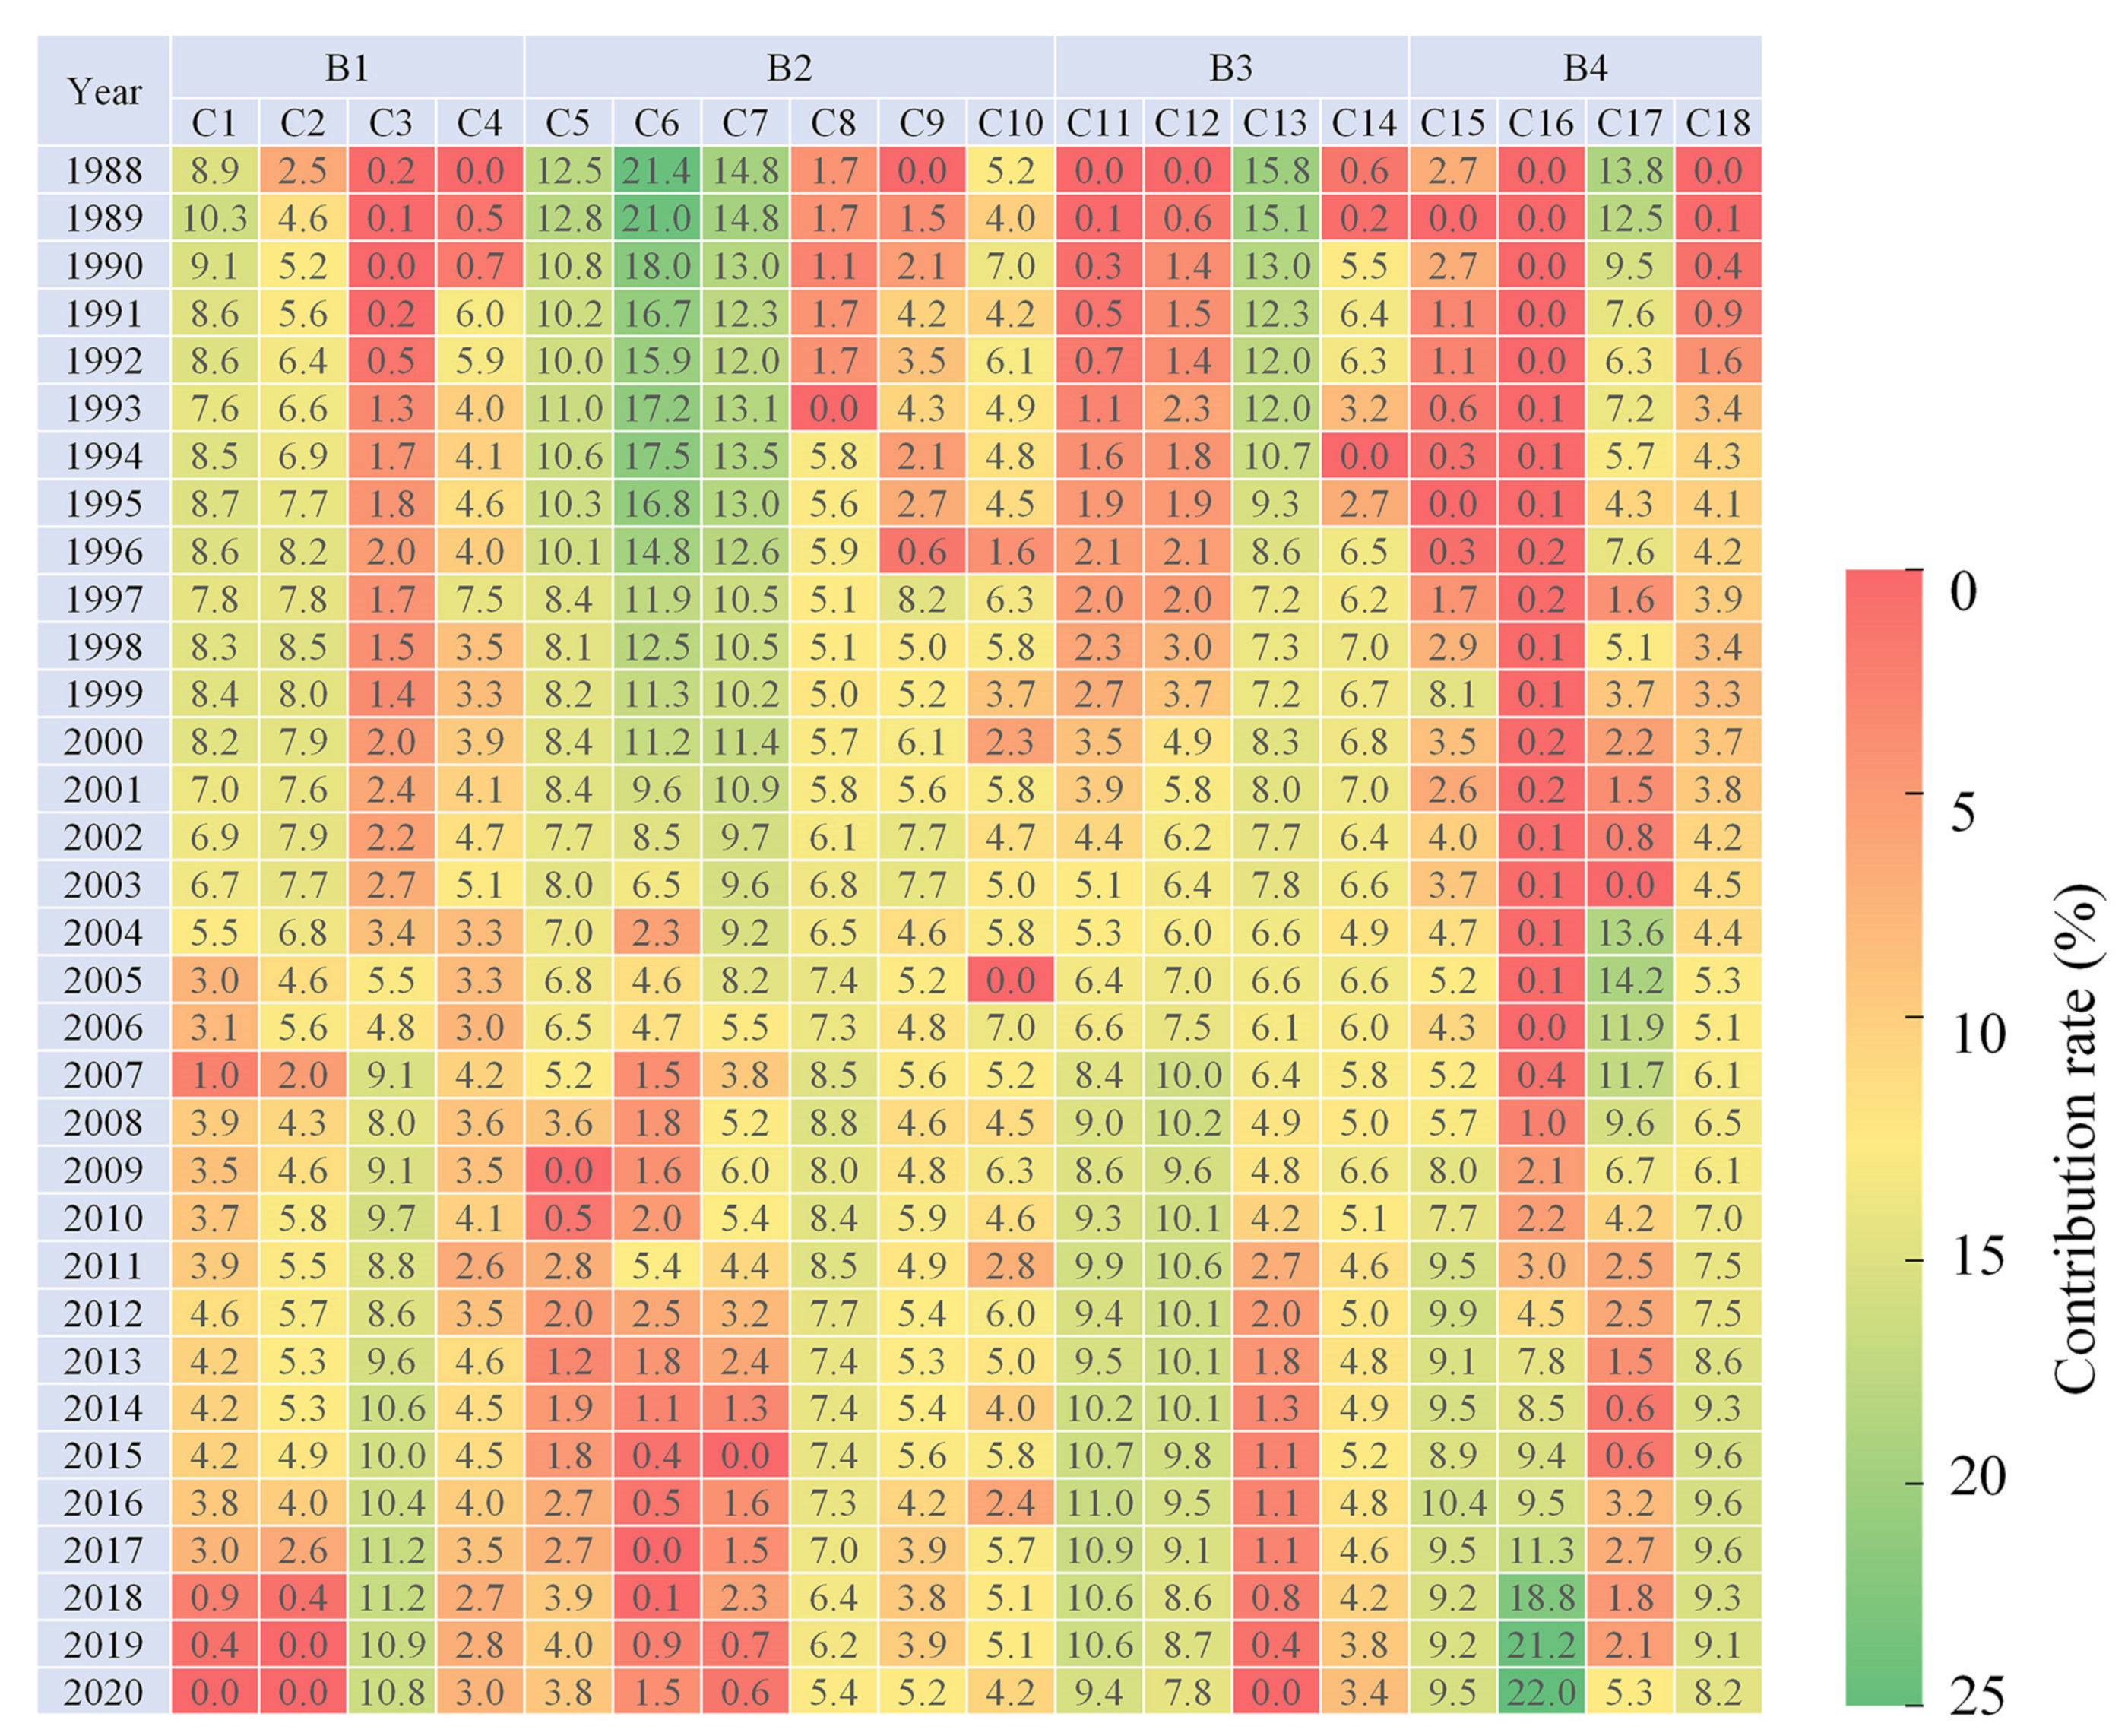
The annual contribution rates of each subsystem and its indicators to the SI from 1988 to 2020 were also calculated, as shown in Figure 5. From 1988 to 2020, the contribution rates of the resource, economic, and social subsystems to the SI increased from 11.6% to 13.8%, 16.3% to 20.6%, and 16.6% to 28.3%, respectively. However, the contribution rate of the environmental subsystem to the SI decreased from 55.5% to 20.6%, indicating that the deterioration of the ecological environment of agricultural land over a long period of time has not been conducive to the sustainable development of tropical agriculture.
According to the changing trend of the contribution rate of each indicator to the SI, the indicators were divided into three types: positive indicators, stable indicators, and deteriorative indicators. The positive indicators were the kind of indicators whose contribution to sustainable development showed a clear upward trend, including agricultural machinery power (C3), forest coverage (C8), the proportion of the area of cultivated land to ensure stable yields in drought and waterlogging (C9), the index of the total agricultural output value (C11), the average yield of tropical fruits and vegetables (C12), input intensity of research and development (C15), input intensity of agricultural insurance premiums (C16), and the proportion of rural-employed persons (C18). This indicated that the use of agricultural mechanization, construction of farmland infrastructure, improvement of crop productivity, investment in science and technology, and investment in agricultural insurance played a positive role in promoting sustainable development. The stable indicators were a category of indicators with basically stable contributions to sustainable development, including the proportion of effectively irrigated areas of cultivated land (C4), the proportion of the disaster area of tropical agricultural land (C10), the rural consumer price index (C14), and the rural population density (C17). However, the deteriorative indicators were a group of indicators that showed a downward trend in their contribution to sustainable development, including the per capita area of tropical agricultural land (C1), the multiple cropping index of cultivated land (C2), pesticide use intensity (C5), chemical fertilizer use intensity (C6), agricultural film use intensity (C7), and the price index of agricultural means of production (C13). It showed that the decline in the per capita land area and land use efficiency, the high use of fertilizers, pesticides, and agricultural films, and the increase in the price of agricultural inputs were not conducive to the sustainable development of tropical agriculture.
From different periods in 1988, the high contributors to the SI were C1, C5, C6, C7, C13, and C17, with contribution rates of 8.9%, 12.5%, 21.4%, 14.8%, 15.8%, and 13.8%, respectively. By 1998, the high contributors to the SI were C1, C2, C5, C6, and C7, with contribution rates of 8.3%, 8.5%, 8.1%, 12.5%, and 10.5%, respectively. By 2008, the contribution rates of C3, C8, C11, and C17 to the SI had improved to 8.0%, 8.8%, 9.0%, and 9.6%, respectively. By 2018, the high contribution indicators to the SI were C3, C11, C15, C16, and C18, with contribution rates of 11.2%, 10.6%, 9.2%, 18.8%, and 9.3%, respectively. By 2020, the high contribution indicators to the SI were C3, C11, C15, C16, and C18, with contribution rates of 10.8%, 9.4%, 9.5%, 22.0%, and 8.2%, respectively. In general, the contribution rate of the use of agricultural mechanization, construction of farmland infrastructure, improvement of crop productivity, investment in science and technology, and investment in agricultural insurance to the SI gradually increased, which also showed that these indicators played a positive role in promoting the sustainable development of tropical agriculture.

4. Measures and Suggestions for Promoting Sustainable Development of Tropical Agriculture

4.1. Strengthening the Construction and Protection of Cultivated Land Quality

As shown in Figure 5, there was a continuous downward trend in C1 and C2 from 1988 to 2020. This indicates that the gradual reduction in the per capita cultivated land area and multiple cropping gradually decreases, which is not conducive to the sustainable development of tropical agriculture. The key to protecting cultivated land is to maintain the quantity and quality of the cultivated land. In Hainan, the fragmentation degree of the cultivated land is relatively high, with undulating terrain and a low level of land use. It is recommended that the government and relevant departments should take into account the characteristics of the cultivated land and carry out in-depth protection and enhancement actions to improve the quality of the cultivated land. For instance, it should carry out comprehensive land improvement, promote the transformation of low-and medium-yield farmland, construction of high-standard farmland, and the comprehensive treatment of soil and water loss on sloping farmland. This could solve the problems of farmland fragmentation and the dispersion of village residents, promote large-scale planting and intensive management, curb the trend of farmland degradation, and improve the quality of the farmland. Moreover, despite that Hainan is located in tropical and subtropical areas, where multiple cropping can be carried out, the issue of abandoned farmland is still significant. Therefore, a comprehensive cause analysis of cultivated land abandonment should be conducted, and policies and measures should be established according to local conditions, including strengthening the rehabilitation of abandoned farmland, stabilizing grain cultivation areas and yields, and firmly prohibiting arable land from non-agricultural uses.

4.2. Improving the Ecological Environment of Farmland

The high multiple cropping index of farmland results in a large number of fertilizers, pesticides, and agricultural films being used in Hainan. As a result, the number of fertilizers, pesticides, and plastic films used per hectare is relatively high and far above the national average. The consumption of fertilizers per unit area is 1.5 times the national average, and the consumption of pesticides per unit area is twice the national average. The excessive use of chemical fertilizers, pesticides, and agricultural films not only poses a major hidden threat to the quality and safety of agricultural products but also tends to accumulate in the soil, causing serious damage to the ecosystem. In addition, the use of chemical fertilizers, pesticides, and agricultural films in Hainan Province has increased year on year since 1988. The ecological environment of farmland has become the biggest weak link in the sustainable development of tropical agriculture in Hainan. Therefore, the government and relevant departments must increase environmental protection efforts, raise awareness about environmental protection among farmers, use fertilizers and pesticides scientifically, increase efforts to recycle plastic film and reduce agricultural non-point source pollution. Additionally, Hainan is also prone to natural disasters, such as typhoons, floods, and seasonal droughts. Additionally, an important task to improve agricultural disaster prevention and mitigation capacity is building artificial protective forests, increasing forest coverage, and strengthening infrastructure construction, such as farmland irrigation and drainage.

4.3. Promoting the Innovation of Agricultural Science and Technology

In the social subsystem, increasing the input intensity of science and technology funds (C15) and agricultural insurance premiums (C16) can greatly promote the sustainable development of tropical agriculture. However, the scientific and technological foundation in Hainan is relatively weak, and there is still great potential for scientific and technological innovation to promote agricultural sustainability. The proportion of agricultural technology funds invested in Hainan every year is still not high compared to the GDP, so it is necessary to ensure stable and increased funding. At the same time, Hainan should pay attention to the introduction of high-tech agricultural technologies and establish a perfect talent training platform so as to build a group of science and technology teams with a high level of innovation. Meanwhile, Hainan should strengthen science and technology training for farmers and improve its overall quality so as to further promote the popularization of agricultural technology. Additionally, Hainan is located in an area with a high incidence of various natural disasters, and the agricultural losses caused by natural disasters amount to thousands of millions of RMB every year. It is proposed to increase policy-based agricultural insurance to reduce farmers’ disaster losses and to enhance their self-rescue ability and enthusiasm for agricultural production after disasters so as to promote the sustainable development of agriculture.

4.4. Implementing Policies for the Sustainable Development of Tropical Agriculture

At present, the sustainable development of agriculture has become a national development strategy in China; however, there lacks a systematic institutional framework. Therefore, it is proposed that Hainan should gradually improve its localized assessment system for the sustainable development of tropical agriculture with the United Nations’ Sustainable Development Goals (SDGs) as a benchmark. Additionally, the government should strengthen organizational leadership, improve the leadership and working mechanisms of agricultural work, and coordinate agricultural production, ecological environment improvement, circular agriculture construction, and agricultural resource protection. Investment should be increased, and a sound investment guarantee system for sustainable agricultural development should be established, exploring diversified investment mechanisms and improving corresponding policy systems. Moreover, it is essential to study agricultural assistance policies suitable for the local area, formulate local regulations that align with Hainan’s actual situation, improve farmers’ awareness of law-abiding, and guarantee regulation effectiveness. Balancing the interests of all parties is required to achieve sustainable agriculture, with policymakers guiding agricultural transformation and enterprises emphasizing social responsibility, promoting sustainable production models, and collaborating closely with farmers. Furthermore, farmers need to adjust traditional agricultural production methods, improve production efficiency, and enhance economic benefits. Only when the interests of all parties are balanced can sustainable agriculture be promoted.

5. Conclusions

Taking Hainan Province, China, as an example, this paper has established an evaluation index system for the sustainable development of tropical agriculture by selecting 18 indicators from four aspects: agricultural resources, ecological environment, economic conditions, and social conditions. It then combined the Coefficient of Variation Method (CVM) and Index Weighted Method (IWM) to quantitatively assess the level of sustainable development of tropical agriculture in the Hainan Province from 1988 to 2020. The results indicate that from the perspective of the whole province, the sustainable development level of tropical agriculture gradually improved from 1988 to 2020. The agricultural sustainability of each county or city had significant differences and various types of changes, showing a decreasing trend from the central mountainous area to the surrounding coastal areas. The counties or cities with a high level of sustainability included Wuzhishan, Lingshui, and Qiongzhong. The counties or cities with a low level of sustainability included Sanya, Dongfang, Wenchang, Qionghai, Ding’an, Danzhou, and Haikou. Other counties or cities had a medium level of sustainability. From 1988 to 2020, the sustainable development index of Wuzhishan, Wanning, Chengmai, Lingao, and Lingshui had the highest improvement value, while that of Baisha, Haikou, and Sanya had the lowest improvement value. Across the province, indicators such as the use of agricultural mechanization, construction of farmland infrastructure, improvement of crop productivity, investment in science and technology, and investment in agricultural insurance played a positive role in promoting sustainable development. While indicators such as the per capita area of cultivated land and the degree of land use have declined, the high use of fertilizers, pesticides, and agricultural films and the increase in the price of agricultural inputs have not been conducive to the sustainable development of tropical agriculture. It is suggested to take effective measures to enhance the quality and protection of farmland, improve the ecological environment of the farmland, and promote innovation in agricultural science and technology. This will facilitate the formulation of practical policies for the sustainable development of tropical agriculture. Therefore, the sustainable development evaluation index system for tropical agriculture established in this study can be effectively utilized to assess the sustainable development status of Hainan’s tropical agriculture. The results provide a fundamental theoretical and methodological guide for realizing sustainable development objectives in Hainan and for assessing the sustainable development capacity of tropical agriculture in similar regions.
Additionally, this study primarily relied on statistical data from the statistical yearbook. Although it can provide useful information, there are also limitations, such as the data being incomplete, inaccurate, and not updated in real-time. Therefore, it is necessary to integrate big data technology for a more objective and accurate assessment of the sustainable development of tropical agriculture in the future. Particularly, utilizing long-time series remote sensing and geographic spatial information data could better capture the ecological, environmental, and resource situations of regions or fields, thereby enhancing the accuracy and practicality of the sustainable development evaluation results. Ultimately, this will provide a scientific basis and support for future initiatives aimed at promoting the sustainable development of tropical agriculture.

Author Contributions

Conceptualization and methodology, H.Y., H.W. and C.N.; software, C.N.; formal analysis, H.Y., C.N., J.W. and M.W.; resources, J.W., W.H. and L.T.; data curation, M.W.; writing—original draft preparation, H.Y. and M.W.; writing—review and editing, H.Y. and M.W.; visualization, C.N.; supervision, J.W.; project administration, M.W.; funding acquisition, H.Y. All authors have read and agreed to the published version of the manuscript.

Funding

This work was supported by grants from the Strategic Priority Research Program of the Chinese Academy of Sciences (XDA19030105), the Hainan Province Science and Technology Special Fund (ZDYF2021GXJS038), the Hainan Provincial High-Level Talent Program of Basic and Applied Basic Research Plan of China (621RC614), the Youth Innovation Promotion Association CAS (2021119), and the Future Star Talent Program of Aerospace Information Research Institute, Chinese Academy of Sciences (2020KTYWLZX08).

Institutional Review Board Statement

Not applicable.

Informed Consent Statement

Not applicable.

Data Availability Statement

Not applicable.

Conflicts of Interest

The authors declare no conflict of interest.

References

  1. Lian, X.; Jeong, S.; Park, C.E.; Xu, H.; Li, L.Z.; Wang, T.; Gentine, P.; Penuelas, J.; Piao, S.L. Biophysical impacts of northern vegetation changes on seasonal warming patterns. Nat. Commun. 2022, 13, 3925. [Google Scholar] [CrossRef]
  2. MacLeod, M.; Arp, H.P.H.; Tekman, M.B.; Jahnke, A. The global threat from plastic pollution. Science 2021, 373, 61–65. [Google Scholar] [CrossRef]
  3. Willemen, L.; Barger, N.N.; Brink, B.T.; Cantele, M.; Erasmus, B.F.N.; Fisher, J.L.; Gardner, T.; Holland, T.G.; Kohler, F.; Kotiaho, J.S.; et al. How to halt the global decline of lands. Nat. Sustain. 2020, 3, 164–165. [Google Scholar] [CrossRef]
  4. World Commission on Environment and Development (WCED). Our Common Future; Oxford University Press: Oxford, UK, 1987. [Google Scholar]
  5. United Nations (UN). Earth Summit Agenda 21 the United Nations Programme of Action from Rio; United Nations: New York, NY, USA, 1992. [Google Scholar]
  6. United Nations (UN). Transforming Our World: The 2030 Agenda for Sustainable Development; United Nations: New York, NY, USA, 2015. [Google Scholar]
  7. Chen, S.F.; Liu, Y.; Su, L.Y. Sustainable Agriculture in the “Belt and Road” Region in Conjunction with the Sustainable Development Goals. J. Resour. Ecol. 2019, 10, 649–656. [Google Scholar]
  8. Cui, P.; Zhu, A. China Tropical Agriculture Development Strategy in the New Period. Chin. J. Trop. Crops 2020, 41, 1949–1953. [Google Scholar]
  9. Zhai, D.L.; Xu, J.C.; Dai, Z.C.; Cannon, C.H.; Grumbine, R.E. Increasing tree cover while losing diverse natural forests in tropical Hainan, China. Reg. Environ. Chang. 2014, 14, 611–621. [Google Scholar] [CrossRef]
  10. Song, C.Y.; Zhang, J.J.; Liu, L.; Ma, W.Q.; Ma, L.; Ding, S.; Zhao, H.W. Spatial and temporal characteristics of agricultural green development indicators in Hainan Island. Chin. J. Eco-Agric. 2020, 28, 1156–1167. [Google Scholar]
  11. Shen, J.B.; Zhu, Q.C.; Jiao, X.Q.; Ying, H.; Wang, H.; Wen, X.; Xu, W.; Li, T.; Cong, W.; Liu, X.; et al. Agriculture green development: A model for China and the world. Front. Agric. Sci. Eng. 2020, 7, 5–13. [Google Scholar] [CrossRef]
  12. Qi, Y. A New Goal of Hainan: From Pilot Free Trade Zone to Free Trade Port with Chinese Characteristics. Stud. China’s Spec. Econ. Zones 2021, 4, 171–181. [Google Scholar]
  13. Li, M.; Wang, J.; Chen, Y. Evaluation and influencing factors of sustainable development capability of agriculture in countries along the belt and road route. Sustainability 2019, 11, 2004. [Google Scholar] [CrossRef]
  14. Organization for Economic Co-operation and Development (OECD). Waste Management and the Circular Economy in Selected OECD Countries: Evidence from Environmental Performance Reviews; Organization for Economic Co-Operation and Development: Paris, France, 2019. [Google Scholar]
  15. United Nations Environment Programme (UNEP). The Emissions Gap Report 2017: A UN Environment Synthesis Report; United Nations Environment Programme: Nairobi, Kenya, 2017. [Google Scholar]
  16. United Nations Commission on Sustainable Development (UNCSD). Indicators of Sustainable Development—Framework and Methodologies; United Nations: New York, NY, USA, 1996. [Google Scholar]
  17. Waheed, B.; Khan, F.; Veitch, B. Linkage-Based Frameworks for Sustainability Assessment: Making a Case for Driving Force-Pressure-State-Exposure-Effect-Action (DPSEEA) Frameworks. Sustainability 2009, 1, 441–446. [Google Scholar] [CrossRef]
  18. Wang, X.B.; Liu, W.N.; Wu, W.L. A holistic approach to the development of sustainable agriculture: Application of the ecosystem health model. Int. J. Sustain. Dev. World 2009, 16, 339–345. [Google Scholar] [CrossRef]
  19. Triviño-Tarradas, P.; Carranza-Cañadas, P.; Mesas-Carrascosa, F.J.; Gonzalez-Sanchez, E.J. Evaluation of agricultural sustainabil-ity on a mixed vineyard and olive-grove farm in Southern Spain through the INSPIA model. Sustainability 2020, 12, 1090. [Google Scholar] [CrossRef]
  20. Trivino-Tarradas, P.; Gomez-Ariza, M.R.; Basch, G.; Gonzalez-Sanchez, E.J. Sustainability Assessment of Annual and Permanent Crops: The Inspia Model. Sustainability 2019, 11, 738. [Google Scholar] [CrossRef]
  21. Palanisamy, K.; Parthasarathy, K. Urbanization, food insecurity and agriculture—Challenges for social sustainable development. Probl. Ekorozw. 2016, 11, 157–161. [Google Scholar]
  22. Zhou, S.; Felix, M.; Benjamin, B.; Cao, X.; Hou, Y. Assessing agricultural sustainable development based on the DPSIR approach: Case study in Jiangsu, China. J. Int. Agric. 2013, 12, 1292–1299. [Google Scholar] [CrossRef]
  23. Wang, Q.S.; Yuan, X.L.; Zhang, J.; Gao, Y.; Hong, J.L.; Zuo, J.; Liu, W. Assessment of the sustainable development capacity with the entropy weight coefficient method. Sustainability 2015, 7, 13542–13563. [Google Scholar] [CrossRef]
  24. Zhao, Q.G.; Xu, M.J. Sustainable agriculture evaluation for red soil hill region of southeast China. Pedosphere 2004, 14, 313–321. [Google Scholar]
  25. Xiong, W.; Wang, Q.; Xie, D.; Fletcher, D.H.; He, D. Factors influencing tropical island freshwater fishes: Species, status, threats and conservation in hainan island. Knowl. Manag. Aquat. Ecosyst. 2018, 419, 6. [Google Scholar] [CrossRef]
  26. Bi, X.; Ren, L.; Gong, M.; He, Y.; Wang, L.; Ma, Z. Transfer of cadmium and lead from soil to mangoes in an uncontaminated area, Hainan Island, China. Geoderma 2010, 155, 115–120. [Google Scholar] [CrossRef]
  27. Hainan Provincial Bureau of Statistics, Survey Office of National Bureau of Statistics in Hainan. Hainan Statistical Yearbook 2022; China Statistical Press: Beijing, China, 2022. [Google Scholar]
  28. Yang, J.; Huang, X. The 30 m annual land cover dataset and its dynamics in China from 1990 to 2019. Earth Syst. Sci. Data 2021, 13, 3907–3925. [Google Scholar] [CrossRef]
  29. Rural Social and Economic Survey Division, National Bureau of Statistics. China Rural Statistical Yearbook (1985–2021); China Statistical Press: Beijing, China, 1988–2021. [Google Scholar]
  30. Hainan Provincial Bureau of Statistics, Survey Office of National Bureau of Statistics in Hainan. Hainan Statistical Yearbook (1985–2021); China Statistical Press: Beijing, China, 1988–2021. [Google Scholar]
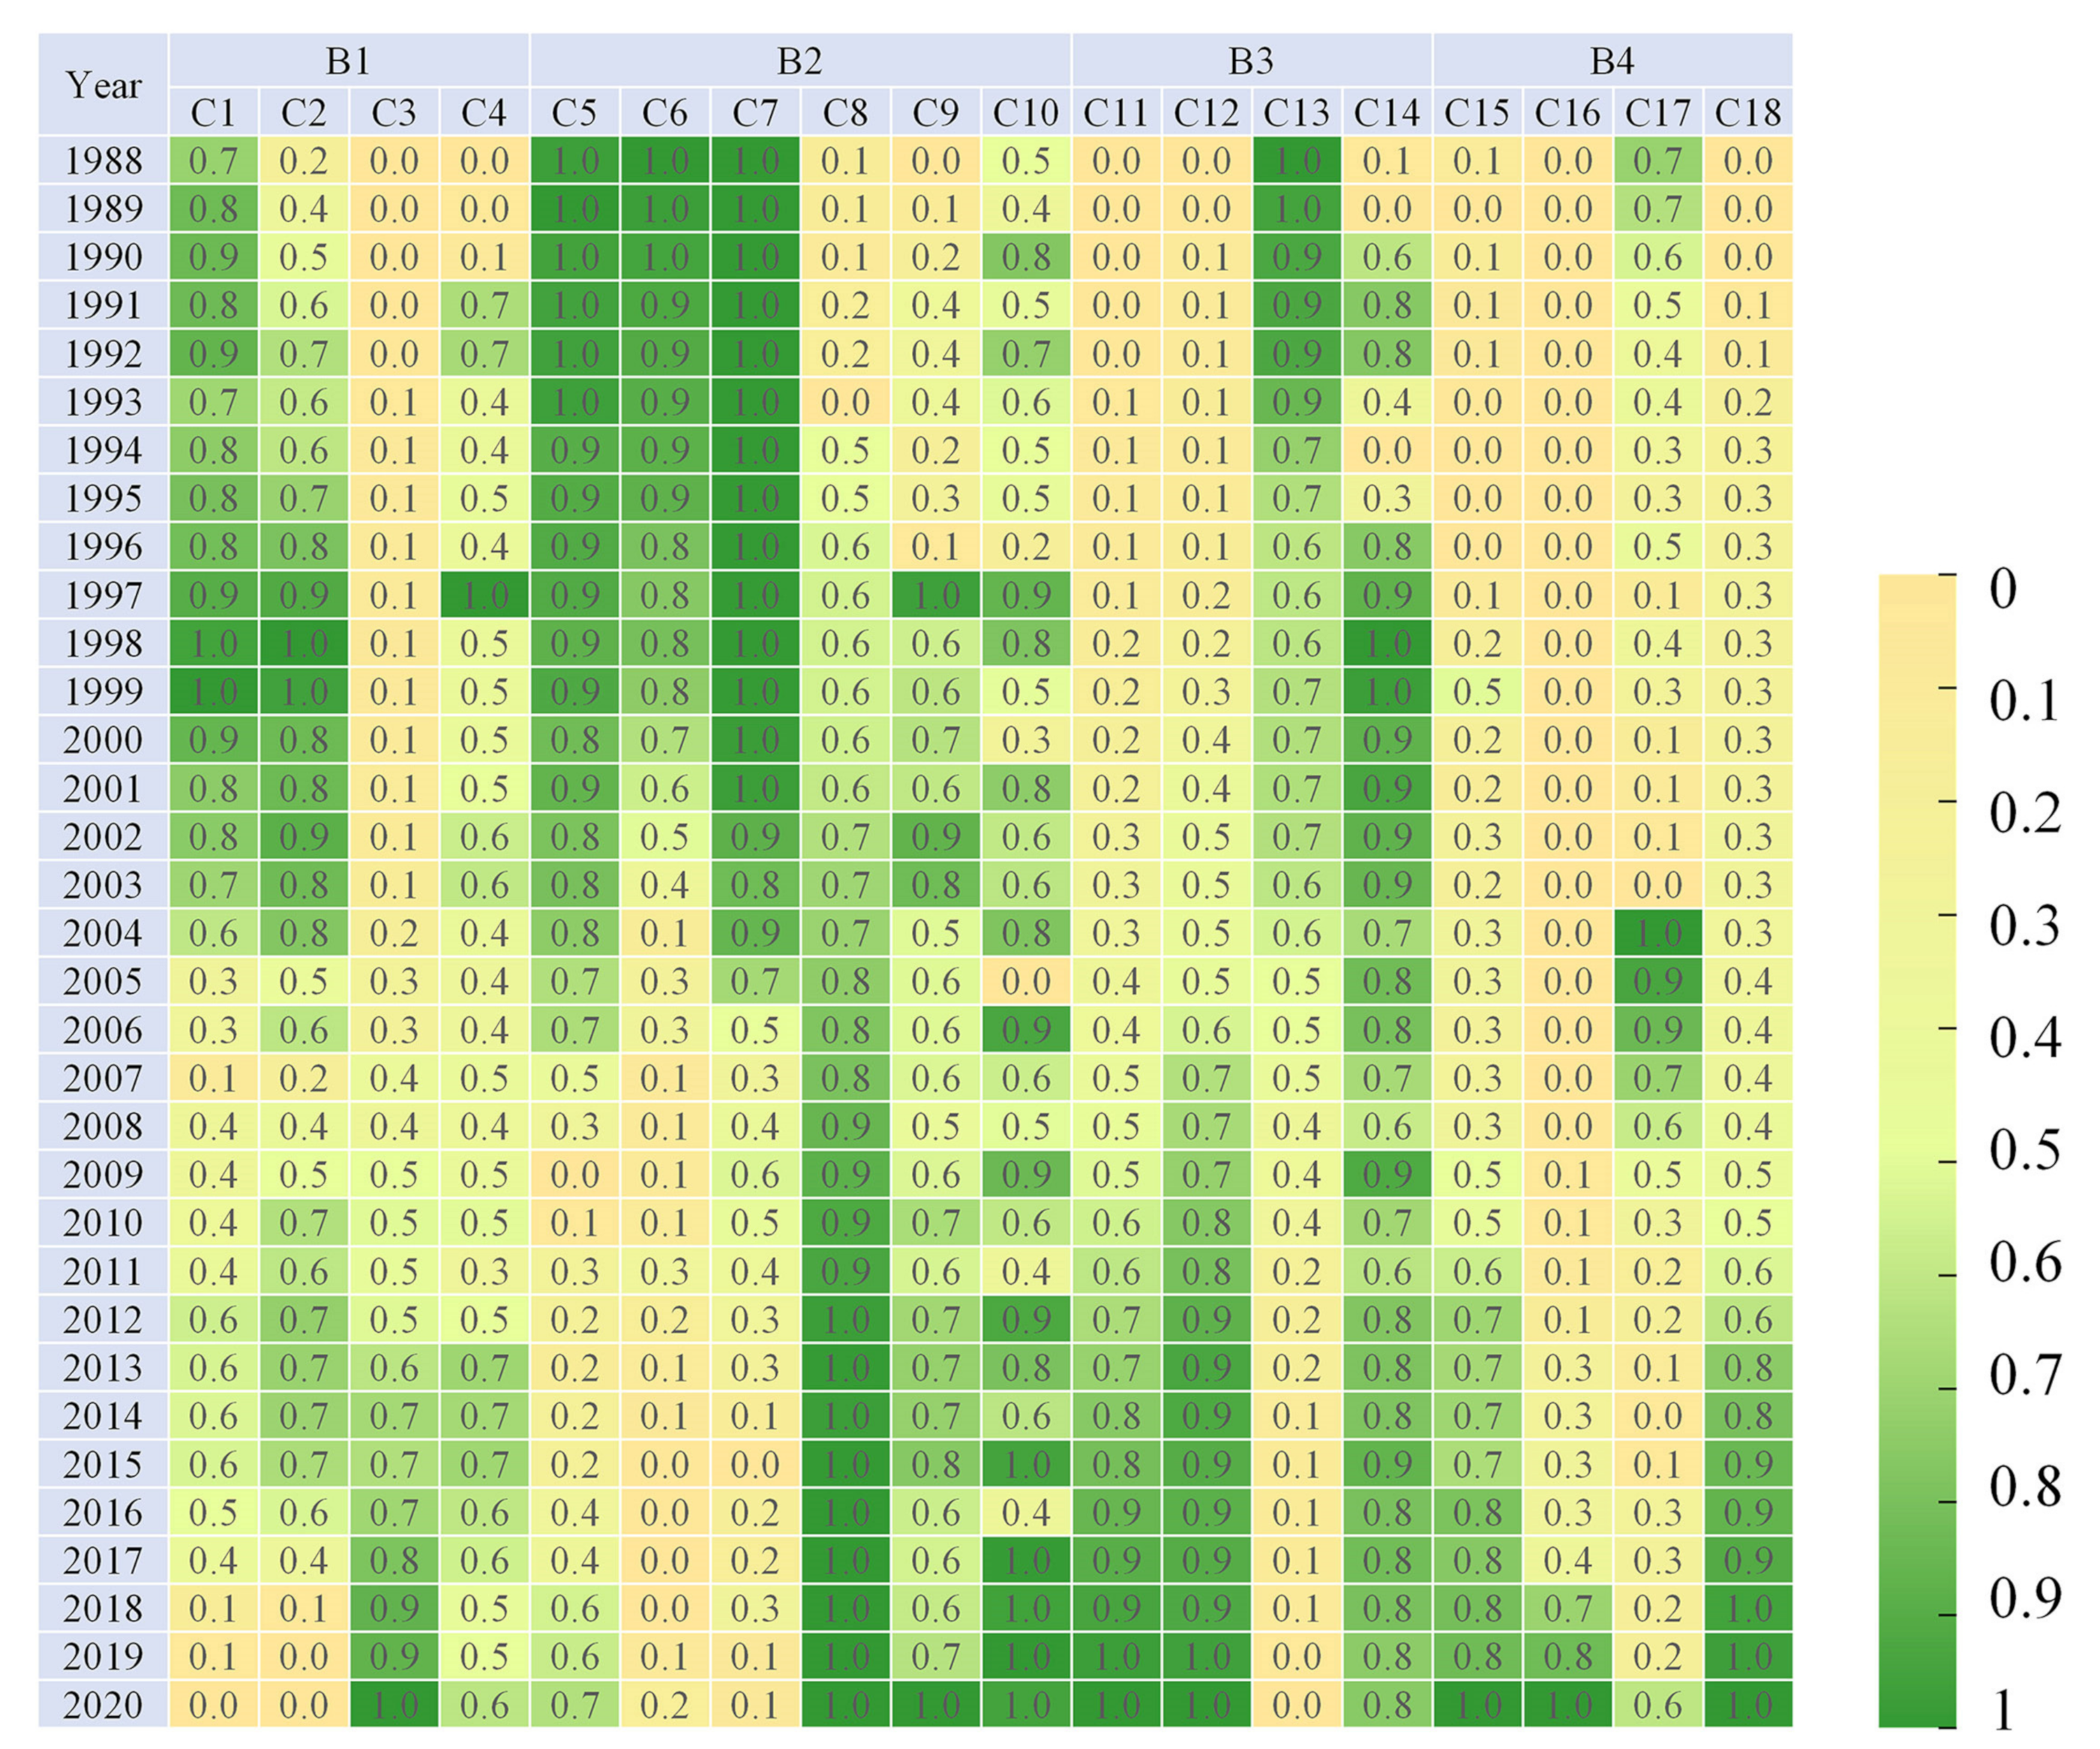
Figure 1. Geographical map of Hainan Province (a) with the distribution of land cover (b) and digital elevation (c).
Sustainability 15 08778 g001
Figure 2. Dimensionless value of each indicator of sustainable development capacity for tropical agriculture in Hainan Province from 1988 to 2020.
Sustainability 15 08778 g002
Figure 3. Sustainability index (SI) of tropical agriculture in Hainan Province from 1988 to 2020 (a) with the best-fitting linear trend line (blue line) of the sustainable agricultural development (b), resource subsystem (c), environmental subsystem (d), economic subsystem (e), and social subsystem (f).
Sustainability 15 08778 g003
Figure 4. Distribution of the sustainability index of tropical agriculture in the Hainan’s cities or counties. The SI in 2020 (a) and changes in the SI from 1988 to 2020 (b).
Sustainability 15 08778 g004
Figure 5. Contribution rates of each subsystem and its indicators to the SI from 1988 to 2020 in Hainan Province.
Sustainability 15 08778 g005
Table 1. Indicators selected and their weights determined using the Coefficient of Variation Method for assessing the level of sustainable development in tropical agriculture.
Primary IndexSecondary IndexCalculation FormulaUnitDescriptionCorresponding to SDGsAttributeWeight
Resource subsystem (B1)Per capita area of tropical agricultural land (C1)Tropical agricultural land area/total rural populationhectare per capitaReflecting the regional per capita agricultural production capacitySDG 2.3Positive0.039
Multiple cropping index of cultivated land (C2)Total sown area of crops/cultivated land area%Reflecting the intensity of cultivated land useSDG 2.3Positive0.038
Agricultural machinery power (C3)Total agricultural machinery power/tropical agricultural land areakW per hectareReflecting the level of agricultural mechanization utilizationSDG 2.4Positive0.079
Proportion of effectively irrigated areas of cultivated land (C4)Effective irrigation area/cultivated land area%Reflecting the irrigation capacity and water conservancy level of cultivated landSDG 2.4/SDG 6.4Positive0.034
Environmental subsystem (B2)Pesticide use intensity (C5)Amount of pesticide application/pesticide application areakg per capitaReflecting the intensity of pesticide application per unit area of cultivated landSDG 2.4Negative0.041
Chemical fertilizer use intensity (C6)Amount of fertilizer application/fertilizer application areakg per capitaReflecting the intensity of fertilizer application per unit area of cultivated landSDG 2.4Negative0.069
Agricultural film use intensity (C7)Amount of agricultural film application/agricultural film application areakg per capitaReflecting the intensity of agricultural film application per unit area of cultivated landSDG 2.4Negative0.047
Forest coverage (C8)Forest coverage%Reflecting the percentage of forest covered land area covered with treesSDG 15.1Positive0.039
Proportion of the area of cultivated land to ensure stable yields in drought and waterlogging (C9)Area of cultivated land to ensure stable yields in drought and waterlogging/cultivated land area%Reflecting the ability of agriculture to resist natural disastersSDG 1.5Positive0.038
Proportion of the disaster area of tropical agricultural land (C10)Disaster area of tropical agricultural land/tropical agricultural land area%Reflecting the proportion of crop production affected by disastersSDG 1.5Negative0.032
Economic subsystem (B3)Index of total agricultural output value (C11)Statistical dataindexReflecting the agricultural productivity levelSDG 8.1Positive0.069
Average yield of tropical fruits and vegetables (C12)Total yield of tropical fruits and vegetables/area of tropical fruits and vegetablesKg per hectareReflecting the tropical fruit and vegetable productivity levelSDG 2.3Positive0.057
Price index of agricultural means of production (C13)Statistical dataindexReflecting the trend and degree of changes in the prices of the means of agricultural production during a given periodSDG 2.cNegative0.051
Rural consumer price index (C14)Statistical dataindexReflecting the actual changes in the living standards of rural consumersSDG 2.cNegative0.032
Social subsystem (B4)Input intensity of research and development (C15)Input of research and development/value of regional gross products %Reflecting the level of technology to promote sustainable developmentSDG 9.bPositive0.069
Input intensity of agricultural insurance premiums (C16)Agricultural insurance premiums input/tropical agricultural land areaRMB yuan per hectareReflecting the ability to prevent and rescue agricultural disastersSDG 1.5/SDG 8.10Positive0.160
Rural population density (C17)Rural population/land areaperson per hectareReflecting the ability to engage in agricultural production per unit of land areaSDG 2.3Negative0.060
Proportion of rural-employed persons (C18)Number of employed persons in rural area/total number of employed persons in society %Reflecting the proportion of employed persons in the rural area SDG 2.3Negative0.046
Disclaimer/Publisher’s Note: The statements, opinions and data contained in all publications are solely those of the individual author(s) and contributor(s) and not of MDPI and/or the editor(s). MDPI and/or the editor(s) disclaim responsibility for any injury to people or property resulting from any ideas, methods, instructions or products referred to in the content.