Abstract
Revealing the temporal and spatial evolution pattern of reservoirs and their driving mechanisms is of great significance for promoting the coordinated development of the national economy and natural ecology. In this study, the northern slope of the Tianshan Mountains (NSTM) in Xinjiang was selected as the study area. Based on remote sensing data from 1990 to 2020, the temporal and spatial evolution characteristics of reservoirs on the NSTM in the past 30 years were analyzed using the grid cells method and the nuclear density analysis method, and the mechanisms by which natural geographical conditions and socio-economic development influence the temporal and spatial evolution of reservoirs in the NSTM were analyzed using GeoDetector. The results indicate the following: (1) In terms of temporal change, the area of reservoirs in the NSTM showed an overall expansion trend from 1990 to 2020, with a growth rate of 42.77%, and the number of reservoirs increased from 123 to 238 during the same period, with a growth rate of 93.50%. (2) In terms of spatial change, the distribution of reservoir accumulation areas on the NSTM gradually developed horizontally from the middle section with rapid economic development to the western and eastern sections. (3) The GeoDetector results showed that the main driving factors affecting the spatial differentiation of reservoir area in the NSTM from 1990 to 2020 were the average elevation (0.201), cultivated land area (0.112), and GDP (0.070), while the main driving factors combinations were the average elevation and cultivated land area (0.374), the average elevation and GDP (0.325), and the average elevation and average population (0.319). The research results can provide a theoretical basis and a decision-making reference for water conservancy project planning and water resources management in the NSTM.
1. Introduction
Water resources are the lifeblood of regional development. In recent years, the increase in surface temperature [1,2], the increase in the variability of precipitation frequency and intensity [3,4], and the increase in snow and glacier melting [5] have been observed all over the world. In the context of climate change, water resources will increase first and then decrease, and reservoirs will play an important role because of their powerful water storage function [6]. Therefore, it is of great significance to analyze the distribution of and changes in reservoirs and to study their driving forces for water conservancy project construction and the sustainable management of water resources.
The rising demand for water resources has led to the construction of a large number of reservoirs around the world. It was calculated that about 50,000 large reservoirs have been built around the world [7]. By 2020, 98,000 reservoirs had been built in China. The importance and value of reservoirs are increasingly prominent, and so research on the monitoring and evaluation of reservoir quantity, quality, and driving forces in different time and space scales has been carried out on various occasions [8,9,10]. For example, Lehner et al. established a set of global reservoir and dam databases (GRand) with clear spatial coordinates and hydrological information [11]. Donchyts et al. used remote sensing satellite data and cloud analysis to monitor the multi-year state of small- and medium-sized reservoirs around the world. This research shows that the inter-annual and intra-annual changes in small- and medium-sized reservoirs are unevenly distributed in space [12]. Du et al. established a dataset to record the changes in lakes and reservoirs in the Nenjiang Watershed from 1980 to 2015 by using the object-oriented image classification method and Landsat series images and found that the total area and the number of reservoirs continued to increase during the research period [13]. Wang et al. drew a surface water map of the Xiaolangdi Reservoir from 1999 to 2019 on the GEE cloud platform by using Landsat images and MNDWI and analyzed the temporal and spatial characteristics of its area change, and concluded that the change in the water body area of Xiaolangdi Reservoir was weakly negatively correlated with natural factors such as precipitation, temperature and population, and positively correlated with runoff and GDP [14]. It can be seen from the existing research that the area of a single reservoir usually fluctuates, and the main driving forces are precipitation, temperature, and agricultural activities [15,16], while the area and number of reservoirs in the basin and even around the world show a continuous upward trend [11]. Although the existing research is very important, there are still some shortcomings. Most of the current research focuses on the change characteristics of the water area of a single reservoir, and there are few studies on reservoirs at the macro and meso scales, and most of them are limited to the statistics of quantity and geographical location, ignoring the analysis of temporal and spatial distribution characteristics and their driving forces. Therefore, it is of great significance to study the temporal and spatial evolution characteristics and driving forces of reservoirs in a wider scope for understanding the overall distribution law and management of reservoirs.
With the development of remote sensing technology, human beings have entered an era of remote sensing big data. The Google Earth Engine (GEE) cloud platform can easily obtain and process the data needed for research, which changes the traditional mode of remote sensing data acquisition, processing, and application [17]. The GEE cloud platform stores massive Landsat, Sentinel, and other datasets. Users can view and process long-time series as well as large-scale data in real time on the GEE cloud platform. At the same time, the data can be uploaded to the cloud without being limited by time and space. The GEE cloud platform has played a role in high-resolution environmental monitoring on a global scale, such as land cover [18], forests [19], coastlines [20], water bodies [21,22], and rivers [23]. The distribution of reservoirs has strong spatial differentiation, and the analysis methods based on spatial characteristics such as spectrum analysis [24] and the grid cells method [25,26] can effectively reveal the spatiotemporal evolution pattern of reservoirs. Among them, the grid cells method can quantitatively reflect the overall and partial changes in the reservoir space within a certain period, which is an effective means of expressing the spatial change pattern [27]. In terms of driving factor analysis, methods such as the Logistic regression model [28], grey correlation degree [29], geographically weighted regression [30], and GeoDetector [31,32] have been widely used and achieved good results. Among them, by establishing the statistical relationship between variables [33], GeoDetector can analyze the possible causal relationship. Moreover, it is widely used in all kinds of research because it is easy to operate and less constrained by samples [34].
The northern slope of the Tianshan Mountains (NSTM) is the core area driving the economic and social development of Xinjiang. However, it faces a series of problems such as water shortages, an uneven distribution of surface water resources in time and space, and a fragile ecological environment, seriously hindering the economic development of this area. Reservoirs can regulate runoff, store floods, and replenish drought, meaning that natural water can better meet the requirements of the local water use sector in terms of time and space, and so many reservoirs have been built on the NSTM to solve those problems. With the increasing number of reservoirs, the natural river system in this area has gradually evolved into an artificial runoff regulation system composed of reservoirs. The system has a great impact on the local eco-environmental benefits and socio-economic benefits [35], and studying the temporal and spatial evolution of this series of reservoirs is the basis of quantitative analysis of the impact of this system on ecological and environmental benefits and social and economic benefits. However, most of the previous studies only focused on the utilization of water resources in this area [36,37], and research on the temporal and spatial evolutionary processes of this series of reservoirs in this area is still lacking. Therefore, it is of great significance to study the temporal and spatial evolution process and driving forces of these reservoirs for the sustainable development of the ecology and social economy in this area.
The main objectives of this study are: (1) Using remote sensing images to analyze the change process of the reservoir area and quantity in the NSTM from 1990 to 2020; (2) Exploring the regularities of distribution for reservoirs via the spatial analysis method; (3) Quantifying the roles of natural geographical conditions and human activities in driving the changes in reservoirs on the NSTM by GeoDetector. This study can provide a theoretical basis and data support for the construction of water conservancy projects and water resource planning in the region.
2. Materials and Methods
2.1. Study Area
The NSTM is located in the south of the Junggar Basin in the Xinjiang Uygur Autonomous Region, with geographical coordinates of 42°41′~47°14′ N and 79°53′~96°23′ E. It is adjacent to the Gurbantunggut Desert in the north, with high terrain in the south and low terrain in the north, with a temperate continental climate, an annual average temperature of 7.3 °C, and annual average precipitation of 184.45 mm. Its total resident population accounts for 42% of the total resident population in Xinjiang, and its GDP accounts for 62% of the total in Xinjiang. It is the core area driving the economic and social development of Xinjiang as a whole. In order to facilitate the analysis of the spatial heterogeneity of reservoirs in the NSTM, this study divided the region into western, middle, and eastern sections based on county boundaries. Among them, the western section starts from Wenquan County in the west and ends in Karamay City in the east; the middle section starts from Kuitun City in the west and ends in Wujiaqu City in the east; the eastern section starts from Urumqi County in the west and ends in Hami City in the east. The geographical location and segmental boundaries of the NSTM are shown in Figure 1.
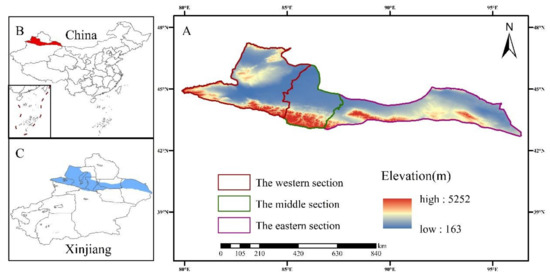
Figure 1.
Geographical location of the northern slope of the Tianshan Mountains (NSTM). (A) Segmental boundaries and elevation of the NSTM. (B) The location of the study area on the map of China. (C) The location of the study area on the map of Xinjiang in China.
2.2. Data Sources and Methodology
The data used in this study mainly include remote sensing image data, topographic data, and socio-economic data. Remote sensing image data were obtained from the Landsat5 TM/MSS, Landsat7 ETM+, and Landsat8 OLI (Surface Reflectance Tier 1, SRT1) products from the Google Earth Engine cloud platform (https://earthengine.google.com) (accessed on 20 October 2022) and images were selected based on April to June when the cloudiness of single-scene images is less than 20%. Areas that are greatly affected by clouds and areas that have no suitable images during this period were supplemented by images of the same period in adjacent years. The remote sensing image data used in this study are shown in Table 1. Topographic data included elevation, slope, and river. The digital elevation model (DEM) came from the geospatial data cloud (http://www.gscloud.cn/) (accessed on 15 October 2022), and the spatial resolution is 30 m. Slope data were calculated using the ArcGIS 3D analysis tool based on DEM data. The river data came from the river distribution data extracted by the Resource and Environment Science and Data Center, Chinese Academy of Sciences (https://www.resdc.cn/) (accessed on 20 November 2022) based on DEM. Socio-economic data included the grid data of GDP and population spatial distribution and cultivated land data, among which the grid data of GDP and population spatial distribution came from the Resource and Environment Science and Data Center, Chinese Academy of Sciences (https://www.resdc.cn/) (accessed on 20 November 2022), and the spatial resolution is 1 km. Due to the lack of data in 1990, the data in 1995 were used instead, and the data were collected every 10 years after that. Cultivated land data came from the Statistical Yearbook of Xinjiang and the Statistical Yearbook of Xinjiang Production and Construction Corps [38], with a time span of 1990–2020 and a period of every 10 years.

Table 1.
The table of remote sensing image data.
2.3. Methods for Extracting Reservoir Information
In order to extract the reservoirs in the NSTM, this study used the massive Landsat archived datasets in GEE for programming through the online platform programming interface, namely the Landsat TM/MSS, Landsat ETM+, and Landsat OLI (Surface Reflectance Tier 1, SRT1) series products, after radiation correction and geometric correction. The images were screened to show the remote sensing image datasets with less than 20% cloud cover in the western, middle, and eastern sections of the NSTM in 1990, 1995, 2000, 2005, 2010, 2015, and 2020. The remote sensing image datasets were preprocessed via geometric correction and radiation correction. Strip restoration was performed using the focus statistics and fusion function for 2005 data alone, and then all images meeting the temporal and spatial requirements in the study area were stitched according to their median values using the image mosaic function, and finally, the remote sensing image data of the study area were cropped using the cropping function [39]. The workflow diagram is shown in Figure 2 [40], and photographs of some reservoirs in the study area are shown in Figure 3 [41].
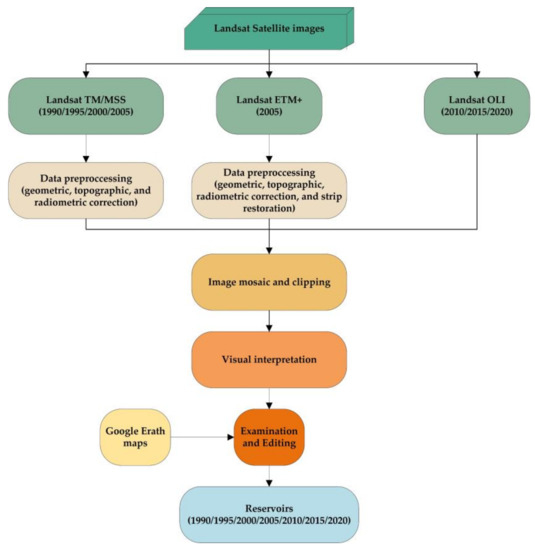
Figure 2.
The workflow diagram.
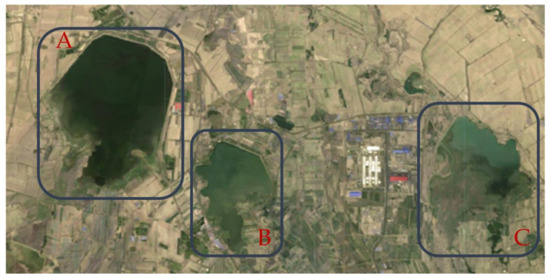
Figure 3.
Aerial photograph of some reservoirs (Google Earth 11 May 2020). (A) Moguhu Reservoir. (B) Daquangou Reservoir. (C) Jiahezi Reservoir.
In ArcGIS 10.2, the preprocessed remote sensing image data were combined with Google Earth maps and statistical data to extract the area spots of the reservoirs by visual interpretation in the past seven years. Considering the resolution of remote sensing data, to ensure the extraction accuracy of reservoirs, this study did not consider reservoirs with a water surface area below 0.01 km2. The historical data of Google Earth were updated periodically to meet the requirements of accuracy verification in this study [42]. The accuracy of reservoir extraction was verified by comparing the random points generated in and around reservoirs with the historical images of Google Earth. A total of 522 random points were generated in and around reservoirs with area ≥ 10 km2, 659 in and around reservoirs with 1 km2 < area ≤ 10 km2, and 723 in and around reservoirs with area ≤ 1 km2, a total of 1904 random points were generated. The evaluation results are shown in Table 2. According to the evaluation results, the overall accuracy of the classification results of reservoir water surface is 97.26%, and Kappa coefficient is 0.9438. The accuracy of the classification results of reservoirs with area ≤ 1 km2 is 96.27%, and Kappa coefficient is 0.9253. The accuracy of the classification results of reservoir with 1 km2 < area ≤ 10 km2 is 97.42%, and the Kappa coefficient is 0.9477. The accuracy of the classification results of reservoirs with area ≥ 10 km2 is 98.08%, and Kappa coefficient is 0.9587. It shows that extraction accuracy of reservoirs is high and can be further analyzed.
Table 2.
The results of classification accuracy evaluation.
2.4. Spatial and Temporal Change Analysis Model of Reservoirs
In order to quantitatively describe the intensity and rate of reservoir area and quantity changes in different periods on the NSTM, two indicators, the rates of change in reservoir area and number, were introduced. The calculation formulas are shown in Formulas (1) and (2).
where denotes the rate of change in reservoir area during the study period; and are the reservoir area at the beginning and end of the study period, respectively; denotes the rate of change in reservoir number during the study period; and and is the number of reservoirs at the beginning and end of the study period, respectively.
Because reservoirs are fragmented and scattered in the study area, it is difficult to reflect the change in reservoir is very small, it is not accurately reflected in the distribution map of the study area. The grid cells method can show more detailed information while reflecting the overall distribution characteristics of the data by combining the information within the grid for spatial analysis [43]. Therefore, to determine the intensity and spatial evolution pattern of changes in the reservoir area, the grid cells method was used to construct a grid covering the entire study area. To balance the visualization effect and analysis accuracy, the size of each grid was determined to be 3 km×3 km after several trials, and the attribute value of the grid was the degree of change in the reservoir area in the grid during the study period. The degree of change in reservoir area can be expressed by Equation (3).
where represents the degree of change in the area of the reservoirs in the i-th grid during the study period, while and represents the area of the reservoirs in the i-th grid at the beginning and end of the research period, respectively.
Nuclear density can effectively reflect the spatial aggregation of elements [44]. The basic principle of nuclear density analysis is that each centroid is covered with a smooth surface, and the surface value is highest at the position where the centroid is located and decreases as the distance from the centroid increases, the surface value is zero at the position where the distance is equal from the centroid to the search radius, the data points close to the centroid are given higher weights, and vice versa, and the estimated density of each point is the weighted average density of all points in the region. The aggregation degree of reservoirs can be expressed by Equation (4) [45,46,47,48]. In this study, ArcGIS 10.2 software was used to implement this operation. In this study, ArcGIS 10.2 software was used to realize this operation, and the aggregation degree of reservoirs was divided into six grades according to the natural discontinuity method.
where is the nuclear density of at any point in space; is the weight of the study object ; is the distance between the spatial point and the research object ; is the bandwidth of the selected rule area (); and is the number of study subjects within the range of bandwidth .
2.5. Analysis of the Drivers of Change in Reservoirs
In order to analyze the driving factors of change in reservoir area, this study used GeoDetector to analyze the driving factors. This is a statistical method that can detect spatial variability and reveal its drivers [34]. The principle assumes that something has spatial differentiation, and an environmental factor also has spatial differentiation and is similar to the spatial differentiation of the thing, which means that the environmental factor has a significant impact on the spatial variation of the thing. Therefore, this study used GeoDetector to analyze the driving factors of temporal and spatial changes in the reservoir area on the NSTM. The calculation method is shown in Formula (5).
where is the influence of the factor on the spatial differentiation of the reservoir area; is the number of subregions of the detection factor; is the factor stratification; and are the total number of samples and the number of samples in the region , respectively; and and are the variance of the total region and the variance of the region , respectively. The range of value is [0, 1], and the higher the value, the stronger the explanatory force of the influence factor on the change in reservoir area, and vice versa.
In addition, this study used the interaction detector in the GeoDetector model to assess the explanatory power of the interaction of multiple different drivers relative to a single driver on the dependent variable. Taking the reservoir area contained in each grid in the grid unit analysis as the dependent variable of the GeoDetector, the driving factors of the change in reservoir area in each research period were analyzed by GeoDetector.
3. Results
3.1. Temporal Changes in Reservoirs in the NSTM
The spatial and temporal changes in reservoirs from 1990 to 2020 were obtained by extracting the reservoir spots in the western, middle, and eastern sections of the NSTM in 1990, 1995, 2000, 2005, 2010, 2015, and 2020, and overlaying these seven years of spots separately by region. Based on the extraction results of the reservoir spots on the NSTM, the area fields were added and calculated in ArcGIS 10.2 to obtain the reservoir area on the NSTM. The change process of reservoirs area on the NSTM from 1990 to 2020 is shown in Figure 4.
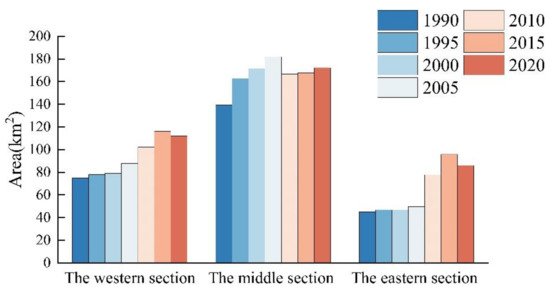
Figure 4.
The change process of reservoir area on the NSTM from 1990 to 2020.
As shown in Figure 4, the area of reservoirs on the NSTM shows an overall growth trend, from 259.32 km2 in 1990 to 370.23 km2 in 2020, with an overall growth rate of 42.77%. The largest growth rate of the reservoir area was 10.86% during the period of 1990–1995, indicating that this period was the fastest growth period of the reservoir area in the whole study period. The growth rate of the reservoir area slowed down and increased year by year during the period of 1995–2015, and the reservoir area showed negative growth during the period of 2015–2020. Combined with the increase in the number of reservoirs from 2015 to 2020 in Figure 5, it can be speculated that the reason for this is that mountain reservoirs with greater technical difficulty and deeper depth have replaced plain reservoirs with less technical difficulty and a large water surface area. In addition, the images demonstrate that the water surface area of the reservoirs shrank. Figure 6 shows the change rate of reservoir area in the overall NSTM and each section from 1990 to 2020. During the period of 1990–2000, the area of reservoirs in the middle section demonstrated an increasing trend and at a higher rate than in the western and eastern sections, when the growth rate of the reservoir area in the western and eastern sections was at a lower level. From 2000 onwards, the growth rate of the reservoir area in the middle section slowed down gradually, while the growth rate of the reservoir area in the western and eastern sections increased significantly, especially in the eastern section from 2005 to 2010. In particular, the area of the reservoirs in the eastern section increased by 27.95 km2 between 2005 and 2010, with a growth rate of 56.15%.
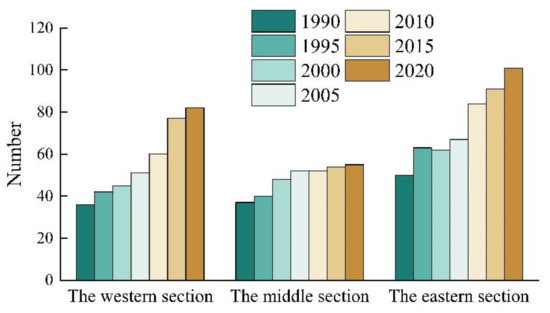
Figure 5.
The change process of reservoirs number on the NSTM from 1990 to 2020.
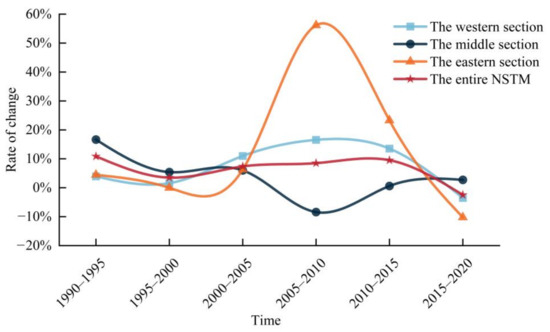
Figure 6.
Rate of change in reservoir area in the NSTM from 1990 to 2020.
As shown in Figure 5, the change in the number of reservoirs showed an increasing trend from 1990 to 2020, from 123 in 1990 to 238 in 2020, and the overall growth rate reached 93.50%. Figure 7 shows the change rate of reservoir number in the overall NSTM and each section from 1990 to 2020. Among them, the fastest growth rate of 17.89% was observed from 1990 to 1995, the growth rate of the number of reservoirs slowed down and increased year by year during the period of 1995–2010, and the growth rate decreased over time during the period of 2010–2020. It can be seen from Figure 5 that the increase in the number of reservoirs in the study area is mainly caused by the increase in the number of reservoirs in the west section and the east section. Combining Figure 4 and Figure 5, it can be seen that although the number of reservoirs in the middle section is smaller than in the other two sections, the area of the reservoirs is significantly larger than that of the other two sections, indicating that the reservoirs built in the middle section are mostly large or medium-sized reservoirs, the number of reservoirs in the west section and eastern section is higher than that of the middle section, but the area is smaller than that of the middle section, indicating that the reservoirs in the west section and eastern section are mainly small and medium. With the increasing population and the rapid development of agriculture in the west section and east sections, a large number of reservoirs have been built in this area to store water to ensure the safety of domestic and production water. For example, the Mohulu Reservoir and Kayinda Reservoir in the west section, and the Xingfu No. 1, No. 2, and No. 3 Reservoir in the east section have effectively alleviated the shortage of local agricultural water and solved the difficulty of drinking water for local people and animals. Just because of the massive construction of small- and medium-sized reservoirs in the west and east sections, the number of reservoirs in the study area shows an overall increasing trend.
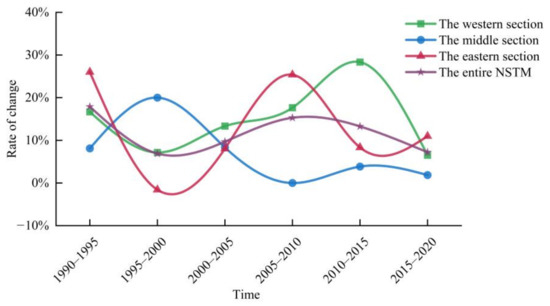
Figure 7.
Rate of change in reservoir number in the NSTM from 1990 to 2020.
3.2. Spatial Changes in Reservoirs in the NSTM
The spatial pattern of the change rate for reservoir area in three research periods and 30 years on the NSTM is shown in Figure 8. It can be seen from Figure 8a that the areas where the reservoir area increased from 1990 to 2000 were mainly located in the middle of the NSTM, and there were fewer areas with reduced reservoir area. The extent of growth in the area of the reservoirs from 2000 to 2010 was more diffuse than in the previous period, spreading to the western section and the western part of the eastern section. The reduced areas increased compared with the previous period, which shows that the construction of reservoirs was more active during this period (Figure 8b). From 2010 to 2020, the change rate of reservoir area in each section of the NSTM decreased, indicating that the construction of reservoirs on the NSTM tends to be stable (Figure 8c).
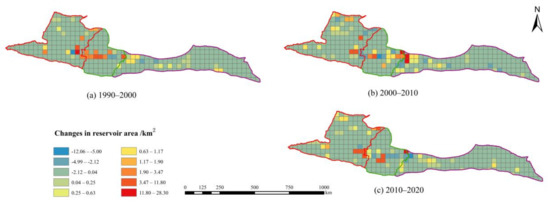
Figure 8.
Spatial pattern of change rate for reservoir area on the NSTM from 1990 to 2020.
The changes in the degree of aggregation in the reservoir area on the NSTM from 1990 to 2020 are shown in Figure 4. Overall, the spatial dynamics of the reservoir area on the NSTM became more decentralized from 1990 to 2020, extending and spreading around multiple aggregation cores, respectively. In 1990, the reservoirs in the NSTM were mainly concentrated in four locations, showing a weaker four-core aggregation trend, namely the northwestern part of the western section, including Emin County and Tacheng County, the eastern part of the western section, including Kuitun City, the middle and western parts of the eastern section, including Shihezi City, Hutubi County, Changji City, Wujiaqu City, and Urumqi City, and Jimsar County and Qitai County in the eastern section. Among them, the reservoirs in the western part of the eastern section had the highest degree of concentration, so the western part of the eastern section was the main core. In 2000, reservoirs in the entire NSTM region spread around the core in all directions, and new weakly aggregated cores emerged beyond the four aggregated cores mentioned above. As can be seen from Figure 9b, the degree of aggregation in the reservoir area on the NSTM increased considerably between 1990 and 2000. In 2010, The growth phenomenon of the four-core aggregation of reservoirs continued to enhance, and due to the diffusion effects, the two aggregation cores in the eastern and middle parts of the western section produced the phenomenon of interconnection, and the newly emerged weak aggregation cores were also expanding. In 2020, the degree of aggregation in the reservoir area in the NSTM was further strengthened, and the aggregation core was further expanded.
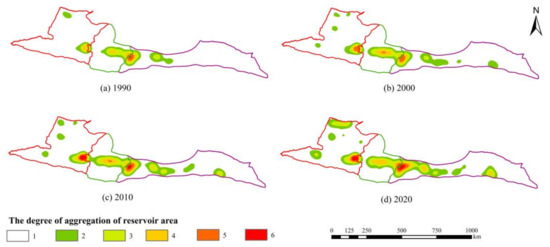
Figure 9.
Degree of aggregation of reservoir area on the NSTM from 1990 to 2020.
Based on a comprehensive analysis of the changes in the degree of aggregation in the reservoir area in the NSTM from 1990 to 2020, it can be seen that the reservoir area increased, the degree of aggregation was strengthened, and the aggregation cores of the reservoirs gradually expanded horizontally from the middle section to the western and eastern sections of the NSTM. The reason for this is that the middle section of the NSTM is abundant in water resources and is the core of the economic development of the entire NSTM, and with the continuous development of the economy of the western and eastern sections, the construction of reservoirs was promoted there.
3.3. Analysis of the Driving Forces of Spatiotemporal Changes in Reservoirs on the NSTM
The terrain is the key factor affecting the development and construction of reservoirs. At the same time, with the development of the social economy, the regulation of water storage by human beings and the development and construction of reservoirs are the main factors affecting the change in the reservoir area. The NSTM is an important agricultural development area in Xinjiang, and one of the important sources of agricultural water is the reservoir. Therefore, the cultivated land data were selected as the representative to analyze the change in the reservoir area. Given the comprehensive influence of natural factors and human activities on the change in the reservoir area, and considering the availability of driving factors and the characteristics of the study area, the driving factors affecting the change in the reservoir area were selected (Table 3). The natural discontinuity method can group data appropriately according to their intrinsic properties, so this study used this method to discretize the driving factors. Among them, the GDP and average population in social and economic factors were based on the grid data of GDP spatial distribution and the grid data of population spatial distribution, respectively, and the average GDP value and average population value in each grid in the grid cell method mentioned above were extracted and divided into 10 levels. The cultivated land area values were extracted based on the statistical data of the county, and were divided into 10 levels, Terrain factors were based on the spatial statistics function of ArcGIS 10.2 software, which used DEM data to extract the average elevation value in each grid, calculated the average slope value in each grid based on DEM data, calculated the river network density based on water vector data, and extracted the river network density value in each grid, which was divided into 10 levels. The driving factor corresponding to the center point of each grid was extracted as the independent variable X and the change degree of reservoir area was extracted as the dependent variable Y, and X, and Y were input into GeoDetector for matching calculation.
Table 3.
Indicators of drivers of spatiotemporal changes in reservoirs on the NSTM.
3.3.1. Differentiation and Factor Detection
The main driving forces affecting the spatial and temporal variation of reservoir area on the NSTM from 1990 to 2020 were detected by using the differentiation and factor detectors in the GeoDetector for GDP, average population, cultivated land area, average elevation, average slope, and river network density. The results are shown in Figure 10. In the past 30 years, the spatial distribution of the reservoir area on the NSTM was affected by socio-economic factors and topographic factors, but there were differences in the influence of different driving factors on the temporal and spatial changes in the reservoir area at different times.
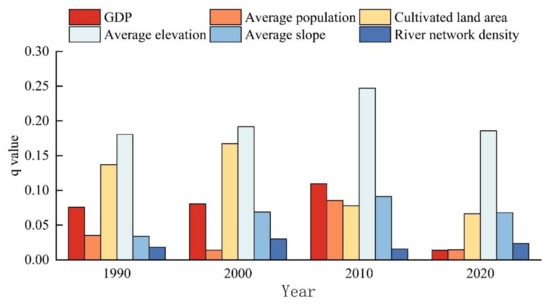
Figure 10.
Results of driver detection of spatiotemporal changes in reservoir area on the NSTM from 1990 to 2020.
Overall, from 1990 to 2020, the magnitude relationship of the driving factors affecting the spatial differentiation of reservoir area on the NSTM was average elevation (0.201) > cultivated land area (0.112) > GDP (0.070) > average slope (0.065), average population (0.037) > river network density (0.022). In 1990 and 2000, the drivers of spatial changes in reservoir area on the NSTM were relatively stable, with the mean explanatory power q values in the top three positions being average elevation, cultivated land area, and GDP. In 2010, the mean explanatory power q values in the top three positions were average elevation, GDP, and average slope. In 2020, the mean explanatory power q values in the top three positions were average elevation, average slope, and cultivated land area. From 1990 to 2020, the influence of various driving factors on the spatial differentiation of reservoir area on the NSTM showed a fluctuating downward trend, indicating that the construction process of the reservoirs on the NSTM gradually stabilized.
3.3.2. Interaction Detection
In this study, the interaction detection in the GeoDetector model was used to assess the explanatory strength of the interaction of multiple different drivers relative to a single driver for the dependent variable. The results are shown in Figure 11; the interaction of all factors was characterized by two-factor enhancement or nonlinear enhancement, suggesting that the changes in reservoir area on the NSTM were the result of the joint action of multiple factors. From 1990 to 2020, the average interaction q-values affecting the spatial differentiation of reservoir area on the NSTM were arranged as the top three factor combinations, which were the average elevation and cultivated land area (0.374), the average elevation and GDP (0.325), and the average elevation and average population (0.319). Factor interactions have different effects on explanatory power from year to year. In 1990, the interaction between GDP and average elevation was the strongest, with an explanatory power q value of 0.572, followed by the interaction between cultivated land area and average elevation, with an explanatory power q value of 0.528. In 2000, the interaction between cultivated land area and the average population was the strongest, with an explanatory power q value of 0.433, followed by the interaction between GDP and average population, with an explanatory power q value of 0.374. In 2010, the interaction between average elevation and river network density was the strongest, with an explanatory power q value of 0.382, followed by the interaction between average elevation and cultivate land area, with an explanatory power q value of 0.370. In 2020, the interaction between average elevation and cultivate land area was the strongest, with an explanatory power q value of 0.299, followed by the interaction between average elevation and river network density, with an explanatory power q value of 0.256. In conclusion, the effect of multi-factor interaction on the change in reservoir area was more significant, which can fully explain the fact that changes in reservoir area were the result of the interaction of multiple factors.
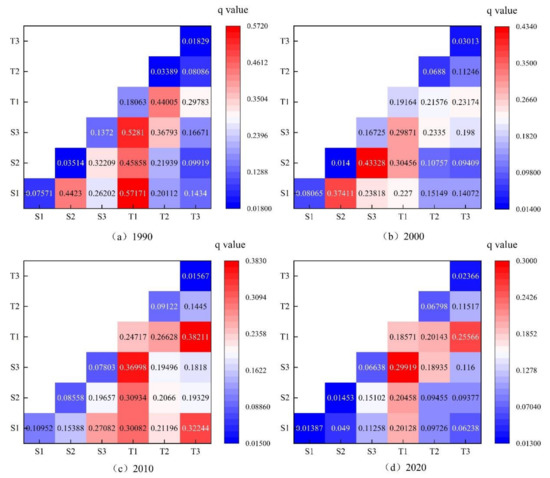
Figure 11.
Interaction detection results of drivers of changes in reservoir area on the NSTM from 1990 to 2020.
4. Discussion
The reservoirs on the NSTM are numerous and widely distributed, but previous studies mainly focus on the change characteristics of a particular reservoir, and there are few studies on the distribution of and changes in reservoirs in the entire NSTM region. Therefore, this study obtained the spatial and temporal variation characteristics of reservoirs on the NSTM from 1990 to 2020 based on the interpreted remote sensing image data. The results showed that from the perspective of temporal variation, the number of reservoirs on the NSTM was in a growth period from 1990 to 2000, with a growth rate of 26.02%. From 2000 to 2010, the growth rate continued to increase, with a growth rate of 26.45%. From 2010 to 2020, the growth rate picked up, with a growth rate of 21.94%, and the construction of reservoirs was stable. Li et al. summarized achievements in the construction of reservoirs in Xinjiang [49], and their research mentioned that the construction of reservoirs in the northern part of Xinjiang was on the rise from 1990 to 2020, reaching a climax of reservoir construction in 2010 to 2020. There is a slight discrepancy with the results of this study because the above article did not include the reservoirs of the Xinjiang Production and Construction Corps (XPCC). The XPCC can be viewed as an independent system nested in Xinjiang, covering the entire territory of Xinjiang except for Kizilsu Kirgiz Autonomous Prefecture. According to the statistics of the XPCC, the number of reservoirs built by the XPCC on the NSTM increased faster between 1990 and 2010 than between 2010 and 2020. Therefore, the growth rate of the number of reservoirs in this study rebounded from 2010 to 2020. From the perspective of spatial change, most of the reservoirs were in the middle section of the NSTM and gradually spread to the east and west, which is consistent with the economic development and distribution of the NSTM [50]. In the early stage of the research period, the economic development level of the middle part of the NSTM was higher than that of the east and west parts, and the ability to build reservoirs was also higher, so there were more reservoirs in the middle part. With the introduction of national policies such as “China’s Western Development Strategy” and the “One Belt One Road policy”, the regional development of the western and eastern sections of the NSTM has received attention, and the level of economic development has been rapidly improved, so the number of reservoirs in the eastern and western sections has gradually increased.
In terms of driving force analysis, using the SEM model, Du et al. [13] concluded that the annual mean precipitation, annual mean temperature, and agricultural water use were the leading factors of water body area change. Using SPSS software to conduct Pearson correlation analysis, Lai et al. [8] concluded that the change in the water area of Miyun Reservoir was highly positively correlated with precipitation, and weakly negatively correlated with Beijing’s GDP, secondary and tertiary industries. Luo et al. [15] argued that climatic factors and agricultural activities are important factors affecting the water storage area and quantity of regional lakes and reservoirs/ponds. All of the above studies illustrated the important influence of climatic factors on the change in the water body area. However, when considering the selection of driving factors, this study did not consider climate factors as the driving factors for the change in reservoir area on the NSTM, because the NSTM belongs to a continental arid climate with little precipitation, having little influence on the change in reservoir area on the NSTM. The role of agricultural activities for the change in reservoir area on the NSTM mentioned in the above study is consistent with this study.
In order to further study the influence of elevation on the distribution of reservoirs on the NSTM, according to the topographic characteristics and actual situation of elevation of the NSTM, the DEM of the NSTM was reclassified into five levels, namely < 500 m (level I), 500–1000 m (level II), 1000–1500 m (level III), 1500–2000 m (level IV), and >2000 m (level V), and overlaid with the reservoir area in 2020. The resulting distribution of the reservoirs on the NSTM at different elevation levels is shown in Figure 12.
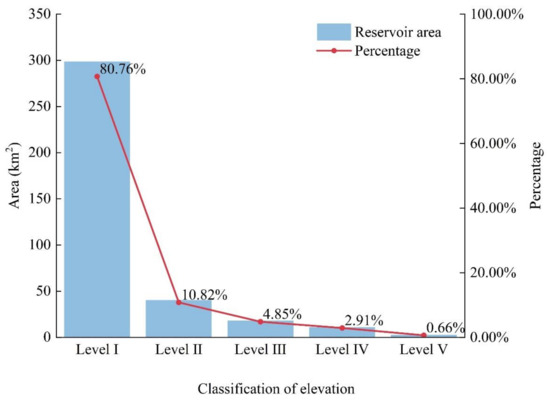
Figure 12.
Relationship between reservoir area and average elevation.
It can be seen from Figure 13 that the distribution of reservoirs on the NSTM has obvious regularity with average elevation, showing a trend of a gradual reduction in the number of reservoirs with an increase in altitude. The reservoirs are mainly distributed in the area below 500 m above sea level, and the reservoirs in this area account for 80.76% of the total reservoirs on the NSTM. The topography of the NSTM is high in the south and low in the north, from south to north, from the Tianshan Mountains to the Alluvial Plain and Gurbantunggut Desert, which are mainly composed of mountains, oases, and deserts, respectively [51]. Therefore, the reservoirs in the NSTM are mainly concentrated in the low-altitude areas in the middle. In the 1980s and 1990s, the Kizil Reservoir and the Uluwati Reservoir were built successively, which started the construction of large-scale mountain reservoirs [52]. A large number of large mountain reservoirs were built one after another, so there are reservoirs distributed above an elevation of 500 m. Combining the characteristics of water resources in arid areas and the requirements of rational allocation and efficient utilization, Xinjiang established a mode for the development and utilization of water resources with the construction of mountainous reservoirs as the lead and the optimal combination of projects [53]. Therefore, the construction of reservoirs on the NSTM at a high altitude will be more important in the future.
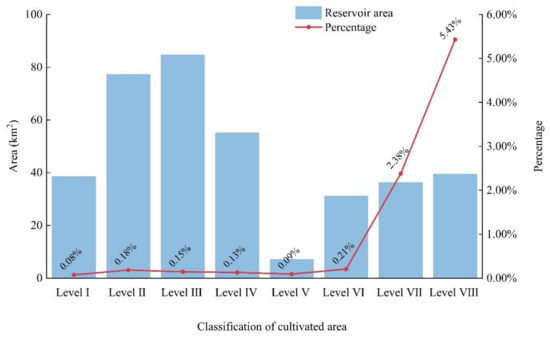
Figure 13.
Relationship between reservoir area and cultivated land area.
In order to further study the influence of the distribution of cultivated land area on the distribution of reservoirs on the NSTM, this study based on ArcGIS 10.2 software, reclassified the NSTM according to the area of cultivated land in 2020, and divided it into eight levels, namely < 5 × 10⁴ hm2 (level I), 5 × 10⁴–10 × 104 hm2 (level II), 10 × 104–15 × 104 hm2 (level III), 15 × 104–25 × 104 hm2 (level IV), 25 × 104–50 × 104 hm2 (level V), 50 × 104–100 × 104 hm2 (level VI), 100 × 104–200 × 104 hm2 (level VII), >200 × 104 hm2 (level VIII), and overlaid these levels with the reservoir area in 2020. The resulting distribution of the reservoirs on the NSTM in different cultivated land area levels is shown in Figure 13.
It can be seen from Figure 13 that the distribution of reservoirs on the NSTM showed an obvious correlation with the distribution of cultivated land area. In general, with the increase in cultivated land area, the ratio of reservoirs to cultivated land area in the region also increases. In areas with less than 100 × 104 hm2 of cultivated land area, with the increase in cultivated land area, the ratio of reservoirs to the cultivated land area does not change much, because these areas are dominated by secondary and tertiary industries as a whole, and there is relatively little water used for agriculture. In contrast, in areas with more than 100 × 104 hm2 of cultivated land area, the proportion of reservoir construction is high. Among them, the areas where the cultivated land area belongs to level VII and level VIII mainly include Shihezi City, Wujiaqu City, and Kuitun City, which are located in the center of the NSTM and are the core of agricultural development on the NSTM. Compared with other areas, although the scale of these areas is small, the construction rate of reservoirs has not decreased, because these areas undertake the main task of agricultural development, and with the development of agriculture, the economic level was constantly improving, and it had the economic conditions to build reservoirs.
5. Conclusions
In this study, the spatial and temporal evolution characteristics of reservoirs in the NSTM in the past 30 years were analyzed via the grid cells method and the nuclear density analysis method, and the mechanism by which natural geographical conditions and socio-economic development influence the spatial and temporal evolution of reservoirs in the NSTM was analyzed using GeoDetector. This study is expected to provide useful references for the construction of water conservancy projects and water resources planning in the NSTM, with the following main conclusions.
(1) In terms of temporal change, the reservoir area on the NSTM expanded during the period of 1990–2020, and the reservoir area increased from 259.32 km2 in 1990 to 370.23 km2 in 2020, with a growth rate of 42.77%. During the same period, the number of reservoirs increased from 123 to 238, with a growth rate of 93.50%.
(2) In terms of spatial change, the distribution of reservoirs in agglomeration areas on the NSTM gradually developed horizontally from the middle section with rapid economic development to the western and eastern sections, a cluster pattern of coexistence and interconnection of cores emerged, and the correlation between each core gradually increased.
(3) The analysis of driving factors showed that socioeconomic factors and topographic factors jointly drive the temporal and spatial changes in the reservoir area on the NSTM. The main driving factors affecting the spatial differentiation of reservoir area on the NSTM from 1990 to 2020 were average elevation (0.201), cultivated land area (0.112), and GDP (0.070). The interactive superposition of multiple factors promotes the spatial differentiation of the reservoir area. The top three factor combinations of average interaction q values are average elevation ∩ cultivated land area (0.374), average elevation ∩ GDP (0.325), and average elevation ∩ average population (0.319).
This study can not only provide a useful reference for the construction and sustainable management of reservoirs in the NSTM but also be extended to the study of the temporal and spatial evolution of reservoirs in other regions. However, there are still some things to be improved in this study. For example, the time span of this paper is insufficient, and the selected driving factors are incomplete. In future research work, we will consider expanding the time span and increasing the selection range of driving factors, so as to realize the change and driving force analysis of reservoirs in a longer time scale.
Author Contributions
Conceptualization, B.L. and G.Y.; data curation, T.W.; formal analysis, Y.S.; methodology, B.L.; project administration, B.L. and G.Y.; resources, J.W.; supervision, B.L.; validation, Y.D.; visualization, Y.S.; writing—original draft, Y.S.; writing—review and editing, Y.D., H.H. and T.W. All authors have read and agreed to the published version of the manuscript.
Funding
This work was supported by the third scientific expedition project in Xinjiang (2021xjkk0804, 2022xjkk0902), China Xin Jiang Group Science and Technology Tackling Plan Project (2021AB021), Shihezi University High-Level Talent Research Initiation Project (RCZK202026).
Institutional Review Board Statement
Not applicable.
Informed Consent Statement
Not applicable.
Data Availability Statement
The code used in the GEE cloud platform is as follows: https://code.earthengine.google.com/cb117816b4e847e5ad7c562176a013c8 (accessed on 20 October 2022), https://code.earthengine.google.com/7a4b3a9cc7362602dffbdc5b133c1670 (accessed on 20 October 2022).
Acknowledgments
The authors appreciate the editors and reviewers for using their precious time to review this paper and improve its quality.
Conflicts of Interest
The authors declare no conflict of interest.
References
- Shinohara, R.; Tanaka, Y.; Kanno, A.; Matsushige, K. Relative impacts of increases of solar radiation and air temperature on the temperature of surface water in a shallow, eutrophic lake. Hydrol. Res. 2021, 52, 916–926. [Google Scholar] [CrossRef]
- Woolway, R.I.; Weyhenmeyer, G.A.; Schmid, M.; Dokulil, M.T.; de Eyto, E.; Maberly, S.C.; May, L.; Merchant, C.J. Substantial increase in minimum lake surface temperatures under climate change. Clim. Chang. 2019, 155, 81–94. [Google Scholar] [CrossRef]
- Li, X.; Wang, X.; Babovic, V. Analysis of variability and trends of precipitation extremes in Singapore during 1980–2013. Int. J. Climatol. 2018, 38, 125–141. [Google Scholar] [CrossRef]
- Li, X.; Zhang, K.; Gu, P.R.; Feng, H.T.; Yin, Y.F.; Chen, W.; Cheng, B.C. Changes in precipitation extremes in the Yangtze River Basin during 1960–2019 and the association with global warming, ENSO, and local effects. Sci. Total Environ. 2021, 760, 13. [Google Scholar] [CrossRef] [PubMed]
- Singh, V.; Jain, S.K.; Shukla, S. Glacier change and glacier runoff variation in the Himalayan Baspa river basin. J. Hydrol. 2021, 593, 17. [Google Scholar] [CrossRef]
- Terrier, S.; Bieri, M.; Jordan, F.; Schleiss, A.J. Impact of glacier shrinkage and adapted hydropower potential in the Swiss Alps. Houille Blanche-Rev. Int. 2015, 101, 93–101. [Google Scholar] [CrossRef]
- Zhang, Q.; Zhang, Z.J.; Shi, P.J.; Singh, V.P.; Gu, X.H. Evaluation of ecological instream flow considering hydrological alterations in the Yellow River basin, China. Glob. Planet. Chang. 2018, 160, 61–74. [Google Scholar] [CrossRef]
- Lai, Y.; Zhang, J.; Song, Y.; Cao, Y. Comparative Analysis of Different Methods for Extracting Water Body Area of Miyun Reservoir and Driving Forces for Nearly 40 Years. J. Indian Soc. Remote Sens. 2020, 48, 451–463. [Google Scholar] [CrossRef]
- Lai, Y.Q.; Zhang, J.; Song, Y.Y.; Li, W.W. Analysis of reservoir environment evolution from 2000 to 2020: A case study in the Guanting Reservoir, China. Ecol. Indic. 2022, 134, 13. [Google Scholar] [CrossRef]
- Li, J.F.; Wang, J.W.; Yang, L.Y.; Ye, H.P. Spatiotemporal change analysis of long time series inland water in Sri Lanka based on remote sensing cloud computing. Sci. Rep. 2022, 12, 9. [Google Scholar] [CrossRef]
- Lehner, B.; Liermann, C.R.; Revenga, C.; Vörösmarty, C.; Fekete, B.; Crouzet, P.; Döll, P.; Endejan, M.; Frenken, K.; Magome, J.; et al. High-resolution mapping of the world’s reservoirs and dams for sustainable river-flow management. Front. Ecol. Environ. 2011, 9, 494–502. [Google Scholar] [CrossRef]
- Donchyts, G.; Winsemius, H.; Baart, F.; Dahm, R.; Schellekens, J.; Gorelick, N.; Iceland, C.; Schmeier, S. High-resolution surface water dynamics in Earth’s small and medium-sized reservoirs. Sci. Rep. 2022, 12, 13776. [Google Scholar] [CrossRef] [PubMed]
- Du, B.J.; Wang, Z.M.; Mao, D.H.; Li, H.Y.; Xiang, H.X. Tracking Lake and Reservoir Changes in the Nenjiang Watershed, Northeast China: Patterns, Trends, and Drivers. Water 2020, 12, 1108. [Google Scholar] [CrossRef]
- Wang, R.M.; Pan, L.; Niu, W.H.; Li, R.M.; Zhao, X.Y.; Bian, X.Q.; Yu, C.; Xia, H.M.; Chen, T.Z. Monitoring the spatiotemporal dynamics of surface water body of the Xiaolangdi Reservoir using Landsat-5/7/8 imagery and Google Earth Engine. Open Geosci. 2021, 13, 1290–1302. [Google Scholar] [CrossRef]
- Luo, L.; Mao, D.H.; Wang, Z.M.; Zhang, B.; Ren, C.Y.; Jia, M.M. Analysis of dynamics and driving forces of lakes and reservoirs in western Songnen Plain. Trans. Chin. Soc. Agric. Eng. 2015, 31, 285–291. (In Chinese) [Google Scholar]
- Xu, Y.X.; Lian, Y.; Chen, X.M.; Mo, X.Q.; He, M.X. Temporal and spatial variation characteristics of the water body of Beidagang Reservoir and the driving force factors. J. Tianjin Norm. Univ. (Nat. Sci. Ed.) 2021, 41, 55–62. (In Chinese) [Google Scholar] [CrossRef]
- Gorelick, N.; Hancher, M.; Dixon, M.; Ilyushchenko, S.; Thau, D.; Moore, R. Google Earth Engine: Planetary-scale geospatial analysis for everyone. Remote Sens. Environ. 2017, 202, 18–27. [Google Scholar] [CrossRef]
- Phan, T.N.; Kuch, V.; Lehnert, L.W. Land Cover Classification using Google Earth Engine and Random Forest Classifier-The Role of Image Composition. Remote Sens. 2020, 12, 2411. [Google Scholar] [CrossRef]
- Venkatappa, M.; Sasaki, N.; Anantsuksomsri, S.; Smith, B. Applications of the Google Earth Engine and Phenology-Based Threshold Classification Method for Mapping Forest Cover and Carbon Stock Changes in Siem Reap Province, Cambodia. Remote Sens. 2020, 12, 3110. [Google Scholar] [CrossRef]
- Luijendijk, A.; Hagenaars, G.; Ranasinghe, R.; Baart, F.; Donchyts, G.; Aarninkhof, S. The State of the World’s Beaches. Sci. Rep. 2018, 8, 11. [Google Scholar] [CrossRef]
- Donchyts, G.; Baart, F.; Winsemius, H.; Gorelick, N.; Kwadijk, J.; van de Giesen, N. Earth’s surface water change over the past 30 years. Nat. Clim. Chang. 2016, 6, 810–813. [Google Scholar] [CrossRef]
- Pekel, J.F.; Cottam, A.; Gorelick, N.; Belward, A.S. High-resolution mapping of global surface water and its long-term changes. Nature 2016, 540, 418. [Google Scholar] [CrossRef] [PubMed]
- Allen, G.H.; Pavelsky, T.M. Global extent of rivers and streams. Science 2018, 361, 585–587. [Google Scholar] [CrossRef] [PubMed]
- Ye, Q.H.; Liu, G.H.; Tian, G.L.; Chen, S.L.; Huang, C.; Chen, S.P.; Liu, Q.S.; Chang, J.; Shi, Y. Geospatial-temporal analysis of land-use changes in the Yellow River Delta during the last 40 years. Sci. China Ser. D-Earth Sci. 2004, 47, 1008–1024. [Google Scholar] [CrossRef]
- Li, Z.L.; Bagan, H.; Yamagata, Y. Analysis of spatiotemporal land cover changes in Inner Mongolia using self-organizing map neural network and grid cells method. Sci. Total Environ. 2018, 636, 1180–1191. [Google Scholar] [CrossRef]
- Maimaitijiang, M.; Alimujiang, K. Spatial-temporal change of Urumqi urban land use and land cover based on grid cell approach. Trans. Chin. Soc. Agric. Eng. 2018, 34, 210–216. (In Chinese) [Google Scholar]
- Bagan, H.; Yamagata, Y. Analysis of urban growth and estimating population density using satellite images of nighttime lights and land-use and population data. GISci. Remote Sens. 2015, 52, 765–780. [Google Scholar] [CrossRef]
- Chu, L.; Sun, T.C.; Wang, T.W.; Li, Z.X.; Cai, C.F. Evolution and Prediction of Landscape Pattern and Habitat Quality Based on CA-Markov and InVEST Model in Hubei Section of Three Gorges Reservoir Area (TGRA). Sustainability 2018, 10, 3854. [Google Scholar] [CrossRef]
- Zhang, Z.P.; Xia, F.Q.; Yang, D.G.; Huo, J.W.; Wang, G.L.; Chen, H.X. Spatiotemporal characteristics in ecosystem service value and its interaction with human activities in Xinjiang, China. Ecol. Indic. 2020, 110, 105826. [Google Scholar] [CrossRef]
- Duan, S.B.; Li, Z.L. Spatial Downscaling of MODIS Land Surface Temperatures Using Geographically Weighted Regression: Case Study in Northern China. IEEE Trans. Geosci. Remote Sens. 2016, 54, 6458–6469. [Google Scholar] [CrossRef]
- Zhang, J.; Yu, L.; Li, X.C.; Zhang, C.C.; Shi, T.Z.; Wu, X.Y.; Yang, C.; Gao, W.X.; Li, Q.Q.; Wu, G.F. Exploring Annual Urban Expansions in the Guangdong-Hong Kong-Macau Greater Bay Area: Spatiotemporal Features and Driving Factors in 1986–2017. Remote Sens. 2020, 12, 16. [Google Scholar] [CrossRef]
- Liu, Y.; Cao, X.; Li, T. Identifying Driving Forces of Built-Up Land Expansion Based on the Geographical Detector: A Case Study of Pearl River Delta Urban Agglomeration. Int. J. Environ. Res. Public Health 2020, 17, 1759. [Google Scholar] [CrossRef] [PubMed]
- Fan, S.D.; Liu, Z.H.; Zhu, M.B.; Zhang, M.M. Time series change and influencing factors of land use in Guangzhou city based on geodetector. Southwest China J. Agric. Sci. 2022, 35, 2276–2289. (In Chinese) [Google Scholar] [CrossRef]
- Wang, J.F.; Xu, C.D. Geodetector: Principle and prospective. Acta Geogr. Sin. 2017, 72, 116–134. (In Chinese) [Google Scholar]
- Li, J.; Liu, Y.; Liu, S.Y.; Peng, Z.X.; Wu, T. Main problems and countermeasures of reservoir dam construction in Xinjiang in the new period. Arid Land Geogr. 2020, 43, 1409–1416. (In Chinese) [Google Scholar]
- Guo, P.C.; Bao, A.M.; Yi, Q.X.; Wang, X.J.; Wang, Q.; Bai, Z.L. Water Footprint Characteristics in Evolution of Oasis and Desertification in an Arid Area—A Case Study of the Northern Slope of Tianshan Mountains, Xinjiang Wei Autonoumos. Bull. Soil Water Conserv. 2012, 32, 171–176. (In Chinese) [Google Scholar] [CrossRef]
- Chen, J.; Cao, L. Spatiotemporal Variability in Water-Use Efficiency in Tianshan Mountains (Xinjiang, China) and the Influencing Factors. Sustainability 2022, 14, 8191. [Google Scholar] [CrossRef]
- Xinjiang Yearbook; Xinjiang Yearbook Press: Urumqi, China, 2018; pp. 353–421. (In Chinese)
- Liu, J.T.; Li, Y.X.; Zhang, Y.; Liu, X.Q. Large-Scale Impervious Surface Area Mapping and Pattern Evolution of the Yellow River Delta Using Sentinel-1/2 on the GEE. Remote Sens. 2023, 15, 136. [Google Scholar] [CrossRef]
- He, S.T.; Wang, D.J.; Zhao, P.; Li, Y.; Lan, H.J.; Chen, W.L.; Jamali, A.A. A review and prospects of debris flow waste-shoal land use in typical debris flow areas, China. Land Use Pol. 2020, 99, 105064. [Google Scholar] [CrossRef]
- Jamali, A.A.; Tabatabaee, R.; Randhir, T.O. Ecotourism and socioeconomic strategies for Khansar River watershed of Iran. Environ. Dev. Sustain. 2021, 23, 17077–17093. [Google Scholar] [CrossRef]
- Hou, J.B.; Zhen, X.K.; Wang, M.; Wang, M.; Shang, Y.X.; Song, K.S. Remote Sensing Information Extraction and Pattern Analysis of Reservoirs in Northeast China. Wetl. Sci. 2017, 15, 582–587. (In Chinese) [Google Scholar] [CrossRef]
- Bagan, H.; Yamagata, Y. Land-cover change analysis in 50 global cities by using a combination of Landsat data and analysis of grid cells. Environ. Res. Lett. 2014, 9, 13. [Google Scholar] [CrossRef]
- Yi, W.; Guo-hua, B.; Qing-yuan, Y.; Zhao-lin, W. Analyzing land use characteristics of rural settlements on the urban fringe of Liangjiang New Area, Chongqing, China. J. Mt. Sci. 2016, 13, 1855–1866. [Google Scholar]
- He, Z.Y.; Song, S. Temporal and spatial variations of reservoirs in China and their effect analysis in the past 30 years. J. Guangzhou Univ. (Nat. Sci. Ed.) 2020, 19, 75–87. (In Chinese) [Google Scholar]
- Xu, Z.N.; Gao, X.L. A novel method for identifying the boundary of urban built-up areas with POI data. Acta Geogr. Sin. 2016, 71, 928–939. (In Chinese) [Google Scholar]
- Li, Q.; Wu, J. Factors affecting the lower limit of the safe mud weight window for drilling operation in hydrate-bearing sediments in the Northern South China Sea. Geomech. Geophys. Geo-Energy Geo-Resour. 2022, 8, 82. [Google Scholar] [CrossRef]
- Li, Q.; Wang, F.; Wang, Y.; Zhou, C.; Chen, J.; Forson, K.; Miao, R.; Su, Y.; Zhang, J. Effect of reservoir characteristics and chemicals on filtration property of water-based drilling fluid in unconventional reservoir and mechanism disclosure. Environ. Sci. Pollut. Res. 2023, 30, 55034–55043. [Google Scholar] [CrossRef] [PubMed]
- Li, J.; Liu, Y.; Wu, T.; Peng, Z.X. 70 years of dam construction in Xinjiang. J. China Inst. Water Resour. Hydropower Res. 2020, 18, 322–330. (In Chinese) [Google Scholar] [CrossRef]
- Wang, Y.; Shi, R.Y.; Qiao, C.L. Evaluation of Water Resources Carrying Capacity Based on Fuzzy Comprehensive Evaluation Method in Northern Slope Economic Belt of Tianshan Mountains. Bull. Soil Water Conserv. 2018, 38, 206–212. (In Chinese) [Google Scholar] [CrossRef]
- Sun, G.L.; Lu, H.Y.; Yu, M.Z.; Yan, X.R.; Zheng, X.; Zhang, Y.M. Ecological vulnerability spatial-time distribution and driving forces analysis in the economic belt on the northern slope of Tianshan Mountains. Southwest China J. Agric. Sci. 2022, 35, 2161–2170. (In Chinese) [Google Scholar] [CrossRef]
- Deng, M.J.; Yu, H.M.; Li, X.Q.; Xu, K.N. Dam construction progress in Xinjiang. Water Resour. Hydropower Eng. 2010, 41, 29–35. (In Chinese) [Google Scholar] [CrossRef]
- Deng, M.J. Studies on water resources strategy in Xingjiang. China Water Resour. 2009, 17, 23–27. (In Chinese) [Google Scholar]


Disclaimer/Publisher’s Note: The statements, opinions and data contained in all publications are solely those of the individual author(s) and contributor(s) and not of MDPI and/or the editor(s). MDPI and/or the editor(s) disclaim responsibility for any injury to people or property resulting from any ideas, methods, instructions or products referred to in the content. |
© 2023 by the authors. Licensee MDPI, Basel, Switzerland. This article is an open access article distributed under the terms and conditions of the Creative Commons Attribution (CC BY) license (https://creativecommons.org/licenses/by/4.0/).