Article

Operation Simulation and Economic Analysis of Household Hybrid PV and BESS Systems in the Improved TOU Mode

Department of Electrical and Electronic Engineering, Imperial College London, London SW7 2AZ, UK
Sustainability 2023, 15(11), 8853; https://doi.org/10.3390/su15118853
Submission received: 2 March 2023 / Revised: 23 May 2023 / Accepted: 23 May 2023 / Published: 31 May 2023

Abstract

:
With the popularization of electric vehicles and electric boilers, household electricity consumption will increase significantly. Household hybrid photovoltaic (PV) systems and battery energy storage systems (BESSs) can supply increasing household electricity consumption without expanding the existing distribution network. This paper validates the technical feasibility of connecting a large number of household power users that contain BESSs and PVs in a distribution line by a simulation in Matlab. In addition to technical feasibility, this article improves the time-of-use (TOU) form to achieve economic feasibility (covering equipment costs). In the past, the TOU was set from the perspective of the load demand of the grid, but the actual user participation would affect this effect. In this paper, based on a social science survey, a new three-level rate TOU is introduced, which has little impact on residents’ lifestyle, to effectively increase the response frequency effectively. Combined with the improved TOU and the state of PVs, the BESS control mode is set for simulation. To compare the three-tier rate TOU with the normal TOU tariff and select the best household BESS size, a MATLAB simulation is used to simulate the common household BESS capacity. The results indicate that the combination of the three-tier rate TOU with a 4 kWh household BESS can afford the investment of household PVs and BESSs. The high cost issue that previously primarily limited the true use of BESSs is expected to be resolved.

1. Introduction

To take responsibility for sustainable development, energy saving, and emission reduction, EU institutions have set a target to reduce carbon emissions by 40% of 1990 levels by 2030 [1]. The CO2 emissions from residential households account for a large proportion of carbon emissions in the whole of society. Therefore, residential households represent a cornerstone of effort to decarbonize the energy systems to achieve the European emission reduction targets. For example, the total CO2 emissions generated in the UK at the distribution level in 2020 has reached 269.76 MtCO2 (metric tons of carbon dioxide), of which up to 30% of the emissions come from residential households [2]. In addition to carbon emissions from residential electricity, transportation and heating are another two important sources, because oil-fueled vehicles and gas-fired boilers are still widely used. Under the conditions of high penetration levels of renewable power generation, replacing oil-fueled vehicles with Electric Vehicles (EVs) and gas-fired boilers with Electric Boilers (EBs) can effectively reduce carbon emissions from the residential side.
According to the data survey in 2020, domestic household electricity accounts for 27.4% of the EU’s total energy consumption [3]. It will rise significantly as a result of introducing EVs, which are mainly recharged in the house. In addition to traffic consumption, which accounts for most of the household energy consumption, 70% of the remaining household energy consumption is used for space heating. As a result, replacing gas-fired boilers with EB will also increase household electricity consumption further. It is possible to introduce more energy-saving appliances and less heat conduction, but on the whole, there will be a significant growth in household electricity consumption [4]. To meet the increasing household electricity consumption, the large-scale expansion of the existing distribution network is an effective method, allowing households to import more electricity from the grid. But this approach requires a high investment and might raise public concerns about electromagnetic pollution. In recent years, the progress of distributed generator technologies, especially the technical advancement of solar photovoltaics (PVs), has provided a new way to solve this problem [5]. At present, many countries are promoting the installation of residential PVs to enhance self-consumption, thus reducing grid pressure [6].
According to the simulated daily electricity consumption of residents in 2030 [7], the supply of residential PVs is out of sync with the electricity consumption in time, which has become a major problem restricting the efficiency of residential PV power generation. Fortunately, the development of energy storage technology can provide a new way to effectively resolve the time mismatch between residential PV power generation and the electricity consumption of residents, thus promoting the deployment of residential PVs. Energy storage systems (ESSs) convert electricity into other forms of energy for storage and then back into electricity when needed to ensure that energy is always available. The main form of the ESS used in electric power systems is pumped storage, which is not suitable at the house. In recent years, many novel types of ESSs have been developed, such as electrochemical energy storage, thermal energy storage, electromagnetic energy storage, etc. [8]. Amongst them, the battery energy storage system (BESS) has become the main option for household power users. In the early days, high battery cost was the largest obstacle in deploying the BESS for household power users. Fortunately, the current battery price already has dropped significantly and is expected to achieve 40% of their 2016 price by 2030 because of technology progress together with widespread use [9].
Therefore, how to deploy and control the BESS in distribution systems and by the household power users has become a research hotspot in the field of electrical engineering. Mehos et al. [9] developed a simple but effective BESS control strategy, which stores excess energy in the BESS when the PV power generation exceeds a predetermined threshold, and discharges when the load demand is too large to be satisfied by the PV power generation. Karanki et al. [10] optimized the location and size of the BESS to achieve maximum benefit, i.e., promoting the operation efficiency of the distribution systems and deferring investments for upgrading the distribution systems. Graditi et al. [11] designed a novel bidirectional inverter to enable the BESS to have the ability of rapid voltage regulation and transient frequency regulation. Grillo et al. [12] integrated the BESS with wind turbine generators and developed an optimal management strategy based on forward dynamic programming. If the BESS is integrated into the distribution systems, this control strategy can also achieve a quick grid balance. The high price of batteries limits the widespread use of the BESS by household power users. At present, the decline in battery price is the trend, but the BESS is still expensive for the household power users. Therefore, how to use the household BESS in a more economical way is another key issue of concern by academia and industry.
In this context, relevant policies formulated according to costs are also being investigated to promote the use of the BESS in the distribution systems and by household power users [13,14]. Graditi et al. [11] calculated the income of a medium BESS under the time-of-use (TOU) tariff when analyzing the stability of distribution systems. In addition to the investment of the BESS, Chen also took the operation and maintenance costs of the BESS connected to the distribution systems as a single optimization objective, aiming to find a profitable BESS connection strategy [15]. Hu et al. [16] optimized the BESS capacity by sequential quantization planning considering the real-time electricity price to realize profit maximization with less loss of capacity. Based on the work reported in [16], Gallo et al. [17] found more suitable BESS parameters through a hybrid optimization. Youn et al. [18] investigated the optimal size of the household BESS deployed to meet peak load based on power grid data from the United Kingdom (UK). In addition, ref. [17] developed a strategy to control the BESS in combination with the PV systems on the basis of forecasting the real-time electricity price. Koskela and Järventausta noted that the BESS cannot be popularized and used to balance the grid at present. They found that household heating is the largest form of energy consumption. On the premise that the human body feels comfortable, it can be used as a small battery for adjustment to help regulate the power grid. But there is still no way to provide financial support for BESSs [19]. Present studies demonstrate that most households cannot afford the BESS cost under the current policies in the UK, thus hindering the development of household BESSs [20].
TOU is an effective measure to balance power in the distribution line. The TOU policy is set based on the supply and demand relationship of the load. In fact, the TOU effect is closely related to consumers’ willingness to participate actively [21]. The activities of household energy consumption mainly include cooking, dishwashing, laundry, heating, and bathing. The personal activity time and social factors of residents all affect their willingness to transfer activities. In 2020, Hafeez et al. developed a wind-driven bacterial foraging algorithm (WBFA) to improve the demand response based on price and user comfort, ensuring optimal electrical usage needs in order to return to the optimal electricity plan for residential smart devices [22]. In recent years, a variety of algorithms have been proposed for balancing multiple objectives in the demand response. The hybrid algorithm (EDGE) proposed in 2021 based on enhanced differential evolution (EDE) and the genetic algorithm (GA) has made significant contributions to energy costs and carbon emissions. The multiple objectives involved in the demand side response must have tradeoffs in implementation [23]. In order for the electricity price to reflect the state of the power grid more accurately, Balakumar et al. introduced machine learning into the optimization goal to predict the load. Through weather prediction, the state of sustainable energy in the power grid can be better estimated, rather than simply considering user behavior to balance the grid [24]. The comfort formulation provided in the optimization process proposed in these papers is judged by the amount of power transfer. Less power transfer makes the resident more comfortable. There is an essential difference in this paper with social surveys. People are willing to respond in some periods of time. People can essentially transfer work activities to other times, which can cause more changes in electricity power. Ian and Aimie proposed a three-tier rate TOU based on a large number of national surveys and analyses involving lifestyle and consumption capacity in which people were willing to participate [25]. It can increase the potential benefits and more participants can also bring more significant changes to the grid. The proposed approach is fully considered from the perspective of comfort. This paper verifies the feasibility of the demand response based on the price. The description of the conversion process from multiple targets to single targets is shown in detail in the second chapter.
Table 1 compares the characteristics of this article with historical papers that focus on the application of BESSs and DR. Some research did not incorporate DR into the control model of BESSs. However, they verified technological progress but were unable to cover the costs for promotion.
Based on previous studies, this paper validates the technical feasibility of connecting many household power users containing BESSs and PVs in a distribution line by a simulation in Matlab. In the simulation, 30 household power users powered by a combination of household PVs and BESSs are connected to a single distribution line simultaneously. The second chapter mainly describes how to build the distribution line model and BESS control system and determine whether this control method can achieve household electricity through reasonable estimation in 2030. Finally, we evaluate this control model solution. The simulation results show that the distribution line can operate safely even if the penetration level of the household PV and BESS in a single distribution line is very high; that is to say, both power flow and voltage in the distribution line are reasonable. In addition, a method is developed to execute 20 years of economic analysis for the household power user powered by a combination of the household PV and BESS. The results demonstrate that the benefits of the household power user can cover investments of the household PV and BESS under the three-tier rate TOU. In other words, the three-tier rate TOU can effectively promote the applications of the household PV and BESS. To select a more suitable three-tier TOU BESS capacity size from the perspective of technology and economy, the household BESS capacities of 3, 4, 6 kWh, which are common in the market, are simulated. The final 4 kWh household BESS can not only successfully afford the cost of the BESS and PV, but also effectively prevent the occurrence of excessive pulses in the nodes of the low-voltage distribution line, to select the most suitable size for the household BESS device with the three-tier rate TOU.

2. The Operation Strategy of the Household BESS

2.1. Introductions of the Battery

The purpose of the household BESS is to resolve the problem where the supply of the residential PV is out of sync with the electricity consumption in time. In this context, the household BESS needs to meet some requirements, such as low cost, many cycles, and no memory effect. The household BESS also needs to be safe and non-toxic for household use, and have a high energy density to make the size fit. At present, the main types of mature battery technologies mainly include lead–acid batteries, nickel–hydrogen batteries, lithium-ion batteries, etc. The lithium-iron phosphate battery (LiFePO4) is a new type of lithium-ion battery that is not toxic and is more efficient and less costly than cobalt-based lithium-ion batteries of similar energy density [26]. The lithium-ion battery (LiB), which has a good development prospect, has a high energy density and high efficiency [27]. It is the most suitable technology for domestic use [27]. With the development of LiFePO4, the price can be reduced to 180 C/kWh by 2030, which is about 50% lower than that in 2018 [28]. Therefore, LiFePO4 is ideal for the household BESS.
In this paper, it is assumed that the depth of discharge (DOD) of the household BESS is 90%, i.e., the minimum state of charge (SOC) of the household BESS is 10%. In this paper, three kinds of household BESSs with different capacities are connected to the household power users to find the best BESS capacity according to the benefits. The relevant parameters of the three kinds of household BESSs are illustrated in Table 2.
The following assumptions are made in this paper when simulating the household power users [29].
  • The cycle time of the household BESS is 24 h and repeated daily. At the last measurement of the day, the BESS SOC is controlled at 10%;
  • The energy generated by the household PV is to meet the household self-consumption first, because the selling price is far less than the purchase price;
  • The electricity price of TOU is predetermined in advance;
  • The charge and discharge efficiencies of the household BESS are both 95%;
  • The SOC and charging/discharging rate of the household BESS are controlled to satisfy the constraints listed below.
V SOC , min < V SOC , 0 +   ( P BESS , t × Δ T ) < V SOC , max
P BESS , discharge < P BESS , t < P BESS , charge
where V SOC , min and V SOC , max are, respectively, the minimum and maximum values of the SOC of the household BESS, which can be determined by the nature of LiFePO4; V SOC , 0 is an initial value of the SOC of the household BESS; P BESS , t denotes the charging/discharging rate of the household BESS at time slot t; P BESS , charge and P BESS , discharge are, respectively, the maximum charging and discharging rates of the household BESS. When the value of P BESS , t is positive, the household BESS charges; otherwise, the household BESS discharges. The SOC conversion in Simulink is shown in Appendix A.

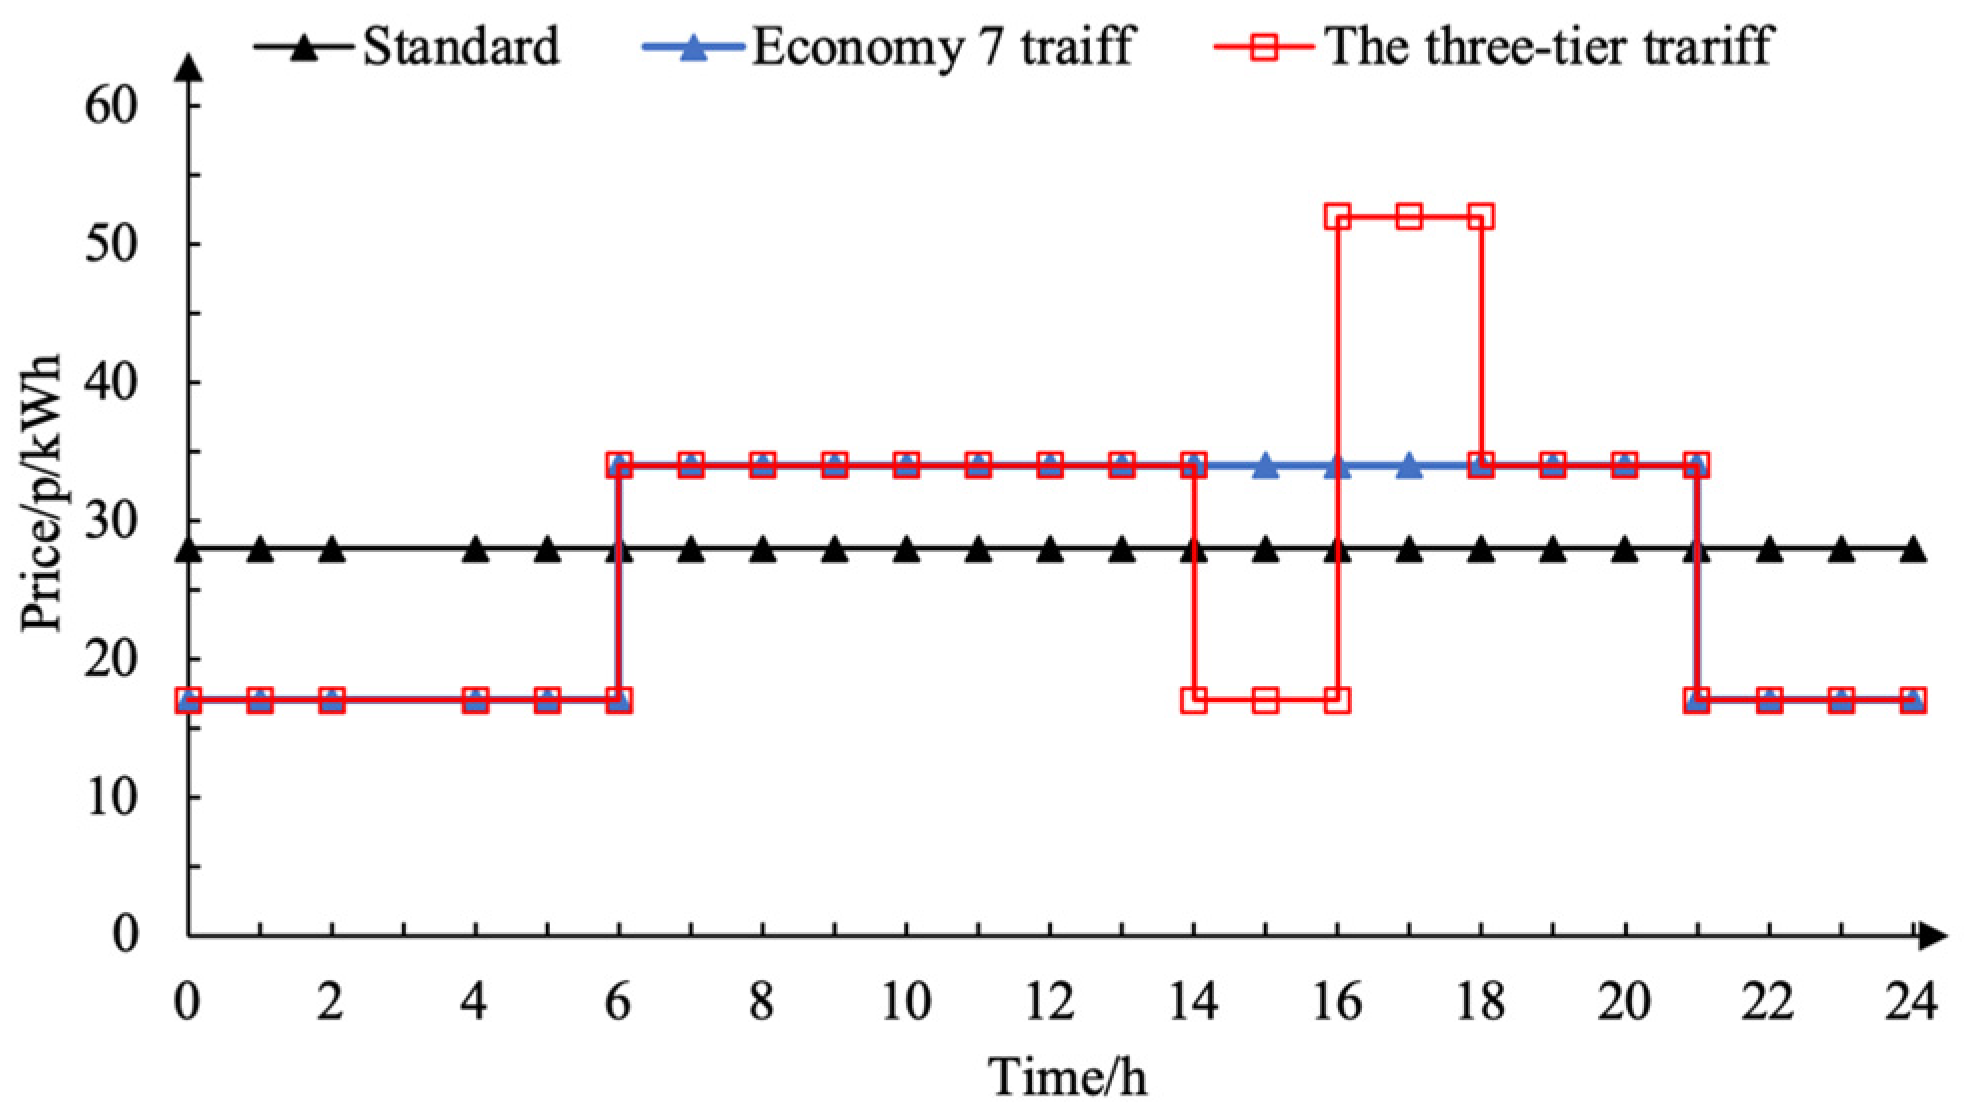
2.2. The Three-Tier Tariff

At present, the tariff rate in the UK is the Economy 7 tariff, which is the off-peak rate from 9 p.m. to 6 a.m., with the remaining time being peak time [23]. Because there is a clear difference between daytime and nighttime electricity consumption activities, such as washing clothes and cooking during the daytime hours, it is difficult for users to shift day work to the night to match the Economy 7 tariff. The three-tier tariff model constructed by Ian, which has now attracted people’s attention, can help users save costs without affecting their lifestyle. According to the survey, people are more willing to actively participate in the three-tier tariff [29]. The three-tier tariff includes three prices, which are peak, mid-peak, and non-peak, as shown by the red line in Figure 1, which adds a buffer from 2 p.m. to 4 p.m. The electricity fee includes the usage fee (p/kWh) and the fixed daily fee (GBP) [30]. According to the latest electricity prices adjustment in April 2022, the standard usage fee in the UK is 28 p/kWh, and the fixed daily fee is 45 p. The electricity prices of the Economy 7 tariff and the three-tier tariff are set in advance and remain constant, as shown in Figure 1.
Economy 7 and the three-tier rate TOU are price-based demand response (DR) programs, and the three-tier rate TOU has three price levels. The mathematical modeling of the three-tier rate TOU is as follows:
γ ( t ) = { γ 1 ,     if   t T 1 γ 2 ,     if   t T 2 γ 3 ,     if   t T 3
where γ(t) is the electricity price at time t; the power system charges on a daily basis as the unit, which is for 24 h; and γ1, γ2, and γ3 are the prices for off-peak, mid-peak, and peak periods:
T 1   T 2   T 3 = 24   h
γ 1 < γ 2 < γ 3
According to Figure 1, the time intervals from 0 to 6, 14 to 16, and 21 to 24 h are the non-peak hours, corresponding to γ1. Similarly, the time intervals from 6 to 14 and from 18 to 21 h are the mid-peak hours, reflecting γ2. The time interval from 16 to 18 h is the peak hours and corresponds to γ3.
According to the nature of electrical appliances, they can be divided into two types: (a) electrical appliances that can interrupt timeslots and (b) electrical appliances that cannot interrupt timeslots. Electrical appliances that can interrupt timeslots can participate in the response. The formula for the power consumption of (a) interruptible-timeslot electrical appliances throughout the day is as follows:
E c a ( t ) = P c × S
E c a T = t = 1 24 E c a ( t )
where E c a ( t ) is the (a) application-consumed electricity per timeslot, P c is the power rating, and S is the status; if during the peak time, S can be set off.
C a = t = 1 24 ( E c a ( t ) × ρ ( t ) )
where C a is the daily electricity fee for the (a) kind of application. ρ ( t ) is the electricity price for each timeslot.
For Class b electrical appliances, the amount of electricity consumed is fixed for each period of time and only varies with the price, as shown below:
E c b ( t ) = P c × S
E c b T = t = 1 24 E c b ( t )
C b = t = 1 24 ( E c b ( t ) × ρ ( t ) )
The total cost of the two appliances ( C T ) is the total electricity cost:
C T = C a + C b
After participating in the response, it is still ensured that the total electricity consumption throughout the day is consistent. The final energy management optimization problem should have minimized costs (total electricity fee is C T ) and maximized user comfort (R), which can be expressed as the following multi-objective optimization problems:
min ( C T ,   R )
subject to
E T < c a p a c i t y
E T T b e f o r e = E T T a f t e r
C a > C a b a s e
where E T is the total application-consumed electricity per timeslot, E T T b e f o r e is the total consumed electricity per day in normal situations, and E T T a f t e r is the total consumed electricity per day when attending to the demand response. In addition, it is necessary to ensure the basic use requirements of class a appliances at every moment.
Based on social surveys, the application of the three-tier rate TOU is more easily accepted by residents. To simplify the optimization problem, when Economy 7 and the three-tier rate TOU modes transfer the same load, the comfort level of the three-tier rate TOU is inevitably higher than that of Economy 7. Assuming that 30% of users participate at each timeslot, based on the social survey [23], participating users will reduce their total power by 30% to simplify the drop variation in the amount of power, transforming the multi-objective optimization problem into a single objective optimization problem and focusing on the cost.
In the UK, household electricity consumption in winter is much higher than that in summer because of widespread utilizations of the household EB, which will put more pressure on the distribution systems [31]. Therefore, the simulation is executed based on household electricity consumption in winter.

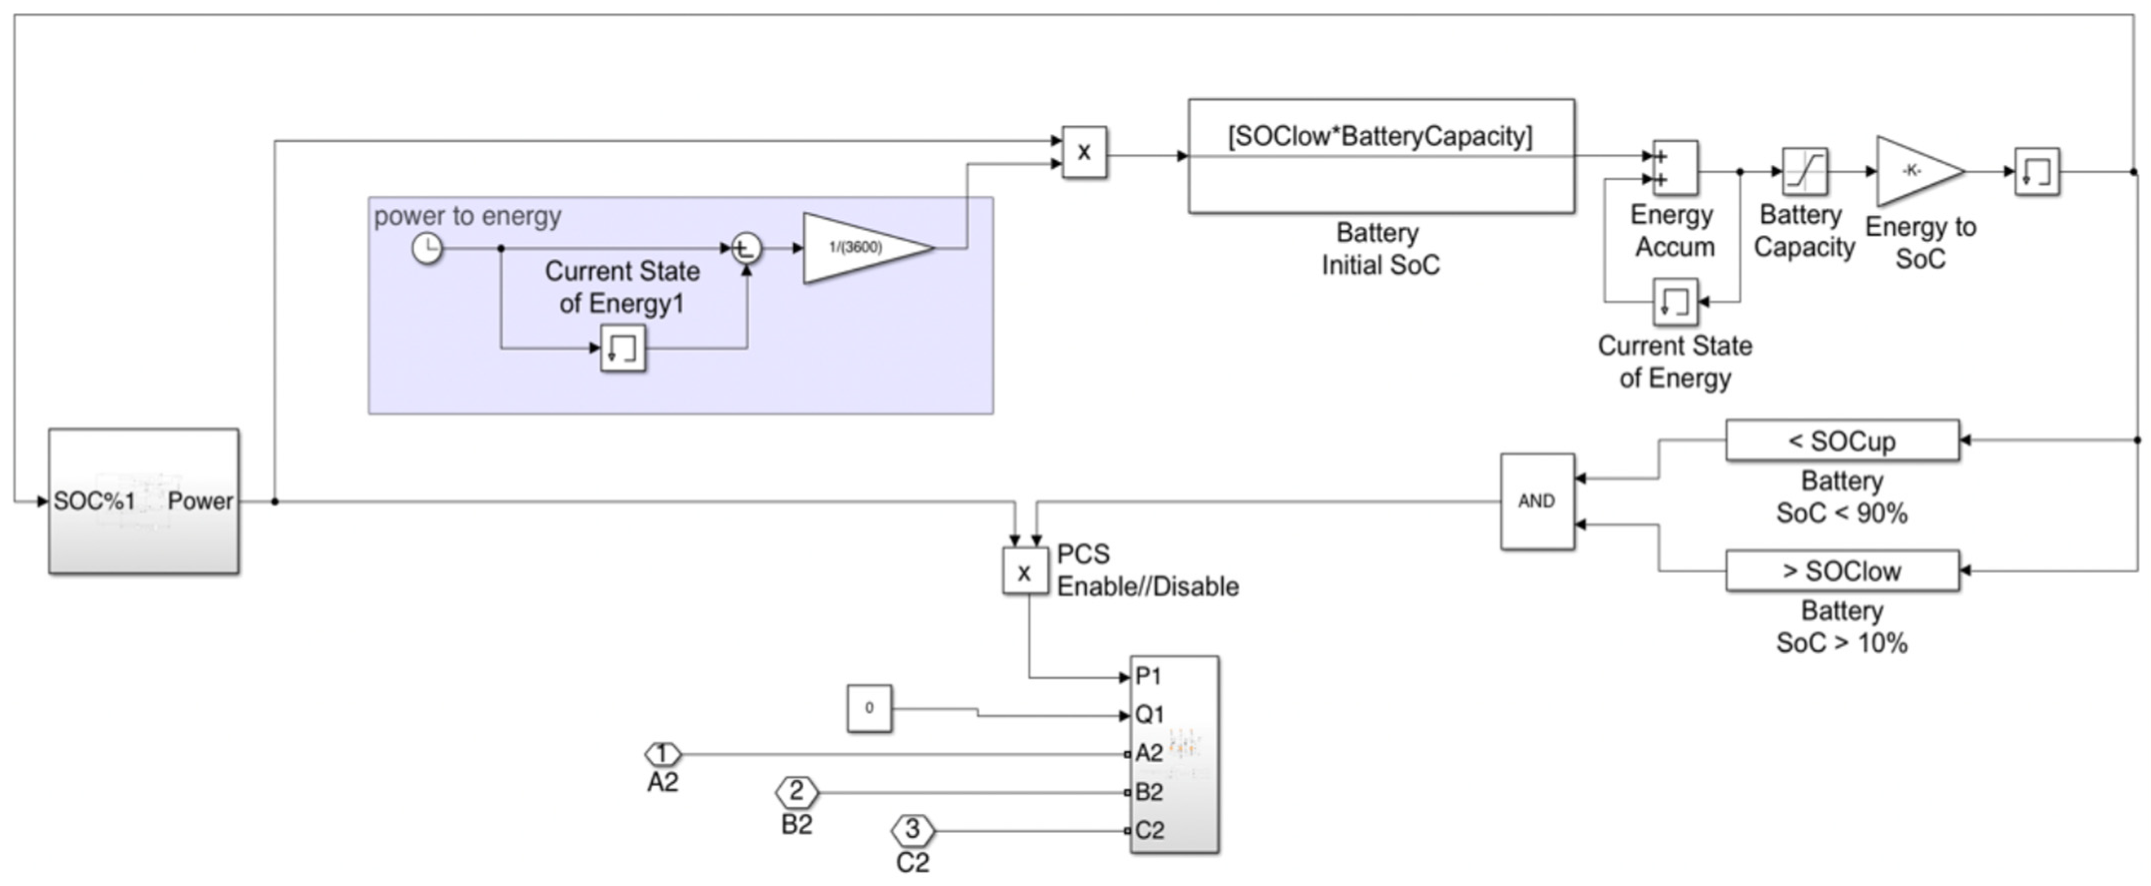
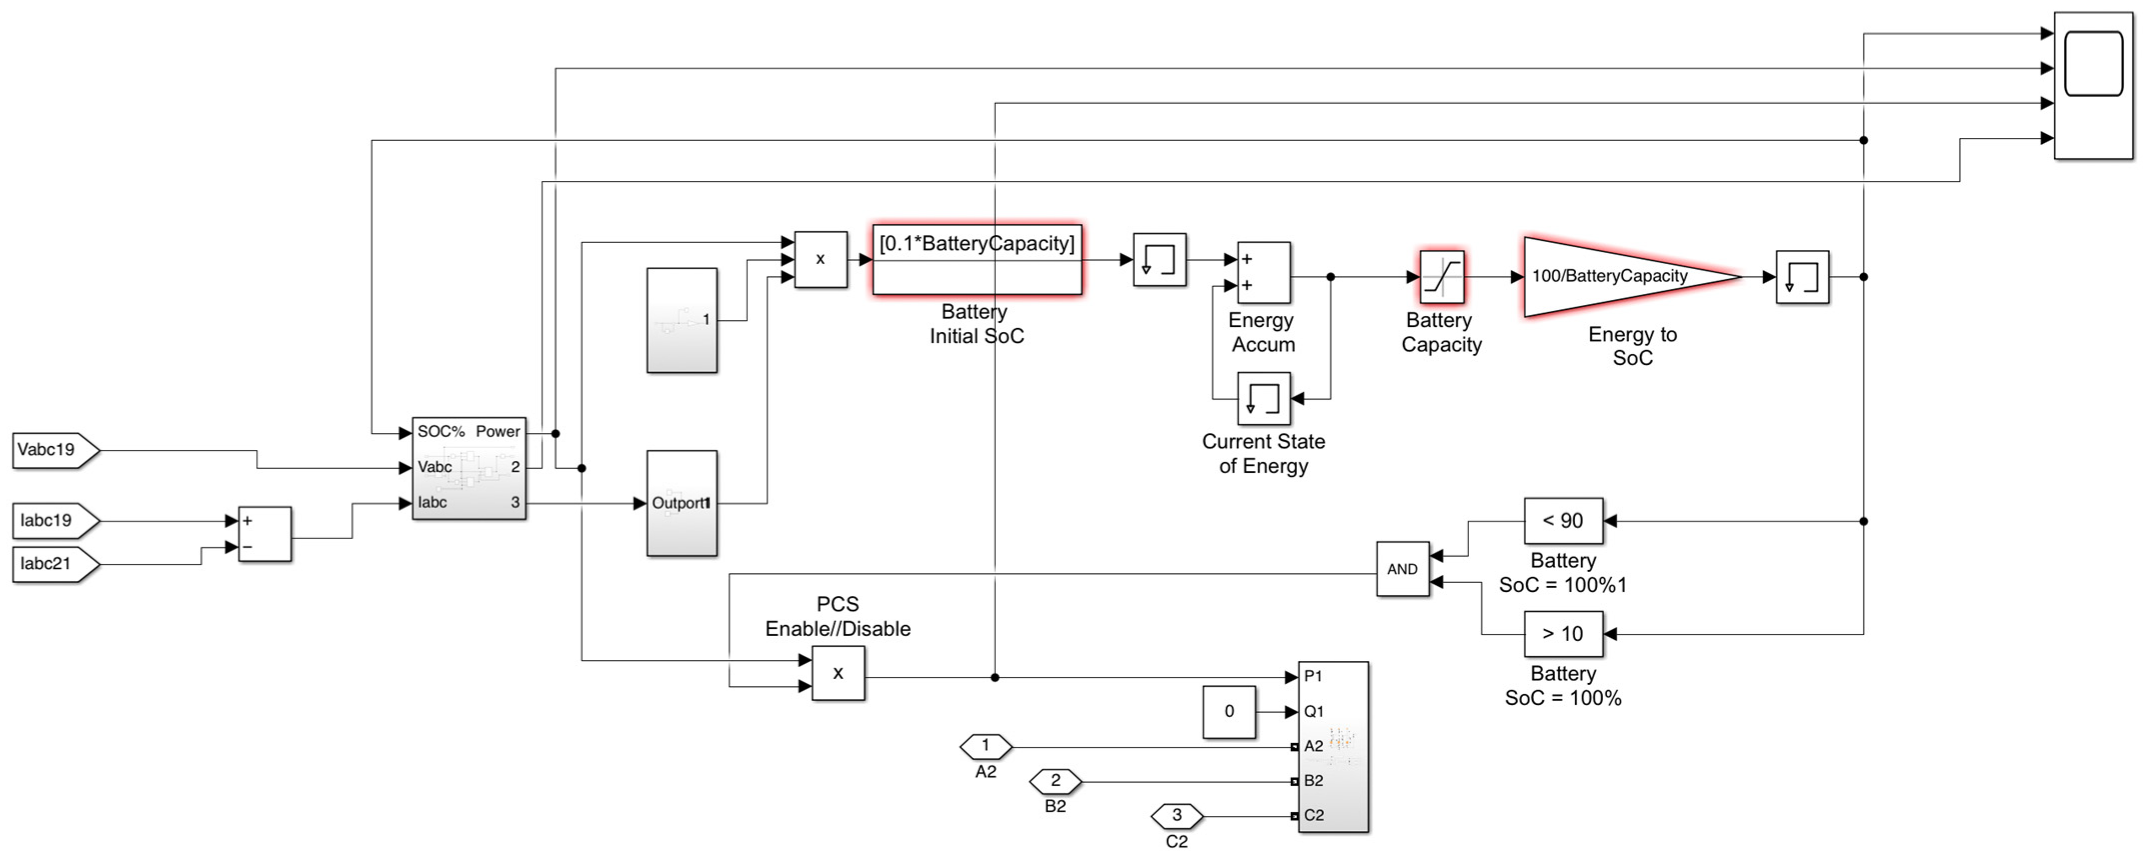
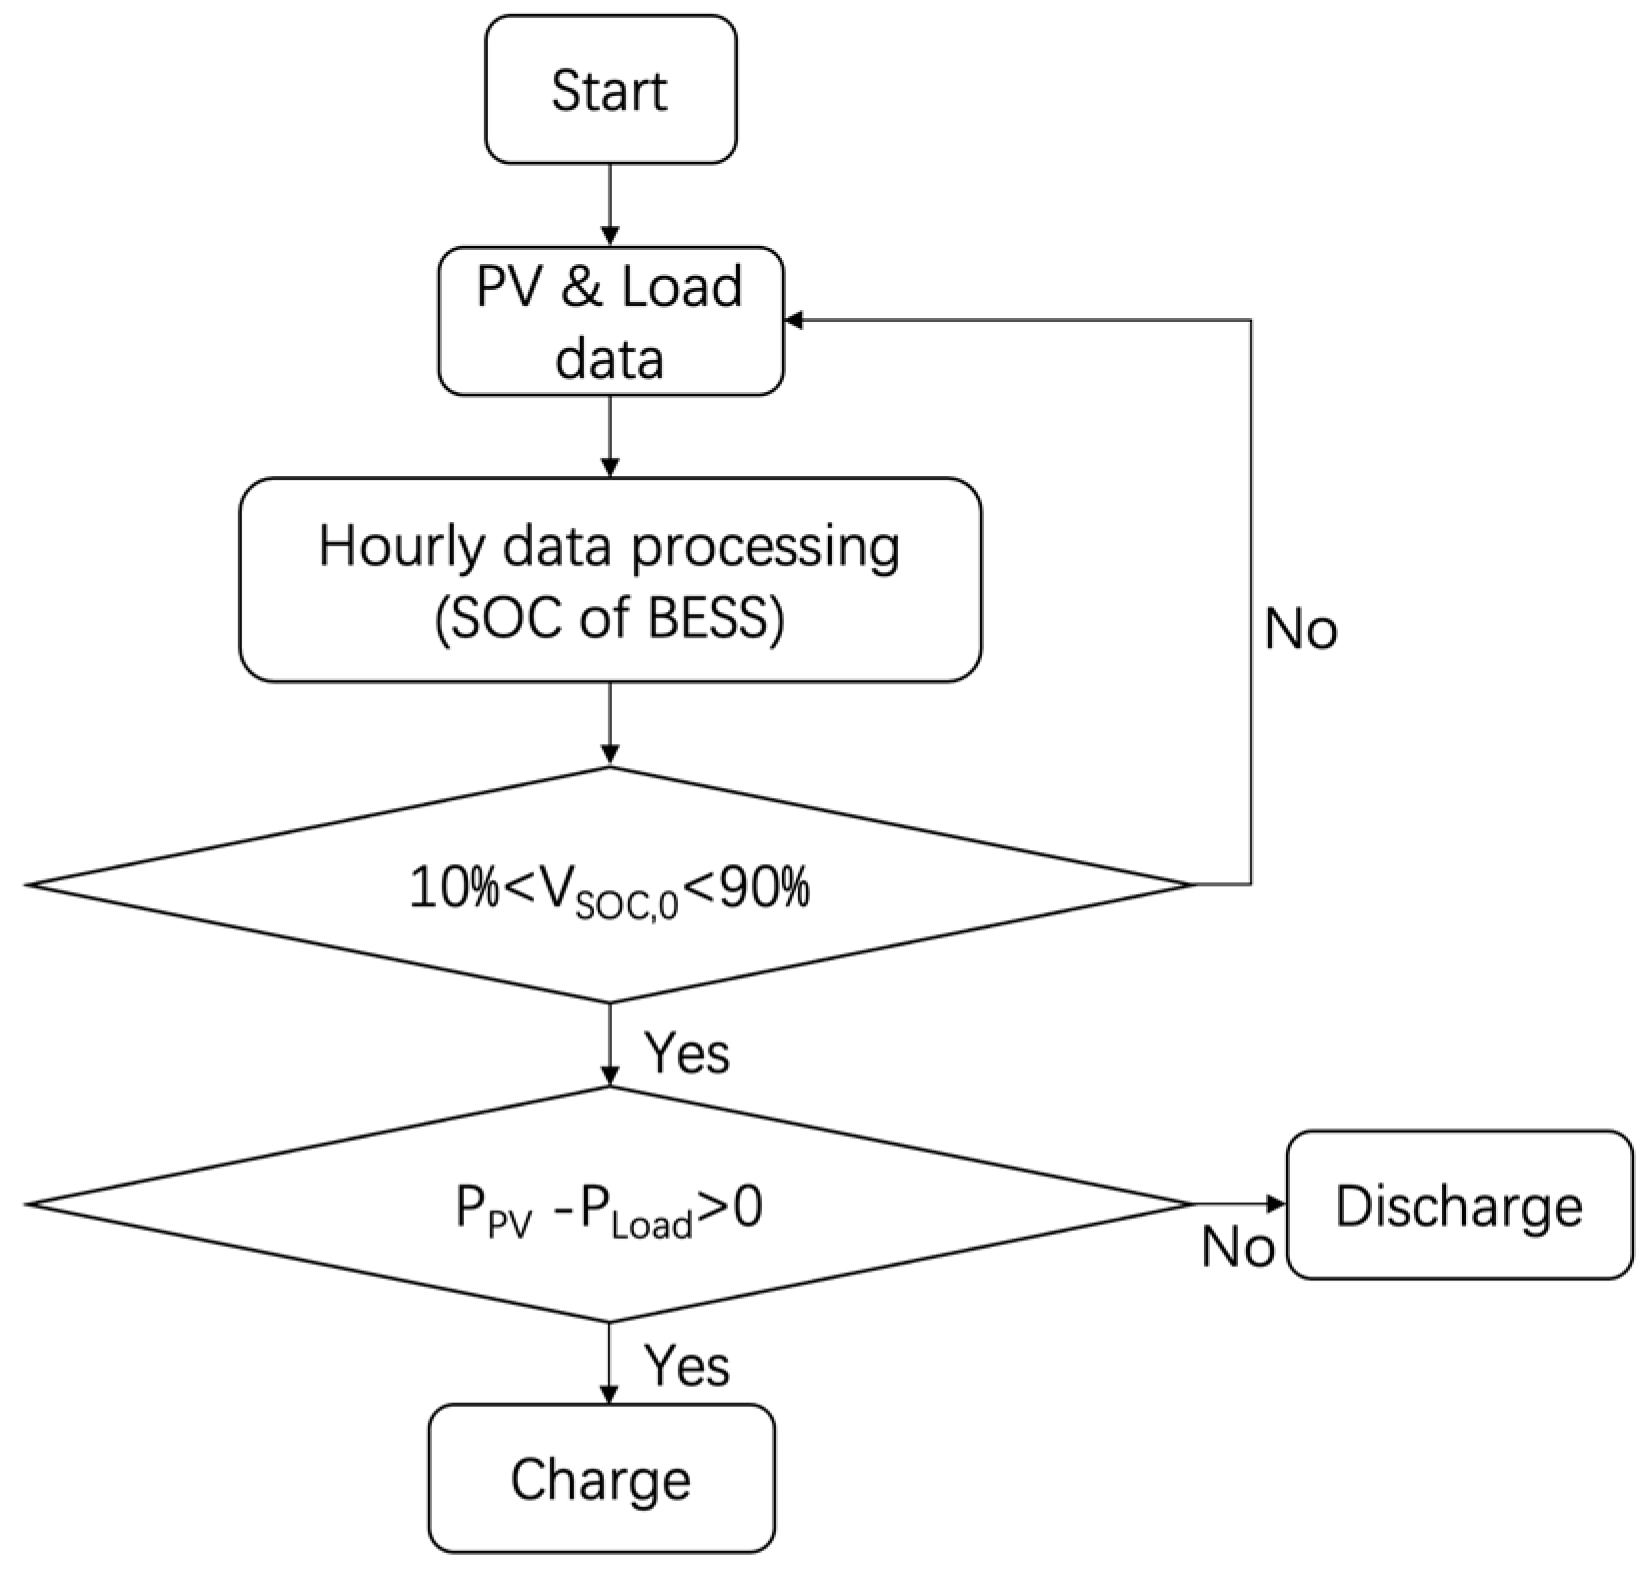
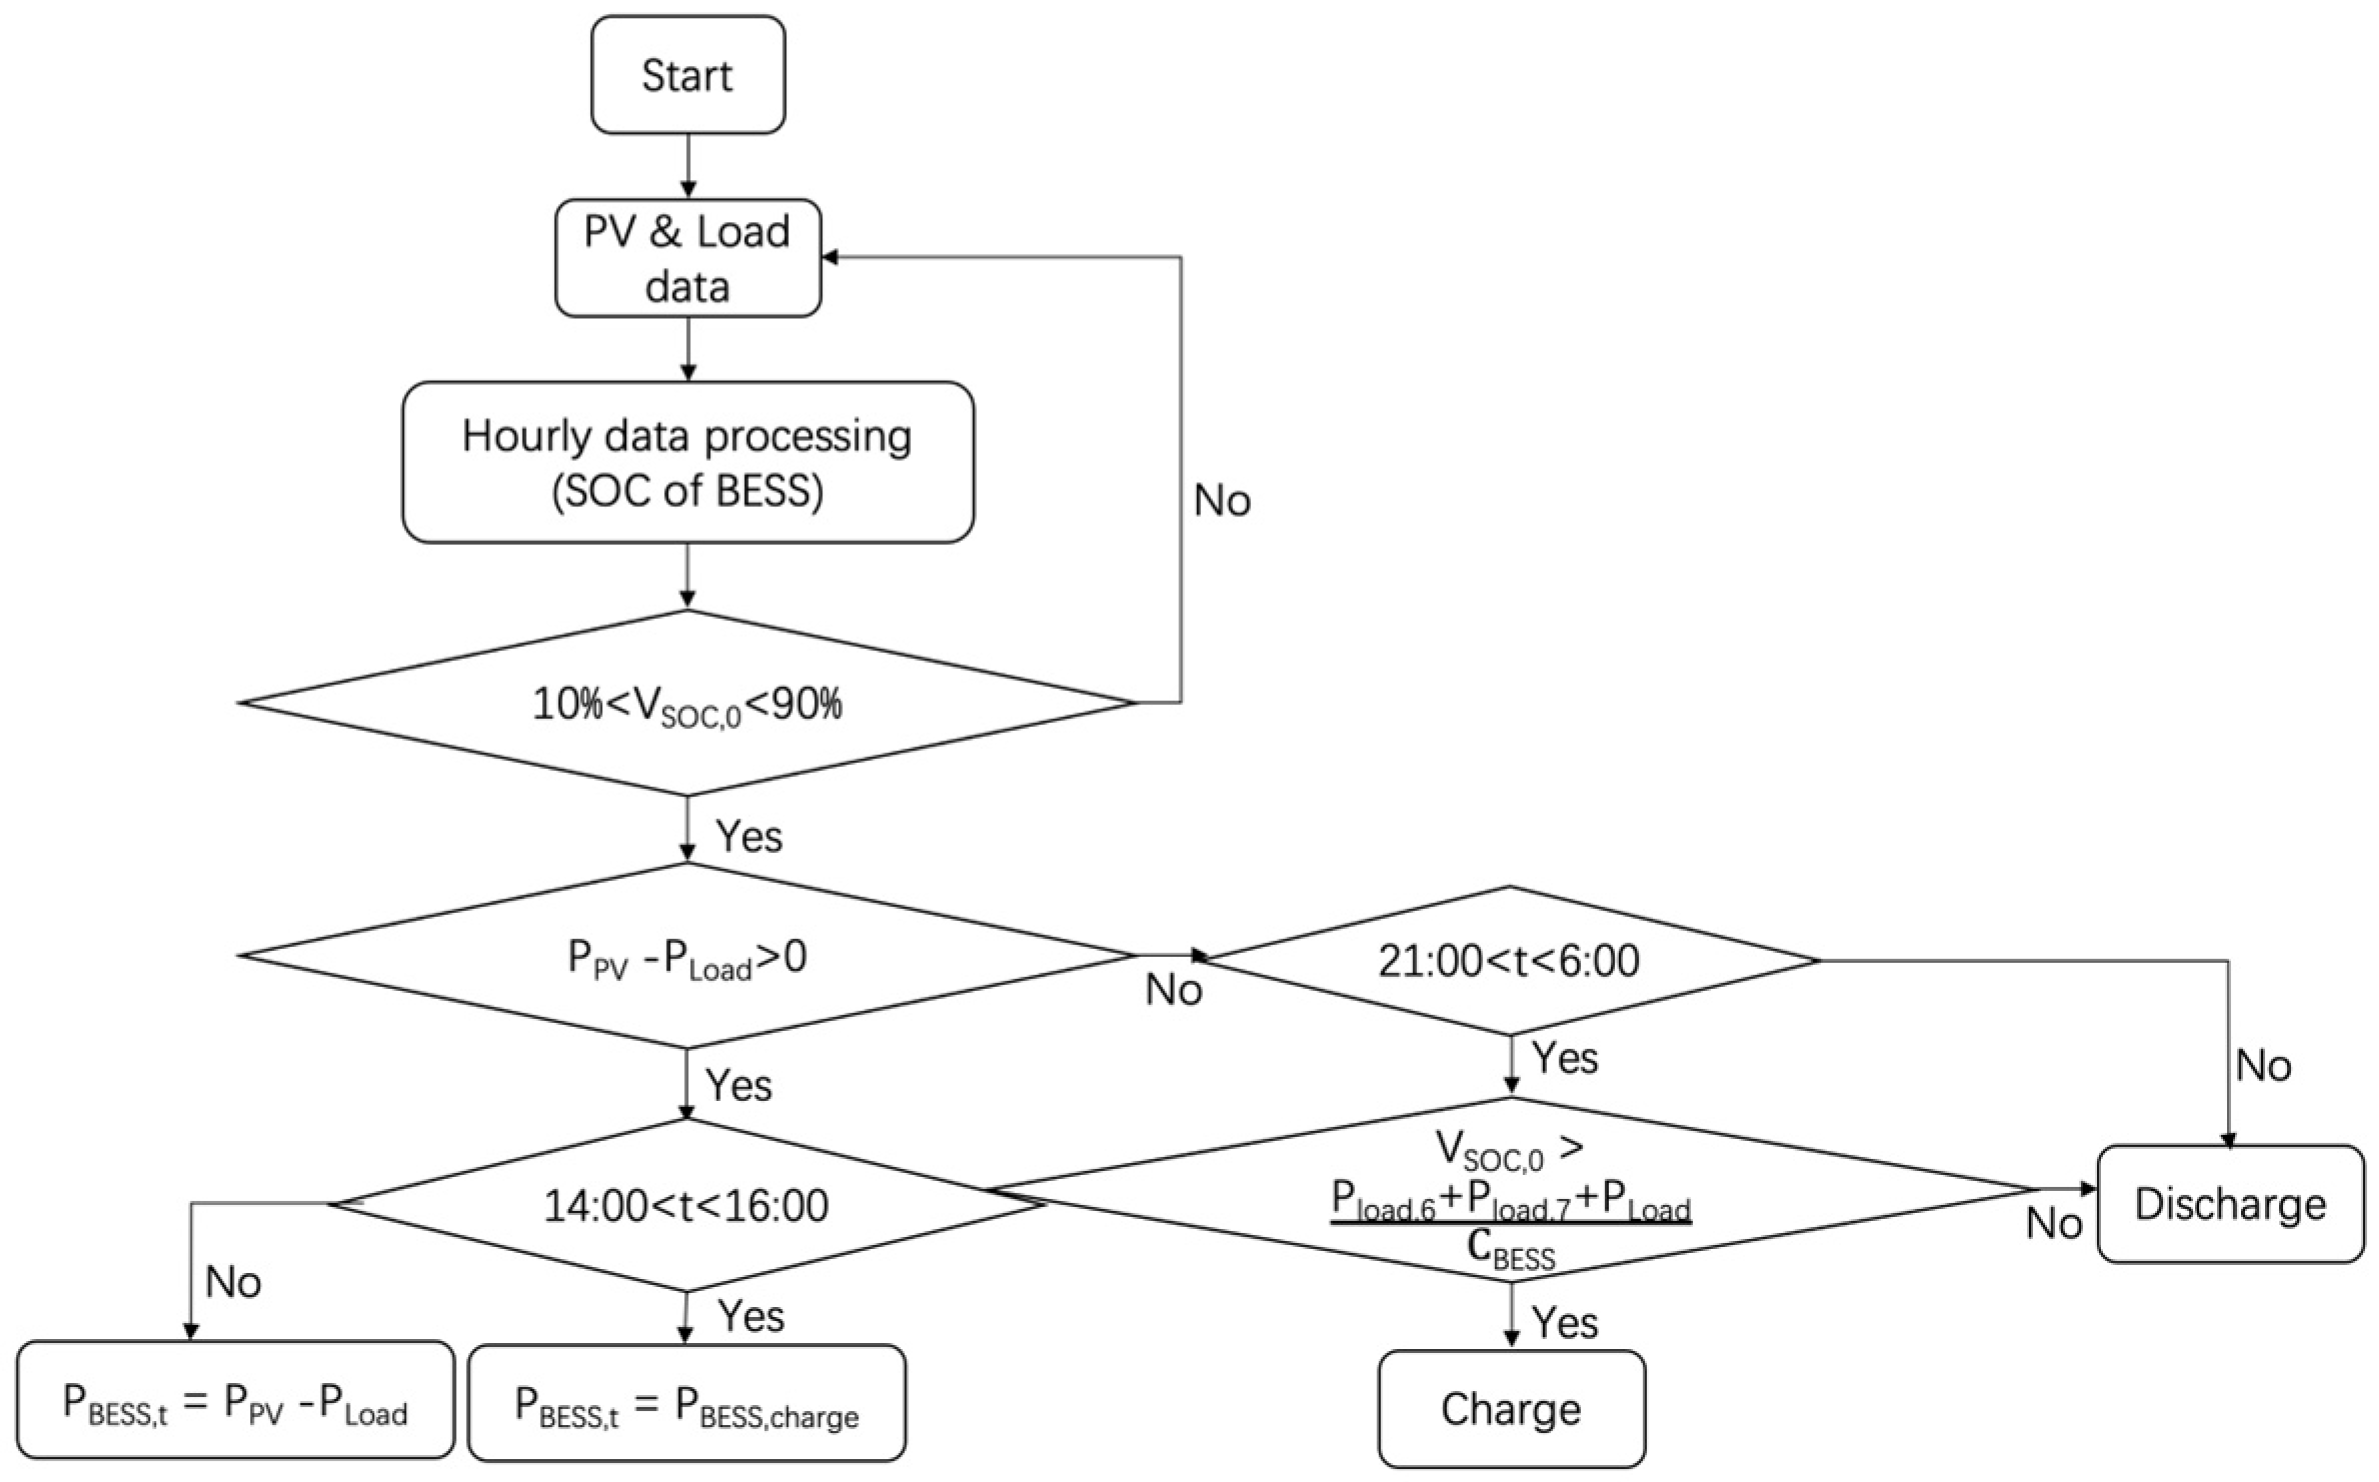
2.3. BESS Control Strategy

The control strategies of the household BESS are related to two important factors: (1) which price strategy is adopted, and (2) whether the PV is deployed by the household power users or not. In this paper, five scenarios are designed according to these two factors for investigating the control strategies of the household BESS, which are illustrated in Table 3.
If the standard pricing is adopted (i.e., Scenario 1 in Table 2), the charging/discharging status of the household BESS is related to whether the energy produced by the household PV can completely supply the household load and the V BESS , 0 . If there is surplus energy from the household PV production after supplying the household load and V BESS , SOC < 90%, the BESS is controlled to charge, as shown in Figure 2. The simulation process reflected in the flow chart is shown in Appendix B.
When the PV is deployed by the household electricity users (i.e., Scenarios 3 and 5 in Table 2), the control strategies of the household BESS vary with the adopted price strategy, as illustrated in Figure 3 and Figure 4.
For the Economy 7 tariff (i.e., Scenarios 3 in Table 2), the off-peak period is from 9 p.m. to 6 a.m., as shown in Figure 1; the other periods are peak periods. There should be no energy storage in the BESS at the end of the peak time (i.e., 9 p.m.). According to the weather in the UK, PV generation is usually available from 8 a.m. However, the peak period begins from 6 a.m., so the BESS should be charged at the off-peak time to satisfy the electricity needed from 6 a.m. to 8 a.m. The flow chart of Scenario 3 is shown in Figure 3.
For the three-tier tariff (i.e., Scenario 4 in Table 2), which adds a buffer from 2 p.m. to 4 p.m. based on the Economy 7 tariff, the BESS should be charged at the maximum charging rate in the buffer zone between 2 p.m. and 4 p.m. to satisfy the electricity needed in the peak period from 4 p.m. to 6 p.m. The flow chart is as shown in Figure 4.
When the household electricity users are not equipped with PVs (i.e., Scenarios 2 and 4 in Table 2), the control strategies of the household BESS are simple, i.e., PPV is a constant 0 in Figure 3 and Figure 4, and the basis of judgment is only time-dependent. The BESS during the off-peak period should be fully charged, rather than just charging to meet the electricity needs from 6 p.m. to 8 p.m.
The above flow chart reflects the specific simulation state as shown in the Figure 5, where the power source is selected in the PV, BESS, and grid. This paper compares three different situations with the BESS content that should be selected in the user’s consumption state. First, consider the PV self-consumption scenario, and increase the available load of solar energy by combining batteries, as shown in Figure 5a. Then we focus on the control of the BESS through TOU in combination with the changing price, Figure 5b,c combines the above two methods to determine whether the battery performance can be improved.

3. Simulation for a Low-Voltage Distribution Line in 2030 Scenarios

In order to verify the technical feasibility of connecting a great number of household PVs and BESSs to a low-voltage distribution line at the same time, the operating conditions of a 400 V distribution line during a typical day in each season are simulated in Matlab. This distribution line supplies power to 32 household electricity users, each of whom are equipped with a household BESS and/or PV.

3.1. Model Structure and Components

The increasing penetration of EVs and EBs together with the upgrade of the household appliances have a significant impact on electricity consumption. Electricity consumption forecasts can help grid upgrades in advance. Several projects have analyzed electricity consumption in 2030, and one eye-catching project is Gridlington. In the simulation executed in this paper, the basic data in 2030 are obtained from Gridlington to ensure the results’ accuracy. Specific city information in Gridlington can be obtained through [32]. The distribution line in this paper is located at the 118 area in Gridlington, which contains one transformer (11 kV/400 V) as the swing point in node 33 to supply 32 household electricity users. The Simulink model is shown in Figure 6.
Relevant grid input data include:
  • Standardized component parameters: lines, transformer, protection devices, etc.;
  • Transformer parameters: the capacity of a 50 kW transformer is selected for 32 households (refer to Gridlington);
  • Household loads on the distribution line (see Section 3.2);
  • Geographical location: time and power of PV generation (Gridlington is the location of sandy Bedfordshire, near London) (see Section 3.3);
  • Probability events: the special circumstances are not considered in this paper. For example, the maximum power flow of each component generally does not occur at the same time [33].

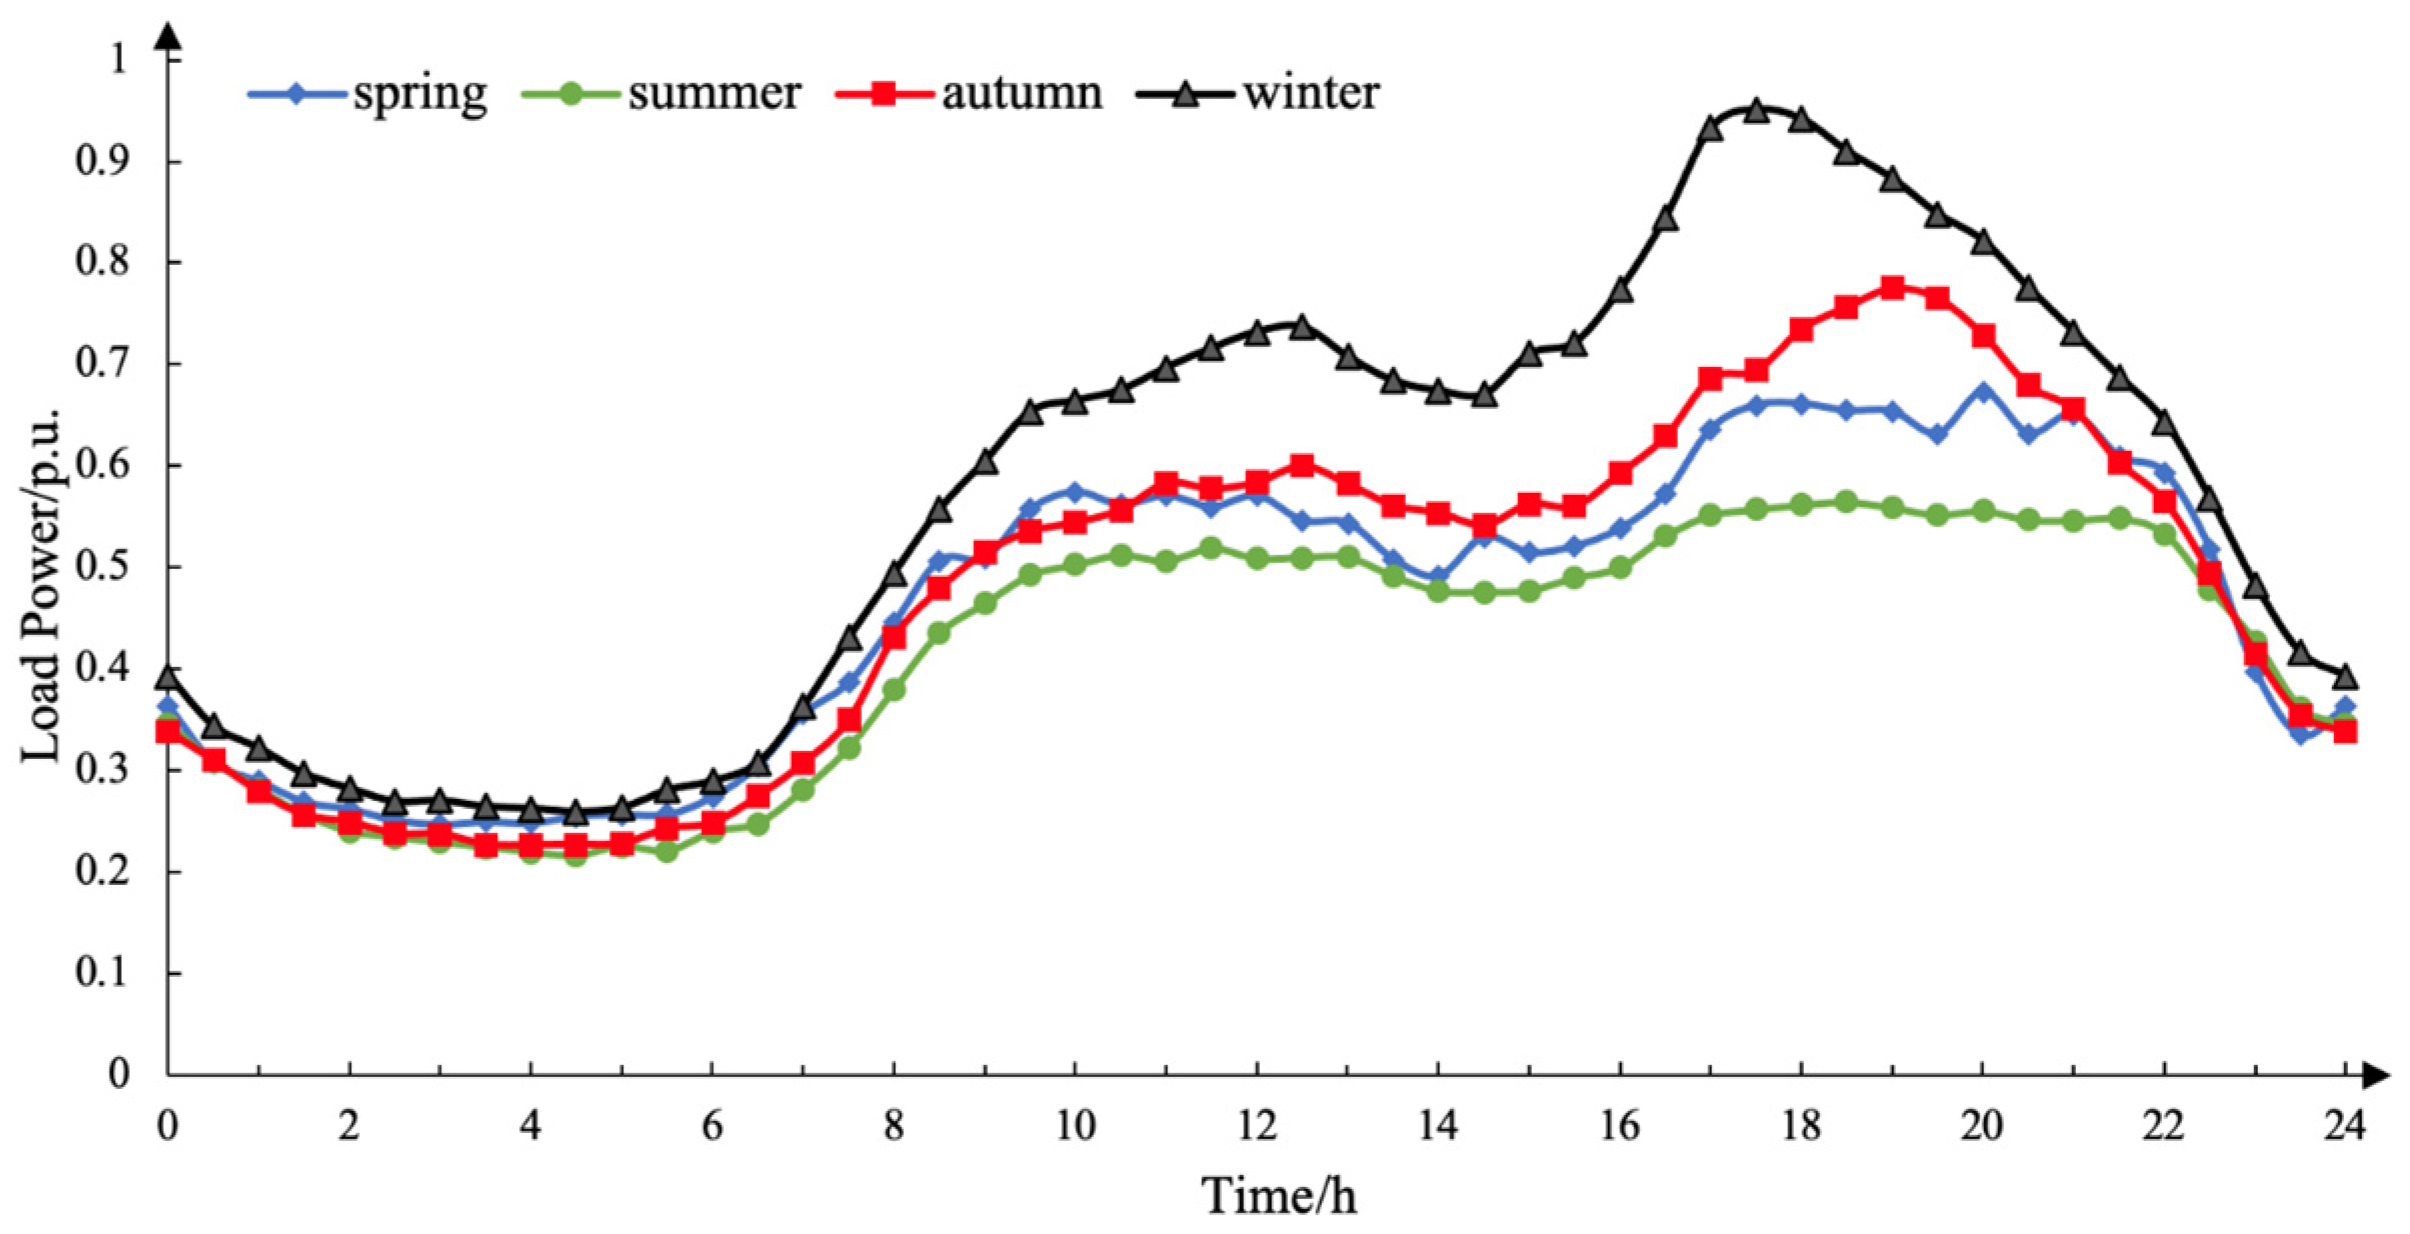
3.2. Forecasting Household Load

The average profile class data in 2021 were published by Elexon (the National Supervision Department in the UK) and the average annual power consumption per half-hour of users is shown as profile class 1 (domestic unrestricted customers) [30]. The average value can be used to obtain the overall trend and power range. According to an analysis reported in [34], the household electricity load in low-voltage power systems is highly consistent with a gamma distribution.
The gamma distribution parameters reported in [35] are highly consistent with the size of the Gridlington distribution line selected. The corresponding gamma distribution parameters γ 1 ( μ 1 , σ 1 ) can be used to satisfy the linear relationship in Equation (17), which is determined as a function of the mean μ1 and standard deviation σ1. The gamma distribution is chosen, as shown in Equation (18).
σ 1 = a μ 1 + b
where a = 0.18 and b = 1.52 .
f ( x ) = 1 Γ ( k ) θ k x k 1 e x θ
where μ 1 = k θ and σ 1 k = k θ 2 .
The electricity consumptions of 32 household electricity users are simulated each half-hour per day for four seasons. One of the households is selected as an example, as shown in Figure 7. The load data are changed every half-hour to facilitate the introduction of smart meters for TOU. According to the 24 h optimization method to simulate one day to present a season, the four seasons are used for the whole year.
The data of the load can be connected to the power grid as a controlled current source according to the PQ control to realize the automatic coordination of the power grid. This control mode is beneficial to observe the dynamics within the system. In addition, the physical model can be better simulated by connection with the inverter. It is only applicable to the time mode of continuous or discrete in the POWERGUI in Simulink, and is not applicable to the phasor mode in the POWERGUI. However, the phasor mode can be simulated in a very short time even if the simulation period is one year. If we only focus on the amplitude and phase changes of voltage and current, the phasor mode is ideal to meet the needs. According to Gridlington’s data, the power factors of 32 household electricity users are also set to be 0.97 uniformly. The active power of 32 household electricity users can be generated by a Monte Carlo simulation in advance, and the corresponding reactive power can be balanced by the compensator deployed in the grid. Therefore, the specific calculation does not need to consider reactive power. The load power is converted as the controlled current source connected to the grid, as shown in Figure 8. Based on parameter options, the transformer model selected for this area is 50 kWh to meet the peak time. There is a lot of capacity waste. It is generally required to reserve 70% of the transformer margin, and the power consumption of each household is generally 0.6 kW (30 houses). If the peak value can be reduced, and if the next level transformer can be reserved, that is, 25 kWh, the total power needs to be controlled at 17.5 kWh. For the three-tier tariff, in the peak or shoulder peak period, if the load provided by the transformer is greater than 17.5 kWh, the DSR will need to respond. Simulink will judge according to this situation. According to the social survey, only 30% of people will participate in the demand response.

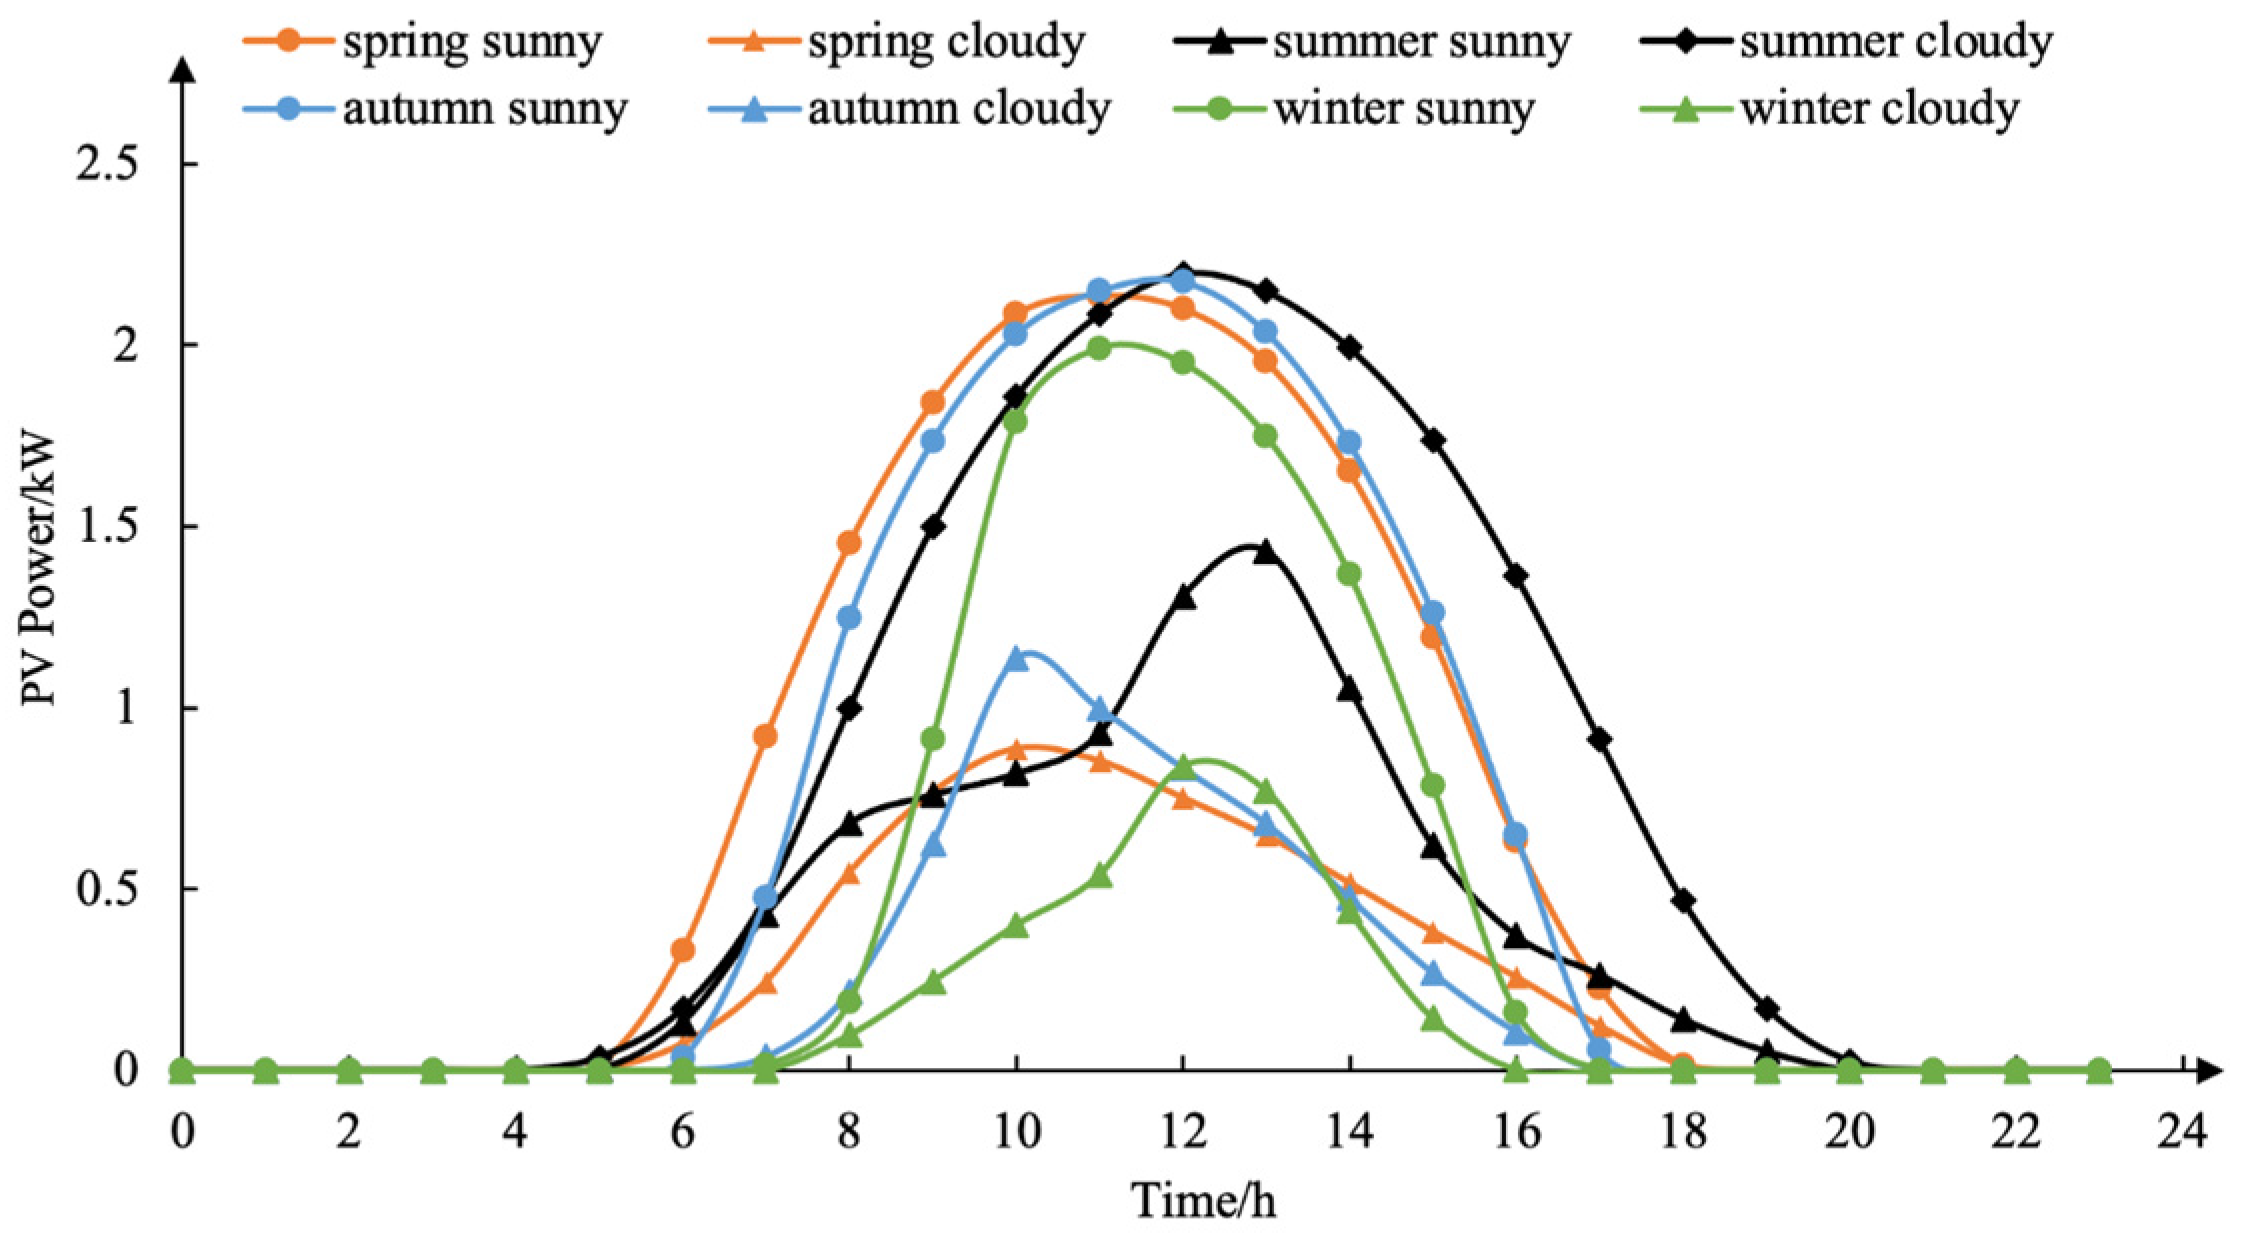
3.3. Predict the Electric Energy Generated by the PV

The household PV contains solar panels and inverters, and the costs of the household PV include installation, operation, and maintenance costs. The cost of the solar panels is determined by their size. In the UK, the most common size of the household PV is 4 kW, which fits the roof area [36,37]. The service life of the household PV is generally 25 years. The working life of the PV is set at 20 years in this paper because the efficiency dropped sharply from 20 to 25 years in the final few years [38].
Based on the solar data in sandy-Bedfordshire and the specified PV size, the hourly power generation can be automatically generated through the website [39]. It is assumed that 32 household electricity users with the same kind of PVs will convert the same amount of electricity. There is a large difference between the amount of PV energy produced on sunny and cloudy days. Therefore, sunny and cloudy days need to be calculated separately to accurately estimate annual electricity consumption.
The sun emits radiation into the atmosphere in the form of electromagnetic waves, and clouds filter it in the process. There are many clouds on cloudy days, the radiation is sharply reduced, and the diffusion is increased. The process is irregular. The radiant rate during a sunny day changes smoothly without volatility, while the radiant rate during a cloudy day changes violently and irregularly. The average values of sunny- and cloudy-converted electricity in four seasons are obtained by the website, as illustrated in Figure 9. It is noted that the violent fluctuations in the household PV power generation during the cloudy days are not obvious in Figure 9, because the data are measured on an hourly basis.
The number of sunny and cloudy days in the UK can be obtained by the meteorological aggregation to make a one-year estimate [40], with the final estimated ratio used shown in Table 4. The energy generated by PVs is connected to the grid in the same way as the load.

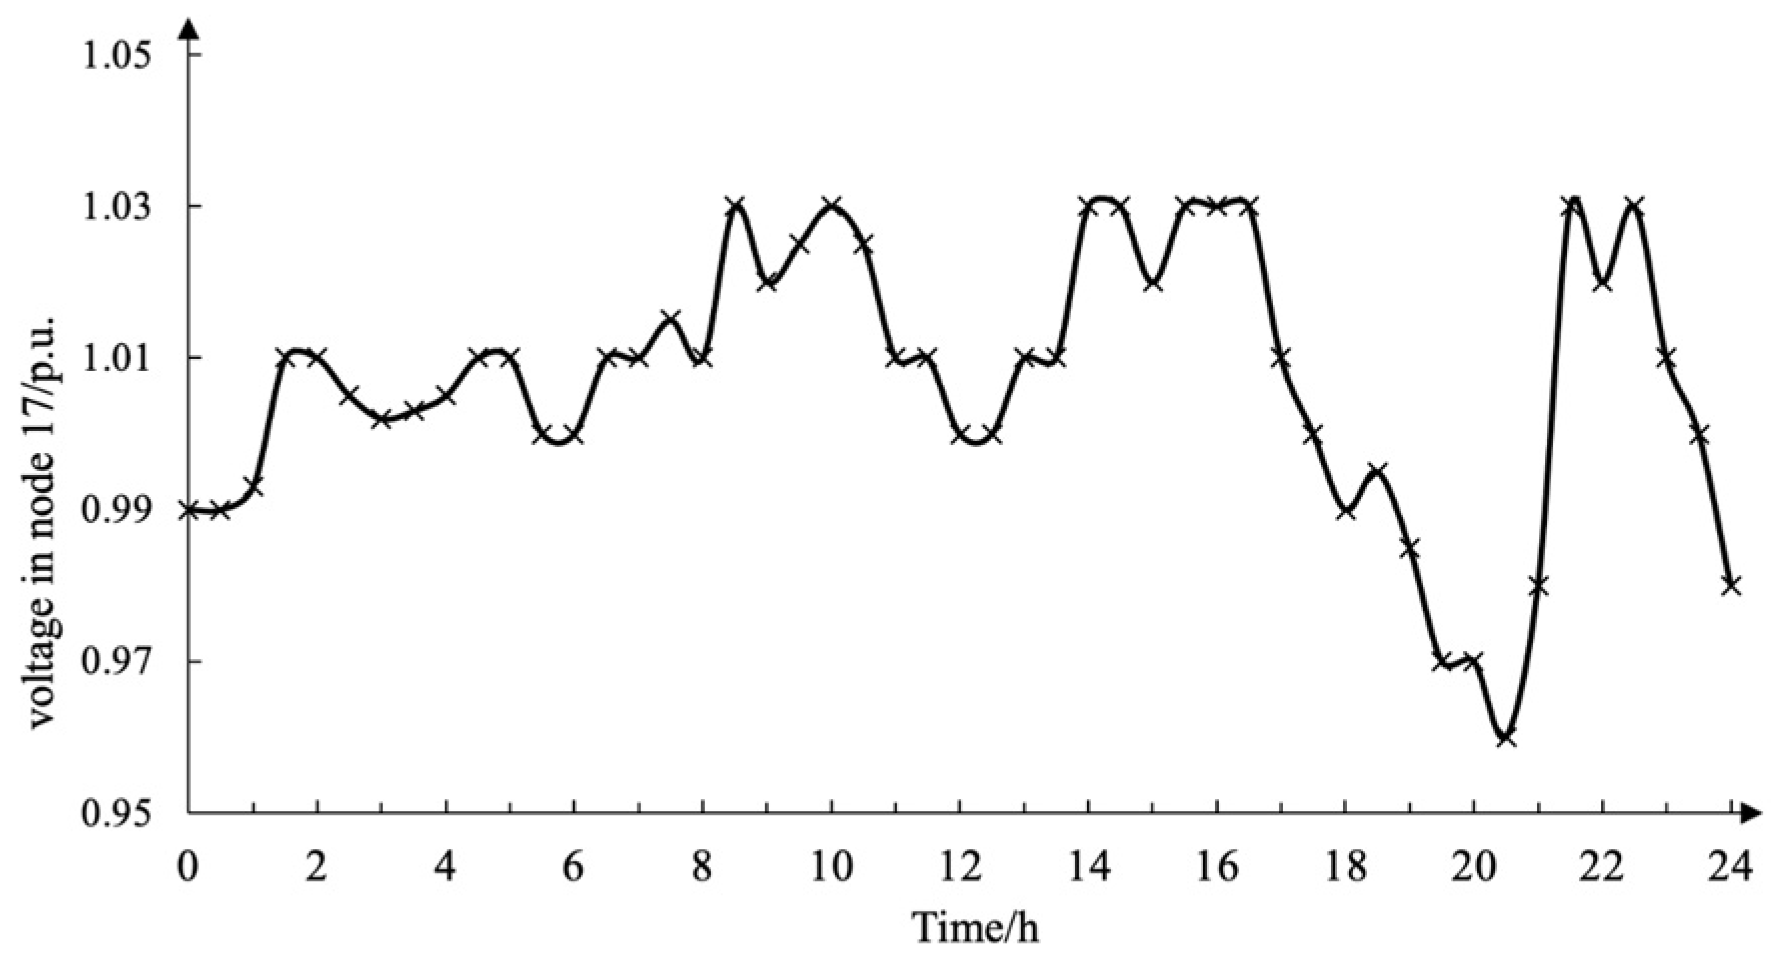
3.4. Operation Conditions of the Distribution Line

According to the flow chart and the data, the simulation is carried out. According to the results, taking node 17 in Figure 6 as an example, the voltage of the distribution line with the household BESS and PV meets the requirements, as illustrated in Figure 10. The power flow results obtained by Simulink are explained in the following specific cases. Both the voltage and the power flow meet the constraint requirements of the distribution line.
As shown in Figure 10, when the BESS working is coordinated with the PV, the use of the BESS can compensate for the potential voltage imbalance caused by the addition of PVs, which is consistent with the experimental results demonstrated by Ahmed et al. [41]. Ahmed et al. verified the state of the power grid with the introduction of the BESS in various extreme cases. In this paper, the voltage balance is only considered in general.

4. Results

4.1. The Power Consumption for Household Users

The simulation model obtained by the corresponding scenarios can clearly show the power flow of household electricity consumption at various times of the day. Take the BESS with a 4 kWh BESS as an example to test.

4.1.1. Case 1: The BESS Connected with the PV in Standard Pricing (in Scenario 1)

In scenario 1, the charging condition of the BESS only needs to consider whether the PV energy has excess electric energy production. Through the simulation shown in Figure 11, with the large electricity consumption in winter, the BESS cannot work on cloudy days. The expected state of discharge when the SOC is charged to 90% is only satisfied on sunny days in summer, and the life of the BESS will be significantly shortened.
Load is the household electricity consumption, which is in the discharge state for the distribution line, so it has a negative value. For the load power from the grid, it is negative when the grid needs to provide electricity to the residents, and positive when the PV has excess energy that transmits to the grid. For the BESS, the power is positive when the battery is charged.
In this case, there is no extra energy to charge the BESS on a cloudy winter day. On sunny days in winter and cloudy days in summer, there is no way to charge the BESS fully. Only on sunny days in summer can the capacity of the battery be fully utilized. In scenario 1, the BESS cannot fully play its role.

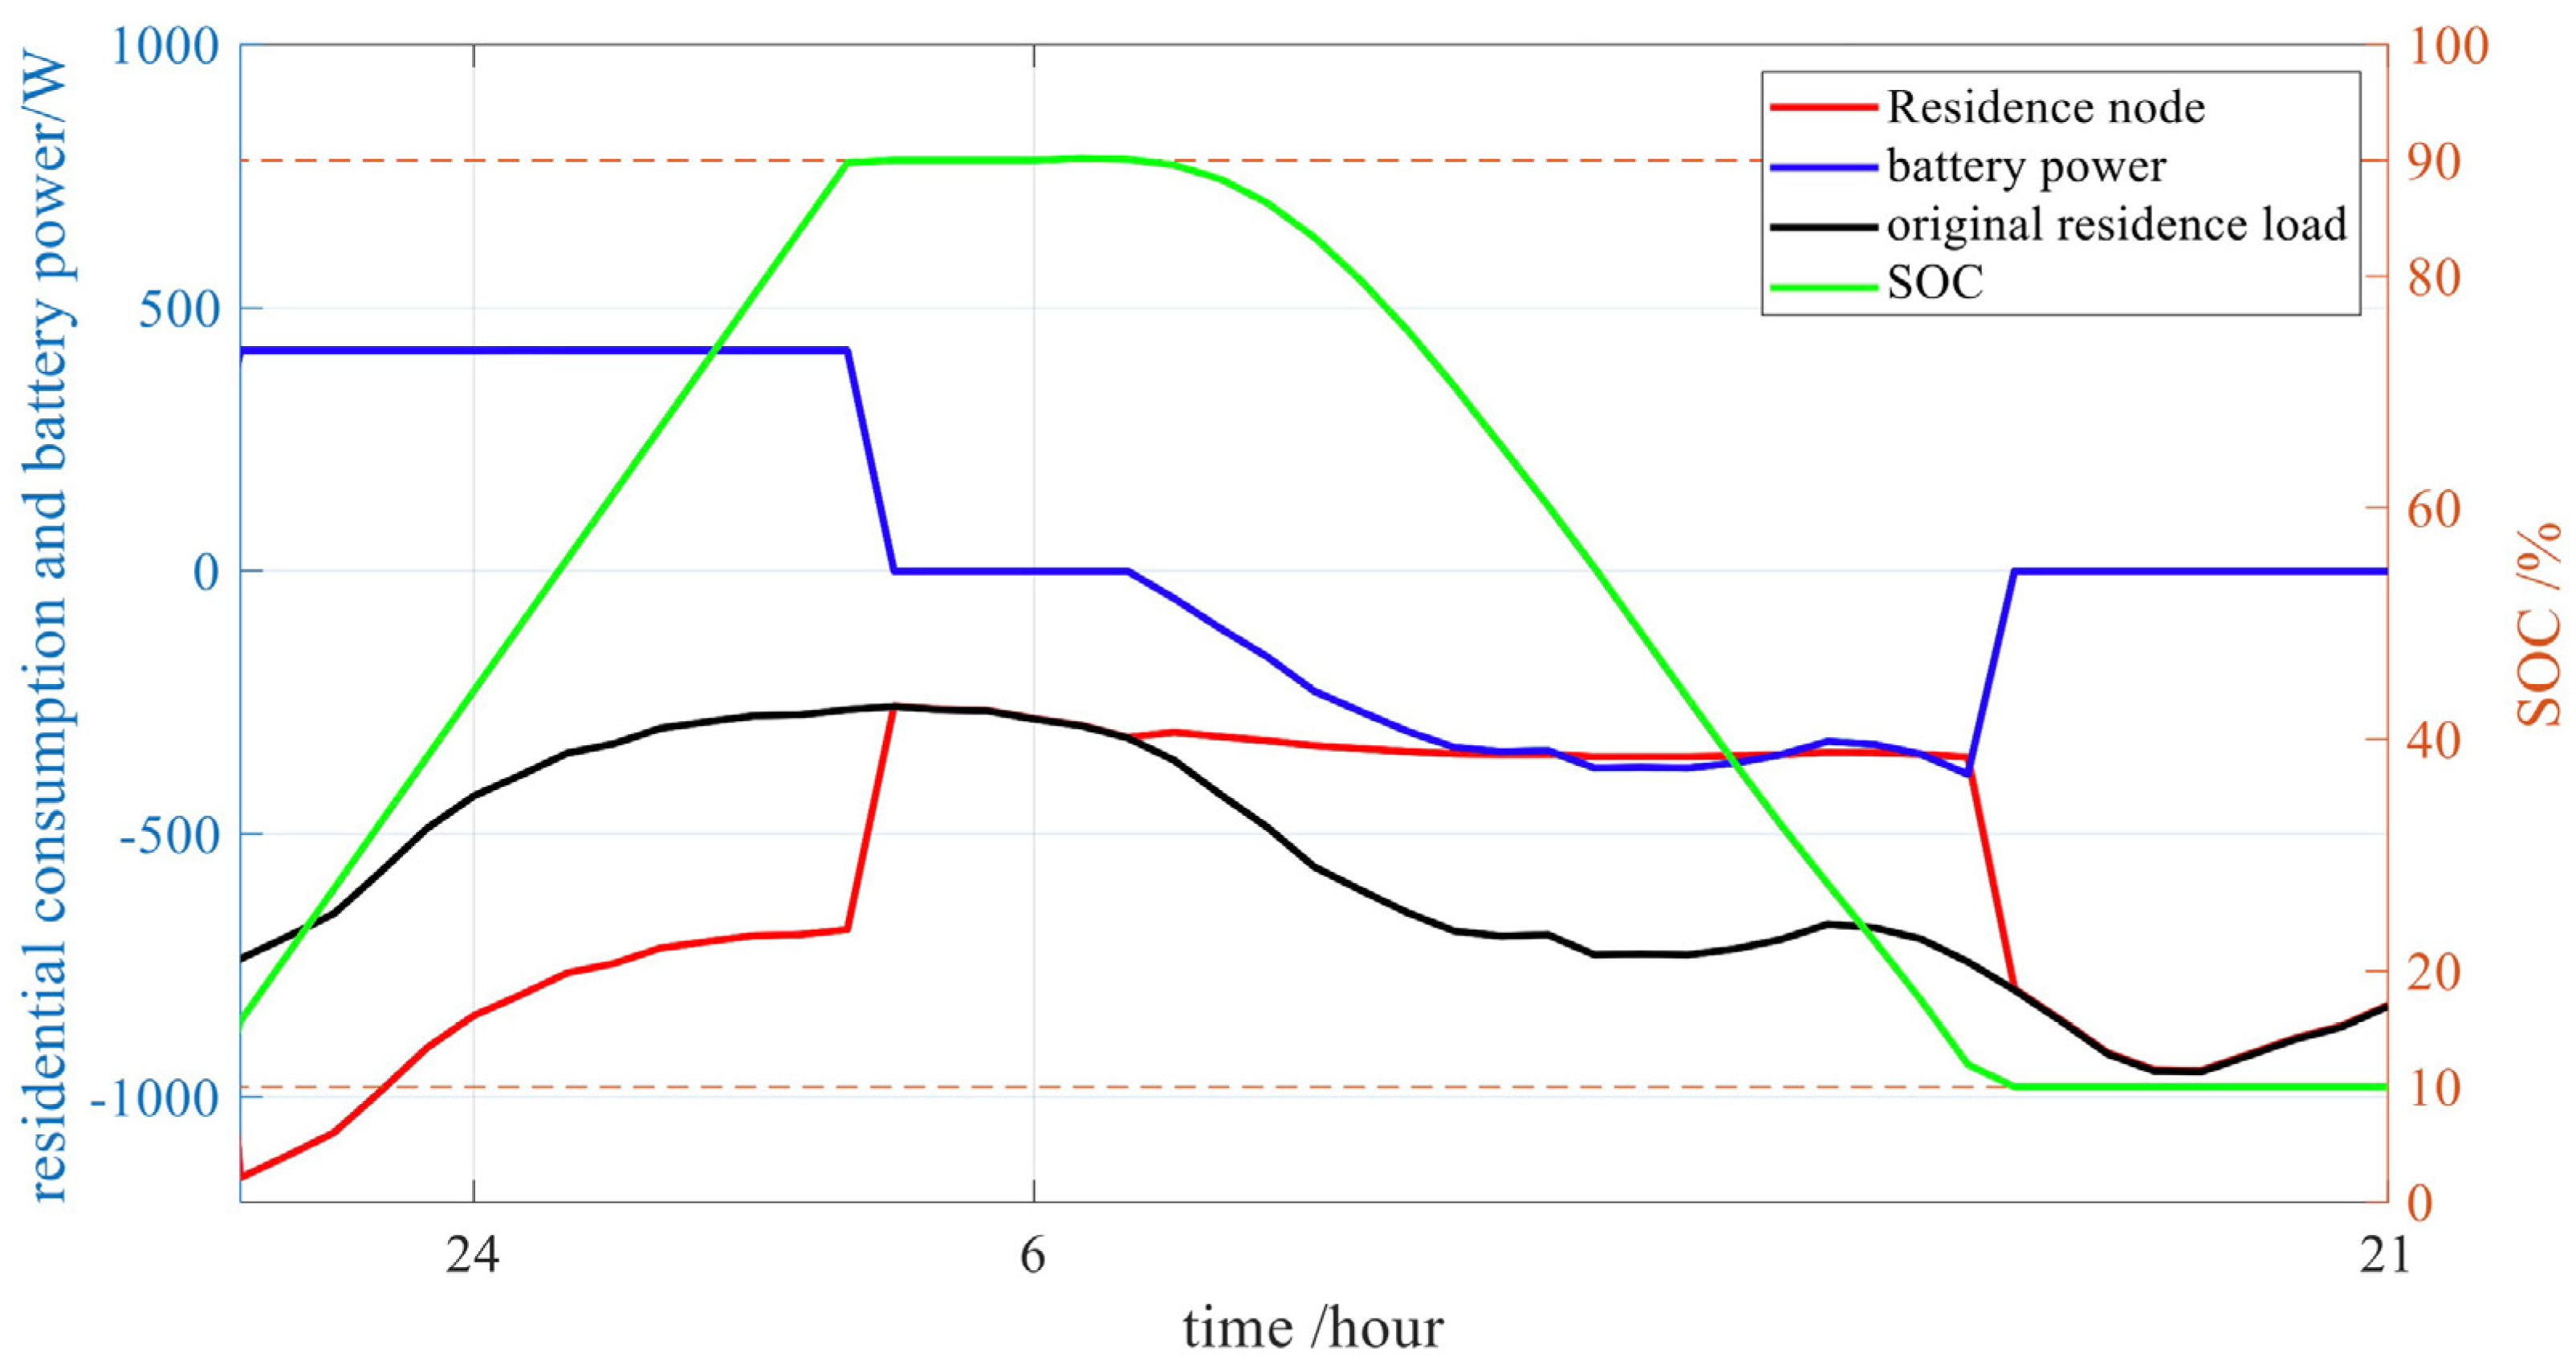
4.1.2. Case 2: Only BESS in TOU Pricing (in Scenario 2 and Scenario 4)

For scenarios 2 and 4, the condition is not affected by the weather. The BESS and the household load are based on the time difference from the electricity pricing to control the BESS. To cause the BESS consumption to cycle in days, the statistics of the Economy 7 pricing case (i.e., scenario 2) starts at 9 p.m. The time of 9 p.m. is the beginning of the off-peak period, so there should be no capacity in the BESS. The result on the sunny day in winter is as shown in Figure 12. A SOC of 10% at the end of the peak time ensures that there is no subsequent waste and that maximum profit can be made. A SOC of 90% at the end of the off-peak period guarantees BESS consumption during the peak period. The three-tier tariff adds a buffer from 2 p.m. to 4 p.m. based on the Economy 7 tariff and the pricing from 4 p.m. to 6 p.m. adjusts to a higher rate. The result on the sunny day in winter is as shown in Figure 13. In these cases, the BESS can be fully cycled daily. However, the BESS has a long rest period and does not participate in the activities of the line at all times. When the energy is stored in the BESS, it can consume itself. The cases in scenarios 2 and 4 are heavily dependent on the size of the BESS: the larger the size, the less electricity fee is paid.

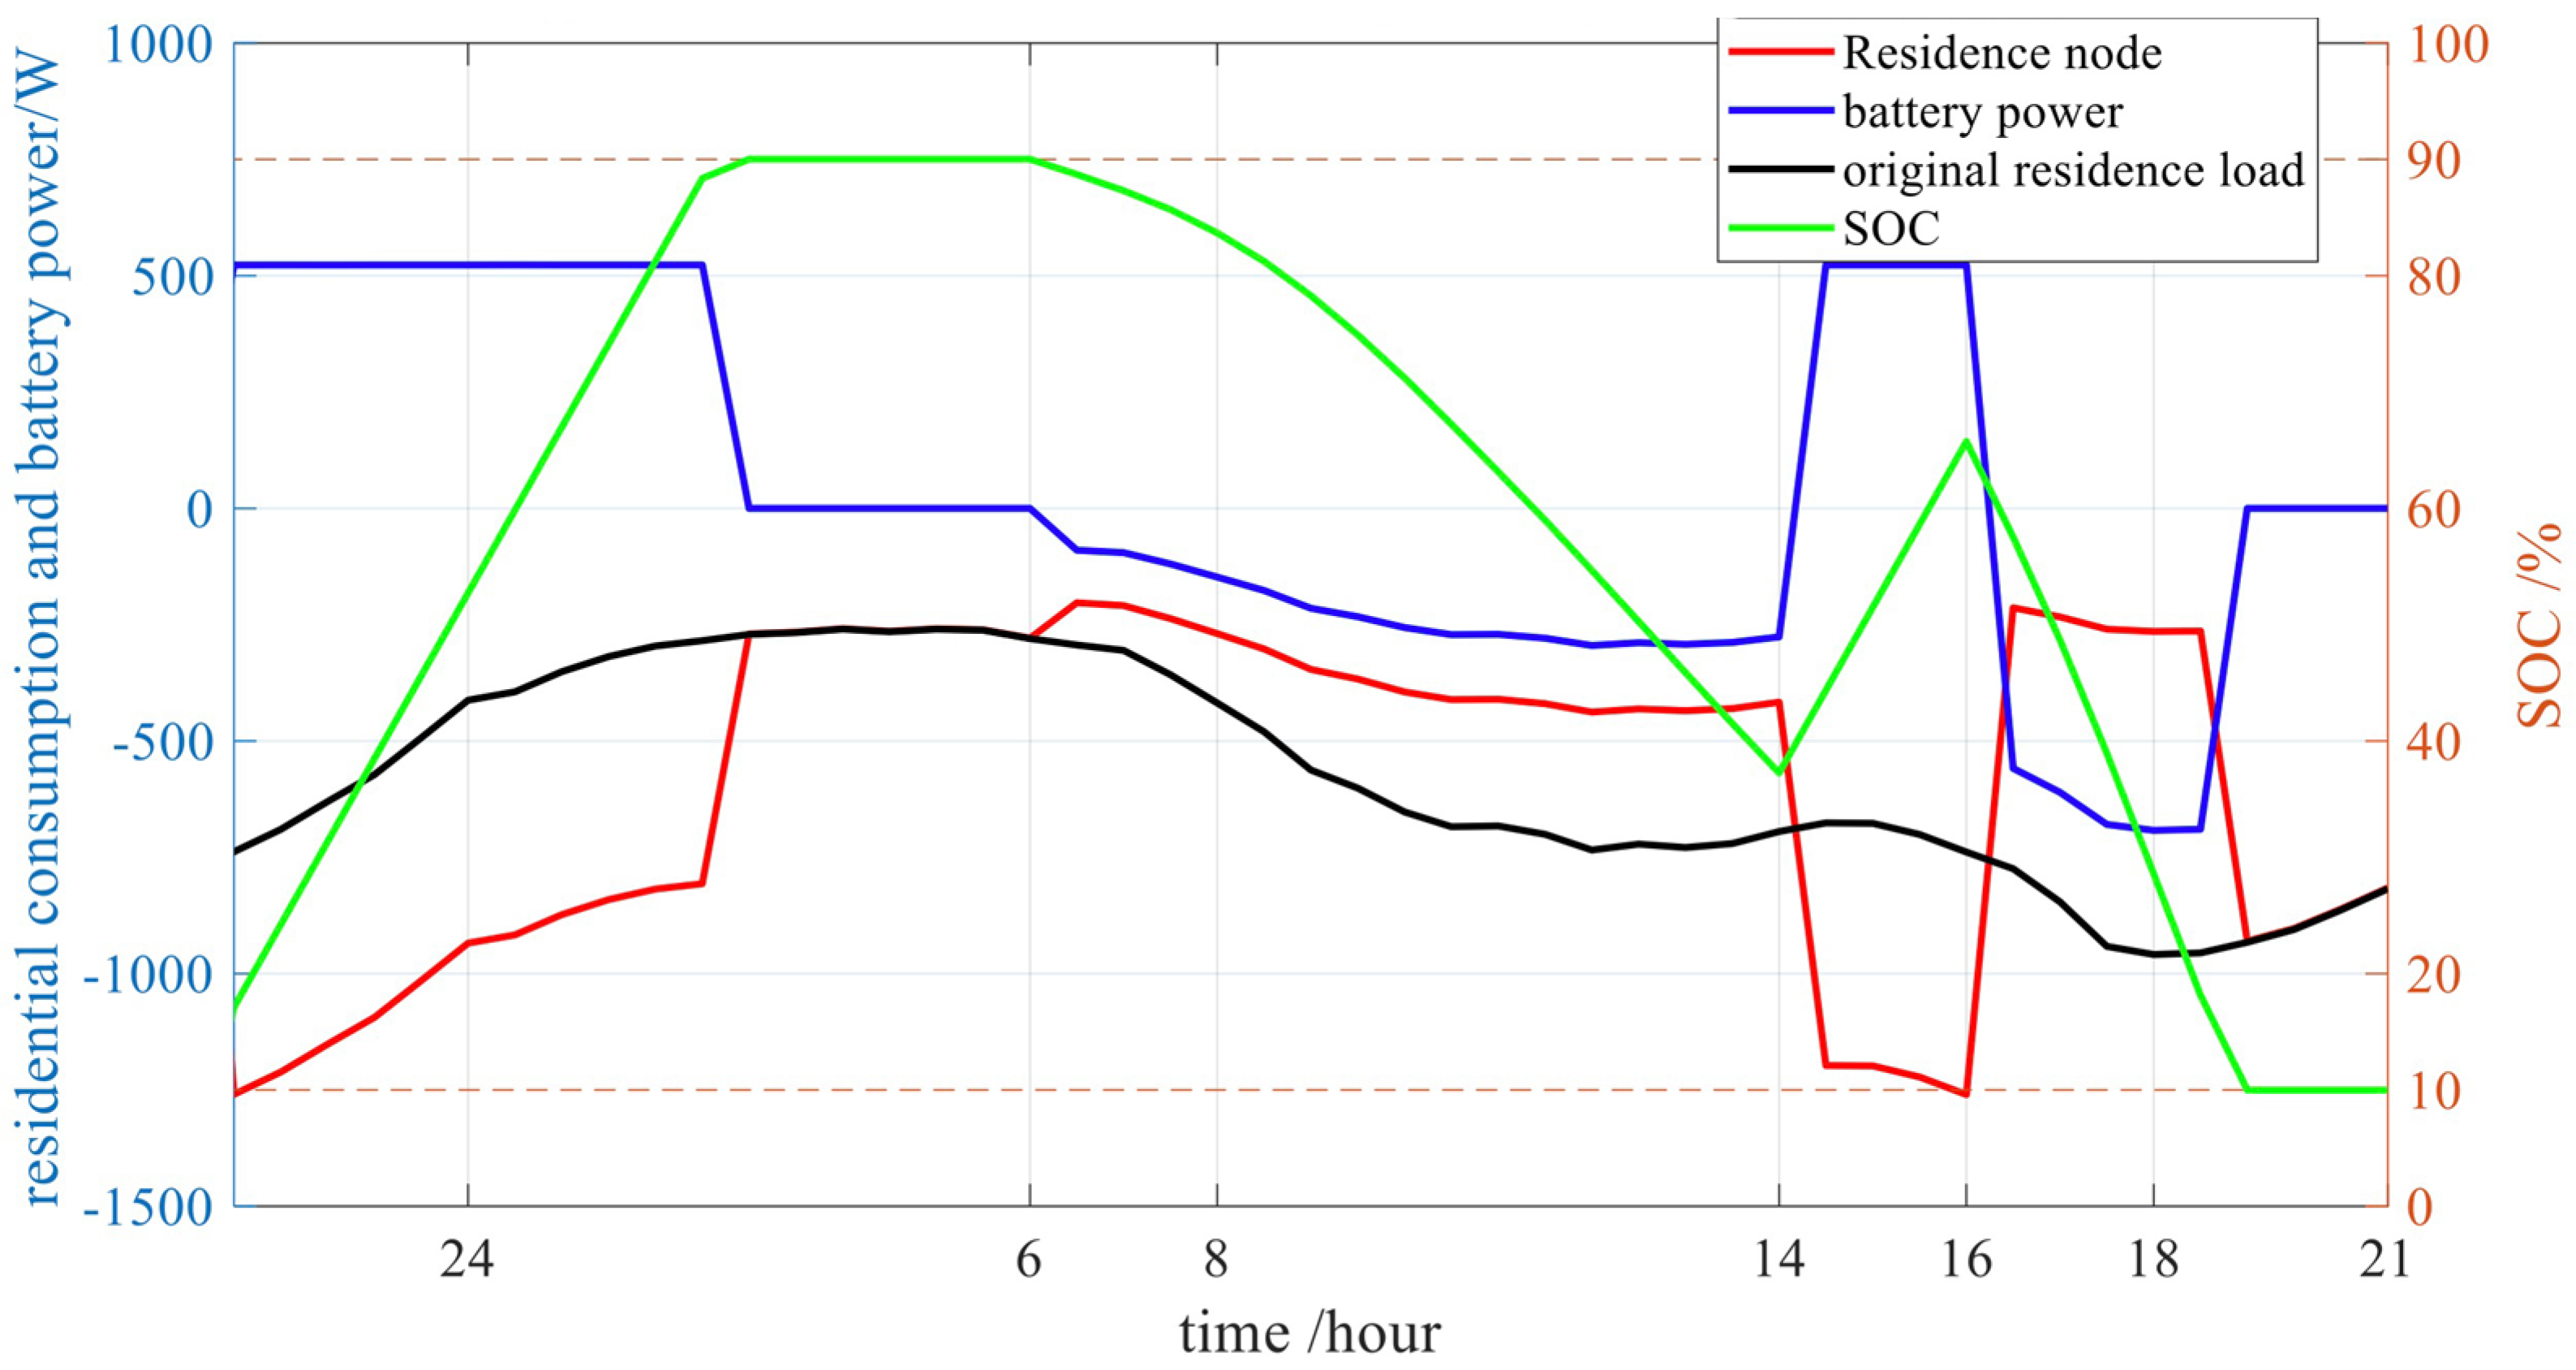
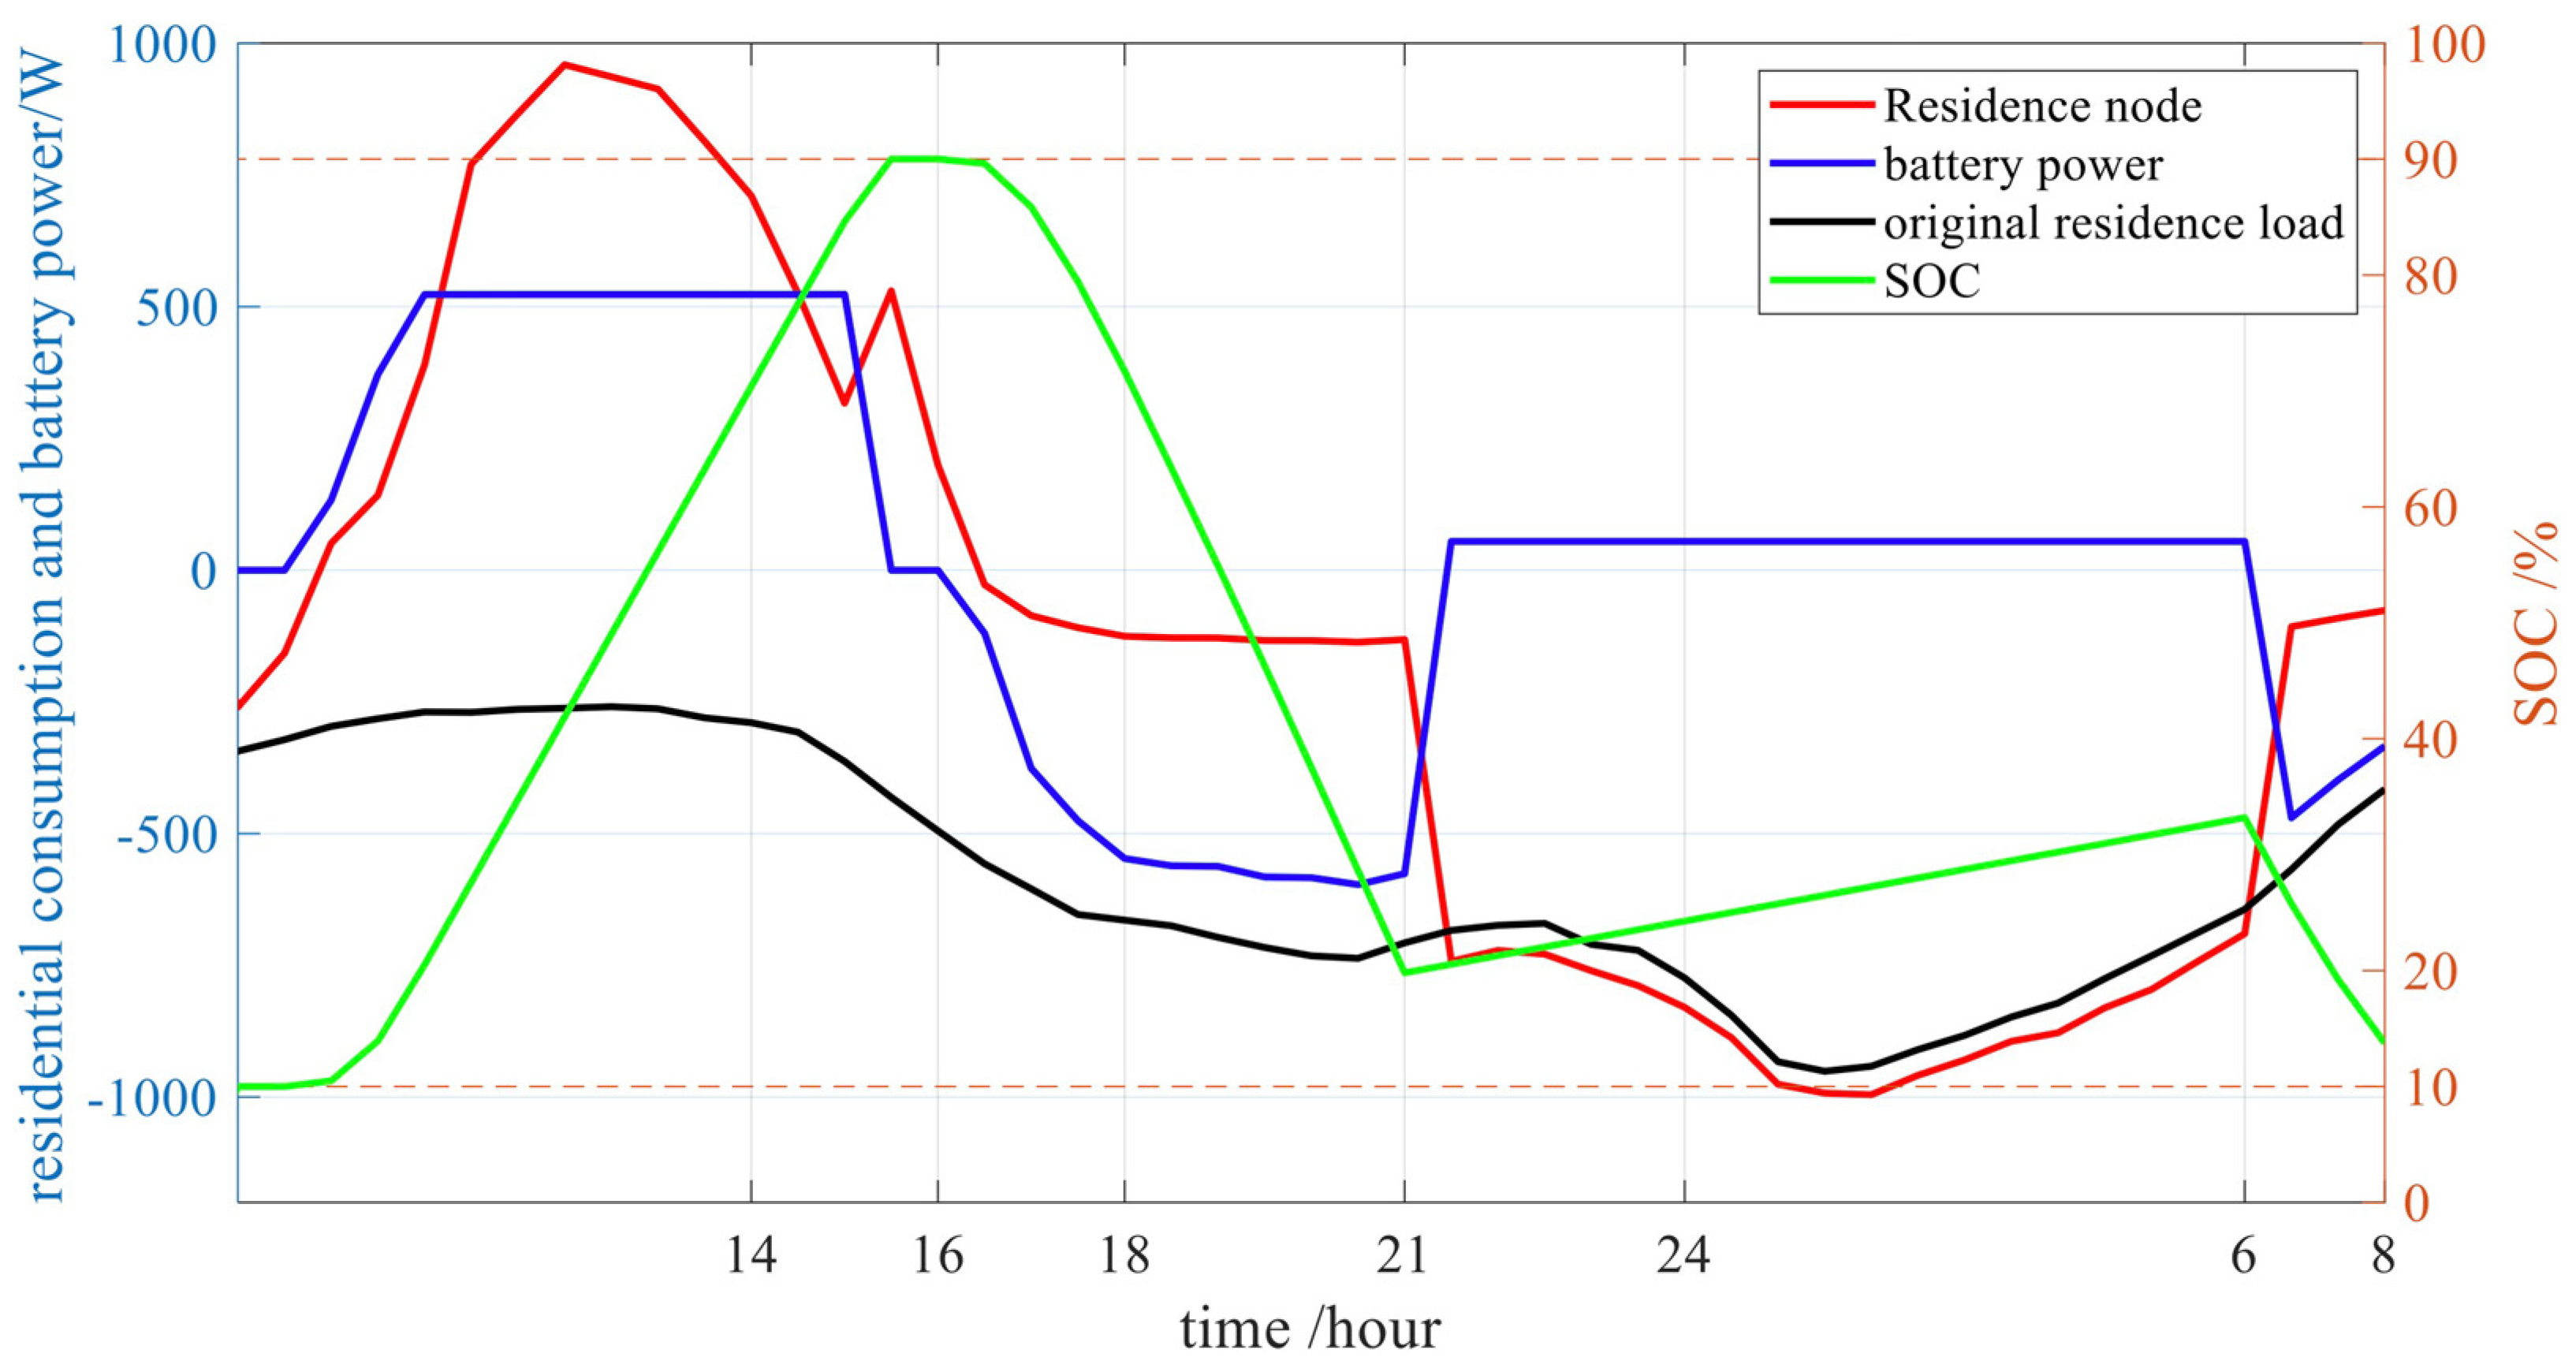
4.1.3. Case 3: The BESS Connected with the PV in TOU Pricing (in Scenario 3 and Scenario 5)

The BESS for the household user with the PV is mainly stored from the PV. For the Economy 7 price (i.e., scenario 3), as 6 a.m. to 8 a.m. is in the peak period, there is no PV generation, and it is necessary to prepare the BESS energy from 6 a.m. to 8 a.m. in advance in the off-peak period. The result on the sunny day in winter is as shown in Figure 14. The result on the sunny day in winter is as shown in Figure 14. The three-tier tariff with the PV can be combined with case 2 and case 3 in the Economy 7 tariff, shown in Figure 15. By comparison with Figure 12, because of the PV, there is no need to conduct centralized charging from 2 p.m. to 4 p.m. to supply from 4 p.m. to 6 p.m., thus avoiding the new peak time from 2 p.m. to 4 p.m. Because the household does not supply energy entirely through the BESS and line, 4 kWh can carry out reasonable control and meet the needs of residential users without wasting capacity.
According to the current results, the Economy 7 tariff is more appropriate for use by the household BESS, but the current results are from the winter sunny days, which are the most adequate use of BESSs. From the eight typical days of the whole year, the three-tier tariff is the more reasonable use of BESSs.

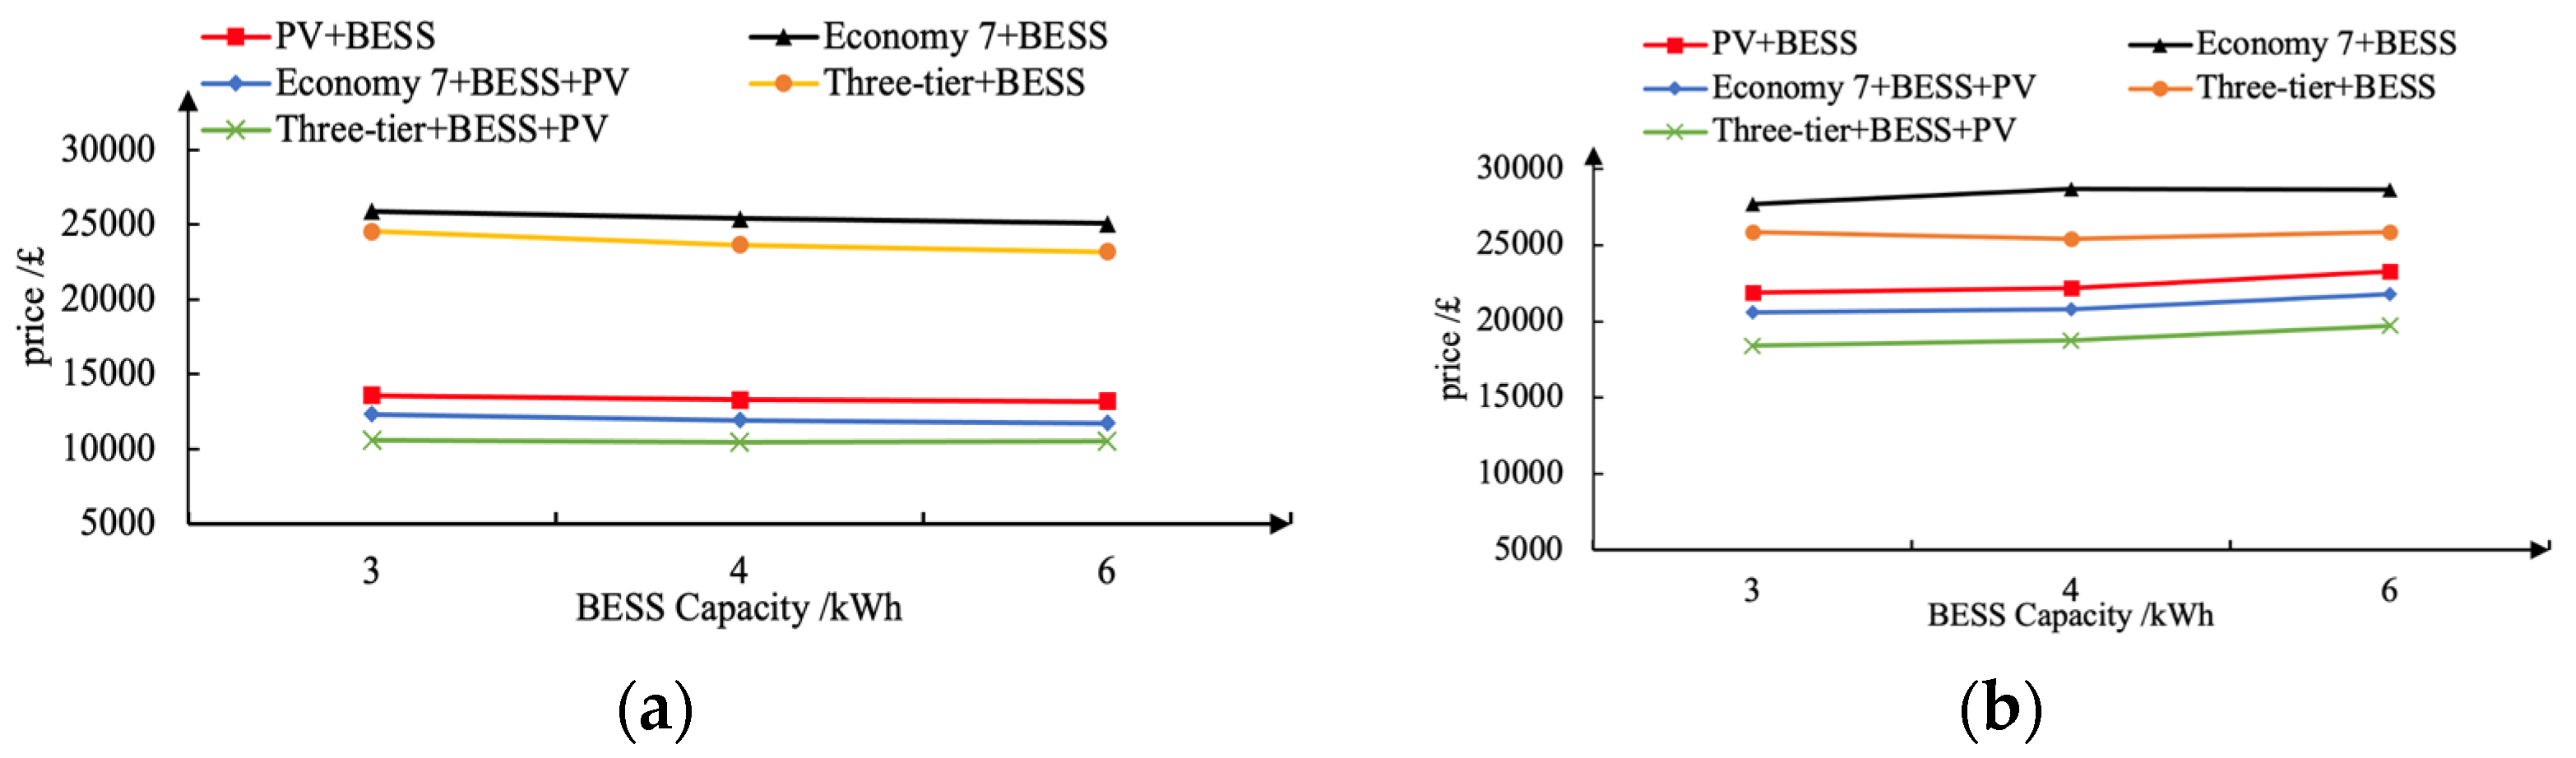
4.2. The Cost of the BESS and the Most Suitable Size

The total cost of the 4 kWp PV currently used in most homes ( ρ PV ) is estimated at GBP 6500 [42]. In 2018, the estimated purchase cost of LiFePO4 battery components was about 290 to 670 GBP/kWh, and the inverter and labor costs were 150 GBP/kWh. Assuming that the inverter and labor costs remain constant, it is expected that the price of battery modules can reach 130 to 440 GBP/kWh by 2030 [7]. The total price of a LiFePO4 cell ( ρ BESS ) is estimated to be around 530 GBP/kWh by 2030. The BESS price is related to the capacity, C BESS . The total equipment cost ( ρ total ) is their total cost.
ρ total = ρ PV + C BESS × ρ BESS
S P B T system = ρ total P
where P is the annual interests of the system investment. This paper considers investment income and adopts the Simple Payback Time (SPBT) method, ignoring the time nature of cost (e.g., depreciation price). It is assumed that the annual rate of return of PVs and BESSs is constant within 20 years of working time.
Based on the proportion of sunny and cloudy days in the UK described in Table 5, the total electricity price for a season is estimated using the following equation (spring is an example), and the final annual cost is the sum of the four seasons.
ρ s p r i n g = ρ s u n n y × N s u n n y N s p r i n g + ρ c l o u d y × N c l o u d y N s p r i n g
where ρ s p r i n g is the total electricity fee in spring and ρ s u n n y is the electricity fee on a sunny day in spring. N s u n n y is annual sunny days and N s p r i n g is annual spring days.
According to Table 5, the total electricity fee of 20-year consumers without considering the equipment price and the total electricity fee of 20-year consumers with the equipment price can be obtained, as shown in Figure 16.
When the equipment cost is not considered, the larger the capacity of the BESS, the lower or slightly lower the electricity fee. As for the Economy 7 tariff pricing, it is clear from Case 2 that the larger the BESS capacity, the better. However, any reasonable battery capacity would be unaffordable for users, and this is a major reason for the current restrictions on the household BESS. When the Economy 7 pricing is changed to the three-tier tariff pricing, the lowest point of the total cost appears when the battery capacity is 4 kWh, indicating that the three-tier pricing mode is very effective in reducing the required battery size and total electricity cost.
By comparing costs, the 4 kWh and 6 kWh BESSs and PVs at the three-tier rate TOU have significant economic advantages. Although the 6 kWh BESS is larger than the 4 kWh, it is not suitable for the current control mode when applied in households. Through simulation, it can be seen that the node voltage changes throughout the day, as shown in Figure 17 below. The 6 kWh BESS will experience significant saturation when working under the current control mode, and the state will quickly return to the situation without BESS participation, resulting in obvious spikes, which is not conducive to the stability. Therefore, the 4 kWh BESS is most suitable for combining PVs at the three-tier rate TOU.

5. Conclusions

Through the simulation of a distribution line, this paper technically confirms that the household BESS has a positive effect on the distribution line, and verifies from various perspectives that the introduction of the innovative three-tier rate not only has a positive effect on the distribution line, but can also easily achieve the purpose of saving electricity fees by combining with PVs to realize the equipment cost recovery. Compared with the past when it is impossible to use the household BESS due to the high cost [43,44], the combination of TOU and PVs can make profits, which can fundamentally solve the problem where the BESS cannot be widely applied. At the same time, based on the user power consumption forecast data and battery development in 2030, this paper also obtains the optimal BESS access size that should be connected to 4 kWh of BESS capacity in 2030 to obtain the maximum profit and technical support.
The combination of TOU and PVs can alleviate the inconvenience caused by TOU. With battery development reducing costs, small-size batteries for household BESSs can be affordable for achieving the same effect as a large one. With the introduction of sustainable energy, the household BESS slows down the need to upgrade the grid and brings more convenience for low-carbon living.
Although this article provides good economic support for the application of BESSs, the operating modes considered in this article are for normal situations. The specific operation of the power grid is complex and variable, and the introduction of sustainable energy makes it so the impact of extreme weather cannot be ignored. Therefore, collaborative cooperation between multiple energy storage modules is also essential. As the previous research, a large integrated BESS has better handling methods for such situations [45]. In the choice between economy and technology, integrated energy storage and distributed energy storage will require more balance or cooperation in the future.

Funding

This research received no external funding.

Institutional Review Board Statement

Not applicable.

Informed Consent Statement

Informed consent was obtained from all subjects involved in the study.

Data Availability Statement

Data are not publicly available, though the data may be made available on request from the corresponding author.

Conflicts of Interest

The author declares no conflict of interest.

Appendix A

Sustainability 15 08853 g0a1

Appendix B

Sustainability 15 08853 g0a2

References

  1. A European Green Deal Striving to Be the First Climate-Neutral Continent. Available online: https://commission.europa.eu/strategy-and-policy/priorities-2019-2024/european-green-deal_en (accessed on 7 May 2023).
  2. Energy Balances for 150 Countries and 35 Regional Aggregates. Available online: https://www.iea.org/reports/world-energy-balances-overview (accessed on 7 May 2023).
  3. Fischer, D.; Surmann, A.; Lindberg, K.B. Impact of emerging technologies on the electricity load profile of residential areas. Energy Build. 2020, 208, 109614. [Google Scholar] [CrossRef]
  4. Sprake, D.; Vagapov, Y.; Lupin, S.; Anuchin, A. Housing estate energy storage feasibility for a 2050 scenario. In Proceedings of the 2017 Internet Technologies and Applications (ITA), Wrexham, UK, 12–15 September 2017; IEEE: Piscataway, NJ, USA, 2017; pp. 137–142. [Google Scholar]
  5. Toledo, O.M.; Oliveira Filho, D.; Diniz, A.S.A.C. Distributed photovoltaic generation and energy storage systems: A review. Renew. Sustain. Energy Rev. 2010, 14, 506–511. [Google Scholar]
  6. Martin, S.; Ryor, J. Prosumers in Bengaluru: Lessons for Scaling Rooftop Solar PV. Available online: https://www.wri.org/research/prosumers-bengaluru (accessed on 7 May 2023).
  7. Keiner, D.; Ram, M.; Barbosa, L.D.S.N.S.; Bogdanov, D.; Breyer, C. Cost optimal self-consumption of PV prosumers with stationary batteries, heat pumps, thermal energy storage and electric vehicles across the world up to 2050. Sol. Energy 2019, 185, 406–423. [Google Scholar]
  8. Energy Trends UK, January to March 2022; Department for Business, Energy and Industrial Strategy: London, UK, 2022. Available online: https://assets.publishing.service.gov.uk/government/uploads/system/uploads/attachment_data/file/1086781/Energy_Trends_June_2022.pdf (accessed on 7 May 2023).
  9. Mehos, M.; Kabel, D.; Smithers, P. Planting the seed. IEEE Power Energy Mag. 2009, 7, 55–62. [Google Scholar] [CrossRef]
  10. Karanki, S.B.; Xu, D.; Venkatesh, B.; Singh, B.N. Optimal location of battery energy storage systems in power distribution network for integrating renewable energy sources. In Proceedings of the 2013 IEEE Energy Conversion Congress and Exposition, Denver, CO, USA, 15–19 September 2013; IEEE: Piscataway, NJ, USA, 2013; pp. 4553–4558. [Google Scholar]
  11. Graditi, G.; Ippolito, M.G.; Telaretti, E.; Zizzo, G. An innovative conversion device to the grid interface of combined RES-based generators and electric storage systems. IEEE Trans. Ind. Electron. 2014, 62, 2540–2550. [Google Scholar]
  12. Grillo, S.; Marinelli, M.; Massucco, S.; Silvestro, F. Optimal management strategy of a battery-based storage system to improve renewable energy integration in distribution networks. IEEE Trans. Smart Grid 2012, 3, 950–958. [Google Scholar] [CrossRef]
  13. Nottrott, A.; Kleissl, J.; Washom, B. Energy dispatch schedule optimization and cost benefit analysis for grid-connected, photovoltaic-battery storage systems. Renew. Energy 2013, 55, 230–240. [Google Scholar] [CrossRef]
  14. Yang, Y.; Yang, N.; Li, H. Cost-benefit study of dispersed battery storage to increase penetration of photovoltaic systems on distribution feeders. In Proceedings of the 2014 IEEE PES General Meeting|Conference & Exposition, National Harbor, MD, USA, 27–31 July 2014; IEEE: Piscataway, NJ, USA, 2014; pp. 1–5. [Google Scholar]
  15. Chen, C.; Duan, S.; Cai, T.; Liu, B.; Hu, G. Smart energy management system for optimal microgrid economic operation. IET Renew. Power Gener. 2011, 5, 258–267. [Google Scholar] [CrossRef]
  16. Hu, W.; Chen, Z.; Bak-Jensen, B. Optimal operation strategy of battery energy storage system to real-time electricity price in Denmark. In Proceedings of the IEEE PES General Meeting, Minneapolis, MN, USA, 25–29 July 2010; IEEE: Piscataway, NJ, USA, 2010; pp. 1–7. [Google Scholar]
  17. Gallo, D.; Landi, C.; Luiso, M.; Morello, R. Optimization of experimental model parameter identification for energy storage systems. Energies 2013, 6, 4572–4590. [Google Scholar] [CrossRef]
  18. Youn, L.T.; Cho, S. Optimal operation of energy storage using linear programming technique. In Proceedings of the World Congress on Engineering and Computer Science, London, UK, 3–5 July 2009; pp. 480–485. [Google Scholar]
  19. Karimianfard, H.; Salehizadeh, M.R.; Siano, P. Economic Profit Enhancement of a Demand Response Aggregator Through Investment of Large-scale Energy Storage Systems. CSEE J. Power Energy Syst. 2022, 8, 1468–1476. [Google Scholar]
  20. Davis, M.; Hiralal, P. Batteries as a service: A new look at electricity peak demand management for houses in the UK. Procedia Eng. 2016, 145, 1448–1455. [Google Scholar] [CrossRef]
  21. Li, P.-H.; Keppo, I.; Xenitidou, M.; Kamargianni, M. Investigating UK consumers’ heterogeneous engagement in demand-side response. Energy Effic. 2020, 13, 621–648. [Google Scholar] [CrossRef]
  22. Hafeez, G.; Wadud, Z.; Khan, I.U.; Khan, I.; Shafiq, Z.; Usman, M.; Khan, M.U.A. Efficient energy management of IoT-enabled smart homes under price-based demand response program in smart grid. Sensors 2020, 20, 3155. [Google Scholar] [CrossRef]
  23. Albogamy, F.R.; Khan, S.A.; Hafeez, G.; Murawwat, S.; Khan, S.; Haider, S.I.; Basit, A.; Thoben, K.-D. Real-time energy management and load scheduling with renewable energy integration in smart grid. Sustainability 2022, 14, 1792. [Google Scholar] [CrossRef]
  24. Balakumar, P.; Vinopraba, T.; Chandrasekaran, K. Machine learning based demand response scheme for loT enabled PV integrated smart building. Sustain. Cities Soc. 2023, 89, 104260. [Google Scholar]
  25. Walker, I.; Hope, A. Householders’ readiness for demand-side response: A qualitative study of how domestic tasks might be shifted in time. Energy Build. 2020, 215, 109888. [Google Scholar] [CrossRef]
  26. Apt, R.W.J. Market Analysis of Emerging Electric Energy Storage Systems; National Energy Technology Laboratory: Morgantown, WV, USA, 2008. Available online: https://jointventure.org/images/stories/pdf/netl_market.analysis.of.emerging.electric.energy.storage.pdf (accessed on 7 May 2023).
  27. Vazquez, S.; Lukic, S.M.; Galvan, E.; Franquelo, L.G.; Carrasco, J.M. Energy storage systems for transport and grid applications. IEEE Trans. Ind. Electron. 2010, 57, 3881–3895. [Google Scholar] [CrossRef]
  28. Kuleshov, D.; Peltoniemi, P.; Kosonen, A.; Nuutinen, P.; Huoman, K.; Lana, A.; Paakkonen, M.; Malinen, E. Assessment of economic benefits of battery energy storage application for the PV-equipped households in Finland. J. Eng. 2019, 2019, 4927–4931. [Google Scholar] [CrossRef]
  29. Xiao, J.; Zhang, Z.; Bai, L.; Liang, H. Determination of the optimal installation site and capacity of battery energy storage system in distribution network integrated with distributed generation. IET Gener. Transm. Distrib. 2016, 10, 601–607. [Google Scholar] [CrossRef]
  30. Neufeld, J.L. Price discrimination and the adoption of the electricity demand charge. J. Econ. Hist. 1987, 47, 693–709. [Google Scholar] [CrossRef]
  31. Conflicts and Synergies of Demand Side Response; UK Power Networks, Low Carbon London Project: London, UK, 2014. Available online: https://innovation.ukpowernetworks.co.uk/wp-content/uploads/2019/05/A5-Conflicts-and-Synergies-of-Demand-Side-Response.pdf (accessed on 7 May 2023).
  32. Integrated Development of Low-Carbon Energy Systems. Available online: https://www.imperial.ac.uk/energy-futures-lab/idles/ (accessed on 7 May 2023).
  33. Mateo, C.; Reneses, J.; Rodriguez-Calvo, A.; Frías, P.; Sánchez, Á. Cost–benefit analysis of battery storage in medium-voltage distribution networks. IET Gener. Transm. Distrib. 2016, 10, 815–821. [Google Scholar] [CrossRef]
  34. Data Flows Available from BSC Systems. Available online: https://www.elexon.co.uk/data/key-data-reports/data-flows-available-from-bsc-systems/ (accessed on 7 May 2023).
  35. McQueen, D.H.; Hyland, P.R.; Watson, S.J. Monte Carlo simulation of residential electricity demand for forecasting maximum demand on distribution networks. IEEE Trans. Power Syst. 2004, 19, 1685–1689. [Google Scholar] [CrossRef]
  36. Koskela, J.; Rautiainen, A.; Järventausta, P. Using electrical energy storage in residential buildings–Sizing of battery and photovoltaic panels based on electricity cost optimization. Appl. Energy 2019, 239, 1175–1189. [Google Scholar] [CrossRef]
  37. UK Domestic Solar Panel Costs and Returns 2019; Green Business Watch: London, UK, 2019. Available online: https://greenbusinesswatch.co.uk/uk-domestic-solar-panel-costs-and-returns-2019#section4 (accessed on 7 May 2023).
  38. West, J. How Big of a Battery Bank Do You Need to Run a House? Available online: https://www.weekand.com/home-garden/article/how-big-of-a-battery-bank-do-you-need-to-run-a-house-18070303.php (accessed on 7 May 2023).
  39. Pfenninger, S.; Staffell, I. Simulations of the Hourly Power Output from Wind and Solar Power Plants Located Anywhere in the World. Available online: https://www.renewables.ninja (accessed on 7 May 2023).
  40. Climate and Average Weather Year Round in London. Available online: https://weatherspark.com/y/45062/Average-Weather-in-London-United-Kingdom-Year-Round (accessed on 7 May 2023).
  41. Ahmed, M.; Ganeshan, A.; Amani, A.M.; Al Khafaf, N.; Nutkani, I.U.; Vahidnia, A.; Jalili, M.; Hasan, K.; Datta, M.; Razzaghi, R. Effects of Household Battery Systems on LV Residential Feeder Voltage Management. IEEE Trans. Power Deliv. 2022, 37, 5325–5336. [Google Scholar] [CrossRef]
  42. How Much Does a Solar Battery Storage System Cost. Available online: https://www.greenmatch.co.uk/blog/2018/07/solar-battery-storage-system-cost (accessed on 7 May 2023).
  43. Salles-Mardones, J.; Flores-Maradiaga, A.; Ahmed, M.A. Feasibility Assessment of Photovoltaic Systems to Save Energy Consumption in Residential Houses with Electric Vehicles in Chile. Sustainability 2022, 14, 5377. [Google Scholar] [CrossRef]
  44. Shabbir, N.; Kütt, L.; Daniel, K.; Astapov, V.; Raja, H.A.; Iqbal, M.N.; Husev, O. Feasibility Investigation for Residential Battery Sizing Considering EV Charging Demand. Sustainability 2022, 14, 1079. [Google Scholar] [CrossRef]
  45. Koskela, J.; Järventausta, P. Demand Response with Electrical Heating in Detached Houses in Finland and Comparison with BESS for increasing PV Self-Consumption. Energies 2023, 16, 497. [Google Scholar] [CrossRef]
Figure 1. Three kinds of electricity price strategies.
Sustainability 15 08853 g001
Figure 2. The control strategy of the household BESS in Scenario 1.
Sustainability 15 08853 g002
Figure 3. The control strategy of the household BESS in Scenario 3.
Sustainability 15 08853 g003
Figure 4. The control strategy of the household BESS in Scenario 5.
Sustainability 15 08853 g004
Figure 5. The three main types of communication in the five scenarios modeled.
Sustainability 15 08853 g005
Figure 6. The Simulink model of the distribution line in Area 118 based on Gridlington (total node diagram and partial Simulink model).
Sustainability 15 08853 g006
Figure 7. A load of a typical household electricity user (The base value is the maximum electricity ever achieved).
Sustainability 15 08853 g007
Figure 8. Connect the load to grid by Simulink.
Sustainability 15 08853 g008
Figure 9. The power generation of the household PV during 8 typical days.
Sustainability 15 08853 g009
Figure 10. The one-phase voltage of node 17 in Scenario 5 (p.u.).
Sustainability 15 08853 g010
Figure 11. Residence with PV and 4 kWh battery on: (a) cloudy days in winter; (b) cloudy days in summer; (c) sunny days in winter; (d) sunny days in summer.
Sustainability 15 08853 g011
Figure 12. Residence with BESS and Economy 7 tariff on the sunny day in winter.
Sustainability 15 08853 g012
Figure 13. Residence with BESS and the three-tier tariff on the sunny day in winter.
Sustainability 15 08853 g013
Figure 14. Residence with PV, BESS and Economy 7 tariff on the sunny day in winter.
Sustainability 15 08853 g014
Figure 15. Residence with PV, BESS and the three-tier tariff on the sunny day in winter.
Sustainability 15 08853 g015
Figure 16. Total household cost: (a) without equipment; (b) with equipment.
Sustainability 15 08853 g016
Figure 17. Residence with PV and 6 kWh BESS in sunny summer.
Sustainability 15 08853 g017
Table 1. Taxonomy table (√: considered, -: not considered, ×: unachievable).
ReferenceBESSDRWhether Afford the Cost
[9] --
[15] - ×
[16] - ×
[17] --
[18] ×
[21]- -
[22]- -
[23]- -
This study
Table 2. Three kinds of BESSs and their parameters.
TypeCapacity/kWhMaximum Charging Rate/kWMinimum Discharging Rate/kW
130.450.75
240.61.0
360.91.5
Table 3. Five scenarios designed to investigate the control strategies of the household BESS.
ScenariosPV Deployment ConditionsPrice Strategy
1withStandard
2withoutEconomy 7 tariff
3withEconomy 7 tariff
4withoutThe three-tier tariff
5withThe three-tier tariff
Table 4. The proportion of sunny and cloudy days in the UK.
WeatherSpringSummerAutumnWinter
Sunny30%50%50%25%
Cloudy70%50%50%75%
Table 5. The calculation fee for five model cases.
PVPrice Strategy C BESS
/kWh
ρ total
/GBP
Fee
/GBP/year
20 Years Electricity Fee
/GBP
Total Fee with Equipment
/GBP
withStandard3830067913,58021,880
withStandard4890066413,28022,180
withStandard610,10065913,18023,280
withoutEconomy 731800129525,90027,700
withoutEconomy 742400127025,40028,700
withoutEconomy 763600125325,06028,660
withEconomy 73830061612,32020,620
withEconomy 74890059611,92020,820
withEconomy 7611,00058611,72021,820
withoutThe three-tier31800122624,52025,870
withoutThe three-tier42700118223,64025,440
withoutThe three-tier63600115923,18025,880
withThe three-tier3830052810,56018,410
withThe three-tier4890052310,46018,760
withThree-tier6920052610,52019,720
Disclaimer/Publisher’s Note: The statements, opinions and data contained in all publications are solely those of the individual author(s) and contributor(s) and not of MDPI and/or the editor(s). MDPI and/or the editor(s) disclaim responsibility for any injury to people or property resulting from any ideas, methods, instructions or products referred to in the content.

