Article

Performance Optimization of Lignocellulosic Fiber-Reinforced Brake Friction Composite Materials Using an Integrated CRITIC-CODAS-Based Decision-Making Approach

1
Savaria Institute of Technology, Faculty of Informatics, ELTE Eötvös Loránd University, 9700 Szombathely, Hungary
2
Department of Mechanical Engineering, Madhav Institute of Technology and Science, Gwalior 474005, India
3
Mechanical Engineering Department, Graphic Era (Deemed to be University) Dehradun, Dehradun 248002, India
4
Department of Mechanical Engineering, School of Engineering & Technology, K.R. Mangalam University, Gurgaon 122103, India
5
Faculty of Engineering and Management, Abhilashi University, Mandi 175028, India
6
Department of Materials Science and Engineering, Széchenyi István University, 9026 Győr, Hungary
*
Author to whom correspondence should be addressed.
Sustainability 2023, 15(11), 8880; https://doi.org/10.3390/su15118880
Submission received: 24 March 2023 / Revised: 21 May 2023 / Accepted: 26 May 2023 / Published: 31 May 2023
(This article belongs to the Special Issue Sustainable Lignocellulosic Materials)

Abstract

:
A hybrid multicriteria decision-making (MCDM) framework, namely “criteria importance through inter-criteria correlation-combinative distance-based assessment” (CRITIC-CODAS) is introduced to rank automotive brake friction composite materials based on their physical and tribological properties. The ranking analysis was performed on ten brake friction composite material alternatives that contained varying proportions (5% and 10% by weight) of hemp, ramie, pineapple, banana, and Kevlar fibers. The properties of alternatives such as density, porosity, compressibility, friction coefficient, fade-recovery performance, friction fluctuation, cost, and carbon footprint were used as selection criteria. An increase in natural fiber content resulted in a decrease in density, along with an increase in porosity and compressibility. The composite with 5 wt.% Kevlar fiber showed the highest coefficient of friction, while the 5 wt.% ramie fiber-based composites exhibited the lowest levels of fade and friction fluctuations. The wear performance was highest in the composite containing 10 wt.% Kevlar fiber, while the composite with 10 wt.% ramie fiber exhibited the highest recovery. The results indicate that including different fibers in varying amounts can affect the evaluated performance criteria. A hybrid CRITIC-CODAS decision-making technique was used to select the optimal brake friction composite. The findings of this approach revealed that adding 10 wt.% banana fiber to the brake friction composite can give the optimal combination of evaluated properties. A sensitivity analysis was performed on several weight exchange scenarios to see the stability of the ranking results. Using Spearman’s correlation with the ranking outcomes from other MCDM techniques, the suggested decision-making framework was further verified, demonstrating its effectiveness and stability.

1. Introduction

The friction material used in automotive brake systems is typically a multiphase polymer composite. It is considered one of the most complex material systems as it is generally composed of more than ten ingredients. These ingredients are classified as fibers, fillers, property modifiers (abrasives and lubricants), and binders [1]. Fillers such as barium sulfate increase the manufacturability of brake composites while also lowering their total cost [2]. Abrasives (such as alumina) and lubricants (e.g., graphite) are examples of property modifiers. Abrasives are used to boost friction performance at the expense of increased wear, whereas lubricants are used to maintain friction performance while reducing wear [3]. Binders (e.g., phenol-formaldehyde polymer) are used to keep the ingredients of a brake composite from crumbling and falling apart when mechanical and thermal forces are applied [4], while reinforcing fibers are used to keep the brake composite’s structural integrity and mechanical strength. Under various braking circumstances, they help produce the plateau and third body that maintain a steady friction film [5,6]. Traditionally, the materials utilized to fabricate brake composites are either synthetic or extracted from minerals. Alternative materials are being researched due to the limited supply of these resources and the health risks they entail [7].
Nowadays, increased consumer awareness, as well as stringent environmental regulations have promoted the development of sustainable products from natural and waste resources [8,9,10,11]. In particular, brake composite materials are being developed, with the aim of improving their tribological performance so that new products can be introduced in a sustainable and responsible way. Numerous studies have recently been performed to investigate the use of lignocellulosic fibers as reinforcement components in friction composites. Lee and Filip [12] studied the effect of hemp fibers (1.7 wt.%) on the performance of automotive brake materials. The study revealed that the inclusion of hemp fibers increases friction while decreasing wear resistance at high temperatures. The study by Ma et al. [13] on sustainable brake friction composites concluded that the inclusion of 6 wt.% corn stalk fiber showed the best tribological performance. While studying the influence of flax fiber (0–23.6 vol.%) on the performance of sustainable brake composites, Fu et al. [14] concluded that the best tribological performance can be achieved with 5.6 vol.% fiber loading. Sustainable brake friction composites were fabricated with varying proportions (0 to 20 wt.%) of coir fiber by Rajan et al. [15]. The authors claimed the best tribological properties with 5 wt.% fiber loading. Gehlen et al. [16] investigated the possibility of using rice husk (0–12 wt.%) as sustainable automotive brake material. The authors claimed increased fade with rice husk loading, while wear resistance remained highest for the formulation with 6 wt.% rice husk content. M. Amirjan [17] used bagasse fiber (0 to 10 wt.%) to examine its impact on the tribological characteristics of friction composites made of phenolic resin. According to the study, the ideal amount of bagasse fiber to improve tribological characteristics was 5 wt.%. The applicability of cow dung fibers (0 to 8 wt.%) in sustainable brake materials was investigated by Ma et al. [18]. The study concluded that a formulation with 6 wt.% cow dung fibers results in the best brake composite material. In addition, other kinds of lignocellulosic fibers, such as Areva javanica fiber [19], abaca fiber [20], and Prosopis juliflora fiber [21] have been applied to different friction composites.
The reviewed literature suggests that tribological properties are dependent on the type and amount of natural biomass used in composite fabrication. Therefore, reaching a product with the desired performance has always been a challenge faced by formulation designers [22]. Consequently, brake friction material selection is a multicriteria decision-making (MCDM) problem, where formulation designers have to select the best composite from two or more alternatives based on two or more criteria in order to obtain good performance [23,24]. Many MCDM approaches have been published in the literature for selecting brake friction materials. For a quick overview of the most popular MCDM methods currently used to determine the best brake friction materials for automotive, see Table 1.
Subjective, such as AHP (analytic hierarchy process) and BWM (best–worst method), or objective, such as entropy and CRITIC (criteria importance through inter-criteria correlation) weighting methods are generally used to assign the priority weight of selected criteria [42]. According to the literature, several research studies have previously been conducted in order to optimize automotive brake friction materials. Despite these MCDM strategies for friction materials ranking challenges, there was a substantial need to investigate novel types of decision-making techniques in order to present formulation designers with more accurate choices. CODAS is a relatively new optimization approach that is widely used in many management and engineering fields [43]. According to the authors’ knowledge, no research has utilized the CODAS MCDM method to optimize brake friction materials yet. As a consequence, the purpose of this research is to identify the most effective friction material for use in automotive braking systems from among ten candidate materials drawn from the existing literature.

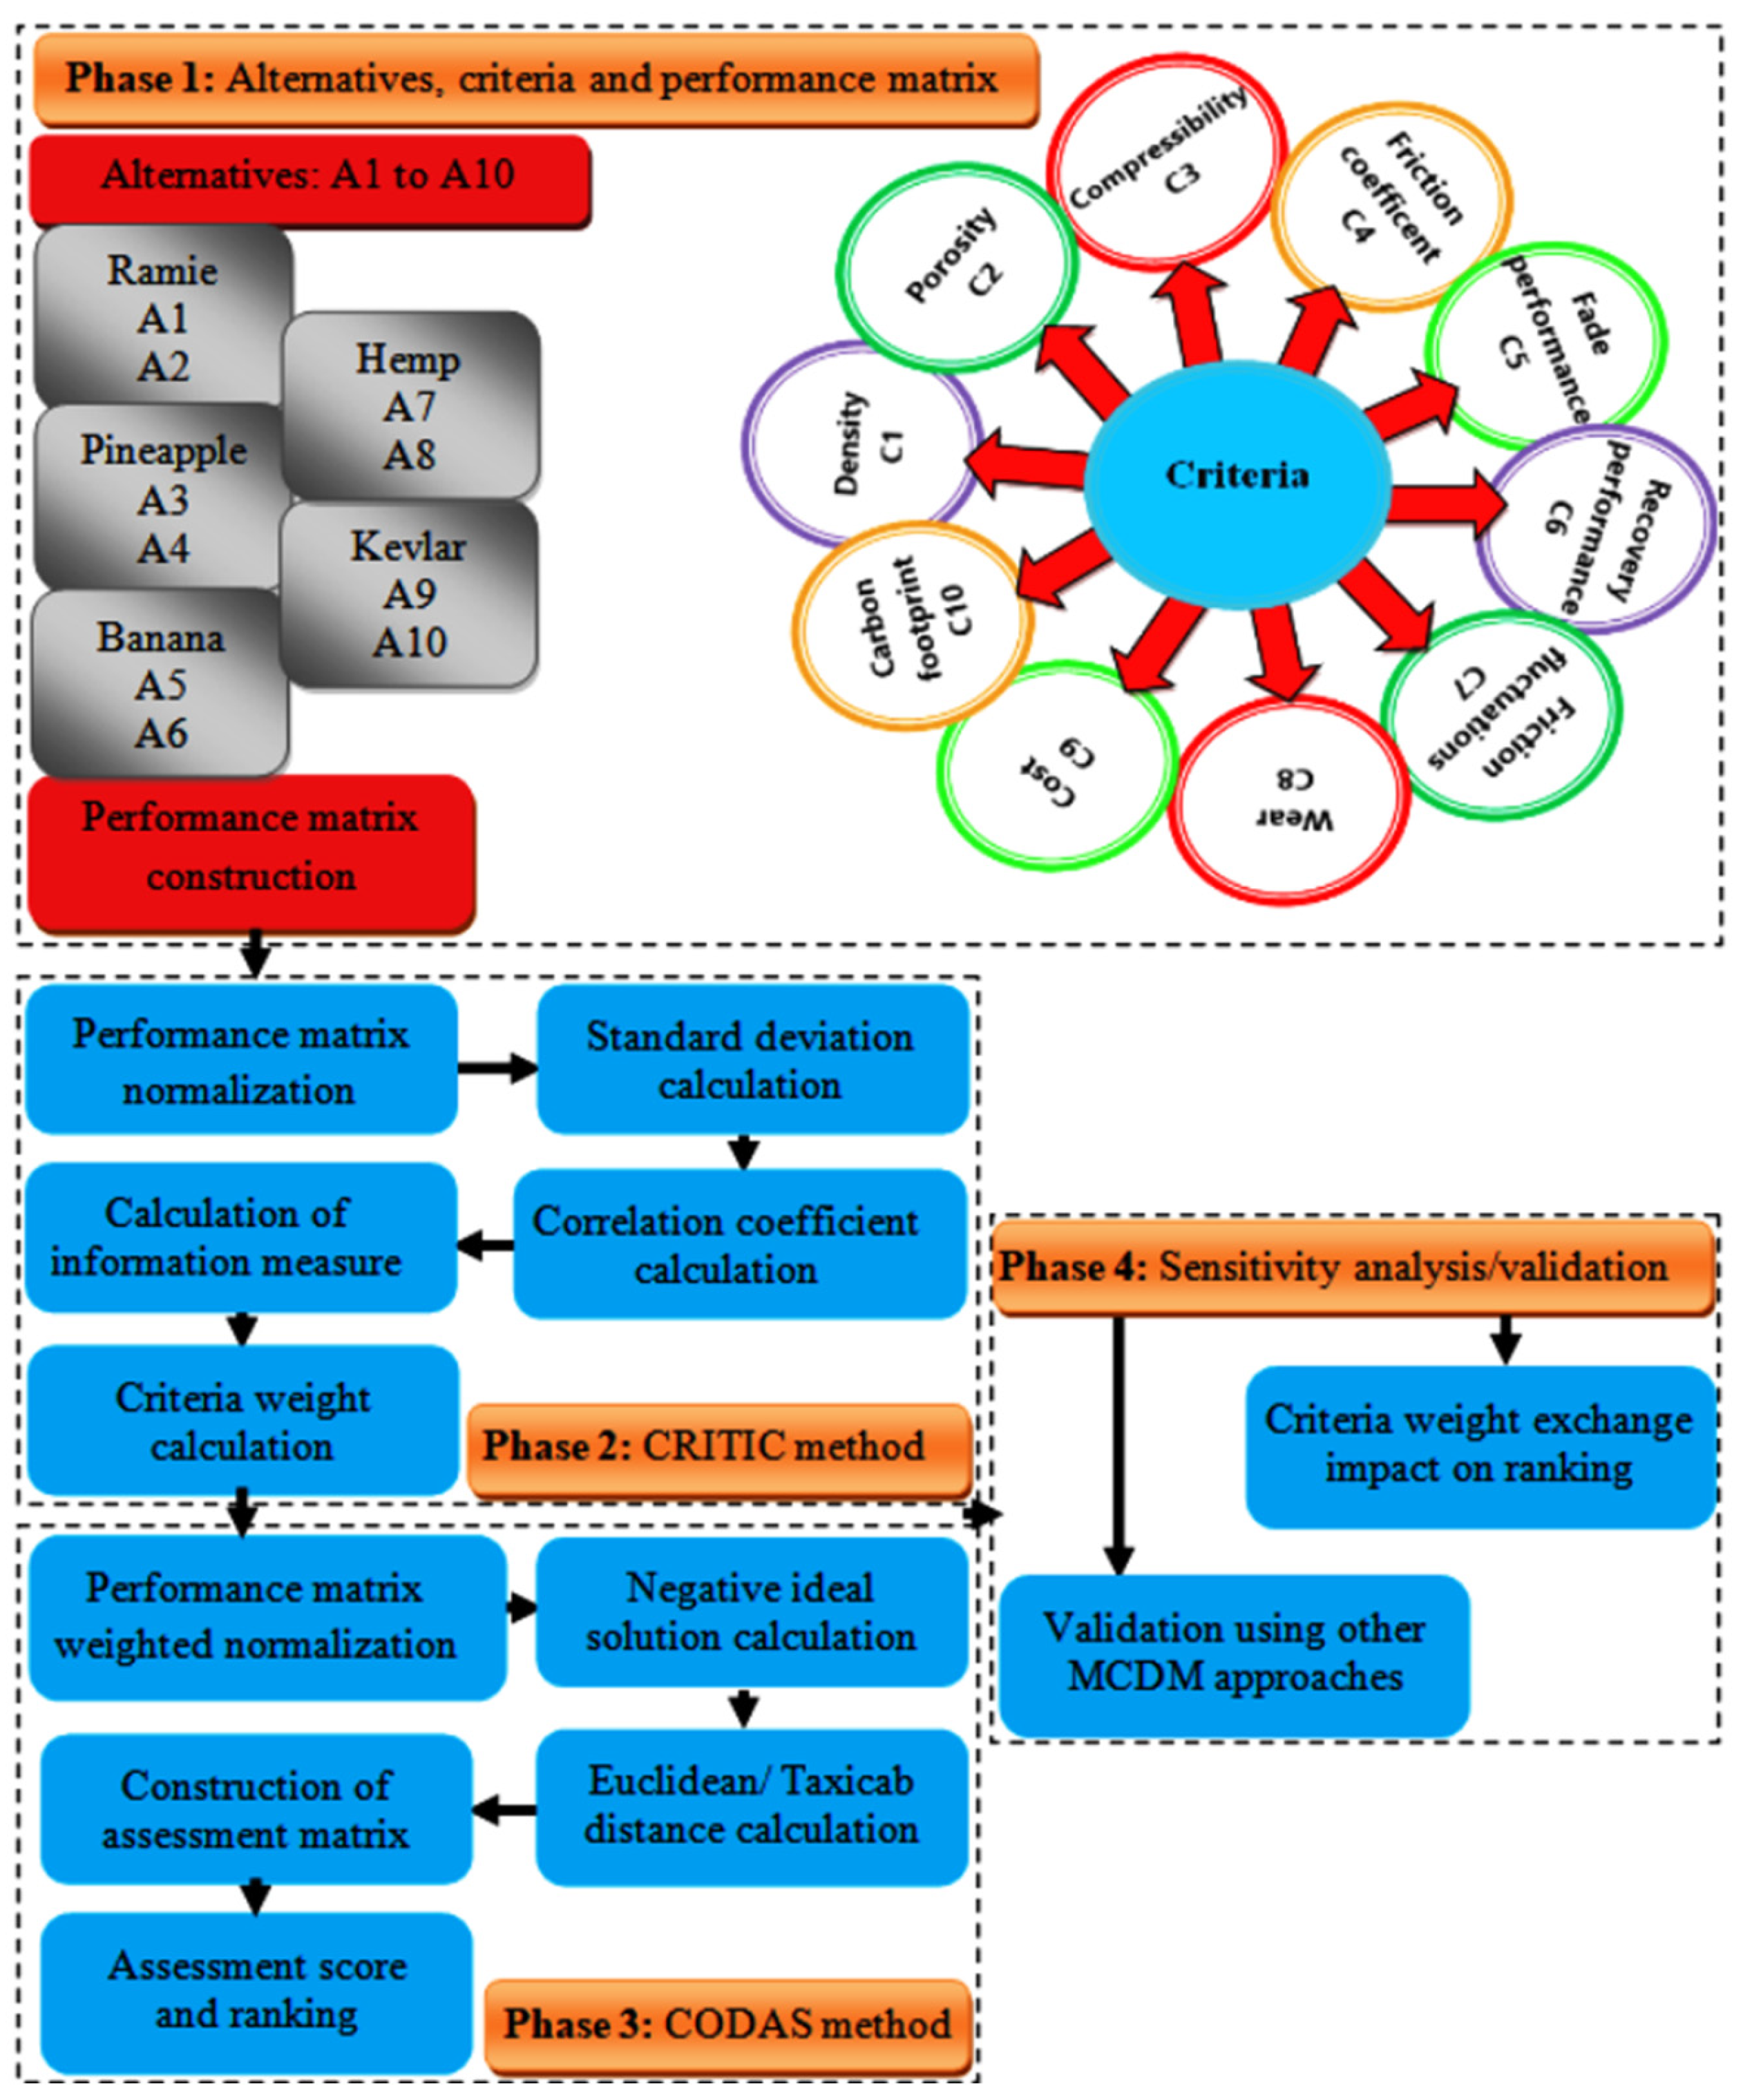
2. Optimization Methodology

A hybrid CRITIC-CODAS framework was developed to determine the optimal options for lignocellulosic fiber-based polymeric composites for automotive braking applications. The method comprises weighing the criteria using the CRITIC methodology and the CODAS tool to select the best composite option. In an MCDM problem, it is common practice to apply both objective and subjective approaches to compute the relevance of criteria. Subjective (AHP/BWM) approaches need some preliminary data based on the decision-makers’ experience or expertise before weight determination [42]. In contrast, there is no need for decision-makers when using objective (entropy/CRITIC) techniques, and the weight of the criteria is decided only on the basis of the data that are available for decision-making. CRITIC, a method for objective weighing that was proposed by Diakoulaki et al. [44], offers certain advantages over other objective weighing techniques since it incorporates both inter-criteria correlation and standard deviation for weight computation. Aside from its popularity and simplicity, scholars have proposed improvements to boost its dependability and accuracy for a variety of disciplines [45]. CODAS, which was proposed by Ghorabaee et al. [46], has become a more useful tool for prioritizing and ranking different options in the scientific and managerial fields. By figuring out the Taxicab and Euclidean distances from the negative-ideal location, the CODAS technique has effectively addressed complex and unpredictable decision-making difficulties. The CODAS strategy seems adequate to represent the fundamental principles of any MCDM issues, as it is a very systematic method that incorporates both advantageous and disadvantageous criteria into its calculations. Due to its easy procedure, CODAS is gaining popularity worldwide for solving many decision-making problems such as landfill site selection [47], energy storage [48], selection of the most polluted city [49], machining process selection [50], automobile radiator performance prediction [51], and material selection [52].
The proposed hybrid MCDM model can be implemented in four main phases as depicted in Figure 1.
Phase 1: Alternatives, criteria, and performance matrix.
Phase 2: CRITIC method.
Phase 3: CODAS method.
Phase 4: Sensitivity analysis and validation.

2.1. Phase 1: Alternatives, Criteria, and Performance Matrix

In the initiation phase of any MCDM process, the first step involves identifying and selecting the alternatives and criteria that will be utilized in the subsequent ranking analysis. Following this, a performance matrix is meticulously constructed, incorporating the chosen alternatives and criteria. Alternatives, in this context, refer to the diverse spectrum of choices or possibilities available for deliberation during the decision-making process. These alternatives have the potential to encompass solutions, strategies, products, projects, or any other viable options under consideration. On the other hand, criteria represent the specific factors or attributes that hold relevance in the decision-making process. These criteria play a crucial role in evaluating and comparing the alternatives. They can manifest as qualitative or quantitative aspects, and their nature may vary depending on the specific characteristics of the decision at hand. In the present study, ‘m’ alternatives A i ,   i = 1 ,   2 , ,   m and ‘n’ evaluation criteria C j ,   j = 1 ,   2 , ,   n are under consideration. To comprehensively analyze and evaluate these alternatives based on the selected criteria, a performance matrix ( Ρ i j m × n ) can be meticulously structured (as shown in Equation (1)), facilitating a thorough and systematic analysis.
Ρ i j m × n = A 1 A 2 A i A m Ρ 11 Ρ 12 Ρ 1 j Ρ 1 n Ρ 21 Ρ 22 Ρ 2 j Ρ 2 n Ρ i 1 Ρ i 2 Ρ i j Ρ i n Ρ m 1 Ρ m 2 Ρ m j Ρ m n C 1     C 2 C j         C n i = 1 ,   2 , ,   m j = 1 ,   2 , ,   n
where Ρ i j = ith alternative rating for jth evaluation criteria.

2.2. Phase 2: CRITIC Method

The CRITIC approach is used for determining the weights of attributes. It uses the standard deviation approach to calculate the attribute weights. The CRITIC method involves several essential steps, namely data normalization, calculation of the standard deviation, calculation of the correlation coefficient, generation of the index values, and ultimately, the calculation of weights. To ensure consistency and validity, the decision matrix is normalized according to attribute implication, as outlined in the provided equations. The stages of the CRITIC method are as follows:
Step 1: Normalize the performance matrix using Equation (2), as follows:
Ρ ¯ i j = Ρ i j Ρ i j min Ρ j max Ρ j min i f j p r o f i t c r i t e r i a Ρ i j max Ρ i j Ρ j max Ρ j min i f j cos t c r i t e r i a
Step 2: Standard deviation ( σ j ) calculation using Equation (3):
σ j = 1 m 1 i = 1 m Ρ ¯ i j j 2 ; j = 1 , , n
where j = mean of the jth criterion, which is calculated as follows:
j = 1 m i = 1 m Ρ ¯ i j ; j = 1 , , n
Step 3: Derive the correlation coefficient ( θ j k ) for a pair of criteria using the following equation (Equation (5)):
θ j k = i = 1 m Ρ ¯ i j j Ρ ¯ i k k i = 1 m Ρ ¯ i j j 2 i = 1 m Ρ ¯ i k k 2
where k represents the mean of the kth criterion and it is calculated by replacing ‘k’ for ‘j’ in Equation (4).
Step 4: Derive the value of information measure ( ρ j ) for each criterion using Equation (6):
ρ j = σ j k = 1 n 1 θ j k ; j = 1 , , n
Step 5: The weight ( ω j ; j = 1 , 2 , , n ) for jth criterion is determined using Equation (7):
ω j = ρ j j = 1 n ρ j ; j = 1 , , n
where j = 1 n ω j = 1 and ϖ j 0 , 1 .

2.3. Phase 3: CODAS Method

The step-by-step methodology for CODAS analyses is based on the literature [46,49]. The computational procedure for the CODAS method involved the following steps:
Step 1—Normalize the criteria: In order to eliminate bias arising from varying measurement units or scales, it is important to normalize the criteria values to a standardized scale. This can be achieved using appropriate normalization techniques as follows:
The formulated performance matrix Ρ i j m × n is further normalized Ρ Ν i j m × n using Equation (8).
Ρ Ν i j = Ρ i j max i Ρ i j i f j p r o f i t c r i t e r i a min i Ρ i j Ρ i j i f j cos t c r i t e r i a
Step 2—Calculate the weighted normalized distance: During the evaluation process, it is crucial to calculate the weighted normalized distance. This step multiplies the normalized distance between each alternative and the ideal solution by its corresponding criterion weight. By doing so, it enables an accurate assessment and ranking of alternatives based on their performance and the significance of each criterion. The weighted normalized performance matrix ϖ i j m × n is structured using Ρ Ν i j m × n as given:
ϖ i j = ω j × Ρ Ν i j
where ω j is the jth criterion weight computed using Equation.
Step 3—Determine the negative-ideal solution: To establish the anti-ideal solution for each criterion, the minimum value is selected as it represents the worst possible performance. This choice facilitates a distinct differentiation among the alternatives, enabling a comprehensive evaluation based on the criterion’s lowest attainable level of performance. The equation for calculating the negative ideal point Ν Ι Ρ j 1 × n is as follows:
Ν Ι Ρ j = min i ϖ i j
Step 4—Calculate the Euclidean and Taxicab distances: For each alternative, compute the Euclidean and Taxicab distance for each alternative. The Euclidean distance ( Ε i ) and Taxicab distance ( Τ i ) for the alternatives from Ν Ι Ρ j 1 × n are computed using Equations (11) and (12):
Ε i = j = 1 n ϖ i j Ν Ι Ρ j 2
Τ i = j = 1 n ϖ i j Ν Ι Ρ j
Step 5—Formulate the assessment matrix: After calculating the Euclidean and Taxicab distance for each alternative, the next step is to construct the assessment matrix i k m × m using Equation (13):
i k m × m = Ε i Ε k + ζ Ε i Ε k × Τ i Τ k
where k 1 , 2 , , m and ζ ( 0.01 ζ 0.05 ) is the threshold parameter. A ζ value of 0.02 is used in this study.
Step 6—Calculate the overall assessment score: The weighted distances for each alternative are aggregated, typically using a summation method, to obtain an overall score or utility value. Based on these scores, the alternatives are ranked in descending order, with higher scores indicating better performance. The assessment score ( Ω i ) is calculated using Equation (14), and the alternatives are ranked as per the decreasing order of Ω i .
Ω i = k = 1 m i k

2.4. Phase 4: Sensitivity Analysis and Validation

For the sensitivity analysis, the CRITIC method-determined criteria weights were interchanged, and a fresh ranking analysis using the CODAS method was carried out for each adjustment. To validate the findings of the proposed methodology, a comparison was made with the ranking of alternatives obtained using other popular MCDM methods (such as EDAS, SAW, MEW, WASPAS, COPRAS, PSI, MOORA, and TOPSIS).

3. Alternatives and Criteria Selection

3.1. Alternatives Selection

The MCDM problem herein is based on the experimental data obtained from the literature where natural fiber-based friction composites were developed for automotive braking applications [33,36,38,42]. In total, ten composite alternatives were selected, whose compositional details are listed in Table 2. Each alternative contains a fixed materials batch, which contains phenolic resin = 10 wt.%, graphite = 5 wt.%, aluminum oxide = 5 wt.%, vermiculite = 5 wt.%, and lapinus fiber = 20 wt.%. This fixed batch was supplemented with Kevlar fiber, barium sulfate, and natural fiber while ensuring that each alternate composition remained 100% by weight. The natural fibers were alkali-treated and then cut to lengths of 1–6 mm for use in composite development. Shear mixing of ingredients using a mechanical mixer (feeder speed = 300 rev/min, chopper speed = 3000 rev/min), compression molding for 10 min (temperature = 155 °C, pressure = 15 MPa), and post-curing in an oven for 3 h (temperature = 170 °C) were used to prepare friction composites in the form of brake pads [33,36,38,42]. For various characterizations, composite samples of the sizes specified by IS 2742 (parts 3 and part 4) were utilized.

3.2. Criteria Selection

In order to select the best composite alternative, ten criteria were considered including density (C1), porosity (C2), compressibility (C3), friction coefficient (C4), fade performance (C5), recovery performance (C6), friction fluctuation (C7), wear (C8), cost (C9), and carbon footprint (C10). Density (C1), porosity (C2), and compressibility (C3) were analyzed as per the requirement of the IS 2742 (part 3) quality procedure. Following the IS 2742 (part 4) quality test protocol, the experimental results for criteria encompassing C4 to C8 were collected from the chase machine. Experimentation, quality assurance, and new product development can all benefit from accurate information provided by the IS 2742 (part 4) standard. Table 3 displays the experimental conditions for various cycles required by the IS 2742 (part 4) standard. The apparatus and the testing schedule were described in full previously [1,40].
After the test was over, the friction coefficient for each composite was examined and given as friction performance (C4), fade performance (C5), recovery performance (C6), friction fluctuations (C7), and wear performance (C8). A detailed description of the selected criteria is given as:
Density (g/cc; C1): The density of the composite alternatives was measured according to the standard water displacement method using density measurement equipment (Wensar Weighing Scales Ltd., Delhi, India). For commercial organic brake friction material, a density of up to 2.6 g/cc is reported in the literature [53]. It is considered a cost criterion (i.e., the lower the better).
Porosity (%; C2): The porosity of the composites was determined in accordance with the JIS D 4418 standard by soaking the composites for 8 h in SAE 90-grade oil. The recommended porosity level is less than 10% for brake friction material [54]. It is considered a cost criterion (i.e., the lower the better).
Compressibility (%; C3): Compressibility was determined using ISO 6310-compliant compressibility testing equipment from Hind Hydraulics in India [15,22]. The compressibility should be less than 2% for a good brake friction material, in line with the recommended literature limits [55]. It is considered a cost criterion (i.e., the lower the better).
Friction coefficient (C4): The friction coefficient was calculated as the mean of the friction coefficients measured during the chase machine testing of alternative samples for four fade/recovery cycles. A good brake friction material should have a high and steady coefficient of friction, ideally between 0.2 and 0.6 [56]. It is considered a profit criterion (i.e., the higher the better).
Fade performance (%; C5): Fade performance measures the ratio of the lowest friction coefficient for fading cycles to the overall test. The recommended range of fade performance is 0 to 30% [57]. It is considered a cost criterion (i.e., the lower the better).
Recovery performance (%; C6): Recovery performance measures the maximum friction coefficient for the recovery cycles in relation to the overall test. The recommended range of recovery performance is 90% to 140% [57]. It is considered a profit criterion (i.e., the higher the better).
Friction fluctuation (%; C7): Friction fluctuation is defined as the difference between the maximum and minimum measured friction coefficients for all fade and recovery cycles. For a good brake material, friction fluctuations should be as low as possible and stable over a range of operating conditions [58]. It is considered a cost criterion (i.e., the lower the better).
Wear (gram; C8): Wear is defined as the loss of material (weight loss) for a composite sample. It is considered a cost criterion (i.e., the lower the better).
Cost (€/kg; C9): Cost is associated with the cost of materials (per kg) used in the fabrication of each composite alternative. Due to economic constraints, cost is an important consideration to consider while selecting materials. Considering the fact that cost often fluctuates due to market conditions and the availability of materials, the wholesale cost of materials was taken into account here. It is considered a cost criterion (i.e., the lower the better).
Carbon footprint (C10): The carbon footprint is an effective indicator for evaluating the environmental impacts of any material or product activities. The carbon footprint is defined as the sum of greenhouse gases (expressed in CO2 equivalent) emitted by a material, or product. In this study, the carbon footprint for the material production process is considered for the varying ingredients (i.e., barium sulfate, lignocellulosic, and Kevlar fibers) only. It is considered a cost criterion (i.e., the lower the better).

4. Results and Discussion

4.1. Criteria Results

The results for the selected ten criteria concerning each alternative are listed in Table 4. The experimental results listed in Table 4 are the mean values from three samples of each composite for the specified criterion. As observed in Table 4, the 5 wt.% fiber-reinforced composites (i.e., A1, A3, A5, A7, and A9) have slightly higher density (C1) than the 10 wt.% fiber-reinforced composites (i.e., A2, A4, A6, A8, and A10). This trend in density is expected as heavier barium sulfate is replaced with lighter fibers [21]. The density of the investigated composites varies from 2.26 to 2.56 g/cc, which is in the range of the reference value for organic brake friction materials reported in the literature [53]. The composites showed porosity (C2) in the 4.34–7.24% range and remained in the prescribed range of brake friction materials, i.e., less than 10% [54]. Including an increased fiber concentration also increased compressibility (C3), which fluctuated between 0.88% and 1.34%. The compressibility obtained was within the range prescribed in the literature (i.e., not more than 2%) [55]. Compared to the 10 wt.% fiber-reinforced composites, the friction coefficient (C4) remained slightly higher for the 5 wt.% fiber-loaded composites. These findings are in tandem with the literature, where increased organic fiber loading was reported to deteriorate tribological performance [16,20]. The friction coefficient was between 0.518 and 0.592, which remained within the range reported in the literature (i.e., 0.2 to 0.6) [56]. The composites’ fade performance (C5) remained within the prescribed limit of 0 to 40% except for alternative A10, which exhibited the highest fade of 51.05%. In comparison, the recovery performance (C6) of the investigated composites remained within the prescribed limit of 90 to 140% [57]. The friction fluctuations (C7) fluctuated between 0.178 and 0.359 and remained in good agreement with the literature [58]. Compared to the 10 wt.% natural fiber-reinforced composites, the wear (C8) was slightly higher for the 5 wt.% natural fiber-loaded composites. These findings are in tandem with the literature, where increased natural fiber loading was reported to increase the wear of brake composite materials [13,15,18].
The cost (C9) of alternative A10 was highest (~4.33 €/kg) because of the higher cost of Kevlar fiber (~35 €/kg) compared to barium sulfate (~0.15 €/kg) and lignocellulosic fibers (~2–3 €/kg). Table 4 shows that all input values for the carbon footprint (C10) are not quantitative but linguistic. So, in order to achieve homogeneity, a four-point (1 to 4) scale was considered for the carbon footprint (C10) as very low (VL = 1), low (L = 2), high (H = 3), and very high (VH = 4). The highest carbon footprint value of 4 (VH) for alternative A10 was assigned on the basis of variable ingredients. The carbon footprint of Kevlar fiber was 8.7 kg CO2-eq/kg [59], while it was reported as 2 kg CO2-eq/kg [60] for barium sulfate and 0.9 kg CO2-eq/kg [61] for natural fiber. The VH carbon footprint was assigned to alternative A10 because of the Kevlar fiber’s highest (10 wt.%) amount. For alternative A9, the Kevlar fiber concentration was reduced to 5 wt.%, and accordingly, the carbon footprint level changed from VH to H. As the Kevlar fiber concentration was replaced with 5 wt.% and 10 wt.% natural fiber, the carbon footprint was further reduced, and the level changed to L and VL, respectively.
The results presented in Table 4 show that no alternative performed best for all the selected criteria. To be detailed, alternative A10 exhibited the lowest density (C1; 2.26 g/cc), least wear (C8; 1.06 g), and second-best friction coefficient (C1; 0.574), but showed the lowest preference for C5 (51.05%), C7 (0.359), C9 (4.33 €/kg), and C10 (4). The recovery performance of A2 was the highest (112.04%) but displayed the second-poorest performances for C2 (7.12%) and C3 (1.26%). The highest value for C2, C3, and C4 were exhibited by A9, but it also exhibited the lowest recovery performance (C6; 107.43%) along with second-poorest cost (C9; 2.64 €/kg) and carbon footprint (C10; 3). The lowest fade performance (C5; 22.12%), friction fluctuations (C7; 0.178%), and cost (C9; 1.01 €/kg) were attained by A1, but A1 was poorest from the density standpoint (C1; 2.56 g/cc).
Figure 2 shows the ranking of composite alternatives using only one criterion at a time. Notably, the order of choice for the alternatives (A1–A10) is not equal across any two criteria, indicating the greatest amount of disagreement and highlighting the vital necessity for a robust weighted MCDM approach. As a result, a hybrid CRITIC-CODAS technique was used to select the optimal alternative while taking into account all criteria at the same time.

4.2. Ranking Analysis

The ranking analysis was divided into three parts. First, the weighting of the criteria was determined by analyzing the CRITIC approach outcomes. Second, the CRITIC outputs were incorporated into the CODAS calculation for ranking. The robustness of the proposed MCDM technique was evaluated using a sensitivity analysis and validation.

4.2.1. CRITIC Results

Referring to the discussion in Section 2, and considering Table 4 as a performance matrix, the data normalization was performed using Equation (2), as shown in Table 5. The resulting standard deviations ( σ j ) for each criterion are displayed in Table 6, as calculated using Equation (3).
The information measure ( ρ j ) values were computed using Equation (5), as displayed in Table 6. Afterward, using Equation (6), the criterion weights were computed and listed in Table 6. Recovery performance (C6) had the most weight at 0.1313, while compressibility (C3) had the least weight at 0.0788.

4.2.2. CODAS Results

The present study comprises ten alternative and criteria each, so n = m = 10. Table 2 was used as a performance matrix Ρ i j 10 × 10 with 10 rows and 10 columns. Table 7 shows the performance matrix after it was normalized using Equation (8).
Following that, the weighted normalized performance matrix Ρ Ν i j 10 × 10 was calculated using Equation (9) and is shown in Table 8. Following that, for each condition, a negative-ideal solution was constructed and reported in Table 8. Next, the Euclidean distance ( Ε i ), using Equation (11), and Taxicab distance, ( Τ i ) using Equation (12), were determined and presented in Table 9. The relative-assessment matrix was subsequently calculated using Equation (13), as shown in Table 10.
After the determination of the Euclidean and Taxicab distances, the assessment score ( Ω i ) for all alternatives was calculated using Equation (14), and the results were recorded in Table 10. Finally, the options were arranged from least to most favorable using the Ω i values presented in Table 10. Alternative A6 containing 10 wt.% of banana fiber ( Ω i = 0.274) ranked first, whereas alternative A10 containing 10 wt.% of Kevlar fiber ( Ω i = −0.528) ranked last.

4.3. Sensitivity Analysis

The sensitivity analysis revealed the solution’s consistency and robustness. Any modification to the weight of a criterion alters the ranking of the alternatives. Therefore, the sensitivity analysis was performed by exchanging the weight of the used criteria. In total, 45 new weight scenarios were generated with criteria weight exchange, and the corresponding ranking for each scenario processed using the CODAS method is depicted in Figure 3. In all weight exchange scenarios, alternative A6 consistently held the top position, while A2 secured second rank except in the circumstances of C3–C10, C5–C10, and C7–C10. The alternatives A9 and A10 remained the least preferred. Overall, some sensitivity was seen, but because the ultimate objective was to select the best option, these modifications had minimal impact on the ranking results. As a result, it might be said that no particular preference dominates the assessment.

4.4. Methodology Validation

The proposed methodology was validated by comparing its ranking results with other well-known MCDM approaches, namely EDAS, SAW, MEW, WASPAS, COPRAS, PSI, MOORA, and TOPSIS. The comparative ranking results for the different methodologies are presented in Figure 4. The rankings for the alternatives according to several MCDM techniques show that alternative A6 is the most dominating, coming in first, while alternative A10 is the weakest option, coming in last across all the techniques. Since the ranking for various models is not same, to determine the interrelationship between the rankings obtained using the CODAS model and the other MCDM models, the Spearman’s rank ( S P r a n k ) correlation test was used using Equation (15), and the results are listed in Table 11 [51].
S P r a n k = 1 6 i = 1 m d i 2 m 3 m
where m = the number of alternatives and d = the difference between the rankings of two MCDM methods.
The rank correlation results reveal that the ranks for the compared MCDM approaches have a substantial statistical connection. All correlation coefficients are greater than 0.87, indicating a very strong relationship.
Further, a sensitivity analysis was performed for the MOORA method (having the lowest S P r a n k correlation coefficient with the proposed CODAS approach) to strengthen the rank validation. The ranking results are presented in Figure 5. Alternatives A6, A2, and A3 consistently hold the first, second, and third position, respectively, in all weight exchange scenarios. At the same time, alternatives A9 and A10 remain at the bottom. A slight sensitivity was observed for the fourth to eighth ranked alternatives, where the alternatives moved up or down by one or two positions. This study’s main objective was to select the best alternative, and the results obtained reflect the validity and credibility of the acquired ranking.

5. Conclusions

The current study presents a decision-assistance system for ranking automobile brake friction materials based on several performance-defining parameters. By combining the CRITIC and CODAS approaches, a hybrid decision-assistance system was developed. The CRITIC methodology was used to compute the priority weights of the criteria, while CODAS was used as the ranking method to examine serious conflicts among the specified criteria and arrive at an assessment score for each alternative. Alternatives were chosen based on the variation in natural (hemp, ramie, pineapple, and banana) and Kevlar fibers, with density, porosity, compressibility, friction coefficient, fade-recovery performance, friction fluctuation, cost, and carbon footprint as performance factors/criteria. According to the results, the alternative with 10% banana fiber was chosen as the best-suited automotive brake friction material. The sensitivity study showed that the ranking outcome was not considerably impacted by changing the criteria weights. To further validate the method, a comparison was made between the CODAS results and those from other MCDM approaches, including EDAS, SAW, MEW, WASPAS, COPRAS, PSI, MOORA, and TOPSIS. The CODAS approach was agreed upon as the best result using all MCDM methods. Future research may use the proposed decision-making model to solve complex MCDM problems for various applications.

Author Contributions

Conceptualization, T.S.; methodology, T.S., A.A. and L.L.; software, T.S., A.A. and V.S.; validation, T.S., L.L., A.A. and L.R.; formal analysis, T.S., L.L. and L.R.; investigation, T.S., L.L., V.S. and P.B.; resources, T.S. and L.L.; data curation, T.S., L.R. and L.L.; writing—original draft preparation, T.S.; writing—review and editing, T.S. and L.L.; visualization, T.S. and P.B.; supervision, T.S. and L.L.; funding acquisition, T.S. and L.L. All authors have read and agreed to the published version of the manuscript.

Funding

Project no. TKP2021-NKTA-48 has been implemented with the support provided by the Ministry of Innovation and Technology of Hungary from the National Research, Development and Innovation Fund.

Institutional Review Board Statement

Not applicable.

Informed Consent Statement

Not applicable.

Data Availability Statement

The data are available from the first author (T.S.) upon reasonable request.

Conflicts of Interest

The authors declare no conflict of interest.

References

  1. Vijay, R.; Rajan, B.; Sathickbasha, K.; Hariharasakthisudhan, P.; Singaravelu, D.; Manoharan, S.; Balaji, P.; Ahmed, A.; Sethupathi, P. Influence of metal sulfide coated steel fibers on the friction and wear performance of brake friction composites. Tribol. Int. 2022, 176, 107924. [Google Scholar] [CrossRef]
  2. Park, J.; Gweon, J.; Seo, H.; Song, W.; Lee, D.; Choi, J.; Kim, Y.; Jang, H. Effect of space fillers in brake friction composites on airborne particle emission: A case study with BaSO4, Ca(OH)2, and CaCO3. Tribol. Int. 2022, 165, 107334. [Google Scholar] [CrossRef]
  3. Sathyamoorthy, G.; Vijay, R.; Singaravelu, D.L. A comparative study on tribological characterisations of different abrasives based non-asbestos brake friction composites. Mater. Today Proc. 2022, 56, 661–668. [Google Scholar] [CrossRef]
  4. Li, C.; Fei, J.; Zhang, T.; Zhao, S.; Qi, L. Relationship between surface characteristics and properties of fiber-reinforced resin-based composites. Compos. Part B Eng. 2023, 249, 110422. [Google Scholar] [CrossRef]
  5. Candeo, S.; Leonardi, M.; Gialanella, S.; Straffelini, S. Influence of contact pressure and velocity on the brake behaviour and particulate matter emissions. Wear 2023, 514, 204579. [Google Scholar] [CrossRef]
  6. Yu, K.; Shang, X.; Zhao, X.; Fu, L.; Zuo, X.; Yang, H. High frictional stability of braking material reinforced by Basalt fibers. Tribol. Int. 2023, 178, 108048. [Google Scholar] [CrossRef]
  7. Monreal-Perez, P.; Elduque, D.; López, D.; Sola, I.; Yaben, J.; Clavería, I. Full-scale dynamometer tests of composite railway brake shoes including latxa sheep wool fibers. J. Clean. Prod. 2022, 379, 134533. [Google Scholar] [CrossRef]
  8. Nogueira, A.P.G.; Gehlen, G.; Neis, P.; Ferreira, N.; Gialanella, S.; Straffelini, G. Rice husk as a natural ingredient for brake friction material: A pin-on-disc investigation. Wear 2022, 494, 204272. [Google Scholar]
  9. Lendvai, L.; Patnaik, A. The effect of coupling agent on the mechanical properties of injection molded polypropylene/wheat straw composites. Acta Tech. Jaurinensis 2022, 15, 232–238. [Google Scholar] [CrossRef]
  10. Hasan, K.M.F.; Czók, C.; Mucsi, Z.; Kóczán, Z.; Horváth, P.G.; Bak, M.; Alpár, T. Effects of Sisal/Cotton Interwoven Fabric and Jute Fibers Loading on Polylactide Reinforced Biocomposites. Fibers Polym. 2022, 23, 3581–3595. [Google Scholar] [CrossRef]
  11. Hasan, K.F.; Horváth, P.G.; Baş, S.; Mucsi, Z.M.; Bak, M.; Alpár, T. Physicochemical and morphological properties of microcrystalline cellulose and nanocellulose extracted from coir fibers and its composites. In Coir Fiber and Its Composites; Woodhead Publishing: Cambridge, UK, 2022; pp. 255–273. [Google Scholar]
  12. Lee, P.W.; Filip, P. Friction and wear of Cu-free and Sb-free environmental friendly automotive brake materials. Wear 2013, 302, 1404–1413. [Google Scholar] [CrossRef]
  13. Ma, Y.; Wu, S.; Zhuang, J.; Tong, J.; Xiao, Y.; Qi, H. The evaluation of physio-mechanical and tribological characterization of friction composites reinforced by waste corn stalk. Materials 2018, 11, 901. [Google Scholar] [CrossRef] [PubMed]
  14. Fu, Z.; Suo, B.; Yun, R.; Lu, Y.; Wang, H.; Qi, S.; Jiang, S.; Lu, Y.; Matejka, V. Development of eco-friendly brake friction composites containing flax fibers. J. Reinf. Plast. Compos. 2012, 31, 681–689. [Google Scholar] [CrossRef]
  15. Rajan, R.; Tyagi, Y.K.; Singh, S. Waste and natural fiber based automotive brake composite materials: Influence of slag and coir on tribological performance. Polym. Compos. 2022, 43, 1508–1517. [Google Scholar] [CrossRef]
  16. Gehlen, G.; Neis, P.; Barros, L.; Poletto, J.; Ferreira, N.; Amico, S. Tribological performance of eco-friendly friction materials with rice husk. Wear 2022, 500, 204374. [Google Scholar] [CrossRef]
  17. Amirjan, M. Microstructure, wear and friction behavior of nanocomposite materials with natural ingredients. Tribol. Int. 2019, 131, 184–190. [Google Scholar] [CrossRef]
  18. Ma, Y.; Wu, S.; Zhuang, J.; Tong, J.; Qi, H. Tribological and physio-mechanical characterization of cow dung fibers reinforced friction composites: An effective utilization of cow dung waste. Tribol. Int. 2019, 131, 200–211. [Google Scholar] [CrossRef]
  19. Ahmed, J.; Balaji, M.S.; Saravanakumar, S.; Sanjay, M.R.; Senthamaraikannan, P. Characterization of Areva javanica fiber—A possible replacement for synthetic acrylic fiber in the disc brake pad. J. Ind. Text. 2019, 49, 294–317. [Google Scholar] [CrossRef]
  20. Liu, Y.; Ma, Y.; Yu, J.; Zhuang, J.; Wu, S.; Tong, J. Development and characterization of alkali treated abaca fiber reinforced friction composites. Compos. Interfaces 2019, 26, 67–82. [Google Scholar] [CrossRef]
  21. Rajan, B.S.; Saibalaji, M.A.; Mohideen, S.R. Tribological performance evaluation of epoxy modified phenolic FC reinforced with chemically modified Prosopis juliflora bark fiber. Mater. Res. Express 2019, 6, 075313. [Google Scholar] [CrossRef]
  22. Kalel, N.; Bhatt, B.; Darpe, A.; Bijwe, J. Copper-free brake-pads: A break-through by selection of the right kind of stainless steel particles. Wear 2021, 464, 203537. [Google Scholar] [CrossRef]
  23. Abdulvahitoglu, A.; Kilic, M. A new approach for selecting the most suitable oilseed for biodiesel production; the integrated AHP-TOPSIS method. Ain Shams Eng. J. 2022, 13, 101604. [Google Scholar] [CrossRef]
  24. Elboshy, B.; Alwetaishi, M.; Aly, R.M.H.; Zalhaf, A.S. A suitability mapping for the PV solar farms in Egypt based on GIS-AHP to optimize multi-criteria feasibility. Ain Shams Eng. J. 2022, 13, 101618. [Google Scholar] [CrossRef]
  25. Satapathy, B.K.; Bijwe, J. Performance of friction materials based on variation in nature of organic fibers Part II: Optimization by balancing and ranking using multiple criteria decision model (MCDM). Wear 2004, 257, 585–589. [Google Scholar] [CrossRef]
  26. Satapathy, B.K.; Majumdar, A.; Tomar, B.S. Optimal design of flyash filled composite friction materials using combined analytical hierarchy process and technique for order preference by similarity to ideal solutions approach. Mater. Des. 2010, 31, 1937–1944. [Google Scholar] [CrossRef]
  27. Zhu, Z.; Xu, L.; Chen, G.; Li, Y. Optimization on tribological properties of aramid fiber and CaSO4 whisker rein-forced non-metallic friction material with analytic hierarchy process and preference ranking organization method for enrichment evaluations. Mater. Des. 2010, 31, 551–555. [Google Scholar] [CrossRef]
  28. Yun, R.; Filip, P.; Lu, Y. Performance and evaluation of eco-friendly brake friction materials. Tribol. Int. 2010, 43, 2010–2019. [Google Scholar] [CrossRef]
  29. Singh, T.; Patnaik, A.; Gangil, B.; Chauhan, R. Optimization of tribo-performance of brake friction materials: Effect of nano filler. Wear 2015, 324, 10–16. [Google Scholar] [CrossRef]
  30. Abutu, J.; Lawal, S.A.; Ndaliman, M.B.; Lafia-Araga, R.A.; Adedipe, O.; Choudhury, I.A. Effects of process parameters on the properties of brake pad developed from seashell as reinforcement material using grey relational analysis. Eng. Sci. Technol. Int. J. 2018, 21, 787–797. [Google Scholar] [CrossRef]
  31. Mahale, V.; Bijwe, J.; Sinha, S. Application and comparative study of new optimization method for performance ranking of friction materials. Proc. Inst. Mech. Eng. Part J J. Eng. Tribol. 2018, 232, 143–154. [Google Scholar] [CrossRef]
  32. Singh, T.; Patnaik, A.; Chauhan, R.; Chauhan, P. Selection of brake friction materials using hybrid analytical hierarchy process and vise kriterijumska optimizacija kompromisno resenje approach. Polym. Compos. 2018, 39, 1655–1662. [Google Scholar] [CrossRef]
  33. Kumar, N.; Singh, T.; Grewal, J.S.; Patnaik, A.; Fekete, G. A novel hybrid AHP-SAW approach for optimal selection of natural fiber reinforced non-asbestos organic brake friction composites. Mater. Res. Express 2019, 6, 065701. [Google Scholar] [CrossRef]
  34. Singh, T.; Patnaik, A.; Fekete, G.; Chauhan, R.; Gangil, B. Application of hybrid analytical hierarchy process and complex proportional assessment approach for optimal design of brake friction materials. Polym. Compos. 2019, 40, 1602–1608. [Google Scholar] [CrossRef]
  35. Singaravelu, D.L.; Vijay, R.; Filip, P. Influence of various cashew friction dusts on the fade and recovery characteristics of non-asbestos copper free brake friction composites. Wear 2019, 426, 1129–1141. [Google Scholar] [CrossRef]
  36. Singh, T.; Pattnaik, P.; Pruncu, C.I.; Tiwari, A.; Fekete, G. Selection of natural fibers based brake friction composites using hybrid ELECTRE-entropy optimization technique. Polym. Test. 2020, 89, 106614. [Google Scholar] [CrossRef]
  37. Shinde, D.; Öktem, H.; Kalita, K.; Chakraborty, S.; Gao, X.Z. Optimization of process parameters for friction materials using multi-criteria decision making: A comparative analysis. Processes 2021, 9, 1570. [Google Scholar] [CrossRef]
  38. Singh, T. Optimum design based on fabricated natural fiber reinforced automotive brake friction composites using hybrid CRITIC-MEW approach. J. Mater. Res. Technol. 2021, 14, 81–92. [Google Scholar] [CrossRef]
  39. Ahlawat, V.; Anuradha, P.; Kajal, S. Preference selection of brake friction composite using entropy-VIKOR technique. Mater. Today Proc. 2021, 46, 9573–9579. [Google Scholar] [CrossRef]
  40. Kalel, N.; Bhatt, B.; Darpe, A.; Bijwe, J. Argon low-pressure plasma treatment to stainless steel particles to augment the wear resistance of Cu-free brake-pads. Tribol. Int. 2022, 167, 107366. [Google Scholar] [CrossRef]
  41. Kalel, N.; Bhatt, B.; Darpe, A.; Bijwe, J. Exploration of Zylon fibers with various aspect ratios to enhance the performance of eco-friendly brake-pads. Tribol. Int. 2022, 167, 107385. [Google Scholar] [CrossRef]
  42. Singh, T.; Singh, V.; Ranakoti, L.; Kumar, S. Optimization on tribological properties of natural fiber reinforced brake friction composite materials: Effect of objective and subjective weighting methods. Polym. Test. 2023, 117, 107873. [Google Scholar] [CrossRef]
  43. Wątróbski, J.; Bączkiewicz, A.; Król, R.; Sałabun, W. Green electricity generation assessment using the CO-DAS-COMET method. Ecol. Indic. 2022, 143, 109391. [Google Scholar] [CrossRef]
  44. Diakoulaki, D.; Mavrotas, G.; Papayannakis, L. Determining objective weights in multiple criteria problems: The critic method. Comput. Oper. Res. 1995, 22, 763–770. [Google Scholar] [CrossRef]
  45. Sotoudeh-Anvari, A. The applications of MCDM methods in COVID-19 pandemic: A state of the art review. Appl. Soft Comput. 2022, 126, 109238. [Google Scholar] [CrossRef]
  46. Ghorabaee, K.M.; Zavadskas, E.K.; Turskis, Z.; Antucheviciene, J. A new combinative distance-based assessment (CODAS) method for multi-criteria decision-making. Econ. Comput. Econ. Cybern. Stud. Res. 2016, 50, 25–44. [Google Scholar]
  47. Badi, I.; Kridish, M. Landfill site selection using a novel FUCOM-CODAS model: A case study in Libya. Sci. Afr. 2020, 9, e00537. [Google Scholar] [CrossRef]
  48. Ren, J. Sustainability prioritization of energy storage technologies for promoting the development of renewable energy: A novel intuitionistic fuzzy combinative distance-based assessment approach. Renew. Energy 2018, 121, 666–676. [Google Scholar] [CrossRef]
  49. Raheja, S.; Obaidat, M.S.; Kumar, M.; Sadoun, B. Bhushan. A hybrid MCDM framework and simulation analysis for the assessment of worst polluted cities. Simul. Model. Pract. Theory 2022, 118, 102540. [Google Scholar] [CrossRef]
  50. Kumari, A.; Acherjee, B. Selection of non-conventional machining process using CRITIC-CODAS method. Mater. Today Proc. 2022, 56, 66–71. [Google Scholar] [CrossRef]
  51. Sivalingam, V.; Kumar, P.G.; Prabakaran, R.; Sun, J.; Velraj, R.; Kim, S.C. An automotive radiator with multi-walled carbon-based nanofluids: A study on heat transfer optimization using MCDM techniques. Case Stud. Therm. Eng. 2022, 29, 101724. [Google Scholar] [CrossRef]
  52. Roy, J.; Das, S.; Kar, S.; Pamučar, D. An extension of the CODAS approach using interval-valued intuitionistic fuzzy set for sustainable material selection in construction projects with incomplete weight information. Symmetry 2019, 11, 393. [Google Scholar] [CrossRef]
  53. De Falco, G.; Russo, G.; Ferrara, S.; De Soccio, V.; D’Anna, A. Sustainable design of low-emission brake pads for railway vehicles: An experimental characterization. Atmos. Environ. X 2023, 18, 100215. [Google Scholar] [CrossRef]
  54. Paramathma, B.S.; Sundaram, M.; Palani, V.; Raghunathan, V.; Dhilip, J.D.J.; Khan, A. Characterization of Silane Treated and Untreated Citrullus lanatus Fibers Based eco-friendly Automotive Brake Friction Composites. J. Nat. Fibers 2022, 19, 13273–13287. [Google Scholar] [CrossRef]
  55. Kumar, M.; Bijwe, J. Optimized selection of metallic fillers for best combination of performance properties of friction materials: A comprehensive study. Wear 2013, 303, 569–583. [Google Scholar] [CrossRef]
  56. Singireddy, V.R.; Jogineedi, R.; Kancharla, S.K.; Farokhzadeh, K.; Filip, P. On scaled-down bench testing to accelerate the development of novel friction brake materials. Tribol. Int. 2022, 174, 107754. [Google Scholar] [CrossRef]
  57. Kumar, M.; Satapathy, B.K.; Patnaik, A.; Kolluri, D.K.; Tomar, B.S. Hybrid composite friction materials reinforced with combination of potassium titanate whiskers and aramid fibre: Assessment of fade and recovery performance. Tribol. Int. 2011, 44, 359–367. [Google Scholar] [CrossRef]
  58. Aranganathan, N.; Bijwe, J. Special grade of graphite in NAO friction materials for possible replacement of copper. Wear 2015, 330, 515–523. [Google Scholar] [CrossRef]
  59. Teijin Aramid Sustainability Report. 2021. Available online: https://www.teijinaramid.com/wp-content/uploads/2022/05/Teijin-Aramid-Sustainability-Report-2021-2.pdf (accessed on 4 November 2022).
  60. Product Carbon Footprint (PCF)-Calculation and Comparison of Naturally or Synthetically Produced Barium Sulphates. Available online: https://www.dolder.com/fileadmin/user_upload/content/Specialty_Chemicals/Products/Sachtleben_Carbon-Footprint_Natural-vs-Synthetic-Barium-Sulphates.pdf (accessed on 25 August 2022).
  61. de Beus, N.; Carus, M.; Barth, M. Carbon Footprint and Sustainability of Different Natural Fibres for Biocomposites and Insulation Material. Available online: http://eiha.org/media/2019/03/19-03-13-Study-Natural-Fibre-Sustainability-Carbon-Footprint.pdf (accessed on 28 June 2022).
Figure 1. Proposed model for ranking brake composite materials.
Sustainability 15 08880 g001
Figure 2. Alternatives rank on the basis of individual criteria.
Sustainability 15 08880 g002
Figure 3. Sensitivity analysis for different criteria weight exchange scenarios.
Sustainability 15 08880 g003
Figure 4. Comparison between CODAS and other MCDM results.
Sustainability 15 08880 g004
Figure 5. Sensitivity analysis for different criteria weight exchange scenarios using the MOORA method.
Sustainability 15 08880 g005
Table 1. MCDM for brake friction material selection.
MCDM MethodNumber ofYearReference
AlternativesCriteria
BR552004[25]
TOPSIS862010[26]
PROMETHEE II662010[27]
EEM592010[28]
PSI482015[29]
GRA2772018[30]
MOORA/EEM882018[31]
VIKOR882018[32]
SAW872019[33]
COPRAS1682019[34]
VIKOR/ELECTRE652019[35]
ELECTRE II972020[36]
TOPSIS/VIKOR/EDAS/MOORA16, 932021[37]
MEW1272021[38]
VIKOR962021[39]
MOORA782022[40]
MOORA682022[41]
EDAS1672023[42]
BR = balancing and ranking; TOPSIS= technique for order of preference by similarity to ideal solution; EEM = extension evaluation method; EDAS = evaluation based on distance from average solution; MOORA = multi-objective optimization based on ratio analysis; COPRAS = complex proportional assessment; VIKOR = visekriterijumska optimizacija i kompromisno resenje; ELECTRE = elimination and choice translating priority; SAW = simple additive weighting; GRA = grey relation analysis; MEW = multiplicative exponent weighting; PROMETHEE = preference ranking organization method for enrichment evaluations; PSI = preference selection index.
Table 2. Details of the alternatives.
Materials (wt.%)Alternatives
A1A2A3A4A5A6A7A8A9A10
Fixed batch45454545454545454545
Barium sulfate50455045504550455045
Ramie fiber51000000000
Pineapple fiber00510000000
Banana fiber00005100000
Hemp fiber00000051000
Kevlar fiber00000000510
Table 3. Testing conditions for IS 2742 (part 4) [1,36,38,40].
Experimental Cycle
BurnishBaseline-IFade-IRecovery-IWearFade-IIRecovery-IIBaseline-II
Speed (RPM) 308411411411411411411411
Temperature (°C)Initial82822611938231782
Final931042899320434593104
Load (N) 440660660660660660660660
Load on timeMin201010
Sec1010201010
Load off timeSec201020
Heating OffOffOnOffOffOnOffOff
Application 120111001120
Table 4. Criteria results.
AlternativesC1C2C3C4C5C6C7C8C9C10
A 1 2.566.281.020.54722.12109.140.1781.161.012 (L)
A 2 2.487.121.260.54026.67112.040.2091.341.081 (VL)
A 3 2.444.681.160.54836.31107.660.2411.221.122 (L)
A 4 2.365.581.340.54038.89108.890.2681.361.301 (VL)
A 5 2.385.421.040.51836.10111.200.2551.321.032 (L)
A 6 2.335.881.120.52624.71108.560.1871.411.111 (VL)
A 7 2.536.821.120.54430.33107.540.2061.081.062 (L)
A 8 2.467.241.180.54033.70108.700.2291.211.171 (VL)
A 9 2.384.340.880.59235.98107.430.2571.182.643 (H)
A 10 2.266.541.160.57451.05111.500.3591.064.334 (VH)
Table 5. Performance matrix normalization for weight calculation.
AlternativesC1C2C3C4C5C6C7C8C9C10
A 1 0.00000.33100.69570.39191.00000.37091.00000.71431.00000.6667
A 2 0.26670.04140.17390.29730.84271.00000.82870.20000.97891.0000
A 3 0.40000.88280.39130.40540.50950.04990.65190.54290.96690.6667
A 4 0.66670.57240.00000.29730.42030.31670.50280.14290.91271.0000
A 5 0.60000.62760.65220.00000.51680.81780.57460.25710.99400.6667
A 6 0.76670.46900.47830.10810.91050.24510.95030.00000.96991.0000
A 7 0.10000.14480.47830.35140.71620.02390.84530.94290.98490.6667
A 8 0.33330.00000.34780.29730.59970.27550.71820.57140.95181.0000
A 9 0.60001.00001.00001.00000.52090.00000.56350.65710.50900.3333
A 10 1.00000.24140.39130.75680.00000.88290.00001.00000.00000.0000
Table 6. Results of CRITIC method.
C1C2C3C4C5C6C7C8C9C10
σ j 0.30980.34210.27890.29170.28720.37100.28730.34160.32550.3315
ρ j 3.39593.15222.39472.94242.40443.99022.42283.59822.92283.1578
ω j 0.11180.10380.07880.09690.07910.13130.07980.11840.09620.1039
Table 7. Normalized performance matrix Ρ Ν i j 10 × 10 .
AlternativesC1C2C3C4C5C6C7C8C9C10
A 1 0.88280.69110.86270.92401.00000.97411.00000.91381.00000.5000
A 2 0.91130.60960.69840.91220.82941.00000.85170.79100.93521.0000
A 3 0.92620.92740.75860.92570.60920.96090.73860.86890.90180.5000
A 4 0.95760.77780.65670.91220.56880.97190.66420.77940.77691.0000
A 5 0.94960.80070.84620.87500.61270.99250.69800.80300.98060.5000
A 6 0.97000.73810.78570.88850.89520.96890.95190.75180.90991.0000
A 7 0.89330.63640.78570.91890.72930.95980.86410.98150.95280.5000
A 8 0.91870.59940.74580.91220.65640.97020.77730.87600.86321.0000
A 9 0.94961.00001.00001.00000.61480.95890.69260.89830.38260.3333
A 10 1.00000.66360.75860.96960.43330.99520.49581.00000.23330.2500
Table 8. Weighted normalized performance matrix ( ϖ i j 10 × 10 ) and the negative-ideal solution ( Ν Ι Ρ j 1 × 10 ).
AlternativesC1C2C3C4C5C6C7C8C9C10
A 1 0.09870.07170.06800.08950.07910.12790.07980.10820.09620.0520
A 2 0.10190.06330.05500.08840.06560.13130.06800.09370.09000.1039
A 3 0.10360.09630.05980.08970.04820.12620.05890.10290.08680.0520
A 4 0.10710.08070.05170.08840.04500.12760.05300.09230.07470.1039
A 5 0.10620.08310.06670.08480.04850.13030.05570.09510.09430.0520
A 6 0.10840.07660.06190.08610.07080.12720.07600.08900.08750.1039
A 7 0.09990.06610.06190.08900.05770.12600.06900.11620.09170.0520
A 8 0.10270.06220.05880.08840.05190.12740.06200.10370.08300.1039
A 9 0.10620.10380.07880.09690.04860.12590.05530.10640.03680.0346
A 10 0.11180.06890.05980.09400.03430.13070.03960.11840.02240.0260
Ν Ι Ρ j 1 × 10 0.09870.06220.05170.08480.03430.12590.03960.08900.02240.0260
Table 9. Euclidean ( Ε i ) and Taxicab ( Τ i ) distances.
Alternatives Ε i Τ i
A 1 0.10240.2365
A 2 0.11180.2264
A 3 0.08270.1895
A 4 0.09770.1898
A 5 0.08410.1820
A 6 0.11570.2529
A 7 0.08810.1947
A 8 0.10420.2095
A 9 0.06080.1586
A 10 0.03540.0711
Table 10. Assessment matrix ( i k 10 × 10 ), assessment score ( Ω i ), and ranking.
Alternatives A 1 A 2 A 3 A 4 A 5 A 6 A 7 A 8 A 9 A 10 Ω i Rank
A 1 0.000−0.0090.0200.0050.018−0.0130.014−0.0020.0420.0670.1424
A 2 0.0090.0000.0290.0140.028−0.0040.0240.0080.0510.0770.2362
A 3 −0.020−0.0290.000−0.015−0.001−0.033−0.005−0.0210.0220.047−0.0558
A 4 −0.005−0.0140.0150.0000.014−0.0180.010−0.0070.0370.0620.0945
A 5 −0.018−0.0280.001−0.0140.000−0.031−0.004−0.0200.0230.049−0.0417
A 6 0.0130.0040.0330.0180.0320.0000.0280.0110.0550.0810.2741
A 7 −0.014−0.0240.005−0.0100.004−0.0280.000−0.0160.0270.053−0.0026
A 8 0.002−0.0080.0210.0070.020−0.0110.0160.0000.0430.0690.1593
A 9 −0.042−0.051−0.022−0.037−0.023−0.055−0.027−0.0430.0000.025−0.2749
A 10 −0.067−0.076−0.047−0.062−0.049−0.080−0.053−0.069−0.0250.000−0.52810
Table 11. Spearman’s rank correlation coefficients.
MCDM ModelCODASEDASSAWMEWWASPASCOPRASPSIMOORATOPSIS
CODAS10.9760.9390.9390.9390.9030.8790.8790.952
EDAS-10.9760.9760.9760.9520.9150.9150.989
SAW--1110.9890.9640.9640.952
MEW---110.9890.9640.9640.952
WASPAS----10.9890.9640.9640.952
COPRAS-----10.9890.9890.939
PSI------110.903
MOORA-------10.903
TOPSIS--------1
Disclaimer/Publisher’s Note: The statements, opinions and data contained in all publications are solely those of the individual author(s) and contributor(s) and not of MDPI and/or the editor(s). MDPI and/or the editor(s) disclaim responsibility for any injury to people or property resulting from any ideas, methods, instructions or products referred to in the content.

