Article

Safety Integrated Network Level Pavement Maintenance Decision Support Framework as a Practical Solution in Developing Countries: The Case of Addis Ababa, Ethiopia

1
Department of Civil Engineering, Division of Global Architecture, Graduate School of Engineering, Osaka University, 2-1 Yamadaoka, Suita 565-0871, Japan
2
Addis Ababa City Roads Authority, Sar Bet, Pushkin RA, Addis Ababa P.O. Box 9206, Ethiopia
*
Author to whom correspondence should be addressed.
Sustainability 2023, 15(11), 8884; https://doi.org/10.3390/su15118884
Submission received: 2 May 2023 / Revised: 26 May 2023 / Accepted: 30 May 2023 / Published: 31 May 2023

Abstract

:
Every year, road traffic crashes lead to the loss of 1.35 million lives globally, of which ninety percent happens in developing countries. Moreover, the rapid deterioration of road infrastructure in these countries causes substantial economic losses and exacerbates road safety issues. This paper proposes a practical and safety-incorporated approach to implementing a strategic pavement management system to address pertinent problems. A two-tiered stochastic process of pavement deterioration and repair is modeled using a Markov-based model. The proposed model is suitable for road agencies with limited road condition data. Road safety conditions considering all road user groups are measured and analyzed using the international road assessment program. The paper outlines a process for establishing appropriate pavement and safety performance goals, developing a deterioration prediction model, and analyzing the relative life cycle cost and risk of maintenance strategies to achieve dual performance goals—pavements and safety. A case study of a road network in Addis Ababa, Ethiopia, illustrates the effectiveness of the proposed approach, showing a significant reduction in fatal and serious injuries by up to 60% annually. In this regard, the proposed approach is useful for road agencies to make informed and safety-conscious decisions to manage their assets proactively with relatively less pavement condition data to ensure safe roads.

1. Introduction

Roads constitute a vital social infrastructure of nations. Prior literature suggests that road infrastructure strengthens manufacturing, tourism, agriculture, and the overall development of a country by improving accessibility and mobility [1,2]. These benefits of road infrastructure for socioeconomic development demand proper management to optimize asset value.
Despite the importance of roads in providing mobility and accessibility, road traffic crashes have become a significant problem. Every year, 1.35 million people’s lives are lost worldwide because of road traffic crashes. Ninety percent of these fatalities happen in developing countries [3]. Moreover, the sustainable development goal 3, target 3.6 to halve the number of deaths and injuries from road traffic crashes by 2020 has not been met, and the target has been reset for 2030 [4]. Although the death rate in low-income developing countries is over three times higher than in developed countries, the initiative to reduce the number of road traffic crashes has not yet progressed in these high-risk countries [3]. Minimizing the effect of road traffic crashes requires an effective management system dealing with vehicles, road infrastructure, and road-user interaction. Accordingly, road safety should be incorporated into road design, construction, and maintenance processes. Thus, integrating road safety into maintenance planning can shift conventional approaches that mainly use pavement conditions as a prioritization criterion, especially in developing countries. Pavement condition-oriented maintenance planning schemes prioritize motorists and overlook other road components such as sidewalks, streetlights, road markings, and crossing facilities important for non-motorized road users, particularly pedestrians and bicyclists.
In addition to traffic safety, the lack of proper road infrastructure management and timely maintenance is another concern in developing countries. For example, in sub-Saharan Africa, 150 billion US dollars were invested in road construction over three decades, but the value of one-third of that investment in social infrastructure has been lost due to a lack of proper maintenance [5]. Besides the high maintenance cost required due to deferred maintenance resulting from improper pavement management, poorly maintained roads significantly increase vehicle operating costs and traffic crashes.
Multiple studies have established a strong link between road traffic crashes and pavement conditions [6,7,8,9,10,11,12,13,14]. The primary pavement characteristics influencing traffic crashes are roughness, rutting, and skid resistance. A study conducted by Elghriany et al. [6] revealed a positive correlation between crash rates and the international roughness index (IRI), indicating that deteriorating (rough) pavement conditions degrade traffic safety. Several other studies [8,9,10,11,13] have also reported similar relationships between crash rates and IRI. However, Tsubota et al. [7] found an inverse relationship between IRI and crash risk. On the other hand, Al-Massaeid [11] concluded that IRI does not significantly impact the overall crash rate but does show an inverse relationship with single-vehicle crashes. However, this study confirmed that higher IRI levels are associated with increased multiple-vehicle crash rates, consistent with previous research. Studies on rutting have also yielded comparable results, confirming that the increase in rut depth leads to a higher crash rate [7,8,9,10]. For example, Mamlouk et al. [10] reported a critical rut depth of 0.4 inches, above which the crash rate increased. Additionally, research on skid resistance has shown a negative correlation with crash rates [9,12,13,14] and crash severity [13]. Moreover, a study by Mayora and Piña [14] indicated that higher skid resistance values reduced crash rates on wet- and dry-pavement, with wet-pavement crash rates seeing a significant average reduction of about 68%. These findings highlight the significant impact of pavement conditions on road traffic crashes.
Being a developing country, Ethiopia has faced socio-economic crises due to traffic crashes. The United Nations road safety performance review revealed that the number of road traffic fatalities and serious injuries in Ethiopia continuously increased in the twelve years between 2007 and 2018 [15]. In 2016, the Ethiopian government officially reported 4352 road traffic fatalities [16]. However, the World Health Organization (WHO) suggested that the actual number is considerably higher, estimated at 27,326, over six times the figure provided by the government [3]. Addis Ababa, the capital of Ethiopia, faces a similar situation, with an average annual fatality rate of 391 between 2013 and 2016 [17]. Additionally, there was a 6% average yearly increase in road fatalities in Addis Ababa from 2010 to 2016, where pedestrian deaths constituted the largest share and accounted for up to 90 percent of all fatalities in 2016 [17]. The UN performance review report recommended integrating road safety into road maintenance to make road safety part of organizational culture, thereby strengthening road safety management [15].
Moreover, Ethiopia has also lost billions of dollars due to its flawed maintenance system for national roads. One of the primary reasons for this loss is the absence of a proper pavement management system (PMS) [18]. Likewise, Addis Ababa exhibits the same problem [19]. Gebre [20] highlighted the use of paper-based systems as one of the challenges affecting road maintenance management in Addis Ababa City, along with other factors. This reliance on paper-based processes has a direct impact on the effectiveness of road maintenance management. Similarly, Agidewu [21] acknowledged the deficiencies in the pavement maintenance management process, specifically the absence of crucial elements such as proper condition assessment, prioritization, and planning schemes. In this regard, a PMS plays a salient role in preserving valuable assets. Furthermore, road agencies cannot devise long-term optimized maintenance strategies without a proper PMS that helps predict pavement deterioration and carry out maintenance type selection versus budget trade-off analysis.
Several approaches have been proposed to improve decision-making in pavement management processes. Han et al. [22] developed an intelligent decision-making framework for optimal maintenance and rehabilitation, utilizing a clustering-PageRank algorithm applied to big data. The framework was compared to an experience-based maintenance approach and showed promise in overcoming the limitations of relying solely on individual experiences. However, the framework was limited when dealing with a small sample size due to its reliance on data mining. De la Garza et al. [23] presented a relatively simpler method based on a linear programming framework for network-level optimization of pavement maintenance renewal strategies. The model’s simplicity and ability to assess outcomes’ sensitivity to input changes make it a strong option for decision-making. However, De la Garza et al.’s assumption of linearity in pavement deterioration, which is inherently nonlinear and stochastic, requires further improvement. Despite the tendency to neglect road safety in current research on maintenance decision support frameworks [24], notable efforts have been made to address this crucial aspect. For example, He et al. [25] developed a project-level maintenance decision support framework that considers pavement treatments’ economic, social, and environmental impacts. This framework aids sustainable maintenance decision-making and includes factors such as user life cycle costs resulting from crashes. However, the consideration of crash costs is limited to those occurring during repair activities due to traffic disruption, as expressed by the volume over capacity parameter. Similarly, Singh et al. [26] considered the friction coefficient as a criterion in prioritizing road maintenance in the Jhunjhunu district, India, using Fuzzy Analytical Hierarchy Process (FAHP) and Fuzzy Weighted Average (FWA) methods. The results demonstrated the effectiveness of these models for agencies that lack proper PMS. However, relying solely on the friction coefficient can mislead decision-making, as it does not provide a comprehensive evaluation of the overall safety condition of the road section. Sayadinia and Beheshtinia [27] proposed a hybrid decision-making approach that combined the Analytic Hierarchy Process (AHP) and three different versions of the Elimination Et Choice Translating Reality (ELECTRE) method. They applied this approach to evaluate four streets in Tehran city, considering eight main criteria, including road safety. While the method proved useful for decision-making under budget constraints, the subjectivity inherent in the methodology limits its applicability.
The framework proposed in this study considers road pavement condition and safety aspects while acknowledging the efforts and limitations of previous research and the difficulties faced in developing countries, such as scarcity of resources and data. A two-tiered Markov process-based approach was proposed for modeling the pavement deterioration and repair process. On the other hand, a deterministic approach was used to integrate the safety aspect into the PMS. The International Road Assessment Program (iRAP) protocol was utilized to assess the safety level for each group of road users, viz., vehicle occupants, motorcyclists, bicyclists, and pedestrians. This paper aims to present a practical method that can be utilized by road agencies, mainly in developing countries, for implementing a strategic sustainable, and safety-incorporated PMS.

2. Markov Process in Pavement Management

The Markov-chain model-based approach discussed in this paper involves two main processes as shown in Figure 1. The first is the deterioration process that forecasts pavement deterioration stochastically. The second is the repair process, which is deterministic and depends on the agency’s decision on the repair action and timing.

2.1. Markovian Pavement Deterioration Process

Due to loading and environmental effects, any infrastructure, including road pavements, deteriorates with time. Therefore, understanding the deterioration process and being able to predict the deterioration process can contribute to proactive actions. The proposed deterioration prediction model is discussed below.

2.1.1. The Deterioration Prediction Model

Markov chain models have been implemented widely in deterioration prediction [28]. Markov chain models are preferred due to their flexibility and operability, especially for network-level analysis [29]. In the Markov process, a transition from one condition state to the future state is only dependent on the current condition state regardless of the transition history. In Markov chain modeling, the transition probability π i j is defined as the probability of the condition state i at calendar time τ 1 (present), h( τ 1 ) = i, transitioning to the condition state j at calendar time τ 2 (future), h( τ 2 ) = j. The values of variables i and j range from 1 (the best condition state) to the worst condition state J (condition state 5 in this study, which is also the absorbing condition state). The probability of transition from the condition state i observed at time τ 1 to the condition state j at future time τ 2 can be expressed as follows:
π i j = Prob [ h ( τ 2 ) = j h ( τ 1 ) = i ] .
All the transition probabilities within the time interval Z ( Z = τ 2 τ 1 ), the period between inspections, can be presented in a matrix form as a Markov transition probability (MTP) matrix denoted by Π :
Π = π i j π 1 J 0 π J J
On reaching the absorbing condition state J, the deterioration remains in the same state if no maintenance is carried out, so π J J = 1. Similarly, it will not be possible to regain a better condition state from a worse condition without maintenance; i.e., π i j = 0 for i > j. Moreover, the summation of probabilities for transitioning from state i should be equal to 1, and from the definition of probability, j = 1 J π i j = 1 . These general preconditions can be summarized as follows:
π i j = 0 , for i > j π i j 0 , for i j j = 1 J π i j = 1
This paper proposes a Markov hazard model developed by Tsuda et al. [29] as a basis for pavement deterioration prediction. It allows the use of arbitrary inspection intervals, thereby avoiding the limitation of the conventional Markov chain model. This model utilizes maximum likelihood estimation for calculating the MTP. Han et al. [30] introduced the Bayesian estimation into the model, improving it by eliminating the maximization problem, which was often the limitation for similar models. Moreover, the improvement makes it suitable for a relatively small data set. It uses pavement condition data inspected at times τ 1 and τ 2 and the explanatory variables such as traffic volume and pavement thickness to calculate the MTP. Interested readers are encouraged to refer to Tsuada et al. [29] for details on the derivation and the background intuition of the Markov hazard model and Han et al. [30] regarding the Bayesian approach of the same model. The improved Markov hazard model, which employs the Bayesian estimation, was used to estimate the pavement deterioration rate in this paper.
To highlight the hazard model, assume that the condition state i starts from calendar time τ i 1 and changes to the condition state i + 1 at calendar time τ i . Thus, the duration of the survival of the condition state i, y i , can be measured by setting y i to zero when the condition i starts to exist at time τ i 1 . The life expectancy of a condition state i is assumed to be a stochastic variable with a probability density function f i ( ζ i ) and a cumulative distribution function F i ( ζ i ) . The distribution function is defined as
F i ( y i ) = 0 y i f i ( ζ i ) d ζ i
Consequently, the survival function or reliability function indicating the probability of the condition state persisting longer than age (duration) y i can be defined as
Prob [ ζ i y i ] = F i ˜ ( y i ) = 1 F i ( y i )
The hazard function θ i ( y i ) , also known as hazard rate, is defined as the instantaneous rate of change in condition state from i to i + 1 per unit time of y i . Mathematically,
θ i ( y i ) = lim d y i 0 Prob ( y i ζ i < y i + d y i ) d y i
The expression in the numerator in Equation (6) is the conditional probability of a change in condition state i to i + 1 in the interval [ y i , y i + d y i ], while the condition state i is still being observed at y i . The term in the denominator is the width of the interval. The conditional probability may be written as the ratio of the joint probability that ζ i is in the interval [ y i , y i + d y i ] and ζ i y i , which is Prob ( y i ζ i < y i + d y i ) to Prob ( ζ i y i ) . The ratio can be expressed as f i ( y i ) d y i for small d y i to F i ˜ ( y i ) . Replacing the numerator with this ratio in Equation (6) gives the following:
θ i ( y i ) = f ( y i ) F ˜ i ( y i )
Differentiating both sides of Equation (5) with respect to y i gives f i ( y i ) as the derivative of F i ˜ ( y i ) . Thus, Equation (7) can be written as
θ i ( y i ) = d d y i ( log F i ˜ ( y i ) )
Assuming that the deterioration process satisfies the Markov property and that the hazard function is constant, independent of y i , the hazard rate becomes a fixed value θ i , where θ i > 0 . The probability of life expectancy of the condition state i greater than y i can be expressed as follows:
F i ˜ ( y i ) = exp ( θ i y i )
When the duration y i is equal to the inspection period Z i , the survival function becomes identical to the transition probability π i i as the condition state i is observed at both the inspection times τ 1 and τ 2 . Thus, π i i = exp ( θ i Z ) . Similarly, the following mathematical formulas can be derived to estimate the Markov transition probabilities based on the exponential hazard model (Markov hazard model).
π i i = exp ( θ i Z )
π i i + 1 = θ i θ i θ i + 1 [ exp ( θ i Z ) + exp ( θ i + 1 Z ) ]
π i j = k = i j m = i k 1 θ m θ m θ k m = k j 1 θ m θ m + 1 θ k exp ( θ k Z ) ] m = i k 1 θ m θ m θ k = 1 , ( when k = i ) m = k j 1 θ m θ m + 1 θ k = 1 ( when k = j )
π i J = 1 j = i J 1 π i j
However, to utilize the formulated model, the hazard rate θ i k for the inspection sample k ( k = 1 , . . . , K ) needs to be further explained as a function of the measurable explanatory variables x k and the unknown parameters β i ( i = 1 , . . . , J 1 ) . The parameters β i can be obtained using Bayesian estimation.
θ i k = f ( x k : β i )

2.1.2. Output of the Deterioration Prediction Model

Using the periodic inspection data, the prediction model gives two significant outputs. The first is the MTP matrix, which is the primary output in forecasting the pavement deterioration process. As explained, the matrix represents the probability of conditions’ transition within a specific time interval Z. Therefore, the MTP matrix after n intervals multiplied with itself n times and can be calculated as
Π ( n Z ) = [ Π ( Z ) ] n
The second output is the expected elapsed time during which a particular condition state stays the same before transitioning to another state in the deterioration process. The expected life expectancy of the condition state i of the inspection sample k, L E i k can be expressed as
L E i k = 0 F ˜ i ( y i k ) d y i k
Substituting Equation (9) in Equation (16) for inspection sample k results in
L E i k = 0 exp ( θ i k y i k ) d y i k = 1 θ i k

2.2. Markovian Pavement Repair Process

The Markov process involving repair or maintenance differs from the deterioration process in two aspects. The first is that the repair rule, pertaining to the repair timing and repair type, is decided by the road agency. Therefore, unlike the probabilistic deterioration process, the repair process is deterministic. Second, the repair process improves the condition states from worse to better, contrary to the deterioration process.

The Repair Model

As with other Markov-based models, the formulation of the transition probability matrix is the core requirement in the repair process. However, contrary to the deterioration process, the probability of the transition from state i to j, r i j , after the repair action that constitutes the repair transition matrix and change in condition state due to each repair action is predetermined.
r i j = 1 , for η ( i ) = j 0 , for η ( i ) j
where η ( i ) denotes the action vector
η = [ η ( 1 ) , . . . , η ( J ) ]
The action vector indicates the change in condition states due to the repair action. The repair action η ( i ) stands for the transition from i to state η ( i ) . For instance, η ( i ) = j indicates the state transition from i to j due to the repair action. If the repair is carried out, the state change follows the repair rule defined in the action vector; otherwise, it remains in its current state. Therefore, the Markov transition probability matrix for the repair can be defined as
R ( η ) = r 11 r 1 J r J 1 r J J
A road network with a pavement condition state vector S ( t r ) at a time of inspection t r will change its state to S ( t r ˜ ) after repair, assuming that the repair is carried out immediately after the inspection.
S ( t r ˜ ) = S ( t r ) R ( η )
As the deterioration and repair processes continue alternately during the service life of the road, the condition states before and after repair at the n t h inspection can be formulated using the initial condition state vector S ( t 0 ) , the deterioration transition probability matrix Π ( Z ) , and the repair transition probability matrix R ( η ) as follows:
S ( t n ) = S ( t 0 ) [ Π ( Z ) R ( η ) ] n 1 Π ( Z )
S ( t n ˜ ) = S ( t 0 ) [ Π ( Z ) R ( η ) ] n

2.3. Life Cycle Cost and Risk Evaluation

Optimum pavement repair strategies could be obtained through life cycle cost (LCC) analysis. According to Han [31], LCC comprises agency, user, and socioeconomic costs. A vast number of studies have applied the concept of LCC analysis in pavement management [32]. The definitions of LCC used in these studies differ depending on the LCC components they considered. Han [31] classified the essential and optional LCC components, as listed in Table 1. This paper considers agency costs, including maintenance and inspection costs, to evaluate maintenance strategies.
To express the agency cost mathematically, consider a repair action η ( i ) = j with repair cost c i , j and inspection cost C I . The agency cost A C for one cycle of deterioration and repair period [ t r , t r + 1 ] with the road network pavement condition state vector at time t r is S ( t r ) , and the transition probability from a state i to j, r i , j can be calculated as
A C ( t r ) = i = 1 J j = 1 J r i , j c i , j s i ( t r ) + C I
Moreover, LCC can be calculated using the discount present value method with discount rate δ for the period of n Z
L C C ( Z , η ) = r = 0 i = 1 J j = 1 J r i , j c i , j s i ( t r ) + C I ( 1 + δ ) Z r
or using the average cost method
L C C ( Z , η ) = i = 1 J j = 1 J r i , j c i , j s i ( t r ) + C I Z
As for Addis Ababa city’s case, the whole network’s inspection is carried out annually, irrespective of the proposed maintenance strategy. Thus, the repair (maintenance) cost remains the primary cost that should be used for maintenance strategy evaluation.
Risk can be expressed through three primary concepts: uncertainty and expected values, events/consequences along with uncertainty, and in relation to objectives [33]. In this study, uncertainty is linked explicitly to the deterioration process, while repair actions’ consequences are known in advance. Consequently, the first two definitions of risk pertain to the consequences of repairs and how they differ from the established target, given the certain outcome of the repairs. Similarly, defining risk based on the objective yielded the same conclusion: risk involves deviation from the predetermined performance target. Hence, in this study, the risk was defined as the percentage of the road length that does not meet the performance target set by the road agency.

3. Road Safety Analytics

Safety-conscious road design, construction, and maintenance are vital in ensuring safe roads and reducing death and serious injury from traffic crashes. The need to consider road safety in all phases of the road life cycle is reflected in the UN Road Safety Performance Targets 3 and 4. Global Road Safety Performance Target 3 aims to have all new roads achieve a star rating of three or above, and Target 4 aims for more than 75% of travel on the existing roads to meet a star rating of three or better for all road users by 2030 [3].
The iRAP methodology was used for road safety analysis in this study. The iRAP has five protocols: crash risk maps, star ratings, fatality and serious injury (FSI) estimations, safer roads investment plans (SRIP), and performance tracking [34]. This study used star ratings, FSI estimation, and SRIP. The online software ViDA was used to generate the star rating, SRIP, and FSI estimation from the road attribute data. The assessment based on star rating helped identify the level of risk of the whole network from a 100 m segmented analysis without detailed crash data, thus making it suitable for developing countries where crash data is scarce [34]. In addition to its advantage in not requiring crash data, the iRAP methodology’s capability to evaluate the safety of the road for all road user groups and its benefit in providing the same traffic safety measurement scale with a global target makes it a favorable choice for road agencies. According to global road safety performance targets, roads that achieve a star rating of 3 or higher for all road users are considered to meet safety standards from a technical perspective [3]. There are 94 countermeasures (safety treatments) in iRAP that can be implemented to improve star ratings. These countermeasures can be chosen and prioritized per the target road’s condition and other considerations such as cost, availability, ease of implementation, and so on to produce an effective and economically viable investment plan.

3.1. Safety Analysis Input

The input data required for ViDA coding is extracted from road survey data. The road survey data comprises images or videos of roads, location, and distance data. A total of 78 attributes are grouped under seven categories as input for the analysis [35]. The seven categories are road details and context data, roadside data, midblock data, intersection data, flow data, VRU (Vulnerable Road Users’ facilities and land use data), and speed data.

3.2. The Safety Model

The computational procedures of the three iRAP protocols, viz., star rating, FSI estimation, and SRIP used in this paper are presented below. In addition, interested readers can refer to the iRAP manual and fact sheets [35,36,37].

3.2.1. Star Rating

A star rating of every 100 m segment for each road user group is produced based on a Star Rating Score (SRS). SRS quantifies the relative risk of death and serious injury for road users. It is calculated by summing up the scores of each crash type q ( q = 1 , , Q ). Accordingly, three crash-type scores are considered for vehicle occupants and motorcyclists: head-on, run-off-road, and intersection crash scores. Pedestrian SRS is calculated by summing up walking along and across the road crash scores. Similarly, riding along the road and intersection crash types are used in the case of bicyclists [36]. Road attributes that influence the initiation and severity of a particular crash type are considered as risk factors. The condition of the risk factors determines the likelihood and severity of a crash. In addition to the likelihood and the severity, operating speed and external flow influence are used to calculate the crash type scores. Median traversability is another factor in calculating run-off and head-on crash scores [35].
S R S = q = 1 Q C r a s h t y p e S c o r e s
C r a s h T y p e S c o r e s = L i k e l i h o o d × S e v e r i t y × O p e r a t i n g s p e e d × E x t e r n a l f l o w i n f l u e n c e × M e d i a n t r a n s v e r s a b i l i t y
For example, paved shoulder width, type of roadside object, and the distance of the object from the road are the three risk factors that influence the severity of run-off crash score for vehicle occupants [37]. Let us consider the effect of paved shoulder width on the severity of the run-off crash. When a road does not have a paved shoulder, the crash modification factor (CMF) value is set at 1. However, the CMF value changes depending on the shoulder width if the road has a paved shoulder. For shoulder widths of 2.4 m or more, the CMF value is 0.77. For widths greater than 1 m but less than 2.4 m, the CMF value is 0.83, and for widths up to 1 m, the CMF value is 0.95. The CMF values show that the severity decreases as the shoulder width increases because the driver gets time to control the vehicle. The CMF values of each risk factor influencing the likelihood and severity will be multiplied to obtain the respective likelihood and severity risk factor scores. Similarly, the degree to which the risk changes with speed, external flow, and median traversability is considered in calculating crash-type scores. Based on the star rating score, a star rating of each segment can be determined as per the star rating bands in Table 2 [36].

3.2.2. Fatality and Serious Injury (FSI) Estimation

The number of fatalities of each road user group on the given road segment is calculated by summing up the estimate of fatalities per crash type. For example, vehicle occupant run-off-road (driver side and passenger side), head-on (loss of control and overtaking), intersection, and property access fatalities are summed up to estimate the number of vehicle occupant fatalities.
The vehicle occupant fatalities for the run-off-road crash can be calculated as:
V O R O = S R S R O × a ( A A D T N o N M C ) b × C F V O R O × 365 10 9
Vehicle occupant run-off-road fatalities ( V O R O ) are estimated by the product of SRS, annual average daily traffic (vehicle flow) for non-motorcycles ( A A D T N O N M C ), and calibration factor (CF) where a and b are constants. The same procedure is implemented for other road user groups as well. The total fatalities value is the sum of each road user group’s estimated number of fatalities.
The number of serious injuries can be calculated by multiplying the estimated number of fatalities by the ratio of serious injuries to fatalities. The ratio can be determined from the crash data, or the 10:1 ratio can be used in the absence of actual data [37]. FSI is then calculated by summing up the fatalities and serious injuries.

3.2.3. Economic Analysis

In order to analyze the economic benefit of countermeasures and optimize different alternatives, the calculated FSI should be converted into monetary value. Therefore, the economic value of life and serious injury can be used whenever a well-established value is available; otherwise, 70 times GDP per capita can be used as a value of human life, and 25% of the human life value can be adopted for serious injury following iRAP methodology [37]. Thus, the number of FSI that can be prevented will be converted to the monetary benefit based on these values and considered an economic benefit. On the other hand, the countermeasure cost is used as an economic cost in the analysis.

3.2.4. Safety Analysis Procedure

Using the attribute data and ViDA software, road agencies can objectively know the level of safety risk at the network level from every 100 m segment’s star ratings. Based on baseline star rating information, the road agency can set the desired network level safety performance target for all road users.
After the target is set, countermeasures appropriate to improve the safety condition are selected for segments with low star ratings. Besides the star rating, the road attribute condition and vehicle (or road-user flow) are the prerequisite conditions (triggers) in countermeasures’ selection in iRAP. For example, the delineation attribute should be coded ‘poor’ as a prerequisite to applying the ‘improve delineation’ countermeasure [37]. Moreover, road agencies need to consider the existing situation, such as budget, road users’ behavior, the road environment, weather, availability of material and labor force, ease of implementation, and social setup, along with others, while selecting countermeasures. Then, the expected network level safety improvement upon implementing the selected countermeasures can be compared with the performance target.
The evaluation of the effect of countermeasures on safety improvement does not end with a comparison with the target value. Instead, the economic analysis of the proposed countermeasures needs to be carried out. The analysis compares the countermeasures’ costs and benefits from FSI savings. Applying these procedures to different sets of countermeasures and comparing the cost and risk of each alternative can be performed by the road agency to choose the best countermeasures. The diagram in Figure 2 illustrates the safety analysis flow.

4. Empirical Analysis: Performance Goal Setting and Repair Strategy (Counter-Measures) Evaluation

The empirical analysis was performed separately for pavement management and safety analysis first and then the best repair strategies were combined for creating annual maintenance and repair plans.

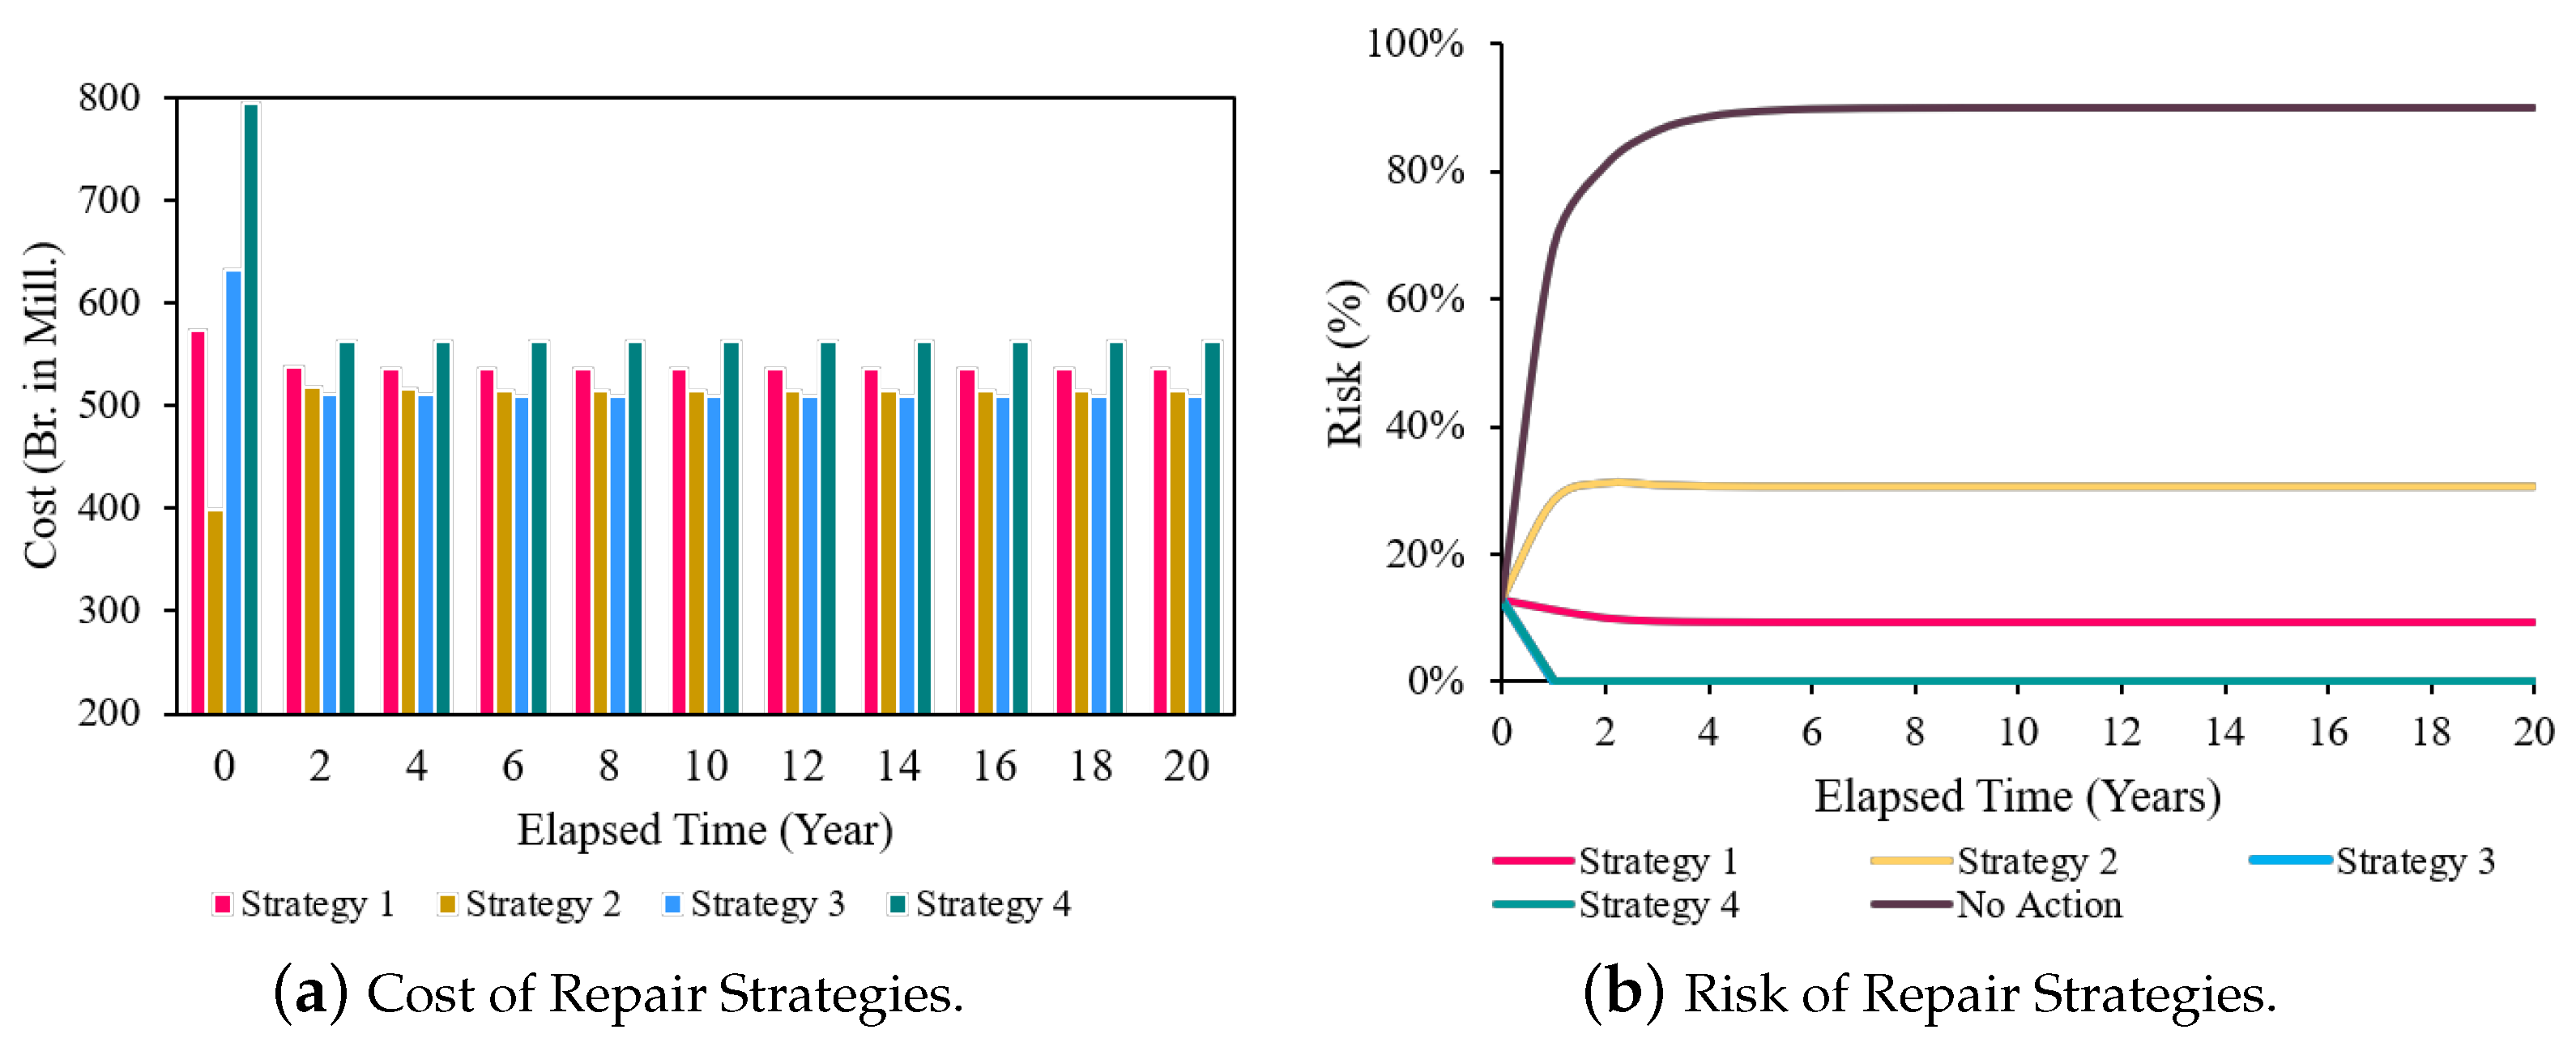
4.1. Pavement Management

The primary arterial, secondary arterial, and collector asphalt roads’ pavement condition data in Addis Ababa, spanning over three consecutive years from 2018, were used for the empirical analysis. IRI was used in this study due to its objectivity, relatively low data-collection cost, and high correlation with road-user costs [38]. A road condition survey vehicle with a profilometer, camera, and global positioning system (GPS) receiver was used for data collection. The profilometer consisted of an accelerometer and a laser displacement sensor. Subsequently, a software application was employed to analyze the gathered data, produce a list of IRI values, and view images containing coordinates and inventory information. The system provided a class 2 (high accuracy) measurement at low speeds below 20 km/h to account for the urban traffic environment [39]. The images from the system were also utilized to extract important road attribute data for safety analysis. A total of 9418 data samples from a road network of 1000 km were used in the analysis. Data from road sections that underwent intervention activity during inspection intervals were excluded to ensure accurate deterioration modeling. The pavement condition states were ranked in five ranges based on the IRI value. According to the Addis Ababa City Roads Authority’s road maintenance plan guideline, the pavement condition was classified into five ranks depending on the IRI value [40]. The ranking is presented in Table 3. The pavement deterioration MTP matrix calculated using the Markov hazard model is shown in Table 4.
Furthermore, as shown in Figure 3, if no repair action is taken, the whole network will reach the worst condition (state 5) within 6.05 years, with the sum of the life expectancy of each condition state transitioning to the next state until it finally reaches the absorbing state. This result agrees with previous studies that concluded that the road network of Addis Ababa showed a rapid deterioration trend [41,42]. Alebachewu [41] argued that drainage and moisture-related problems were the main factors that contributed to the fast deterioration rates.
The network condition state vector that shows the proportion of each condition state at the most recent inspection year was determined as S ( t 0 ) = (0.13, 0.37, 0.24, 0.13, 0.13). Based on the current network conditions, the road agency should decide on the pavement performance target before proposing the repair strategies for evaluation. Accordingly, identifying the maximum network performance achievable with available repair technology and experience is the first task required before setting a target. Theoretically, the maximum network performance can be achieved using a repair action vector that restores all conditions into state 1, i.e., η = (1, 1, 1, 1, 1). When Equations (22) and (23) and the maximum repair action were applied, the road network condition state S ( t r ) became (0.31, 0.38, 0.18, 0.08, 0.05). The result shows that with the predicted pavement deterioration process, MTP, and applying the maximum repair action, the maximum possible network performance achievable was to bring 31%, 38%, 18%, 8%, and 5% of the road network to condition states 1, 2, 3, 4, and 5, respectively. Utilizing this information, the agency can set the target network performance.
For an empirical illustration, the set goal involved two targets, i.e., the lower target being the minimum percentage of the network with at least the good condition state and the upper target being the allowable percentage of the road network with the worst condition. The first, lower target set was to keep at least 60% of the network IRI value below 4 (to keep at states 1 and 2) at any given inspection time t r . The second target, the upper target, was to keep the network in poor condition (state 5) at or below 10% at any given inspection time t r . Notably, the target should be set at most equal to the network performance achievable by the maximum repair action.
Four maintenance strategies with repair actions (1, 1, 2, 3, 1), (1, 2, 2, 3, 1), (1, 1, 2, 1, 1), (1, 1, 1, 1, 1), and no repair action cases were evaluated as an illustration for target-based maintenance/repair strategy evaluation. The repair strategies were developed by considering the repair types employed in Addis Ababa and the condition transitions resulting from each repair. The outcome of repair strategies was determined based on historical repair data and the maintenance guideline provided by Addis Ababa City Roads Authority [39], as depicted in Table 5. The effect of each strategy for ten years is depicted in Figure 4a–d, and in case of no repair, the performance of the network is as presented in Figure 4e.
In addition to evaluating the repair strategies as to whether they met the target, it was necessary to evaluate each strategy’s cost implication and risk to make sound decisions. Therefore, in this paper, the LCC per annum for each repair strategy was calculated following the average cost method. The results are shown in Figure 5.

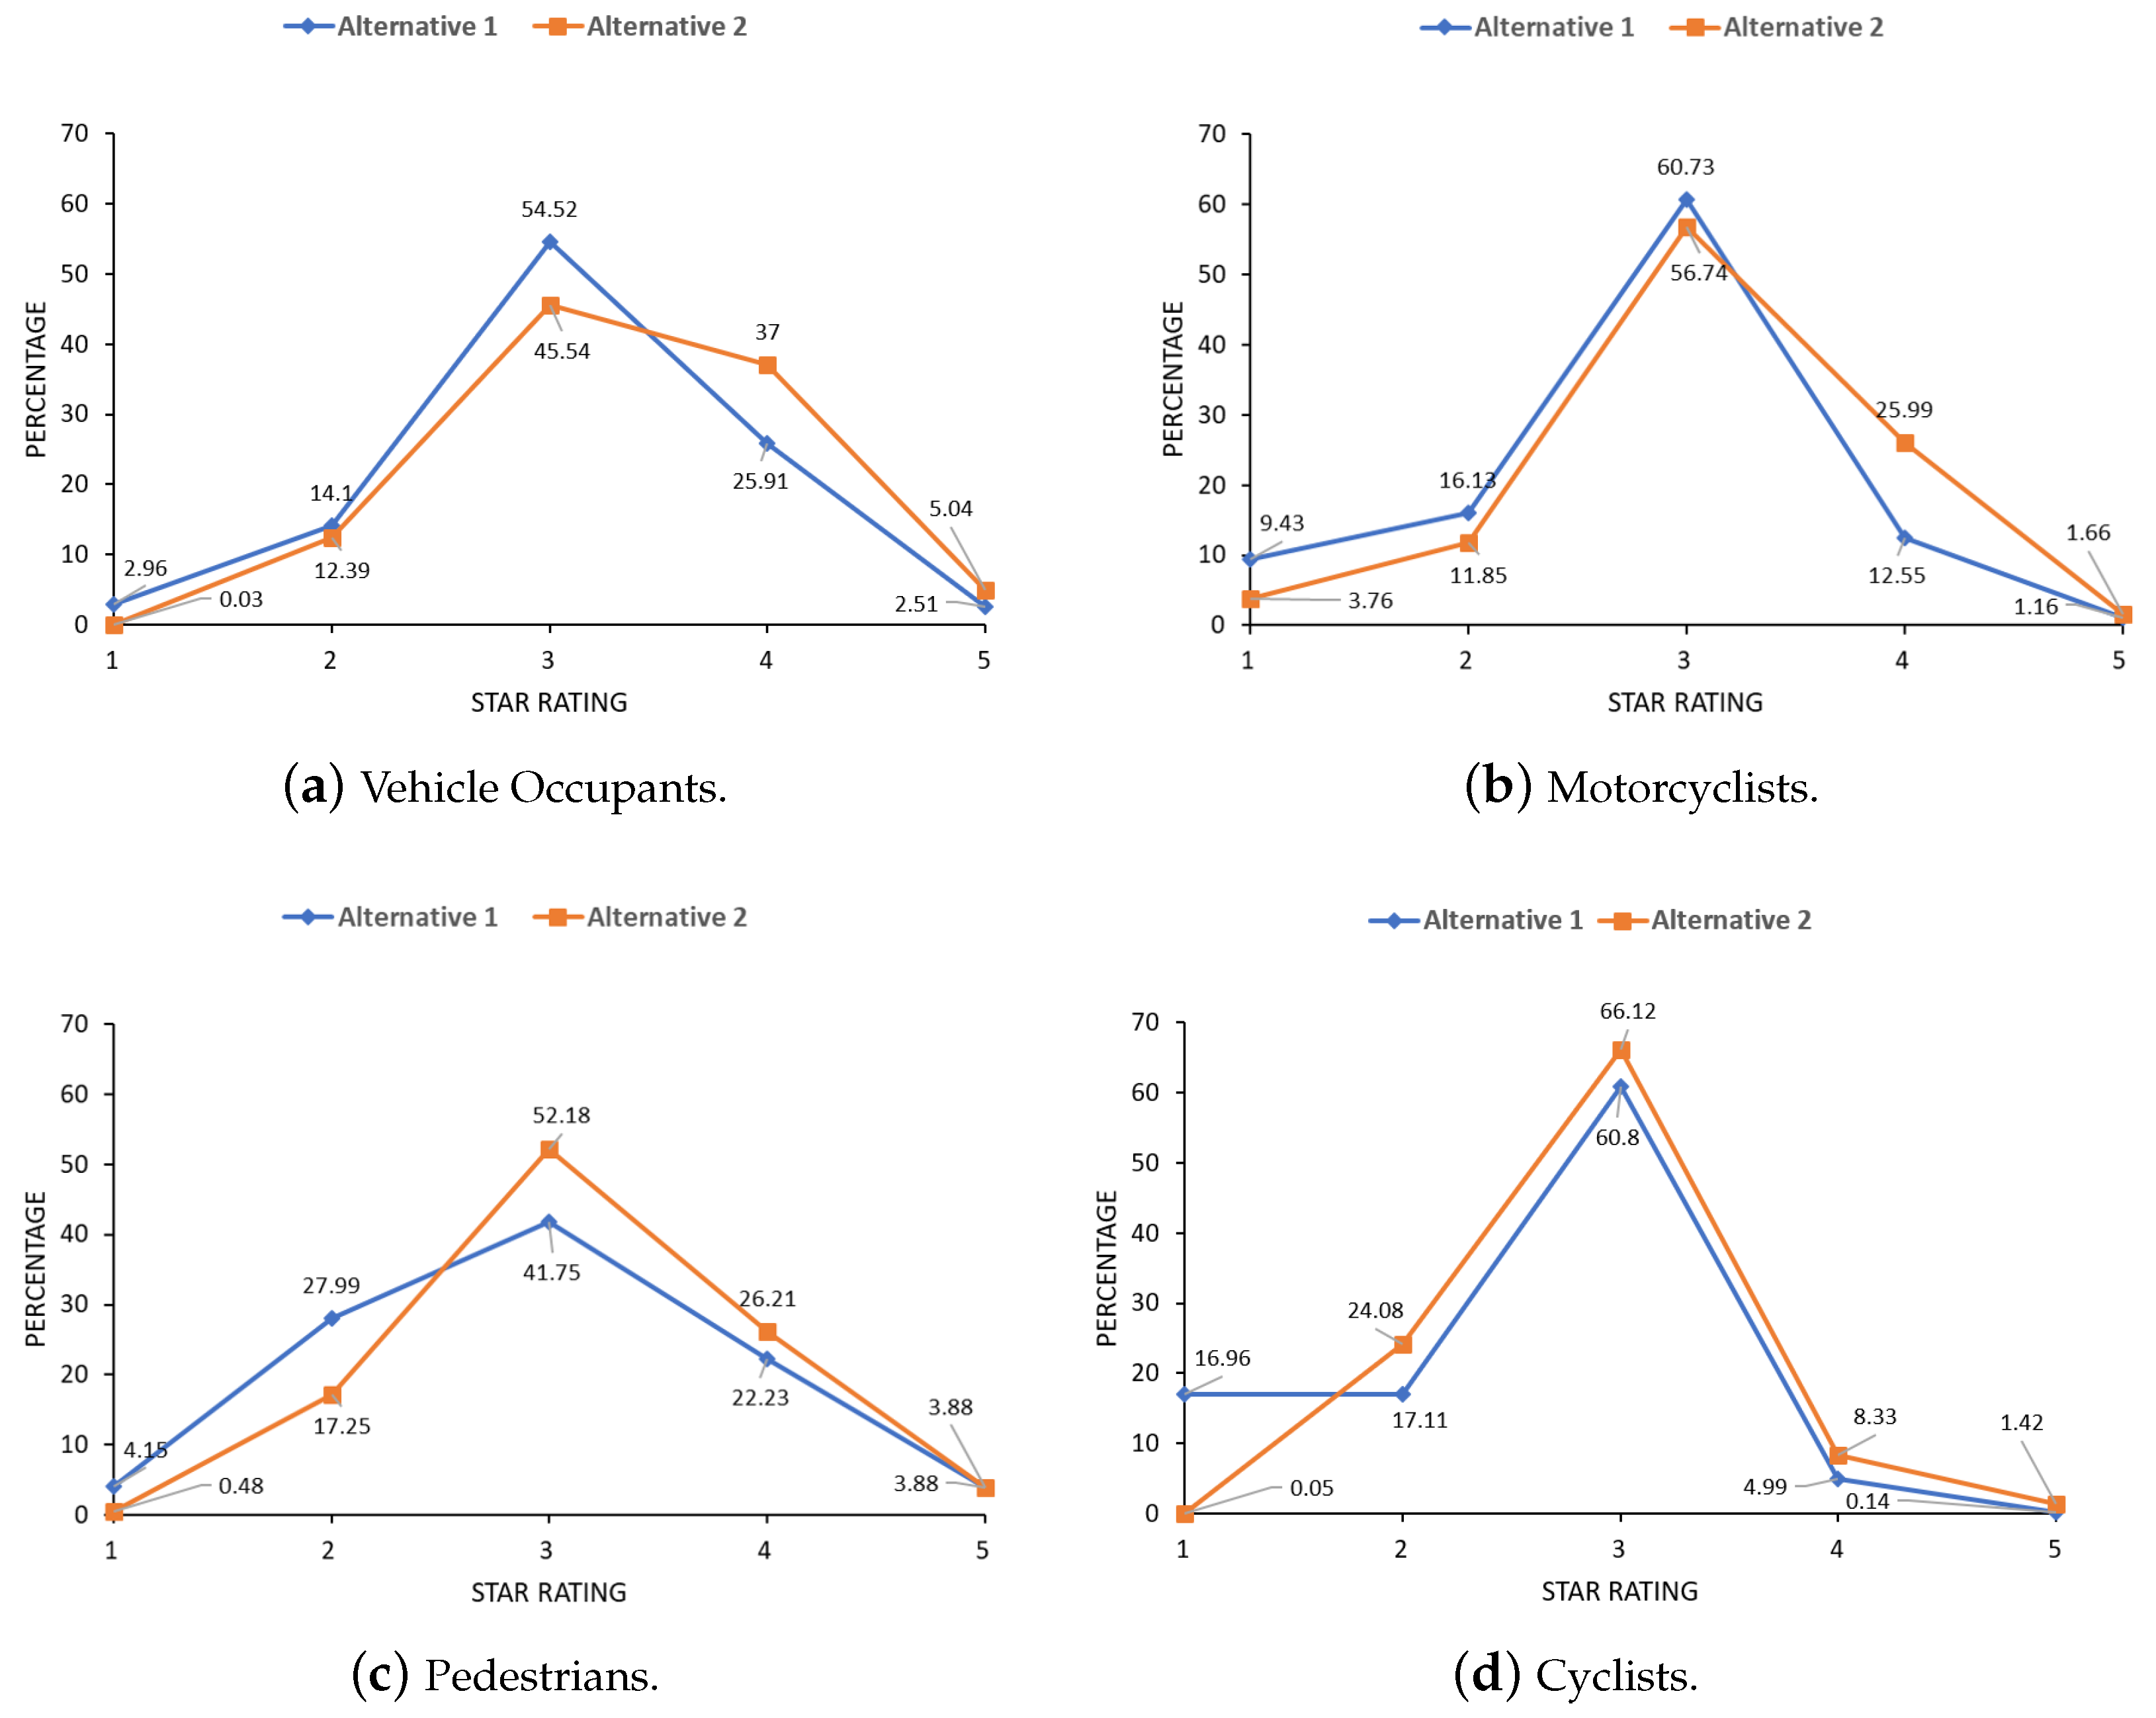
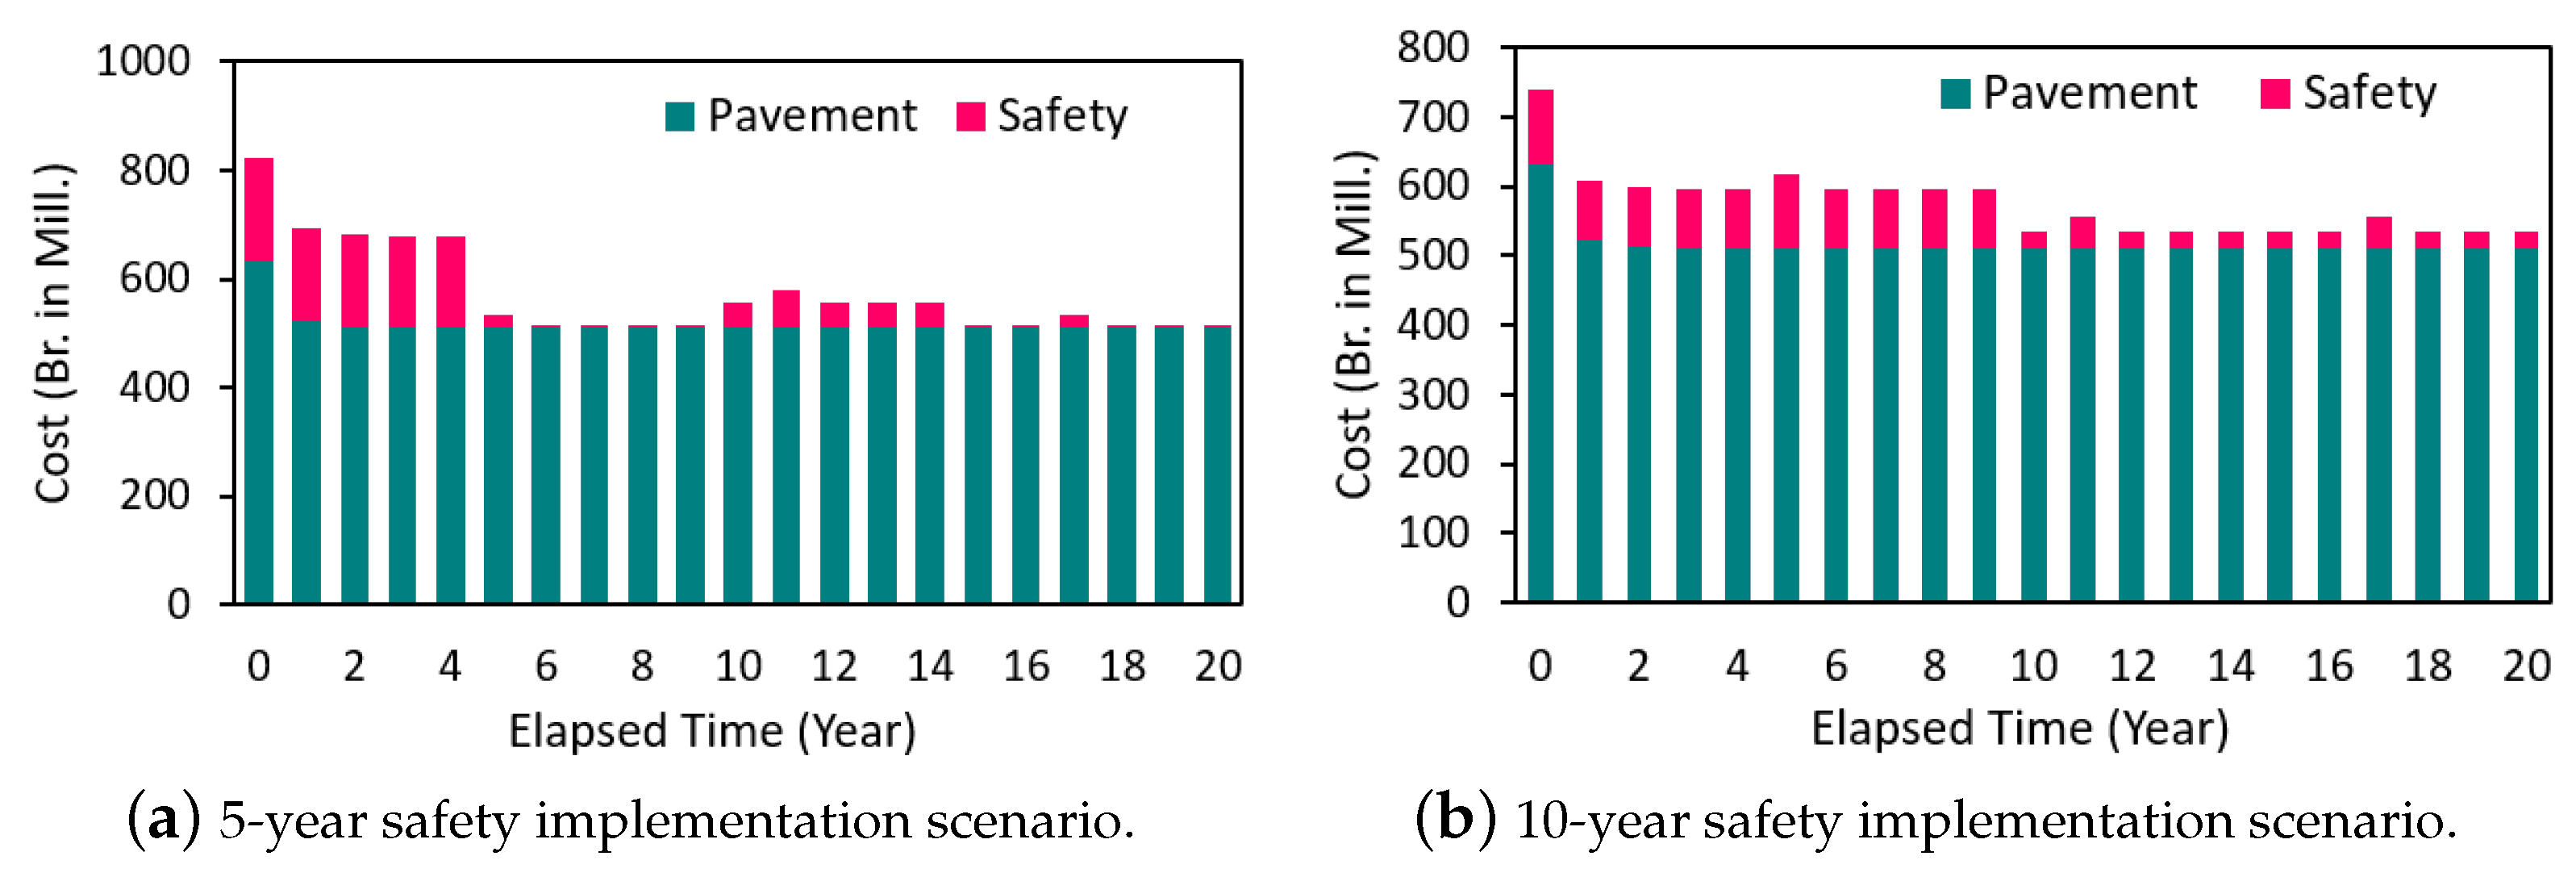
4.2. Road Safety Analysis

The data used in this study were extracted from ViDA (iRAP Ethiopia Addis Ababa Rev3 Project). In the road safety analysis, two alternatives (sets of countermeasures) were used for empirical illustration. The investment plan accessed from the iRAP database of the aforementioned project was used as the first alternative, whereas the second alternative was processed following the iRAP methodology by reducing the speed limit and operating speed through speed limit enforcement action. The analysis was performed using ViDA version 3. In addition, the safety improvement due to pavement repair following the conventional approach was analyzed to compare it with the proposed safety-integrated approach results. The change in the safety condition of the road network due to pavement repair mainly resulted from improvement in road condition and skid resistance following the repair. Therefore, the road condition and skid resistance attributes were enhanced for road segments that would be repaired in line with the best pavement repair strategy selected, and the resulting improvement in the safety condition of the road network was assessed using ViDA.
The baseline star rating data for the road network of Addis Ababa city is presented in Table 6. The baseline data showed that 73.74%, 60.09%, 38.33%, and 49.03% of the road network achieved a rating of 3 stars or above for vehicle occupants, motorcyclists, pedestrians, and bicyclists, respectively. Accordingly, it can be said that the road infrastructure is relatively the safest for vehicle occupants and the riskiest for pedestrians.
Road agencies can set the safety performance target based on the baseline data. For this study, 75% of the network achieving a rating of 3 stars or above for all road users was set as the target. This target is consistent with the UN road safety target 4. The expected star rating of the road network upon implementing the first and second alternatives is presented in Figure 6. Moreover, Figure 7 presents the safety improvement strategies’ cost and risk analysis results. The analysis was performed by grouping the countermeasures based on their service life. The countermeasures selected in this study have a service life of 1, 5, 10, and 20 years. For instance, delineation has a service life of 5 years, meaning that the cost recurs every five years. However, the implementation plan to execute the network level delineation and other countermeasures in one year or an extended period depends on the agency’s decision considering its resource and other factors. It also relies on the preset time frame to achieve the goal. Two scenarios were considered for this study. The first was to execute all proposed countermeasures within five years, and the second was within ten years. The countermeasures were assumed to perform effectively within their service life.
To generate the second alternative, segments that did not meet the target in the first alternative were identified. Then, additional actions for the identified segments were proposed, and the entire road network was reevaluated. This trial-and-error procedure was carried out until the network achieved the set goals. Road agencies can use the same procedure to propose alternative intervention strategies and compare their relative costs and risks to their goals. FSI saved and cost-benefit analysis of each alternative can be obtained from the investment plan output. Finally, the annual budget plan can be extracted from the cost analysis based on the implementation plan (proposed execution period). These outputs can help the road agencies decide whether to implement the alternative that meets the set goals or the need to adjust the performance target.

5. Discussion

The network level pavement condition states achieved by implementing repair strategies 3 and 4 were (0.24, 0.38, 0.21, 0.10, 0.07) and (0.31, 0.38, 0.18, 0.08, 0.05), respectively. The percentage of pavements at least in a good condition state after implementation of repair strategies 3 and 4 were estimated to be 62% and 69%, respectively. Similarly, the percentage of pavements in very poor condition for repair strategies 3 and 4 were 7% and 5%, respectively. Figure 4 shows that strategies 3 and 4 met the network performance targets set among the four repair strategies. Consequently, the risk, as presented in Figure 5, was zero for strategies 3 and 4. On the other hand, implementing repair strategies 1 and 2 resulted in pavement condition states of (0.20, 0.33, 0.21, 0.13, 0.13) and (0.08, 0.30, 0.26, 0.17, 0.19), respectively. The percentage of pavements in a good condition state or better after implementing strategies 1 and 2 were projected to increase to 53% and 38%. Consequently, strategies 1 and 2 had a 7% and 22% deviation, respectively, from target 1, which aimed to keep 60% of the network at least in good condition. Moreover, 13% and 19% of the total pavements in the network were predicted to deteriorate to a very poor condition state if strategies 1 and 2 were applied, respectively. Strategies 1 and 2 resulted in a 3% and 9% deviation, respectively, from target 2, which aimed to keep the maximum percentage of the network in the worst conditions at 10%. By summing up the percentage deviation from both targets, strategy 2 had the highest risk, with 31% of the road network not meeting the goal set by the two targets, followed by strategy 1, which was 10% risky. The risk of no repair action was shown to start from 13% and continuously increased until it reached the predicted life expectancy (6.05 years), where the whole network deteriorated to the worst state (very poor condition state) with IRI ≥ 8. The risk in the no repair case reached 90% when the whole network was estimated to degenerate to the worst state. This result implies that the maximum risk level was 90% as the agency allowed up to 10% of the pavement degrade to the worst state while setting the upper target.
Though strategies 3 and 4 achieved the target set by the agency, the results presented in Figure 5 showed that strategy 4 was more costly than strategy 3. Therefore, according to this analysis, strategy 3 was the best alternative among the four proposed repair strategies.
Figure 6 presents the star rating percentage of the road network upon implementing the two safety improvement strategies (alternatives). The rating of 3 stars or above of vehicle occupants improved from 73.74% to 88.22%; likewise, enhancement from 60.09% to 71.05%, 38.33% to 73.40%, and 49.03% to 62.84% were attained for motorcyclists, pedestrians, and cyclists, respectively, if alternative 1 was implemented. However, 75% of the network achieving a 3-star rating or above was met only for vehicle occupants. Consequently, the percentage of the network that did not meet the target, the risk, for vehicle occupants, motorcyclists, pedestrians, and cyclists was 0%, 3.95%, 1.60%, and 12.16%, respectively. On the other hand, implementing alternative 2 resulted in 90.58%, 82.74%, 76.17%, and 78.91% of the network attaining a 3-star rating or above for vehicle occupants, motorcyclists, pedestrians, and cyclists, respectively. Hence, alternative 2 achieved the intended performance target for all road user groups. The cost-benefit analysis indices also supported the soundness of the investment plan. The estimated BCR was 2.85, implying that the benefit was more than twice the cost. Additionally, an FSI reduction of 13,940 was achieved over the analysis period of 20 years considering alternative 2. The annual cost and risk distribution of alternative 1 applied over two implementation periods, 5 and 10 years, is presented in Figure 7 as a typical cost-and-risk analysis with different implementation periods.
Therefore, strategy 3 of the pavement repair and alternative 2 of the safety improvement strategy fulfilled the road network performance requirements. Accordingly, the annual budget requirement was produced, as shown in Figure 8 for 5- and 10-year safety implementation scenarios. The maximum annual budget requirement was 822.8 and 739.64 million ETB (Birr, Ethiopian currency) for 5- and 10-year scenarios, respectively. These results show that the proposed method can enable road agencies to evaluate the alternatives for different scenarios and compare them against their budget allocation for robust decision-making.
If the conventional approach was followed, the network would have exhibited 89.3%, 74.77%, 75.36%, and 63.72% 3-star ratings or above for vehicle occupants, motorcyclists, pedestrians, and cyclists, respectively. Compared to the proposed safety-integrated approach, the conventional approach failed to fulfill the safety target for motorcyclists and bicyclists. The difference can further be explored by comparing the estimated FSI per annum of the two approaches. Consequently, an annual FSI of 55, 2, 102, and 24 for vehicle occupants, motorcyclists, pedestrians, and cyclists, which equals 183 FSI per annum, may be achieved by implementing a safety-integrated approach. On the other hand, an annual FSI of 74, 3, 122, and 60 for vehicle occupants, motorcyclists, pedestrians, and cyclists, which totals 259 FSI, was estimated in the conventional approach implementation. The results showed that the annual FSI estimate increased by 41.5% if the conventional approach was implemented instead of the safety-integrated one. The FSI difference for bicyclists was the highest, which more than doubled. Implementing the proposed safety-integrated approach prevented 60% of bicyclists’ annual FSI that would happen in the conventional case. The difference in FSI between the two approaches can be multiplied by the analysis period to assess the significance of integrating safety in a given period.
Additionally, it is essential to note that the safety analysis for the conventional approach was carried out on the assumption that the skid resistance and road conditions of road segments would attain an adequate (the best) condition state through the pavement repair process. However, as the skid resistance and road condition attributes have three condition states, viz. adequate, medium, and poor in iRAP assessment, there was a possibility of a given segment failing to achieve the best condition after repair, which is divergent from the assumption. Thus, if road segments failed to attain the assumed adequate condition, the FSI estimate of the conventional approach had a higher probability of being more than what was used in the comparison.
Figure 9 shows the star rating map for the two approaches. A significant difference in safety conditions can easily be observed in parts of the outer ring road, (A) in the figure, in implementing the two approaches. This route is 32.1 km long, with 30.9 km of star 1 and the remaining 1.2 km of star 2 sections. The poor safety condition was mainly related to the driving speed. For example, 11.6 km of the road section had a speed limit of 40 km/h; however, the mean operating speeds were 50 km/h and 90 km/h in 2.1 km and 9.5 km of this section, respectively. Similarly, 20.5 km of this route had a speed limit of 50 km/h, whereas the mean operating speed was found to be 90 km/h. Though the operating speed exceeded the limit in the whole section of the road, the worst violation was observed in 93.5% (30 km) of the route, where the mean operating speed was 90 km/h.
In addition to the speeding problem, poor facilities for vulnerable road users and poor quality of curves probably worsened the safety risk to road users. For instance, there was no physical separation to the sidewalk, such as pedestrian fencing, and no separate facility for bicyclists or motorcyclists, which exposed these vulnerable road users to speeding traffic, increasing their safety risk. The curved road sections need to have guiding signs and markings to help drivers to judge the correct curvature and sight distance in advance and as they turn. The absence of signs and markings, such as chevron markers around the curved segments in the whole route, made the curve quality poor and increased the likelihood of a crash. The pictures in Figure 10 show the current situation of the route.
Considering the situation, safety countermeasures, mainly traffic calming measures, were proposed in the safety-integrated approach. As a result, 30.9 km of this route with the worst star rating (1-star) was proposed for improvement to 3-star (14 km) and 4-star (16.9 km), which would fulfill the safe road standard, upon implementing the safety integrated approach. However, the safety risk remained unchanged if the conventional approach was applied as this approach does not address the speeding problem, the main problem in this road section.
While the framework’s effectiveness has been assessed using the case of Addis Ababa, it can be customized and implemented in any country. Its adaptability is particularly suitable for developing nations facing similar road safety challenges, limited data availability, and scarce resources. In addition, the framework’s flexibility allows for adjustments to suit specific circumstances, including policy formulation and target setting, making it applicable in a wide range of contexts.

6. Conclusions

This paper proposed an improved PMS approach by combining a Markov process-based pavement management practice and iRAP protocol-based road safety analysis. The models included in the approach involve stochastic deterioration prediction and deterministic repair and safety analysis methods. The aim was to address the safety concern seamlessly by incorporating it into the PMS. The approach enhances the conventional single-objective road maintenance planning practice exercised, especially in developing countries, by integrating road safety. The proposed pavement and safety analytics models are highly customizable for setting network-level goals and analyzing alternative maintenance strategies based on the agency’s situation. Moreover, they are suitable for agencies with scarce pavement and crash data. As illustrated in the case study, the approach allows road agencies to make dual maintenance policies and evaluate the consequences of maintenance strategies at the network level to make a proactive safety-conscious decision considering the cost and risk of strategies. The LCC evaluation can also be customized according to the available cost data and the agency’s interest. Moreover, the case study results showed that the proposed safety-integrated approach enhanced the safety of road users by significantly reducing FSI compared to the conventional approach. The economic evaluation clearly showed the profitability of integrating safety in the conventional approach. Therefore, the proposed PMS approach can benefit nations, particularly developing countries, by addressing the financial and social burden of pavement deterioration and traffic crashes by enabling road agencies to make informed, optimized decisions to ensure safe roads.
The analytical model employed in developing the road safety analysis framework used a deterministic approach. However, it is worth noting that the likelihood and severity of a crash linked to the road infrastructure features follow a stochastic deterioration process that changes over time. Likewise, although safety countermeasures were assumed to operate flawlessly during their designated lifespan, their effectiveness diminishes as time goes by. Consequently, investigating the stochastic implications of road infrastructure feature deterioration and the declining efficacy of safety countermeasures on the overall safety of road sections presents a captivating subject for future research.

Author Contributions

Conceptualization, A.A.A., K.S. and K.K.; Methodology, A.A.A., K.S. and K.K.; Formal analysis, A.A.A.; Data curation, A.A.A.; Writing—original draft, A.A.A.; Writing—review & editing, A.A.A., K.S. and K.K.; Supervision, K.K. All authors have read and agreed to the published version of the manuscript.

Funding

This research received no external funding.

Informed Consent Statement

Not applicable.

Data Availability Statement

Data used in this study are available from the corresponding author upon reasonable request.

Acknowledgments

The authors would like to thank the Addis Ababa City Roads Authority and International Road Assessment Program (iRAP) for providing the data used in this paper.

Conflicts of Interest

The authors declare no conflict of interest.

References

  1. Mazrekaj, R. Impact of road infrastructure on tourism development in Kosovo. Int. J. Manag. 2020, 11, 466–474. [Google Scholar]
  2. OECD. Impact of Transport Infrastructure Investment on Regional Development; Technical Report ITRD No. E112022; Organization for Economic Co-operation and Development: Paris, France, 2002.
  3. WHO. Global Status Report on Road Safety; Report; World Health Organization (WHO): Geneva, Switzerland, 2018.
  4. WHO; UNRC. Decade of Action for Road Safety 2021–2030; WHO: Geneva, Switzerland, 2021.
  5. Levik, K. How to sell the message “Road maintenance is necessary” to decision makers. In Proceedings of the Technology Transfer in Road Transportation in Africa, Arusha, Tanzania, 23–25 May 2001. [Google Scholar]
  6. Elghriany, A.; Yi, P.; Liu, P.; Yu, Q. Investigation of the effect of pavement roughness on crash rates for rigid pavement. J. Transp. Saf. 2016, 8, 164–176. [Google Scholar] [CrossRef]
  7. Tsubota, T.; Yoshii, T.; Shirayanagi, H.; Kurauchi, S. Effect of Pavement Conditions on Accident Risk in Rural Expressways. In Proceedings of the 2018 21st International Conference on Intelligent Transport Systems (ITSC), Maui, HI, USA, 4–7 November 2018. [Google Scholar]
  8. Vinayakamurthy, M. Effect of Pavement Condition on Accident Rate. Master’s Thesis, Arizona State University, Tempe, AZ, USA, 2017. [Google Scholar]
  9. Mkwata, R.; Chong, E. Effect of pavement surface conditions on road traffic accident—A Review. E3S Web Conf. 2022, 347, 01017. [Google Scholar] [CrossRef]
  10. Mamlouk, M.; Vinayakamurthy, M.; Underwood, B.S.; Kaloush, K.E. Effects of the International Roughness Index and Rut Depth on Crash Rates. TRR 2018, 2672, 418–429. [Google Scholar] [CrossRef]
  11. Al-Masaeid, H. Impact of pavement condition on rural road accidents. Can. J. Civ. Eng. 1997, 24, 523–531. [Google Scholar] [CrossRef]
  12. McCarthy, R.; Flintsch, G.; Izeppi, E.L. Impact of skid resistance on dry and wet weather crashes. J. Transp. Eng. B Pavements 2021, 147, 04021029. [Google Scholar] [CrossRef]
  13. Alhasan, A.; Nlenanya, I.; Smadi, O.; Mackenzie, C. Impact of pavement surface condition on roadway departure crash risk in Iowa. Infrastructures 2018, 3, 14. [Google Scholar] [CrossRef]
  14. Mayora, J.; Pina, R. An assessment of the skid resistance effect on traffic safety under wet-pavement conditions. Accid. Anal. Prev. 2009, 41, 881–886. [Google Scholar] [CrossRef] [PubMed]
  15. UNEC. Road Safety Performance Review Ethiopia; United Nations: Geneva, Swizerland, 2020.
  16. Ethiopian Federal Police Commission. Annual Crash Data Report; Annual Report; Ethiopian Federal Police Comission: Addis Ababa, Ethiopia, 2019.
  17. Addis Ababa City Transport Bureau. Road Traffic Crashes in Addis Ababa; Report; AACTB: Addis Ababa, Ethiopia, 2018. [Google Scholar]
  18. Banda, T. Investigating the Causes of Frequent Failures on Maintained Asphalt Pavement Federal Roads in Ethiopia. Master’s Thesis, Addis Ababa Science and Technology University, Addis Ababa, Ethiopia, 2018. [Google Scholar]
  19. Yitages, H. Economic Impact of Poor Pavement Maintenance in the City of Addis Ababa (A Case Study: Megenagna-Meskel Square-Torhayloch Road). Master’s. Thesis, Addis Ababa University, Addis Ababa, Ethiopia, 2017. [Google Scholar]
  20. Gebre, Z. Performance Assessment of Road Maintenance Project Management in Addis Ababa City Administration. Master’s Thesis, Addis Ababa University, Addis Ababa, Ethiopia, 2021. [Google Scholar]
  21. Agidew, D. Assessment of Road Maintenance Management Practices of Addis Ababa City Road Authority (AACRA). Master’s Thesis, Addis Ababa Science and Technology University, Addis Ababa, Ethiopia, 2017. [Google Scholar]
  22. Han, C.; Fang, M.; Ma, T.; Cao, H.; Peng, H. An intelligent decision-making framework for asphalt pavement maintenance using the clustering-PageRank algorithm. Eng. Optim. 2019, 52, 1829–1847. [Google Scholar] [CrossRef]
  23. de la Garza, M.J.; Akyildiz, S.; Bish, R.D.; Krueger, D.A. Network-level optimization of pavement maintenance renewal strategies. Adv. Eng. Inform. 2011, 25, 699–712. [Google Scholar] [CrossRef]
  24. Chen, W.; Zheng, M. Multi-objective optimization for pavement maintenance and rehabilitation decision-making: A critical review and future directions. Autom. Constr. 2021, 130, 103840. [Google Scholar] [CrossRef]
  25. He, S.; Salem, O.; Salman, B. Decision support framework for project-level pavement maintenance and rehabilitation through integrating life cycle cost analysis and life cycle assessment. J. Transp. Eng. Part B Pavements 2021, 147, 04020083-1–04020083-12. [Google Scholar] [CrossRef]
  26. Singh, A.; Sharma, A.; Mishra, R.; Wagle, M.; Sarkar, A. Pavement condition assessment using soft computing techniques. Int. J. Pavement Res. 2018, 11, 564–581. [Google Scholar] [CrossRef]
  27. Sayadinia, S.; Beheshtinia, M.A. Proposing a new hybrid multi-criteria decision-making approach for road maintenance prioritization. Int. J. Qual. Reliab. Manag. 2021, 38, 1661–1679. [Google Scholar] [CrossRef]
  28. Karimzadeh, A.; Shoghli, A. Predictive analytics for roadway maintenance: A review of current models, challenges, and opportunities. J. Civ. Eng. 2020, 6, 602–625. [Google Scholar] [CrossRef]
  29. Tsuda, Y.; Kaito, K.; Aoki, K.; Kobayashi, K. Estimating Markovian transition probabilities for bridge deterioration forecasting. JSCE J. Struct. Eng. Eng. 2006, 23, 241–256. [Google Scholar] [CrossRef]
  30. Han, D.; Kaito, K.; Kobayashi, K. Application of Bayesian estimation method with Markov hazard model to improve deterioration forecasts for infrastructure asset management. KSCE J. Civ. Eng. 2014, 18, 2107–2119. [Google Scholar] [CrossRef]
  31. Han, D. Development of Open-Source Hybrid Pavement Management System for an International Standard. Ph.D. Thesis, Kyoto University, Kyoto, Japan, 2011. [Google Scholar]
  32. Alaloul, W.S.; Altaf, M.; Musarat, M.A.; Javed, M.; Mosavi, A. Systematic review of life cycle assessment and life cycle cost analysis for pavement and a case study. J. Sustain. 2021, 13, 4377. [Google Scholar] [CrossRef]
  33. Sotic, A.; Rajic, R. The Review of the Definition of Risk. OJAKM 2015, 3, 17–26. [Google Scholar]
  34. iRAP Project Planning Manual; Version 1.0, Beta Edition; International Road Assessment Programme (iRAP): Bracknell, UK, 2019.
  35. iRAP Coding Manual; Version 5.1; International Road Assessment Programme (iRAP): Bracknell, UK, 2020.
  36. iRAP Star Rating and Investment Plan Manual; Version 1.1; International Road Assessment Programme (iRAP): Bracknell, UK, 2021.
  37. iRAP Methodology Fact Sheets; Version 3; International Road Assessment Programme (iRAP): Bracknell, UK, 2015.
  38. Martin, T.C. A Review of Existing Pavement Performance Relationships; ARRB Transport Research: Vermont South, Australia, 1996.
  39. Road Maintenance Plan Guideline, Project for Development of Road Maintenance Capacity of Addis Ababa; Japan International Cooperation Agency (JICA): Addis Ababa, Ethiopia, 2019.
  40. Pavement Condition Survey Implementation Manual; Japan International Cooperation Agency (JICA): Addis Ababa, Ethiopia, 2019.
  41. Alebachewu, F. Pavement Distresses on Addis Ababa City Arterial Roads, Causes and Maintenance Options. Master’s Thesis, Addis Ababa University, Addis Ababa, Ethiopia, 2005. [Google Scholar]
  42. Tullu, H. Assessment of Pavement Distresses in Addis Ababa City Road; Causes and Maintenance. Master’s Thesis, Addis Ababa University, Addis Ababa, Ethiopia, 2017. [Google Scholar]
Figure 1. Simplified flow chart for Markov process-based decision-making.
Sustainability 15 08884 g001
Figure 2. Simplified flow chart depicting the safety analytics process.
Sustainability 15 08884 g002
Figure 3. Life expectancy of condition states transition.
Sustainability 15 08884 g003
Figure 4. (ad) Performance of the road network with proposed repair strategies, (e) no repair.
Sustainability 15 08884 g004
Figure 5. Cost and risk of pavement repair strategies.
Sustainability 15 08884 g005
Figure 6. Network star rating results of road user groups for the two safety improvement alternatives.
Sustainability 15 08884 g006
Figure 7. Cost and risk of the safety improvement strategy.
Sustainability 15 08884 g007
Figure 8. Annual budget requirement.
Sustainability 15 08884 g008
Figure 9. Road safety star rating map of Addis Ababa city.
Sustainability 15 08884 g009
Figure 10. Pictures of the outer ring road route.
Sustainability 15 08884 g010
Table 1. Classification of Life cycle costs.
ClassificationCore LevelRecommended LevelAdvanced Level
Agency
Cost
User
Cost
Socio-Environ-
mental Cost
Vehicle Operating
Cost (VOC)
Travel
Time Cost
Accident
  
Work Zone
  
Emission
Cost
Essential·   Maintenance·   Fuel·   Travel·   Property ·   CO
·   Inspection·   Tire     time    damage     CO 2 , NO x
Optional·   Initial costs·   Depreciation, repair ·   Injury·   Travel time and·   SO 2 , HC
·   PMS operation·   Engine oil ·   FatalityVOC due to workzone    PM, Pb
Table 2. Star rating bands.
Star RatingVehicle Occupants
and Motorcyclists
BicyclistsPedestrians
TotalAlongCrossing
50 to 2.50 to 50 to 50 to 0.20 to 4.8
42.5 to 55 to 105 to 150.2 to 14.8 to 14
35 to 12.510 to 3015 to 401 to 7.514 to 32.5
212.5 to 22.530 to 6040 to 907.5 to 1532.5 to 75
122.5+60+90+15+75+
Table 3. Pavement condition rating.
Condition StateIRI (m/km)Remark
1     IRI < 2Very Good
22 ≤ IRI < 4Good
34 ≤ IRI < 6Fair
46 ≤ IRI < 8Poor
58 ≤ IRI     Very Poor
Table 4. Pavement deterioration MTP matrix.
Rating12345
10.3090.3860.1810.0770.048
2-0.3500.3000.1830.168
3--0.2290.2820.488
4---0.1580.842
5----1
Table 5. Repair types and associated condition transitions.
Repair TypesRepair Action and Condition Transition
Preventive maintenance η ( 2 ) = 1
Partial overlay and Patching η ( 3 ) = 2
Mill and fill η ( 3 ) = 1
Full overlay η ( 4 ) = 3
Rehabilitation η ( 4 ) = 1
Reconstruction η ( 5 ) = 1
Table 6. Baseline star rating.
RatingRoad Network Safety Rating (%)
Vehicle OccupantMotorcyclistPedestrianBicyclist
17.1416.4524.8924.91
219.1223.4636.7826.06
352.4750.2529.5447.00
419.488.898.351.93
51.790.950.440.10
Disclaimer/Publisher’s Note: The statements, opinions and data contained in all publications are solely those of the individual author(s) and contributor(s) and not of MDPI and/or the editor(s). MDPI and/or the editor(s) disclaim responsibility for any injury to people or property resulting from any ideas, methods, instructions or products referred to in the content.

