
A Three-Stage Hybrid SEM-BN-ANN Approach for Analyzing Airport Service Quality


 ,
, 
Abstract
:1. Introduction
2. Literature Review
2.1. Airport Service Quality (ASQ)
2.2. Airport Service Quality (ASQ) and Overall Satisfaction
3. Hypothesis Development

| Authors, Published Year | Access | Security | Check-In | Airport Facility | Way Finding | Airport Environment | Arrival Services | Price | Personnel Services | Airports | Methodology |
|---|---|---|---|---|---|---|---|---|---|---|---|
| Yeh and Kuo [17], 2003 | ✓ | ✓ | ✓ | ✓ | ✓ | ✓ | 14 Asia Pacific International Airports | A fuzzy MADM model with an effective algorithm | |||
| Fodness and Murray [6], 2007 | ✓ | ✓ | ✓ | ✓ | Six airports in USA | EFA and CFA | |||||
| Liou et al. [11], 2011 | ✓ | ✓ | ✓ | ✓ | ✓ | ✓ | ✓ | Taoyuan International Airport (Taiwan) | DRSA | ||
| Bogicevic et al. [19], 2013 | ✓ | ✓ | ✓ | ✓ | ✓ | ✓ | 33 Popular Airports (Skytrax) | Content analysis | |||
| Bezerra and Gomes [4], 2015 | ✓ | ✓ | ✓ | ✓ | ✓ | A Brazilian International Airport | EFA | ||||
| Bezerra and Gomes [5], 2016 | ✓ | ✓ | ✓ | ✓ | ✓ | ✓ | A Brazilian International Airport | CFA | |||
| Jiang and Zhang [8], 2016 | ✓ | ✓ | ✓ | ✓ | ✓ | ✓ | ✓ | Melbourne Airport (Australia) | MANOVA and IPA | ||
| Pandey [13], 2016 | ✓ | ✓ | ✓ | ✓ | ✓ | ✓ | ✓ | Thai airports | Fuzzy MCDM | ||
| Pantouvakis and Renzi [9], 2016 | ✓ | ✓ | ✓ | ✓ | Fiumicino/Aeroporti di Roma (Italy) | CFA and Rasch Modeling | |||||
| Lee and Yu [2], 2018 | ✓ | ✓ | ✓ | ✓ | ✓ | ✓ | ✓ | Top 100 airports in passenger traffic volume (2013–2016) | Sentiment analysis and Topic modeling | ||
| Nghiêm-Phú and Suter [30], 2018 | ✓ | ✓ | ✓ | ✓ | ✓ | ✓ | ✓ | McCarran International Airport (USA) | Sentiment analysis | ||
| Trischler and Lohmann [31], 2018 | ✓ | ✓ | ✓ | ✓ | ✓ | ✓ | ✓ | Australian airports | Semi-structured interviews and critical analysis | ||
| Bezerra and Gomes [26], 2019 | ✓ | ✓ | ✓ | ✓ | ✓ | Congonhas Airport (Brazil) | PLS–SEM, FIMIX-PLS and PLS-MGA | ||||
| Martin-Domingo et al. [32], 2019 | ✓ | ✓ | ✓ | ✓ | ✓ | ✓ | ✓ | London Heathrow Airport (UK) | Sentiment analysis | ||
| Isa et al. [7], 2020 | ✓ | ✓ | ✓ | ✓ | Klia2 Terminal (Malaysia) | PLS-SEM | |||||
| Barakat et al. [33], 2021 | ✓ | ✓ | ✓ | ✓ | ✓ | London Heathrow Airport (UK) | Deep neural networks (CNN and LSTM) | ||||
| Chonsalasin et al. [10], 2021 | ✓ | ✓ | ✓ | ✓ | ✓ | ✓ | ✓ | Thai airports | Measurement model | ||
| Bakır et al. [34], 2022 | ✓ | ✓ | ✓ | ✓ | Top 50 busiest airports in Europe (Skytrax) | MRA and NCA | |||||
| Li et al. [35], 2022 | ✓ | ✓ | ✓ | ✓ | ✓ | ✓ | ✓ | ✓ | 98 airports in USA | Sentiment analysis and Salience-valence analysis (LSVA) | |
| Liao et al. [28], 2022 | ✓ | ✓ | ✓ | ✓ | ✓ | ✓ | Multi-airports: Guangdong-Hong Kong-Macao Greater Bay Area (GBA) | Push-pull-mooring theory and PLS-SEM | |||
| Lopez-Valpuesta and Casas-Albala [36], 2023 | ✓ | ✓ | ✓ | ✓ | Seville Airport (Spain) | Ordered Logit model with Principal Component Analysis | |||||
| This study | ✓ | ✓ | ✓ | ✓ | ✓ | ✓ | ✓ | Thai airports | SEM-BN-ANN |
4. Research Methodology
4.1. Participants and Data Collection
4.2. Variable Measurement
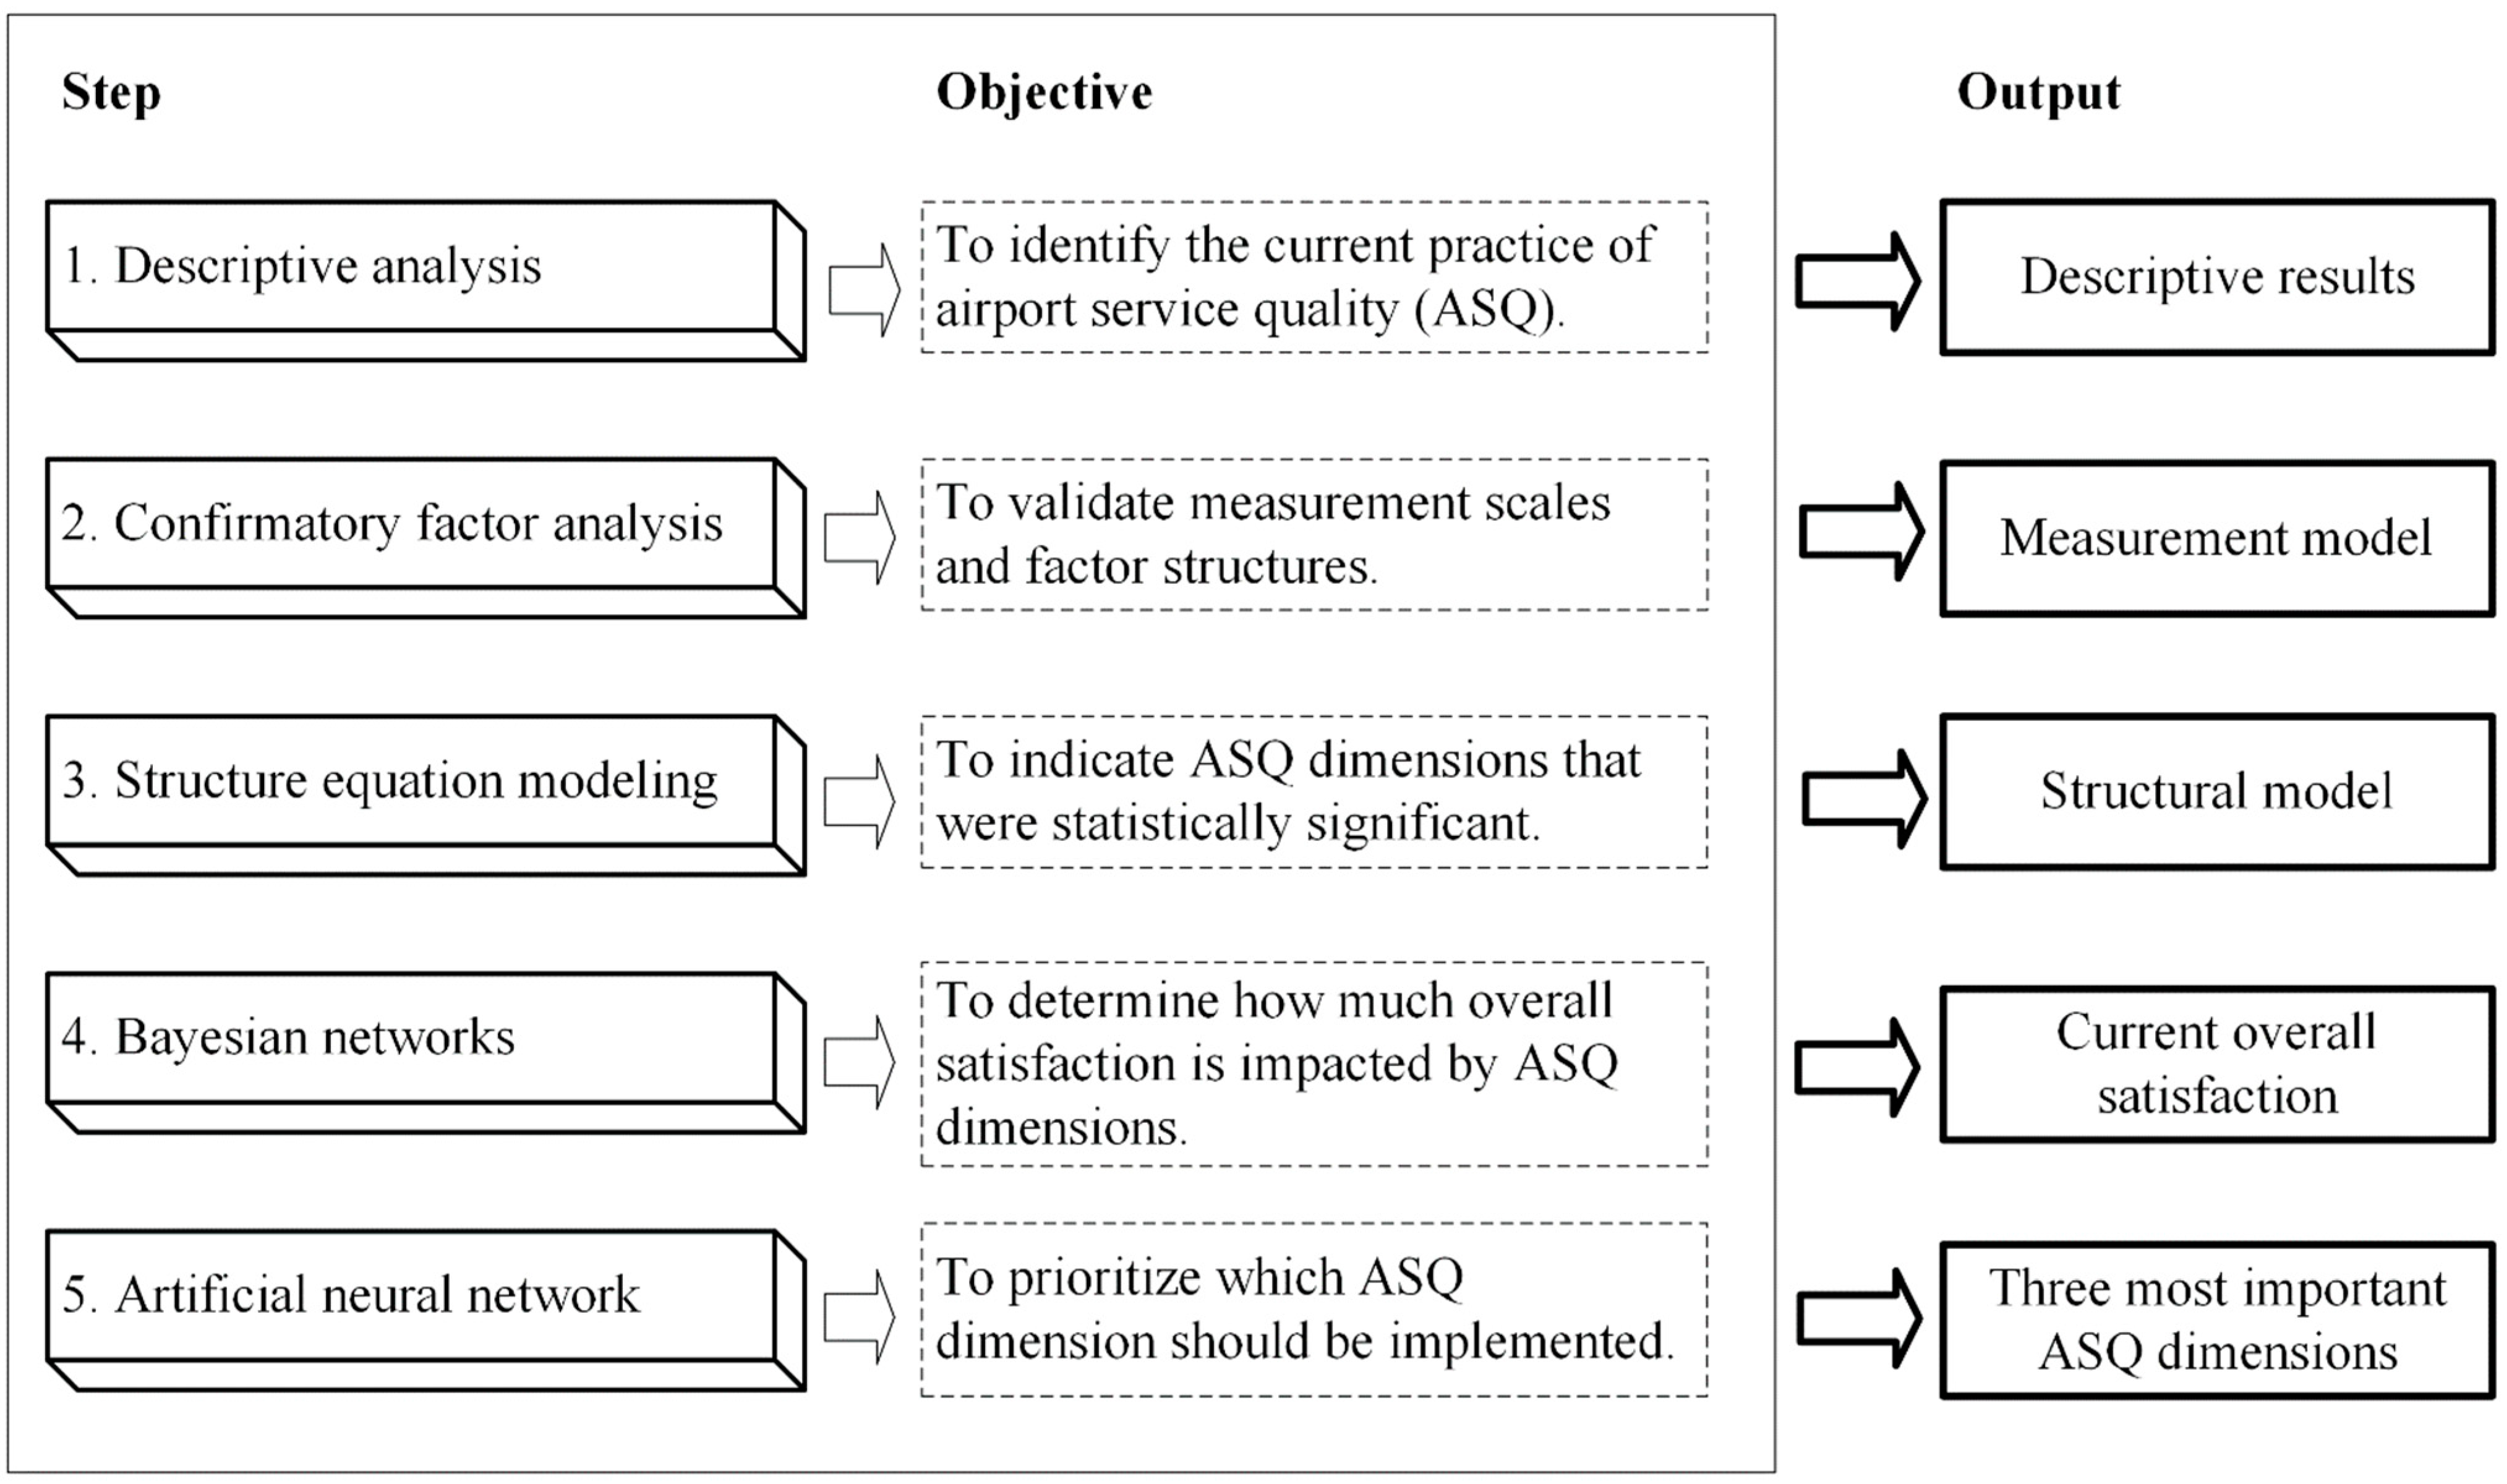
4.3. Data Analysis
| Item | Airport Service Items | SD | Loading (γ) | t-Value | R2 | |
|---|---|---|---|---|---|---|
| Access (Cronbach’s α = 0.903, AVE = 0.776, CR = 0.858) | ||||||
| I1 | “Land transportation has a variety of alternatives, both to and from the airport” | 6.198 | 0.948 | 0.780 | 52.321 ** | 0.609 |
| I2 | “Sufficient parking spaces” | 6.092 | 0.948 | 0.770 | 48.480 ** | 0.592 |
| I3 | “Value for money of parking facilities” | 5.980 | 0.941 | 0.730 | 41.556 ** | 0.533 |
| I4 | “Availability of baggage carts/trolley” | 6.095 | 0.900 | 0.816 | 59.035 ** | 0.666 |
| Check-in (Cronbach’s α = 0.922, AVE = 0.832, CR = 0.918) | ||||||
| I5 | “Waiting time in check-in line” | 6.139 | 0.892 | 0.812 | 69.574 ** | 0.659 |
| I6 | “Efficiency of check-in staff” | 6.168 | 0.886 | 0.838 | 81.147 ** | 0.702 |
| I7 | “Courtesy and helpfulness of check-in staff” | 6.149 | 0.585 | 0.836 | 79.500 ** | 0.700 |
| I8 | “Waiting time at passport inspection” | 6.153 | 0.870 | 0.834 | 78.468 ** | 0.695 |
| I9 | “Courtesy and helpfulness of inspection staff” | 6.188 | 0.901 | 0.840 | 80.562 ** | 0.705 |
| Security (Cronbach’s α = 0.913, AVE = 0.845, CR = 0.909) | ||||||
| I10 | “Courtesy and helpfulness of security staff” | 6.176 | 0.895 | 0.870 | 99.361 ** | 0.758 |
| I11 | “Effectiveness of security inspection” | 6.188 | 0.853 | 0.850 | 87.261 ** | 0.722 |
| I12 | “Waiting time for safety inspection” | 6.170 | 0.867 | 0.819 | 72.702 ** | 0.671 |
| I13 | “Feeling of being safe and secure” | 6.209 | 0.872 | 0.841 | 83.259 ** | 0.707 |
| Wayfinding (Cronbach’s α = 0.921, AVE = 0.828, CR = 0.916) | ||||||
| I14 | “Ease of finding directions at the airport” | 6.223 | 0.852 | 0.836 | 78.931 ** | 0.700 |
| I15 | “Flight information screen” | 6.231 | 0.816 | 0.859 | 90.543 ** | 0.737 |
| I16 | “Walking distance in the passenger terminal” | 6.149 | 0.857 | 0.810 | 67.699 ** | 0.656 |
| I17 | “Ease of connecting other flights” | 6.169 | 0.831 | 0.819 | 71.318 ** | 0.670 |
| I18 | “Courtesy and helpfulness of airport staff” | 6.242 | 0.838 | 0.817 | 70.797 ** | 0.668 |
| Airport facilities (Cronbach’s α = 0.930, AVE = 0.800, CR = 0.926) | ||||||
| I19 | “Sufficiency and quality of restaurants/shops inside the airport” | 6.221 | 0.892 | 0.781 | 57.222 ** | 0.610 |
| I20 | “Value for money of restaurant/eating facilities” | 6.090 | 0.953 | 0.776 | 56.854 ** | 0.602 |
| I21 | “Availability of ATM/Bank/Money changers” | 6.093 | 0.844 | 0.792 | 62.129 ** | 0.628 |
| I22 | “Shopping facilities” | 6.049 | 0.937 | 0.799 | 63.090 ** | 0.638 |
| I23 | “Value for money of shopping facilities” | 6.061 | 0.921 | 0.774 | 56.016 ** | 0.599 |
| I24 | “Availability of Internet service (Wi-Fi)” | 6.107 | 0.939 | 0.823 | 70.794 ** | 0.677 |
| I25 | “Availability of business/executive lounges” | 6.192 | 0.884 | 0.854 | 85.959 ** | 0.730 |
| Airport environment (Cronbach’s α = 0.932, AVE = 0.861, CR = 0.896) | ||||||
| I26 | “Availability and adequacy of restrooms” | 6.198 | 0.881 | 0.870 | 100.551 ** | 0.757 |
| I27 | “Cleanliness of washrooms/restrooms” | 6.212 | 0.870 | 0.867 | 101.598 ** | 0.752 |
| I28 | “Comfort in the waiting area for passengers” | 6.153 | 0.875 | 0.835 | 81.918 ** | 0.698 |
| I29 | “Cleanliness of airport terminal” | 6.151 | 0.894 | 0.865 | 93.668 ** | 0.748 |
| I30 | “Atmosphere or decoration of the airport” | 6.214 | 0.878 | 0.849 | 87.382 ** | 0.720 |
| Arrival Services (Cronbach’s α = 0.906, AVE = 0.857, CR = 0.933) | ||||||
| I31 | “Checking passport/identification card at the immigration checkpoint” | 6.238 | 0.811 | 0.888 | 100.136 ** | 0.789 |
| I32 | “Speed of baggage delivery service” | 6.191 | 0.872 | 0.857 | 80.966 ** | 0.735 |
| I33 | “Custom inspections” | 6.210 | 0.846 | 0.838 | 72.514 ** | 0.702 |
5. Results
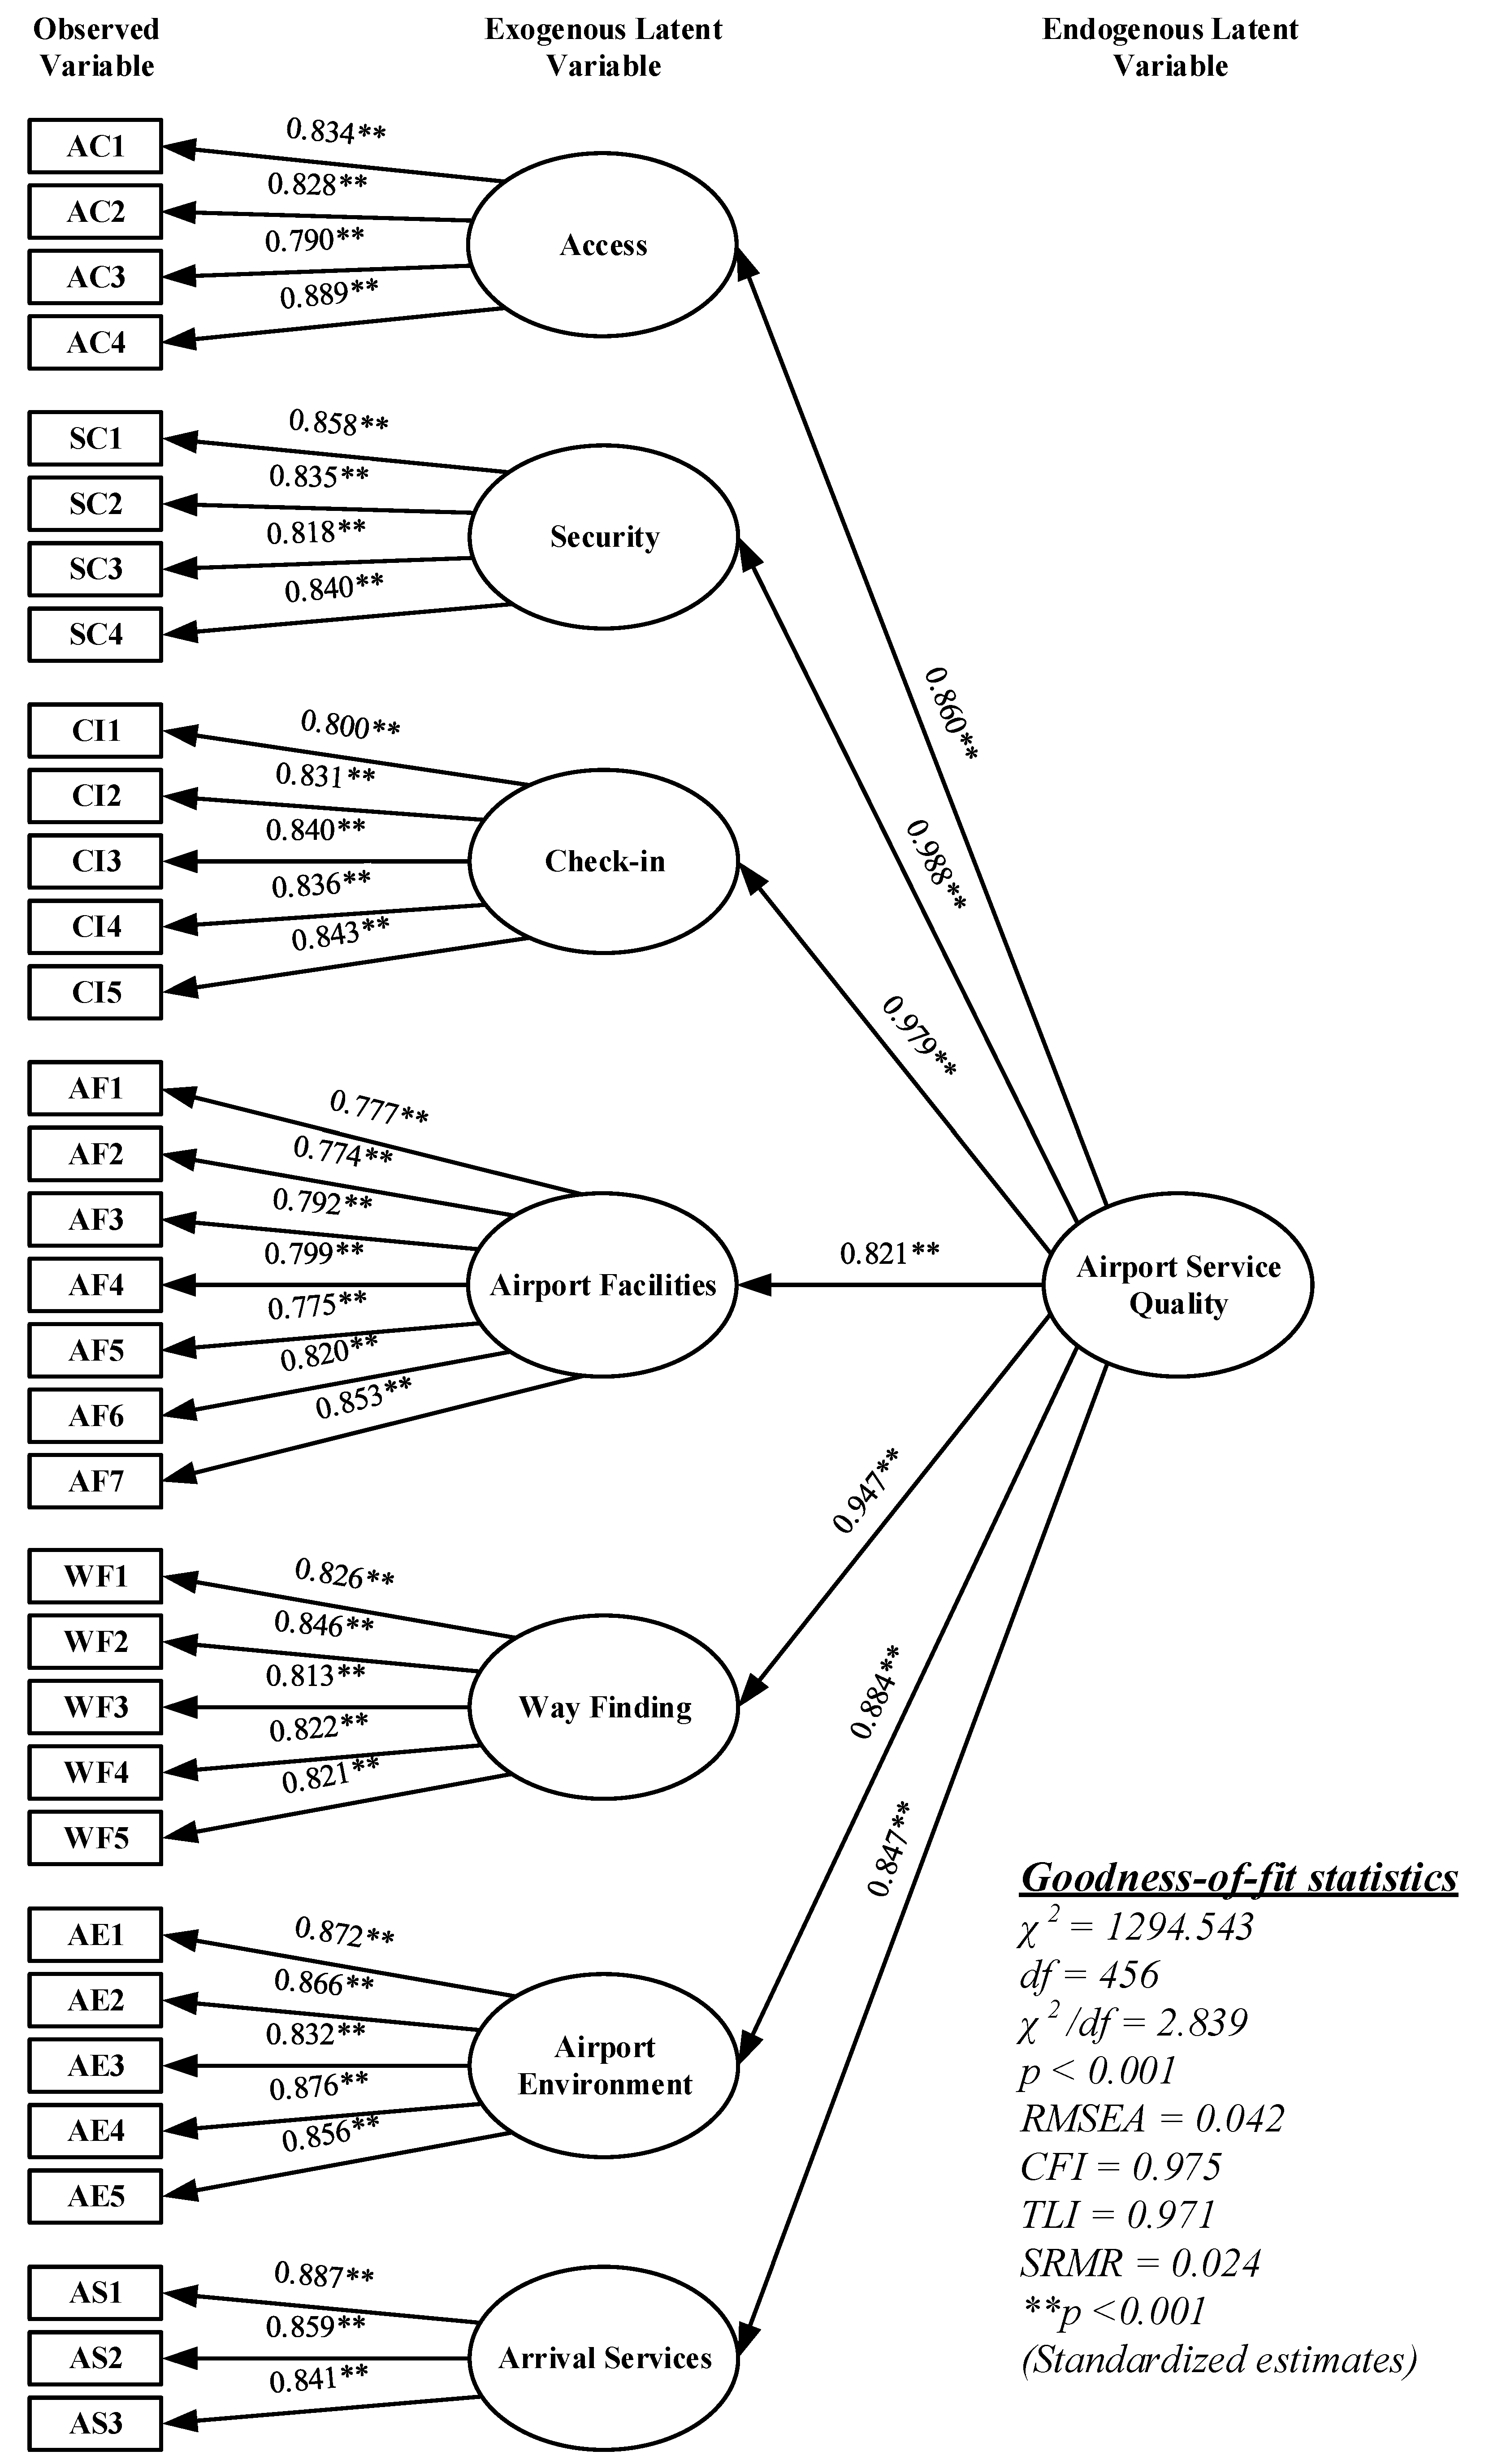
5.1. Structural Equation Modeling
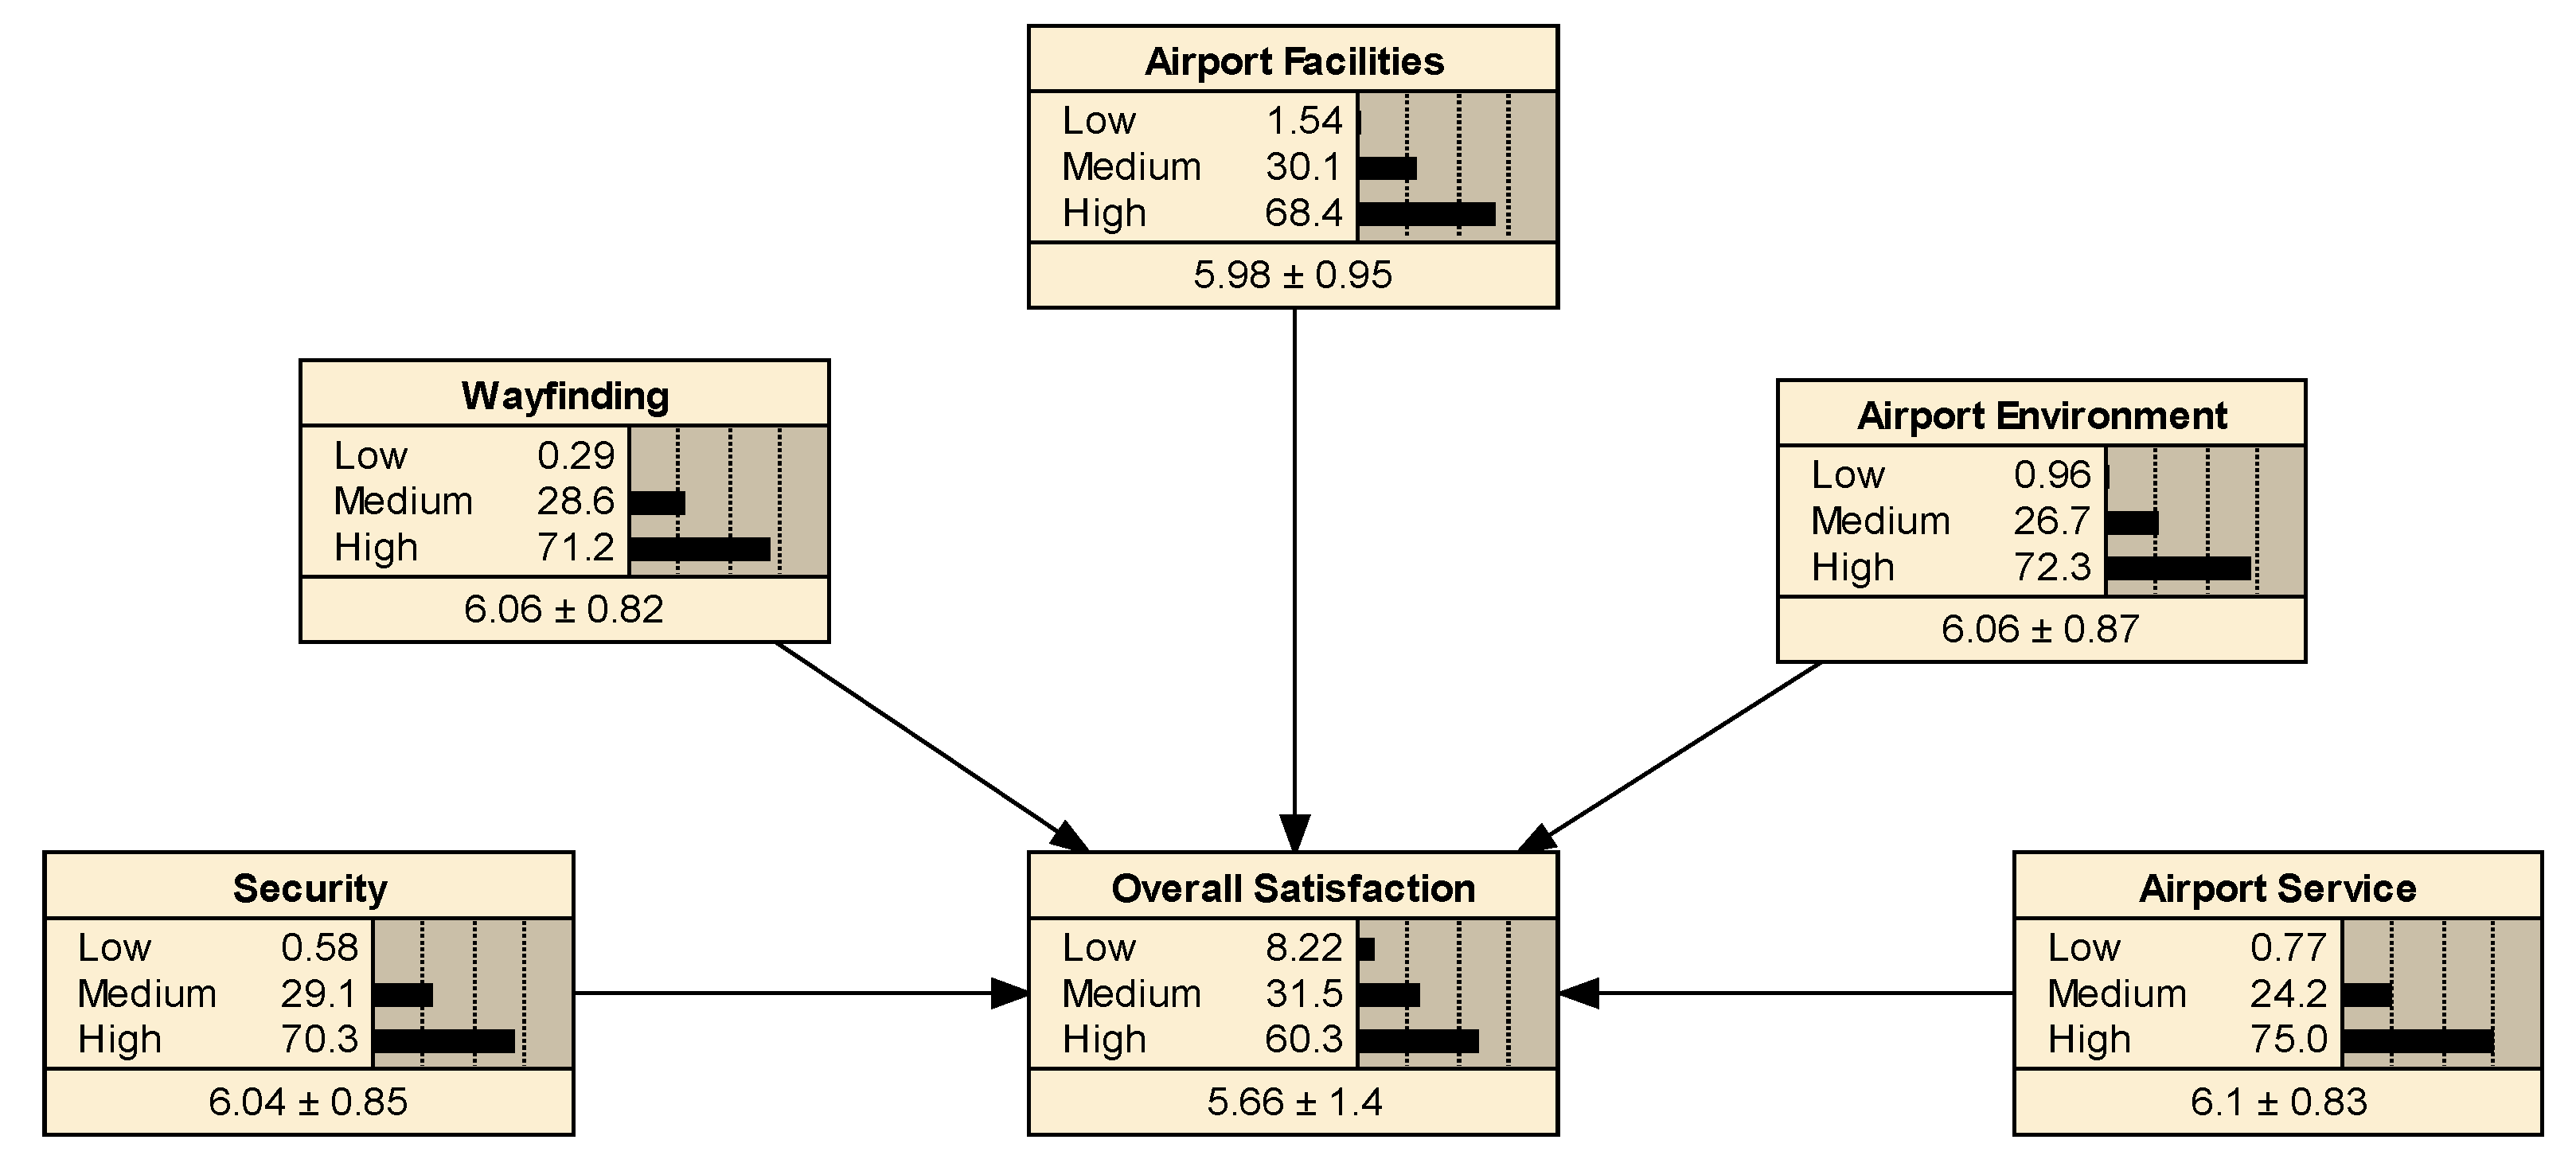
5.2. Bayesian Networks
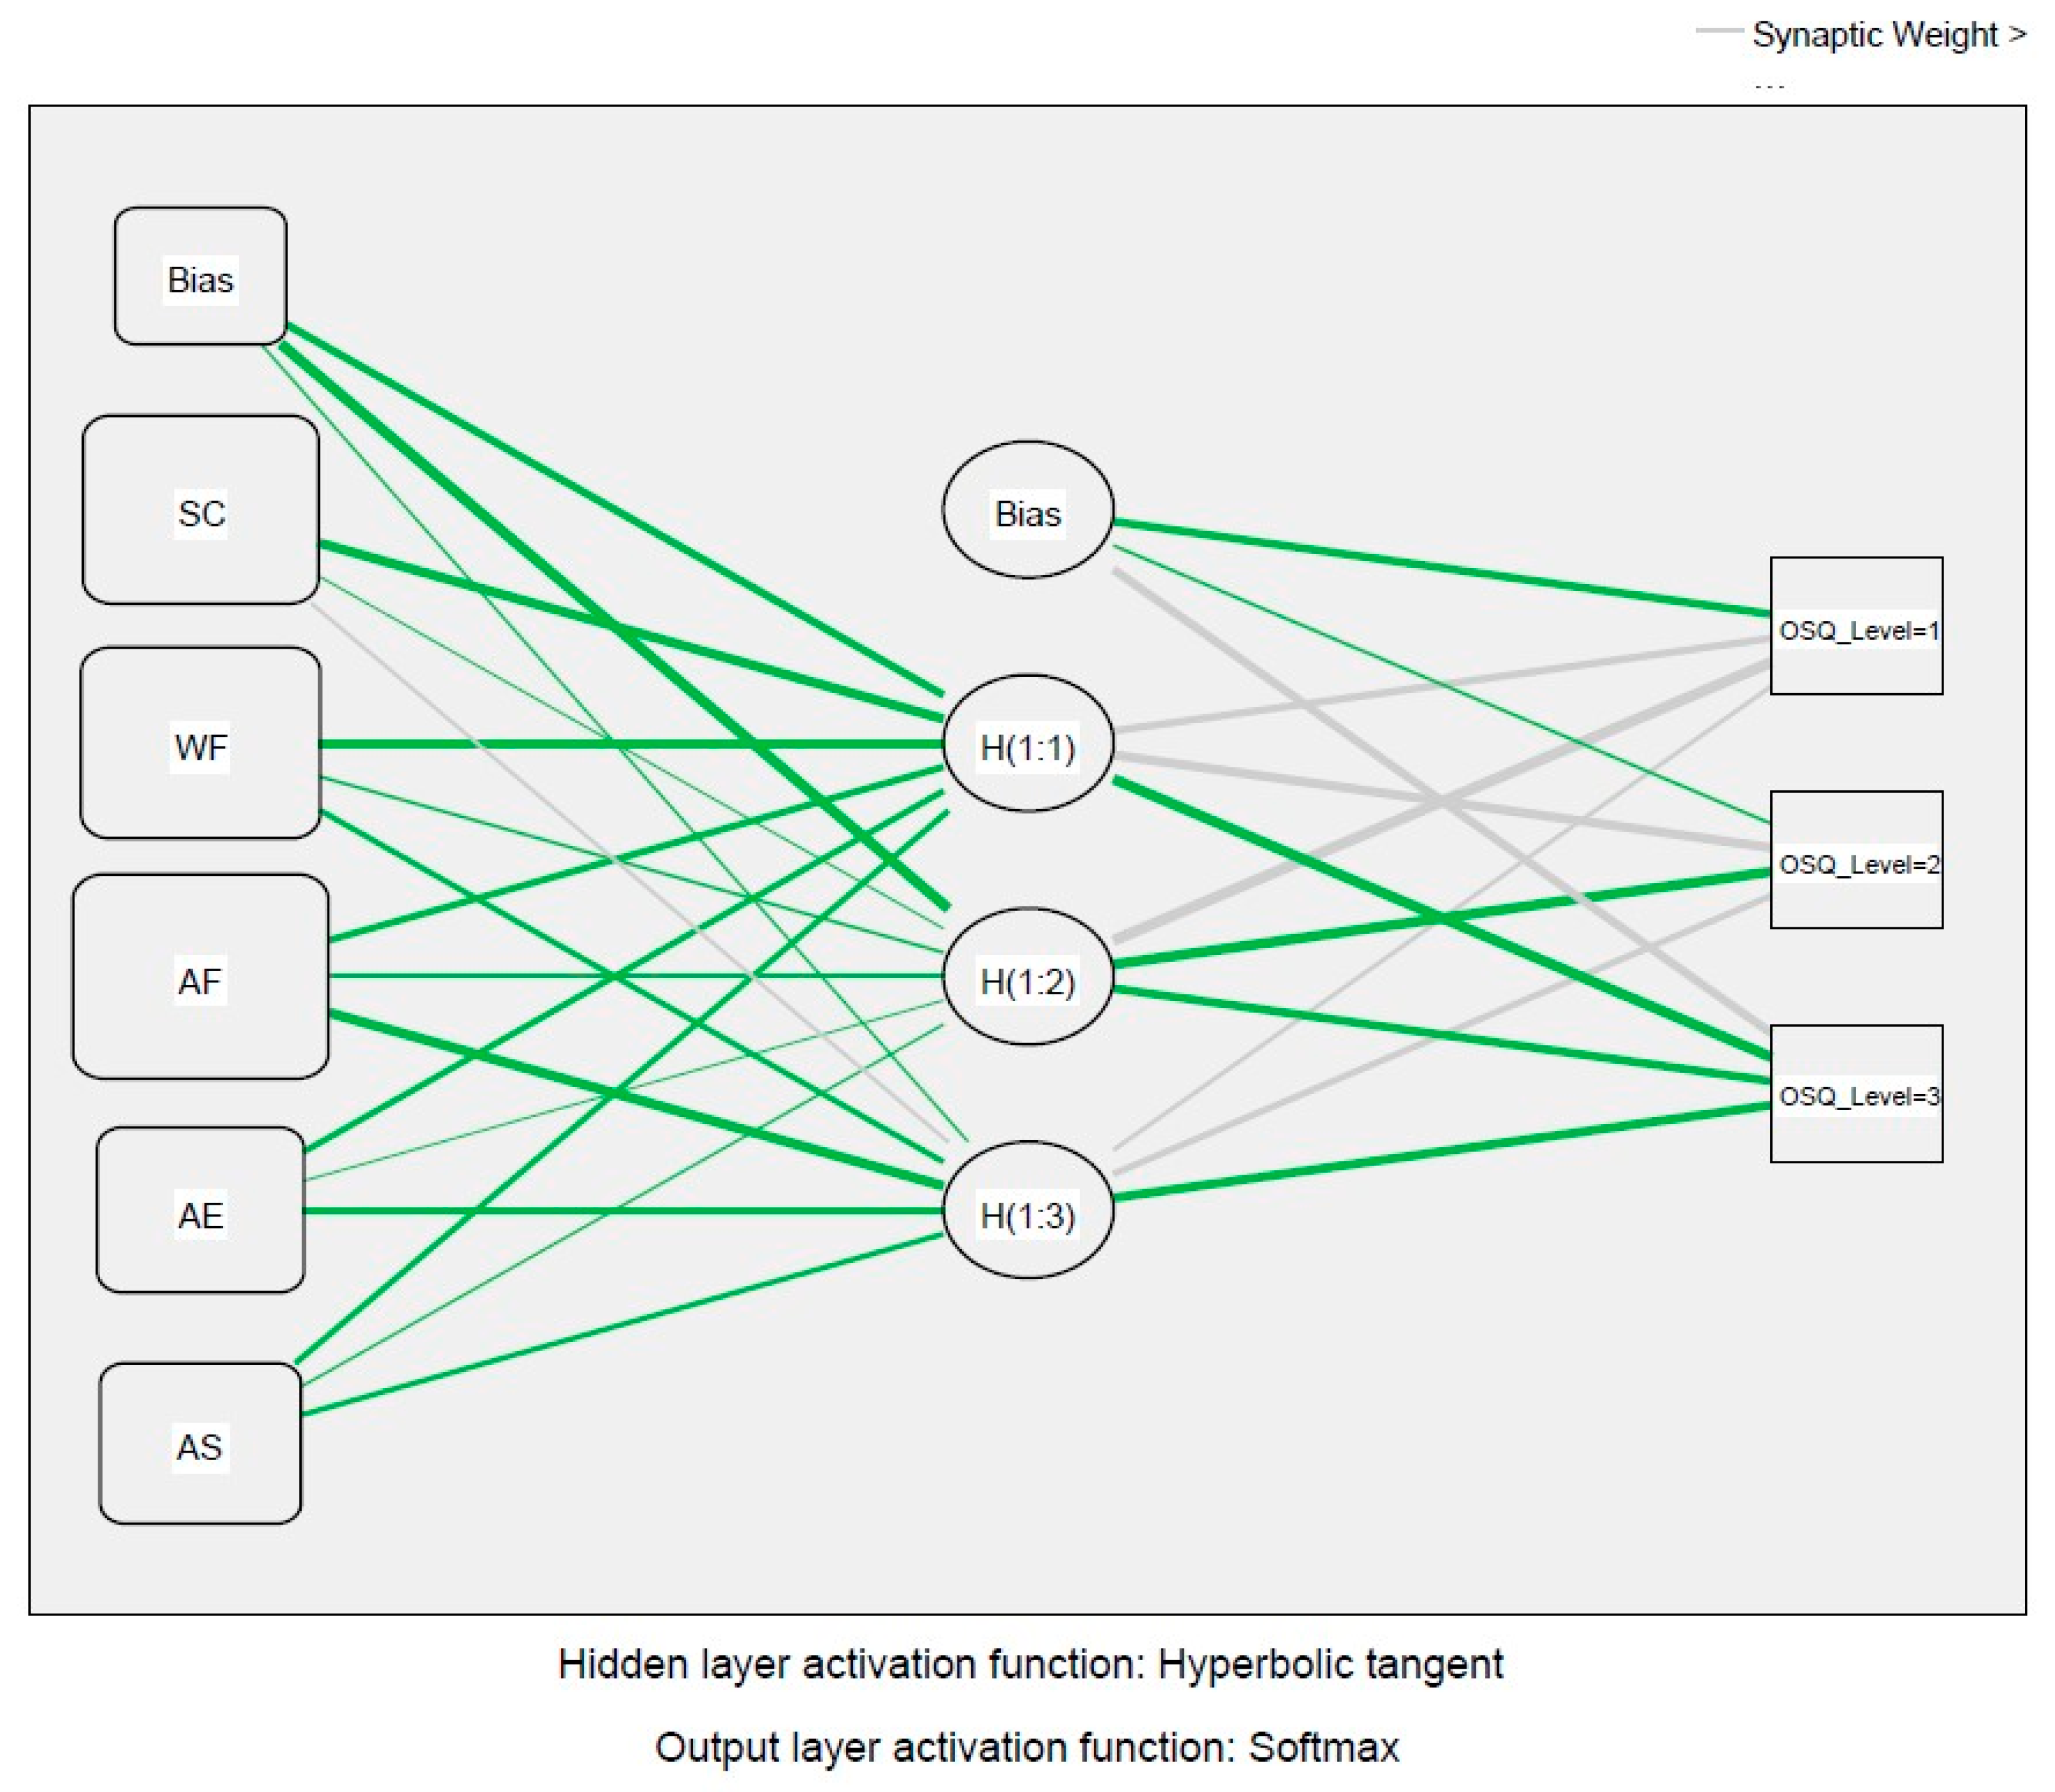
5.3. Artificial Neural Network
6. Discussion
6.1. Theoretical Implications
6.2. Practical Implications
6.3. Limitations
7. Conclusions
Author Contributions
Funding
Institutional Review Board Statement
Informed Consent Statement
Data Availability Statement
Acknowledgments
Conflicts of Interest
Abbreviations
| Abbreviations | State |
| ACI | Airports Council International |
| ACP | Airport Contingency Plan |
| AF | Airport Facilities |
| AE | Airport Environment |
| ANN | Artificial Neural Network |
| AOT | Airports of Thailand |
| AS | Arrival Services |
| ASP | Airport Security Program |
| ASQ | Airport Service Quality |
| ATM | Automated Teller Machine |
| BN | Bayesian Networks |
| CCTV | Closed-Circuit Television |
| CFA | Confirmatory Factor Analysis |
| CFI | Comparative Fit Index |
| CNN | Convolutional Neural Network |
| COVID-19 | Coronavirus Disease 2019 |
| CUBD | Common Use Bag Drop |
| CUSS | Common Use Self Service |
| DRSA | Dominance-based Rough Set Approach |
| EFA | Exploratory Factor Analysis |
| FIMIX-PLS | Finite Mixture Partial Least Squares |
| ICAO | International Civil Aviation Organization |
| IPA | Important Performance Analysis |
| LSTM | Long-Short Term Memory neural network |
| MADM | Multi-attribute Decision Making |
| MANOVA | Multivariate Analysis of Variance |
| MCDM | Multi-criteria Decision Making |
| MLE | Maximum Likelihood Estimation |
| MRA | Multiple Regression Analysis |
| NAR | Non-Aviation Revenue |
| NCA | Necessary Condition Analysis |
| OSQ_Level | Overall Service Quality Level |
| PLS–MGA | Partial Least Squares-based Multigroup Analysis |
| PLS–SEM | Partial Least Squares—Structural Equation Modeling |
| RMSEA | Root Mean Square Error of Approximation |
| SC | Security |
| SEM | Structural Equation Modeling |
| SMS | Safety Management System |
| SRMR | Standardized Root Mean Square Residual |
| TLI | Tucker–Lewis Index |
| UGC | User-Generated Content |
| WF | Wayfinding |
References
- ACI. ASQ Awards and Recognition. 2022. Available online: https://aci.aero/programs-and-services/asq/asq-awards-and-recognition/ (accessed on 1 July 2022).
- Lee, K.; Yu, C. Assessment of airport service quality: A complementary approach to measure perceived service quality based on Google reviews. J. Air Transp. Manag. 2018, 71, 28–44. [Google Scholar] [CrossRef]
- ACI. Voice of the Customer. 2022. Available online: https://aci.aero/programs-and-services/asq/voice-of-the-customer/ (accessed on 1 July 2022).
- Bezerra, G.C.L.; Gomes, C.F. The effects of service quality dimensions and passenger characteristics on passenger’s overall satisfaction with an airport. J. Air Transp. Manag. 2015, 44–45, 77–81. [Google Scholar] [CrossRef]
- Bezerra, G.C.L.; Gomes, C.F. Measuring airport service quality: A multidimensional approach. J. Air Transp. Manag. 2016, 53, 85–93. [Google Scholar] [CrossRef]
- Fodness, D.; Murray, B. Passengers’ expectations of airport service quality. J. Serv. Mark. 2007, 21, 492–506. [Google Scholar] [CrossRef]
- Isa, N.A.M.; Ghaus, H.; Hamid, N.A.; Tan, P.-L. Key drivers of passengers’ overall satisfaction at klia2 terminal. J. Air Transp. Manag. 2020, 87, 101859. [Google Scholar] [CrossRef]
- Jiang, H.; Zhang, Y. An assessment of passenger experience at Melbourne Airport. J. Air Transp. Manag. 2016, 54, 88–92. [Google Scholar] [CrossRef]
- Pantouvakis, A.; Renzi, M.F. Exploring different nationality perceptions of airport service quality. J. Air Transp. Manag. 2016, 52, 90–98. [Google Scholar] [CrossRef]
- Chonsalasin, D.; Jomnonkwao, S.; Ratanavaraha, V. Measurement model of passengers’ expectations of airport service quality. Int. J. Transp. Sci. Technol. 2021, 10, 342–352. [Google Scholar] [CrossRef]
- Liou, J.J.H.; Tang, C.-H.; Yeh, W.-C.; Tsai, C.-Y. A decision rules approach for improvement of airport service quality. Expert Syst. Appl. 2011, 38, 13723–13730. [Google Scholar] [CrossRef]
- Lubbe, B.; Douglas, A.; Zambellis, J. An application of the airport service quality model in South Africa. J. Air Transp. Manag. 2011, 17, 224–227. [Google Scholar] [CrossRef]
- Pandey, M.M. Evaluating the service quality of airports in Thailand using fuzzy multi-criteria decision making method. J. Air Transp. Manag. 2016, 57, 241–249. [Google Scholar] [CrossRef]
- ACI. Airport Service Quality Customer Experience. 2021. Available online: https://aci.aero/programs-and-services/asq/ (accessed on 6 July 2021).
- ACI. Airport Service Quality (ASQ). 2021. Available online: https://aci.aero/customer-experience-asq/ (accessed on 6 July 2021).
- AOT. Customer Satisfaction. 2021. Available online: https://corporate.airportthai.co.th/en/customer-satisfaction/ (accessed on 6 July 2021).
- Yeh, C.-H.; Kuo, Y.-L. Evaluating passenger services of Asia-Pacific international airports. Transp. Res. Part E Logist. Transp. Rev. 2003, 39, 35–48. [Google Scholar] [CrossRef]
- Francis, G.; Humphreys, I.; Fry, J. An international survey of the nature and prevalence of quality management systems in airports. Total Qual. Manag. Bus. Excell. 2003, 14, 819–829. [Google Scholar] [CrossRef]
- Bogicevic, V.; Yang, W.; Bilgihan, A.; Bujisic, M. Airport service quality drivers of passenger satisfaction. Tour. Rev. 2013, 68, 3–18. [Google Scholar] [CrossRef]
- Usman, A.; Azis, Y.; Harsanto, B.; Azis, A.M. Airport service quality dimension and measurement: A systematic literature review and future research agenda. Int. J. Qual. Reliab. Manag. 2022, 39, 2302–2322. [Google Scholar] [CrossRef]
- Di Pietro, L.; Guglielmetti Mugion, R.; Musella, F.; Renzi, M.F.; Vicard, P. Monitoring an airport check-in process by using Bayesian networks. Transp. Res. Part A Policy Pract. 2017, 106, 235–247. [Google Scholar] [CrossRef]
- Farr, A.; Kleinschmidt, T.; Johnson, S.; Yarlagadda, P.; Mengersen, K. Investigating effective wayfinding in airports: A Bayesian network approach. Transport 2014, 29, 90–99. [Google Scholar] [CrossRef]
- Farooq, M.S.; Salam, M.; Fayolle, A.; Jaafar, N.; Ayupp, K. Impact of service quality on customer satisfaction in Malaysia airlines: A PLS-SEM approach. J. Air Transp. Manag. 2018, 67, 169–180. [Google Scholar] [CrossRef]
- Wattanacharoensil, W.; Schuckert, M.; Graham, A. An Airport Experience Framework from a Tourism Perspective. Transp. Rev. 2015, 36, 318–340. [Google Scholar] [CrossRef]
- Graham, A. How important are commercial revenues to today’s airports? J. Air Transp. Manag. 2009, 15, 106–111. [Google Scholar] [CrossRef]
- Bezerra, G.C.L.; Gomes, C.F. Determinants of passenger loyalty in multi-airport regions: Implications for tourism destina-tion. Tour. Manag. Perspect. 2019, 31, 145–158. [Google Scholar] [CrossRef]
- Bakır, M.; Özdemir, E.; Akan, Ş.; Atalık, Ö. A bibliometric analysis of airport service quality. J. Air Transp. Manag. 2022, 104, 102273. [Google Scholar] [CrossRef]
- Liao, W.; Cao, X.; Liu, Y.; Huang, Y. Investigating differential effects of airport service quality on behavioral intention in the multi-airport regions. Res. Transp. Bus. Manag. 2022, 45, 100877. [Google Scholar] [CrossRef]
- Wipulanusat, W.; Sunkpho, J.; Stewart, R.A. Effect of Cross-Departmental Collaboration on Performance: Evidence from the Federal Highway Administration. Sustainability 2021, 13, 6024. [Google Scholar] [CrossRef]
- Nghiêm-Phú, B.; Suter, J.R. Airport image: An exploratory study of McCarran International Airport. J. Air Transp. Manag. 2018, 67, 72–84. [Google Scholar] [CrossRef]
- Trischler, J.; Lohmann, G. Monitoring quality of service at Australian airports: A critical analysis. J. Air Transp. Manag. 2018, 67, 63–71. [Google Scholar] [CrossRef]
- Martin-Domingo, L.; Martín, J.C.; Mandsberg, G. Social media as a resource for sentiment analysis of Airport Service Quality (ASQ). J. Air Transp. Manag. 2019, 78, 106–115. [Google Scholar] [CrossRef]
- Barakat, H.; Yeniterzi, R.; Martín-Domingo, L. Applying deep learning models to twitter data to detect airport service quality. J. Air Transp. Manag. 2021, 91, 102003. [Google Scholar] [CrossRef]
- Bakır, M.; Akan, Ş.; Özdemir, E.; Nguyen, P.-H.; Tsai, J.-F.; Pham, H.-A. How to Achieve Passenger Satisfaction in the Airport? Findings from Regression Analysis and Necessary Condition Analysis Approaches through Online Airport Reviews. Sustainability 2022, 14, 2151. [Google Scholar] [CrossRef]
- Li, L.; Mao, Y.; Wang, Y.; Ma, Z. How has airport service quality changed in the context of COVID-19: A data-driven crowdsourcing approach based on sentiment analysis. J. Air Transp. Manag. 2022, 105, 102298. [Google Scholar] [CrossRef]
- Lopez-Valpuesta, L.; Casas-Albala, D. Has passenger satisfaction at airports changed with the onset of COVID-19? The case of Seville Airport (Spain). J. Air Transp. Manag. 2023, 108, 102361. [Google Scholar] [CrossRef]
- Hair, J.F.; Black, W.C.; Babin, B.J.; Anderson, R.E. Multivariate Data Analysis, 7th ed.; Prentice-Hall Publication: Hoboken, NJ, USA, 2010. [Google Scholar]
- Shah, R.; Goldstein, S.M. Use of structural equation modeling in operations management research: Looking back and forward. J. Oper. Manag. 2006, 24, 148–169. [Google Scholar] [CrossRef]
- Kline, R.B. Principles and Practice of Structural Equation Modeling, 2nd ed.; Guilford Publications: New York, NY, USA, 2005. [Google Scholar]
- Chanpariyavatevong, K.; Wipulanusat, W.; Champahom, T.; Jomnonkwao, S.; Chonsalasin, D.; Ratanavaraha, V. Predicting Airline Customer Loyalty by Integrating Structural Equation Modeling and Bayesian Networks. Sustainability 2021, 13, 7046. [Google Scholar] [CrossRef]
- Díez-Mesa, F.; de Oña, R.; de Oña, J. Bayesian networks and structural equation modelling to develop service quality models: Metro of Seville case study. Transp. Res. Part A Policy Pract. 2018, 118, 1–13. [Google Scholar] [CrossRef]
- Leong, L.-Y.; Hew, T.-S.; Lee, V.-H.; Ooi, K.-B. An SEM–artificial-neural-network analysis of the relationships between SERVPERF, customer satisfaction and loyalty among low-cost and full-service airline. Expert Syst. Appl. 2015, 42, 6620–6634. [Google Scholar] [CrossRef]
- Sharma, S.K. Integrating cognitive antecedents into TAM to explain mobile banking behavioral intention: A SEM-neural network modeling. Inf. Syst. Front. 2019, 21, 815–827. [Google Scholar] [CrossRef]
- Raut, R.D.; Priyadarshinee, P.; Gardas, B.B.; Jha, M.K. Analyzing the factors influencing cloud computing adoption using three stage hybrid SEM-ANN-ISM (SEANIS) approach. Technol. Forecast. Soc. Change 2018, 134, 98–123. [Google Scholar] [CrossRef]
- Anderson, R.D.; Vastag, G. Causal modeling alternatives in operations research: Overview and application. Eur. J. Oper. Res. 2004, 156, 92–109. [Google Scholar] [CrossRef]
- Wipulanusat, W.; Panuwatwanich, K.; Stewart, R.A.; Arnold, S.L.; Wang, J. Bayesian network revealing pathways to work-place innovation and career satisfaction in the public service. J. Manag. Anal. 2020, 7, 253–280. [Google Scholar]
- Zhou, Y.; Fenton, N.; Neil, M. Bayesian network approach to multinomial parameter learning using data and expert judgments. Int. J. Approx. Reason. 2014, 55, 1252–1268. [Google Scholar] [CrossRef]
- Kalinic, Z.; Marinkovic, V.; Molinillo, S.; Liébana-Cabanillas, F. A multi-analytical approach to peer-to-peer mobile pay-ment acceptance prediction. J. Retail. Consum. Serv. 2019, 49, 143–153. [Google Scholar] [CrossRef]
- Steiger, J.H. Understanding the limitations of global fit assessment in structural equation modeling. Personal. Individ. Differ. 2007, 42, 893–898. [Google Scholar] [CrossRef]
- Hu, L.T.; Bentler, P.M. Cutoff criteria for fit indexes in covariance structure analysis: Conventional criteria versus new alternatives. Struct. Equ. Model. A Multidiscip. J. 1999, 6, 1–55. [Google Scholar] [CrossRef]
- Han, S.; Ham, S.; Yang, I.; Baek, S. Passengers’ perceptions of airline lounges: Importance of attributes that determine usage and service quality measurement. Tour. Manag. 2012, 33, 1103–1111. [Google Scholar] [CrossRef]
- Meidute-Kavaliauskiene, I.; Yıldız, B.; Çiğdem, Ş.; Činčikaitė, R. The Effect of COVID-19 on Airline Transportation Services: A Study on Service Robot Usage Intention. Sustainability 2021, 13, 12571. [Google Scholar] [CrossRef]
- AOT. Sustainable Development Report 2021. 2022. Available online: https://www.airportthai.co.th/wp-content/uploads/2022/01/SDReport2021en.pdf (accessed on 12 May 2023).
- Correia, A.R.; Wirasinghe, S.C.; de Barros, A.G. A global index for level of service evaluation at airport passenger terminals. Transp. Res. Part E Logist. Transp. Rev. 2008, 44, 607–620. [Google Scholar] [CrossRef]
- Gkritza, K.; Niemeier, D.; Mannering, F. Airport security screening and changing passenger satisfaction: An exploratory assessment. J. Air Transp. Manag. 2006, 12, 213–219. [Google Scholar] [CrossRef]
- Sun, X.; Wandelt, S.; Zheng, C.; Zhang, A. COVID-19 pandemic and air transportation: Successfully navigating the paper hurricane. J. Air Transp. Manag. 2021, 94, 102062. [Google Scholar] [CrossRef]


| Characteristics | Category | Frequency | Percentage |
|---|---|---|---|
| Gender | Male | 516 | 49.8% |
| Female | 521 | 50.2% | |
| Age | 18–24 years old | 162 | 15.6% |
| 25–34 years old | 570 | 55.0% | |
| 35–44 years old | 221 | 21.3% | |
| 45–54 years old | 60 | 5.8% | |
| Over 54 years old | 24 | 2.3% | |
| Education | Less than bachelor’s degree | 238 | 23.0% |
| Bachelor’s degree | 635 | 61.2% | |
| Higher Bachelor’s Degree | 164 | 15.8% | |
| Occupation | Government official/State Enterprise employee | 358 | 34.5% |
| Private company | 380 | 36.6% | |
| Business owners | 105 | 10.1% | |
| Agriculturist | 16 | 1.5% | |
| Student | 88 | 8.5% | |
| General worker | 59 | 5.7% | |
| Other | 31 | 3.0% | |
| Travel Frequency (per year) | 1 time | 503 | 48.5% |
| 2–3 times | 343 | 33.1% | |
| 4–6 times | 121 | 11.7% | |
| 7 times and more | 70 | 6.8% |
| Hypothesis Path | Standardized Estimate (β) | Standard Error | t-Value | Result |
|---|---|---|---|---|
| Direct Effect | ||||
| H1: Access Overall satisfaction | −0.174 | 0.102 | −1.703 | Not Supported |
| H2: Check-in Overall satisfaction | 0.150 | 0.147 | 1.019 | Not Supported |
| H3: Security Overall satisfaction | 0.282 | 0.109 | 2.586 ** | Supported |
| H4: Wayfinding Overall satisfaction | 0.176 | 0.052 | 3.386 ** | Supported |
| H5: Airport facilities Overall satisfaction | 0.312 | 0.067 | 4.695 ** | Supported |
| H6: Airport environment Overall satisfaction | 0.131 | 0.063 | 2.083 * | Supported |
| H7: Arrival services Overall satisfaction | 0.124 | 0.038 | 3.257 ** | Supported |
| Sample | Observed | Predicted | |||
|---|---|---|---|---|---|
| Low | Medium | High | Percent Correct | ||
| Training | Low | 7 | 0 | 0 | 100.0% |
| Medium | 0 | 278 | 10 | 96.5% | |
| High | 0 | 11 | 518 | 97.9% | |
| Overall Percent | 0.8% | 35.1% | 64.1% | 97.5% | |
| Testing | Low | 3 | 0 | 0 | 100.0% |
| Medium | 0 | 73 | 0 | 100.0% | |
| High | 0 | 3 | 134 | 97.8% | |
| Overall Percent | 1.4% | 35.7% | 62.9% | 98.6% | |
| Variable | Importance | Normalized Importance | Rank of the Importance |
|---|---|---|---|
| Airport facilities | 0.240 | 100.0% | 1 |
| Wayfinding | 0.216 | 90.3% | 2 |
| Security | 0.211 | 88.1% | 3 |
| Airport environment | 0.171 | 71.3% | 4 |
| Arrival services | 0.162 | 67.8% | 5 |
| Step | Results | |
|---|---|---|
| 1. Descriptive analysis | Descriptive results | There were seven ASQ dimensions: access, check-in, security, wayfinding, airport facilities, airport environment, arrival services. |
| 2. Confirmatory factor analysis | Measurement model | |
| 3. Structural equation modeling | Structural model | The structural model indicated that security, wayfinding, airport facilities, airport environment, and arrival services were statistically significant with overall satisfaction, supporting H3, H4, H5, H6, and H7. |
| 4. Bayesian networks | Current overall satisfaction | The BN explained that the overall satisfaction that 60.3% was at a high state. Passenger satisfaction still has room for improvement. |
| 5. Artificial neural network | Three most important ASQ dimensions | The ANN prioritized the critical ASQ dimensions that help increase overall satisfaction levels: airport facilities, wayfinding, and security. |
Disclaimer/Publisher’s Note: The statements, opinions and data contained in all publications are solely those of the individual author(s) and contributor(s) and not of MDPI and/or the editor(s). MDPI and/or the editor(s) disclaim responsibility for any injury to people or property resulting from any ideas, methods, instructions or products referred to in the content. |
© 2023 by the authors. Licensee MDPI, Basel, Switzerland. This article is an open access article distributed under the terms and conditions of the Creative Commons Attribution (CC BY) license (https://creativecommons.org/licenses/by/4.0/).
Share and Cite
Pholsook, T.; Wipulanusat, W.; Thamsatitdej, P.; Ramjan, S.; Sunkpho, J.; Ratanavaraha, V. A Three-Stage Hybrid SEM-BN-ANN Approach for Analyzing Airport Service Quality. Sustainability 2023, 15, 8885. https://doi.org/10.3390/su15118885
Pholsook T, Wipulanusat W, Thamsatitdej P, Ramjan S, Sunkpho J, Ratanavaraha V. A Three-Stage Hybrid SEM-BN-ANN Approach for Analyzing Airport Service Quality. Sustainability. 2023; 15(11):8885. https://doi.org/10.3390/su15118885
Chicago/Turabian StylePholsook, Thitinan, Warit Wipulanusat, Poomporn Thamsatitdej, Sarawut Ramjan, Jirapon Sunkpho, and Vatanavongs Ratanavaraha. 2023. "A Three-Stage Hybrid SEM-BN-ANN Approach for Analyzing Airport Service Quality" Sustainability 15, no. 11: 8885. https://doi.org/10.3390/su15118885
APA StylePholsook, T., Wipulanusat, W., Thamsatitdej, P., Ramjan, S., Sunkpho, J., & Ratanavaraha, V. (2023). A Three-Stage Hybrid SEM-BN-ANN Approach for Analyzing Airport Service Quality. Sustainability, 15(11), 8885. https://doi.org/10.3390/su15118885