Article

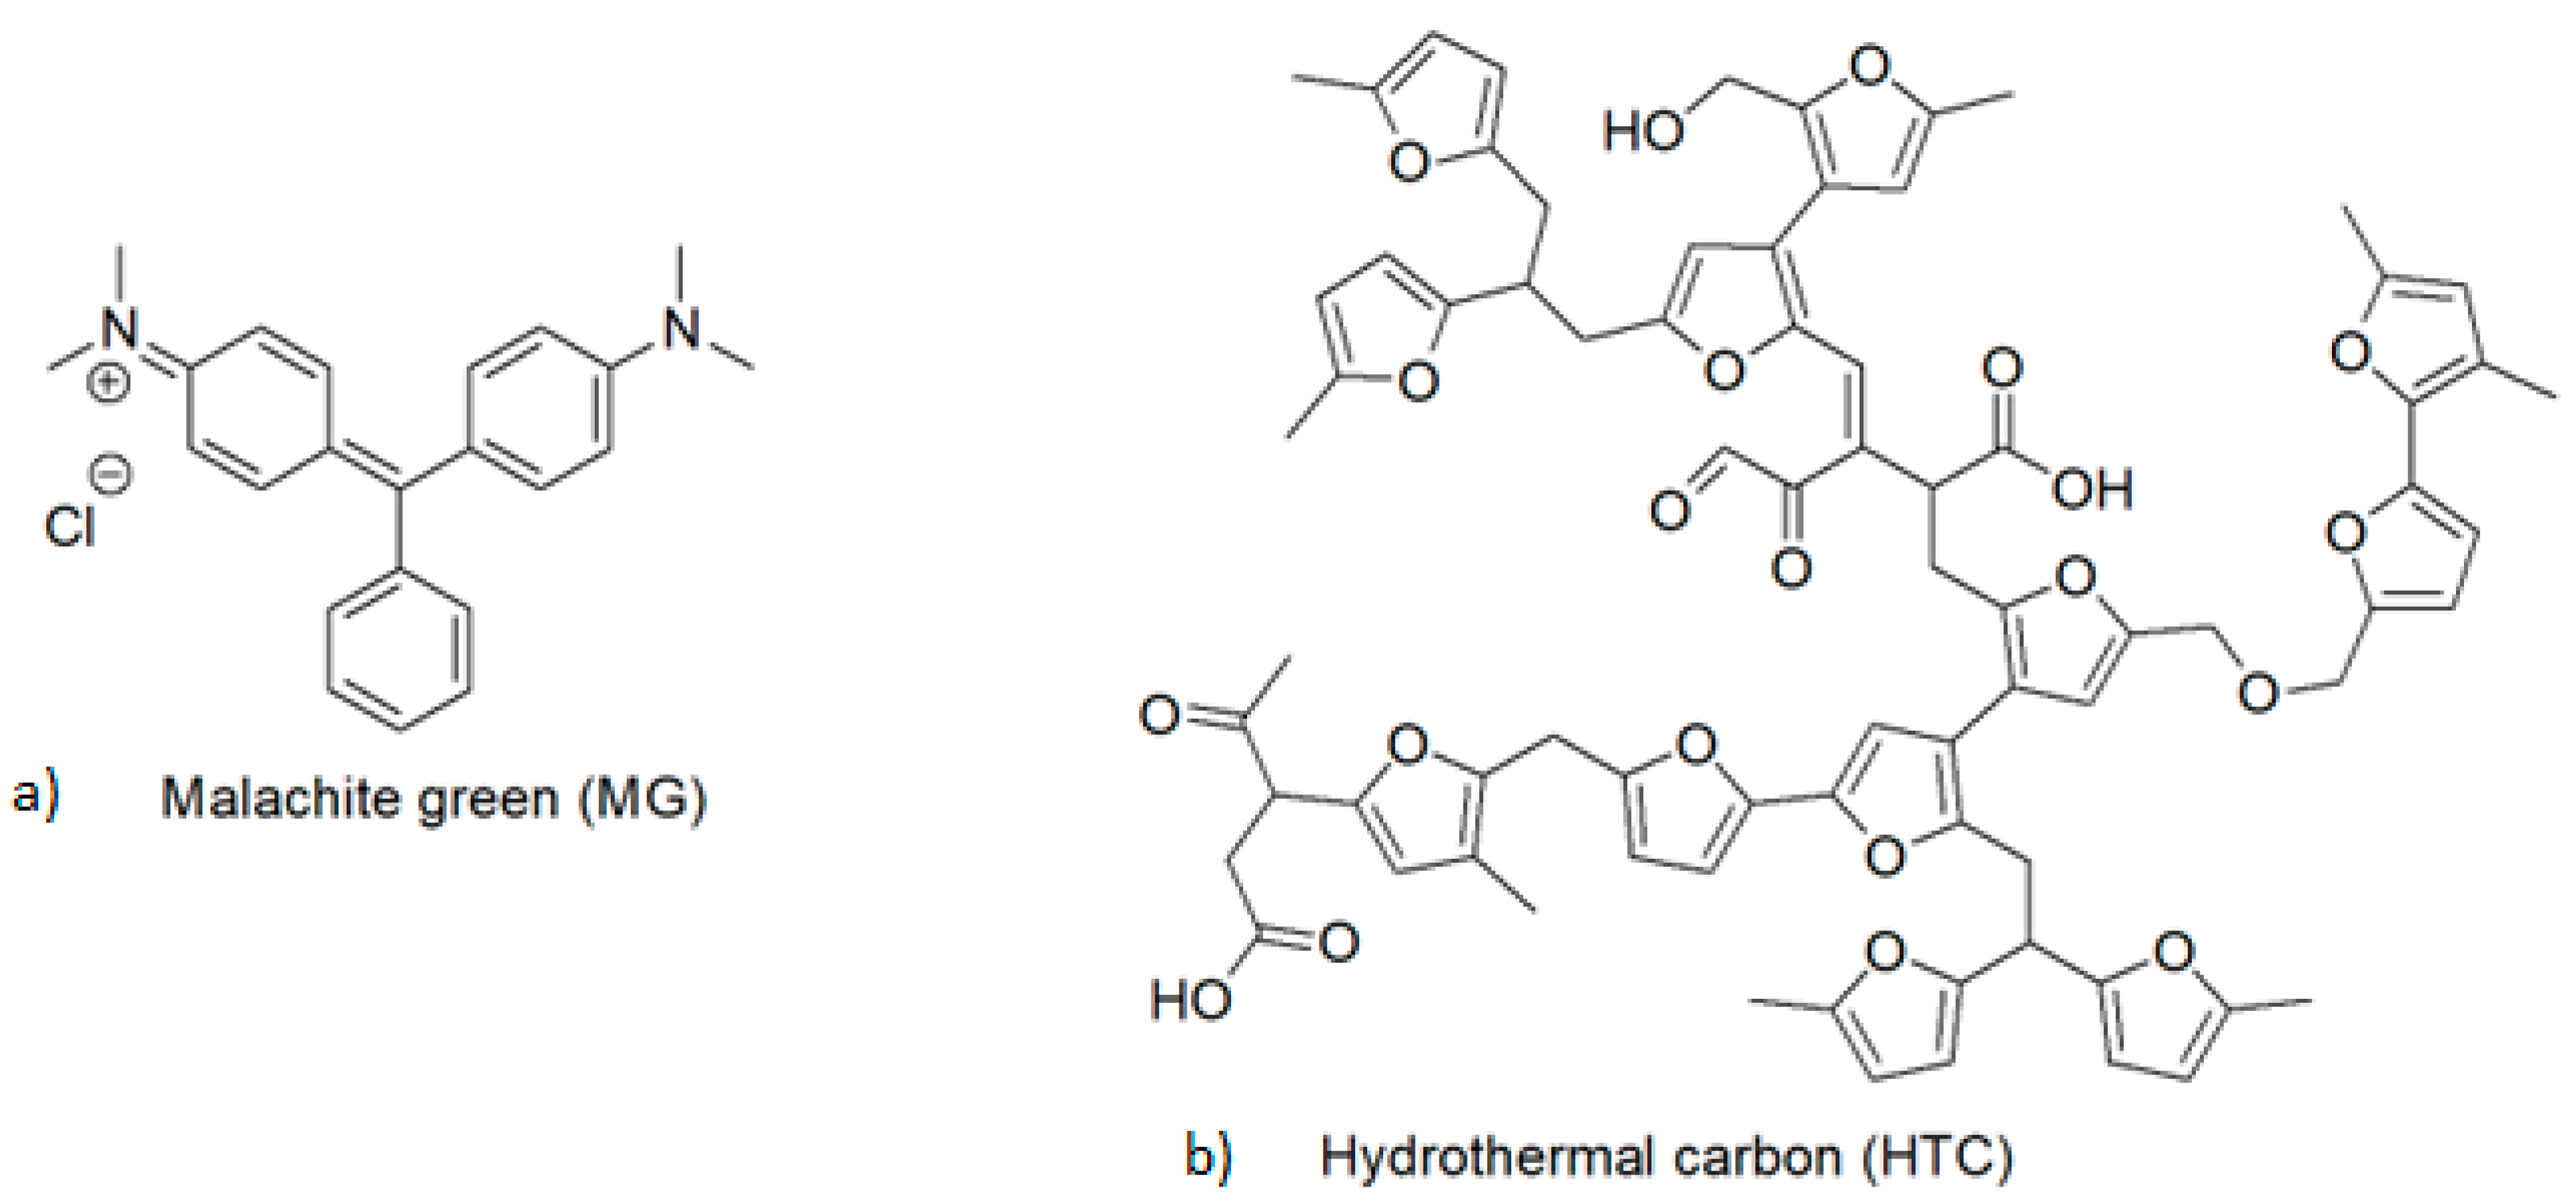
Removal of Malachite Green Using Hydrochar from PALM Leaves

by
Hassan H. Hammud
1,*,
Mohamad H. Hammoud
2,
Aqeel A. Hussein
3,
Youssef B. Fawaz
4,
Malai Haniti Sheikh Abdul Hamid
5 and
Nadeem S. Sheikh
5,*
1
Department of Chemistry, College of Science, King Faisal University, P.O. Box 400, Al-Ahsa 31982, Saudi Arabia
2
Department of Chemical Engineering, King Faisal University, P.O. Box 380, Al-Ahsa 31982, Saudi Arabia
3
Department of Medical Laboratory Science, College of Science, Komar University of Science and Technology, Sulaymaniyah 46001, Iraq
4
Faculty of Science, Beirut Arab University, Debbieh 11-5020, Lebanon
5
Chemical Sciences, Faculty of Science, Universiti Brunei Darussalam, Jalan Tungku Link, Gadong BE1410, Brunei Darussalam
*
Authors to whom correspondence should be addressed.
Sustainability 2023, 15(11), 8939; https://doi.org/10.3390/su15118939
Submission received: 21 March 2023 / Revised: 19 May 2023 / Accepted: 25 May 2023 / Published: 1 June 2023

Abstract

:
Biochar was prepared by the hydrothermal carbonization (HTC) of palm leaves, characterized, and utilized as an adsorbent for Malachite Green dye (MG). The Higher Heating Value (HHV) of biochar depends on the carbonization temperature and has a maximum value of 24.81 MJ/kg. Activation using H2O2 oxidation of HTC biochar prepared at 208 °C produced AHTC with improved capacity. The optimum pH was found to be in the range 7–8. Freundlich, Langmuir, Temkin, and Dubinin–Radushkevich adsorption isotherms were used to study MG adsorption data. The Langmuir isotherm provided the best fit for experimental data. Experiments conducted using activated biochar AHTC at 25 °C resulted in an adsorption capacity of 62.80 mg/g, far greater than what was observed for HTC biochar (45.59 mg/g). The maximum adsorption capacity was 88% when the concentration of MG solution was 66 ppm. The free energy change in adsorption DG° indicated that the adsorption process was spontaneous. Adsorption followed pseudo-second-order kinetics. Fixed-column adsorptions models, namely, Thomas, Yan et al. and Yoon–Nelson models, were investigated for AHTC. The column adsorption capacity determined by the Thomas model was 33.57 mg/g. In addition, a computational investigation has been carried out to determine the structural and electronic features, as well as the quantum chemical parameters of HTC and MG. Moreover, the interaction between the HTC and MG is investigated, which is further elaborated by performing non-covalent interaction (NCI) through the reduced density gradient (RDG) analysis. Thus, the easily prepared hydrochar from abundant waste palm leaves can be used as a high-value biocoal and efficient adsorbent of the cationic dye malachite green.

1. Introduction

Wastewater discharged from textiles, hair color, paper production, food technology, and leathers is usually contaminated by dyes. Thousands of tons of dyes per year are discharged into textile industry wastewater. Most synthesized dyes resist the effects of light, pH, high temperature, and microbial attack. For these reasons, biodegradation of dye is typically a slow process [1]. It is necessary to remove the dye material from the effluent before being discharged into the environment because they decrease the aesthetic value of water [2]. Recently, wastewater treatment technologies implemented novel MIL-101(Fe)/Bi2WO6 microspheres [3] and Cd0.5Zn0.5S/Bi2MoO6 heterostructures [4] for the photocatalytic degradation of organic compounds.
Malachite green (MG), a triphenyl methane dye, which is usually used for silk, wool, jute, and leather dying processes, has a detrimental effect on human health; it causes irritation and pain to the skin upon direct contact, irritation and even cancer of the gastrointestinal tract when inhaled or ingested [5]. The currently exhibited methods to remove this dye from effluent include coagulation, electrochemical process, membrane separation process, chemical oxidation, reverse osmosis, ozonation, chemical precipitation, and ultrafiltration, which are not popular due to their economically high cost and formation of hazardous by-products [6]. Therefore, attempts have been conducted to improve an efficient and eco-friendly technology to reduce dye content in water discharge. Adsorption is an effective and promising technique for the removal of dye from wastewater. Economic advantages and adsorption capacity are the main concerns when selecting an adsorbent; thus, current research efforts are focused on developing an efficient and low-cost adsorbent. Recently several types of adsorbents were studied for the removal of cationic organic dyes, such as methylene blue using modified marine algae Carolina [7], crystal violet by modified Khalas dates residues [8], malachite green by hydrothermally carbonized pine needles [9] and by cobalt carbon nanostructures [10]. Crystal violet by cobalt-carbon/silica nanocomposites [11,12,13] and crystal violet and methylene blue by graphene-nickel silica [14]. In comparison, the anionic methyl orange dye was successfully removed from water by cobalt-carbon/silica nanocomposites [13]. There was an important development in the preparation and application of flexible ceramic fiber in water remediation [15]. The nanofiber/nanoparticle-based catalysts (hierarchical CuO–ZnO/SiO2) showed great advantages in the treatment of Congo red and 4-nitrophenol [16]. MG pollution in aquaculture environments can be eliminated by several methods, such as adsorption, degradation using advanced oxidation processes (AOPs), or biodegradation using microbes or enzymes [17]. However, adsorption has the advantage of simplicity, low cost, and availability of adsorbents. Thus, adsorption was studied for other pollutants, such as tetracycline, using modified orange peel biochar [18] and formic acid molecules on the (104) surface of calcite [19].
Hydrothermal carbonization is a thermochemical process that transforms biomass immersed in water in an anaerobic environment and under moderate heat and pressure into carbonaceous material (HTC), which has gained less attention than the liquid product (bio-oil) [20,21]. The HTC process has the advance of using a non-hazardous water medium [22]. HTC products were tested recently as adsorbents; hydrothermally carbonized phycocyanin-extracted algal bloom residues HTC-PE-ABR showed a high capacity for the removal of malachite green [23]. Palm leaves are abundant waste worldwide, such as in the Middle East and northern Africa regions. Millions of tons of palm leaves are naturally produced each year; the reuse of palm leaves as adsorbent for water treatment purposes can be of great economical value. The objective of this research study is to clarify the adsorption behavior of HTC and activated HTC (AHTC) prepared using palm leaves for the removal of MG in an aqueous solution. Various factors, including temperature, solution pH, and contact time, were carefully examined. The equilibrium kinetics and thermodynamics of the adsorption of MG from water were explored. The easily prepared hydrochar from abundant waste palm leaves was found to be a high-value biocoal and efficient adsorbent of the cationic dye malachite green.

2. Experimental and Methodology

2.1. Equipment and Instrument

The samples were shaken using a shaker-incubator (SHIN SAENG SKIR-601), aliquots were centrifuged with a centrifuge (Centuriol Scientific LTD), concentrations of malachite green (MG) (Figure 1a) in the supernatant were measured using UV–Visible spectroscopy (sp-3000 plus, Optima, Tokyo, Japan), the pH of the solution was measured using a pH meter (Mettler Toledo Model MP 220). Thermogravimetric–differential thermal analysis (TG-DTA) plots were measured from 20–700 °C on a SETARAM LABSYS thermal analyzer under a flow of nitrogen gas with a heating rate of 3 °C/min. High-resolution images were recorded using a high-resolution transmission electron microscope (HRTEM) operating at 300 kV (Titan Cryo Twin, FEI Company, Hillsboro, OR, USA).

2.2. Biochar Preparation

2.2.1. Hydrothermal Carbonized Palm Leaves: HTC-PL Biochar

A stainless-steel Teflon-lined autoclave reactor of 150 mL capacity was used to prepare hydrothermal carbonization of palm leaves HTC (Figure 1b) [9]. The autoclave contained temperature and pressure sensors and a pressure relief valve. In a typical experiment, chopped pieces of palm leaves (10 g) and citric acid catalyst pellets (10 mg) were mixed in deionized water (100 mL). The autoclave was flushed with nitrogen gas. The mixture was then heated for 435 min to reach maximum temperatures Tmax (186, 201, 208, 212, or 225 °C). The temperature and pressure were recorded in intervals of 5 to 30 min for a maximum temperature of 208 °C, Figure 2a. Figure S1a shows the increase in reaction pressures (psi) versus time inside the HTC reactor at different Tmax values of 186–225 °C. In the end, the biocoal is collected by filtration, dried at 105 °C for 4 h, and weighed. HTC biochar PL-208 obtained at Tmax 208 °C was shown in Figure 2c and Figure S1b (wet form) and Figure 2b (dry form). The processed water was weighed in order to calculate the mass balance. For the adsorption studies, the dried HTC biochar obtained at 208 °C was ground to less than 0.5 mm, chemically modified, and used as an adsorbent. The details of the preparation of adsorbent HTC-PL-208 at Tmax (208 °C) are presented in Table S1.

2.2.2. Activated Hydrothermal Carbonized Palm Leaves: AHTC-PL-208

Activated AHTC-PL-208 was prepared by oxidizing dried HTC (3 g) with 20 mL H2O2 (10%) for 2 h, then drying at 80 °C for 24 [24,25].

2.3. Malachite Green Solution Preparation

Analytical reagent MG, chemical formula C23H26N2O·HCl, λ = 618 nm, a purity of about 85%, was supplied by Sigma Aldrich. The stock solution (1 g/L) and the diluted solutions were prepared with deionized water.

2.4. Batch Experiments
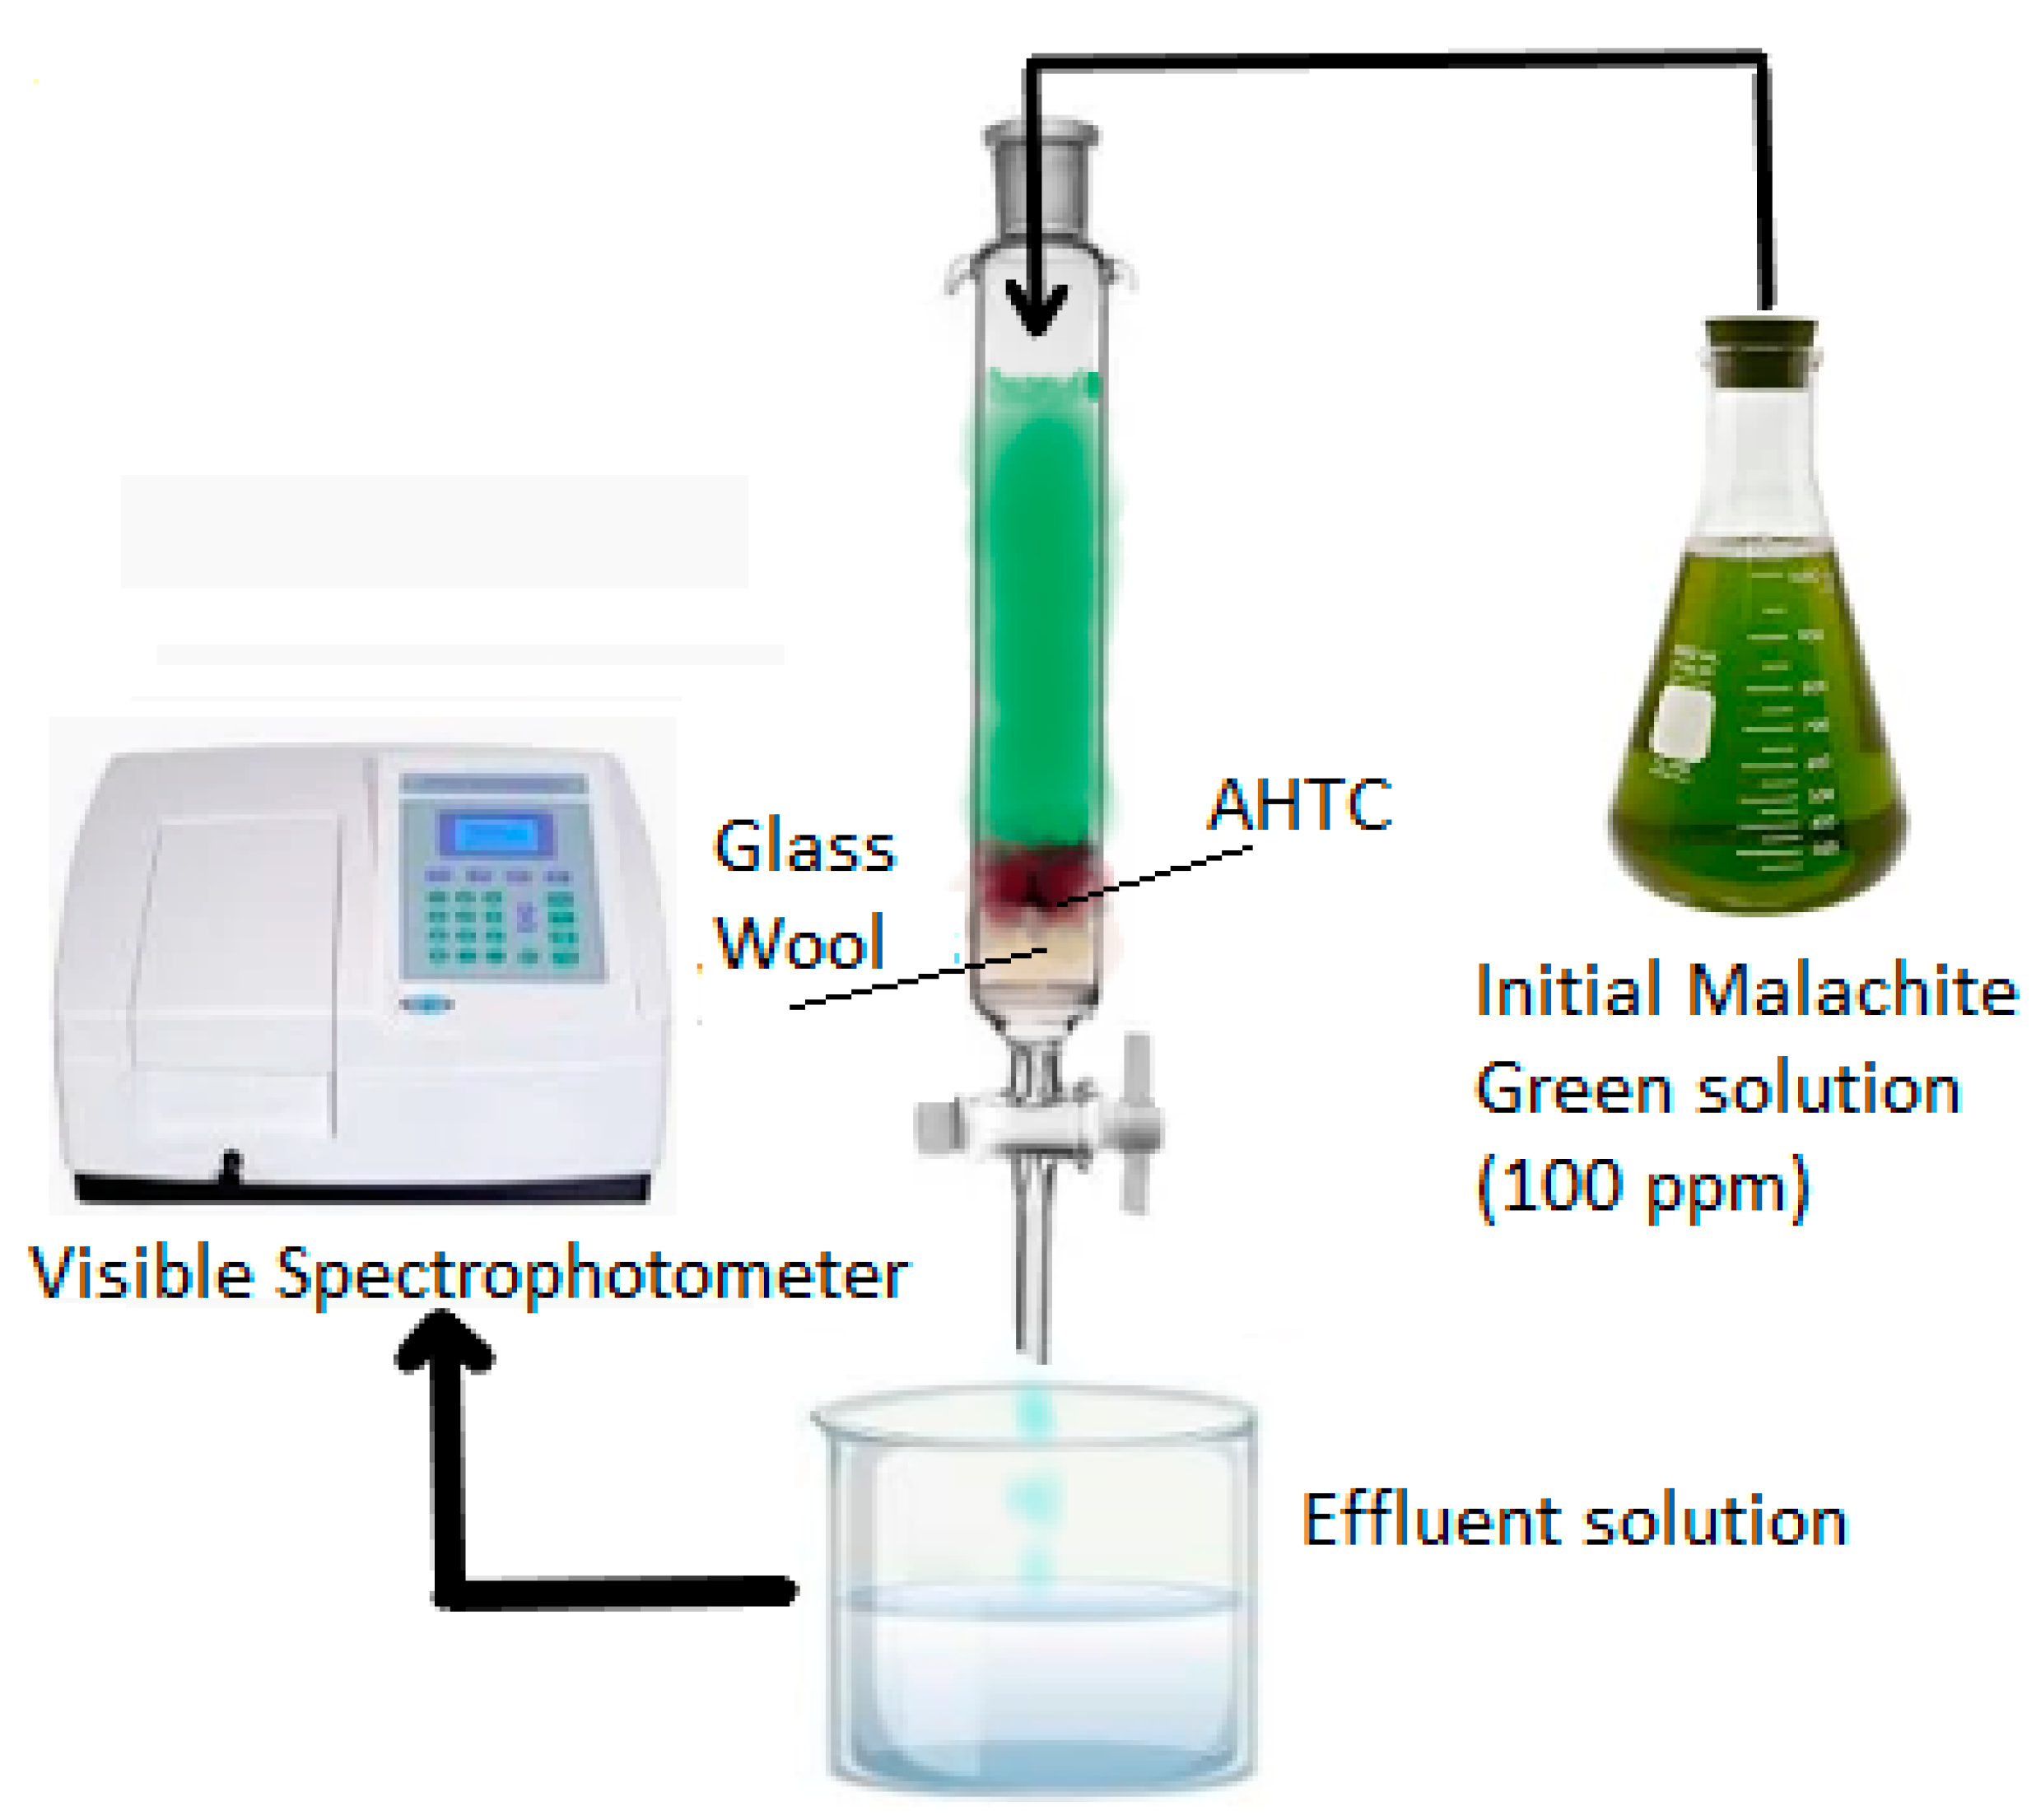
The effect of initial solution pH on adsorption was undertaken; solutions with different pH (2–9) were prepared by adding 0.1 g of HTC into a 50 mL 100 ppm MG solution in a 100 mL flask. The pH of the solution was adjusted with 0.1 M HCl/NaOH. The flasks were shaken at 160 rpm and 25 °C for 24 h. The initial and equilibrium concentration of MG was determined by recording the absorbance at λ = 618 nm.
In order to study the effect of contact time, 0.1 g of HTC or AHTC was shaken with 50 mL of 100 ppm MG solution at 160 rpm at 25 °C. The absorbance was recorded at time intervals in order to determine the optimum time.
For kinetic sorption experiments at different temperatures, 0.1 g of HTC and AHTC were added to flasks containing 50 mL of 100 ppm MG solution and then shaken at 160 rpm at pre-determined temperatures (25, 30, 35, and 40 °C). Aliquots of solution were taken at different times, and their absorbance was measured to determine the residual MG concentration.
While for the isothermal and thermodynamic study, a batch adsorption experiment was carried out in a shaker-incubator where 0.1 g of HTC and AHTC were added into 50 mL of MG solution of concentration varying from (25–200 mg/L) for 24 and 4 h, respectively. After shaking at 160 rpm, the remaining MG concentration of the mixture was measured.

2.5. Column Study

The experiment was conducted by packing 0.5 g of AHTC in a 1 cm wide glass column, then 100 ppm MG solution was added to the column and eluted. The height of the column bed is 0.5 cm. The flow rate was adjusted to 2 mL/min (Figure 3). The MG concentration of the aliquot collected was determined using a spectrophotometer, and the column was operated until the column became saturated. Three cycles were carried out where the adsorbent loaded with MG was regenerated with 0.1 M HCl after each cycle.

2.6. Methodology

Adsorption Isotherm

Equilibrium adsorption occurs in stirred batch reactors when the rate of the forward reaction (adsorption) equals the rate of the reverse reaction (desorption) [26]. The adsorption isotherm represents the distribution at the equilibrium of adsorbate molecules between the adsorbent and solution phases. It revealed the sorption mechanism, surface properties, and affinity of the sorbent [27]. Some of the equilibrium models most used in practice are Langmuir, Freundlich, Temkin, and Dubinin–Radushkevich, which were tested in this research study.
The Langmuir isotherm model assumes uniform energies of adsorption with complete monolayer coverage on the adsorbent surface [28]. The non-linear Langmuir isotherm is represented by the following equation:
qe = (qm KL Ce)/(1 + KL Ce)
where Ce (mg/L) is the equilibrium concentration, qe (mg/g) is the amount adsorbed at equilibrium, qm (mg/g) is the maximum adsorption capacity, and KL is a constant related to adsorption energy.
The Freundlich isotherm model [29] is the earliest known equation describing the adsorption process. It can be used for non-ideal sorption that involves heterogeneous and multilayer adsorption [30]. Freundlich model is given by the following non-linear:
qe = Kf Ce 1/n
where KF (mg/g)(L/mg)1/n is a distribution coefficient related to the bonding energy. nF = 1/n indicates surface heterogeneity.
The Temkin isotherm model assumes that the adsorption energy decreases linearly with the surface coverage due to the interactions between the adsorbent and adsorbate [31]. The non-linear form of Temkin isotherm is given by:
qe = (RT/b)ln(KT Ce)
where b is the Temkin constant related to the heat of sorption (J/mol), KT is the Temkin isotherm constant (L/g), R is the ideal gas constant (8.314 J/K·mol), and T is the temperature in Kelvin.
The Dubinin–Radushkevich (D-R) model estimates the porosity of the adsorbent and the apparent free energy of the adsorption [32]. The non-linear equations of the D-R model are shown in the following equation:
qe = qm exp(−βε2)
where β is a constant related to the adsorption energy, qm is the theoretical saturation capacity, and ε is the Polanyi potential. The mean free energy of adsorption (E) is an indication of the nature of the adsorption process. It can be calculated from β. For values of E < 8 kJ/mol, the adsorption mechanism is controlled by physical forces; chemical forces are dominated when E is higher than 8 KJ/mol [33].
Finally, in order to evaluate the applicability of each isotherm equation, the sum of square errors (SSE) and Chi-square (χ2) were calculated [34].

3. Results and Discussion

3.1. Preparation of HTC Biochar

The variation in the recorded temperature and pressure versus time during the hydrothermal carbonization of palm leaves to form biocoal HTC-PL208 indicated that the temperature T = 195 °C was reached quickly in 55 min. Then it increased slowly until it attained Tmax = 208 °C at 435 min (Figure 2a). In addition, a quick increase in the pressure was observed initially until it reached 65 psi after 55 min. Then the pressure became approximately stable until it reached 90 psi at the end of the experiment after 435 min; Figure 2a for batch PL-208 at maximum temperature 208 °C and Figure S1a for all batches PL-186, PL-201, PL-208, PL-212, and PL-225 were produced at maximum temperatures Tmax ranging from 186 °C to 225 °C. The pressure increase is due to the production of gases from the dehydration and decomposition of raw biomass. Analysis, percentages, and yields for raw palm leaves and biocoal PL-208 produced by HTC prepared at Tmax = 208 °C are summarized in Table S1.
Figure S2a indicated that with an increase in the maximum temperature Tmax of various hydrothermal experiments, the mass recovery decreased considerably. Therefore, in accordance with mass balance, the dry mass is reduced, whereas more dehydration (water generation) and decarboxylation (the split-off of carbon dioxide) occurred as Tmax increased [35]. This is also supported with the increase in the final pressure (affected by the generation of gas) as the final temperature of experiment Tmax increased through 186 °C, 201 °C, 208 °C, 212 °C, and 225 °C for the hydrothermal preparation of biocoal PL-186, PL-201, PL-208, PL-212 and PL-225, Figure S1a.

3.2. Properties of HTC Biochar

In addition, HTC of palm leaves produced biocoal characterized by large coal heating values (HHV), large efficiency of hydrothermal energy conversion (η), and a small rate of ash formation. The biocoal had high coal and fixed carbon yields and a low mass of volatile matter, Table 1. An important characteristic of the biocoal is the higher heating value HHV (MJ/kg). It is the total energy content released when fuel is burnt in air [36,37].
The HHV resulting from carbonization increased when the temperature of the reaction increased considerably. This increase is from 20.95 to 24.81 MJ/kg for palm leaves biochar PL-186 to PL-225 (Table 1).
Analysis of biocoal energetic content produced showed an increase in energy conversion efficiency (η) under the effect of reaction temperature. (η) is defined as the ratio between energy content in the biocoal divided by that in the raw palm leaves; it was calculated by the relationship mentioned below, Equation (5) [38]:
η c o a l = y c o a l × H H V c o a l H H V b i o
where ηcoal is the energy conversion efficiency, HHVcoal is the HHV of the biocoal, and HHVbio is the HHV of the feedstock. The energy conversion efficiency η of the biocoal produced is illustrated in Table B, representing the efficiency of the hydrothermal energy conversion of dry basis biocoal to dry basis organic matter in the feedstock, which gradually increased from 79.6% to 88.7% for PL-186 to PL-225, respectively. Thus, the % energy recovery in the biocoal (i.e., energy conversion efficiency) increased with an increase in the reaction temperature at the expense of % mass recovery. The optimal reaction temperature is the maximum temperature at which the biomass has the highest energetic value without a great loss in the mass yield. This happened at a temperature of 207 °C. However, the HTC process conversion of palm leaves showed that the HHV and the % energy recovery in the bio-coal increased with an increase in reaction temperature without great loss in the mass.
In addition, the HHV is most dependent on the carbon content. This confirms that HTC conversion, as a carbon concentrating process, increased the HHV of the biocoal product. The HHVs correlate well with the carbon content of the organic solids, enabling assessment of the resulting HTC–biocoal fuel characteristics. The plot of carbon content vs. calorific value (Figure 3b) Figure S2b indicated a good correlation between them. The slope was 0.537, and R2 > 0.9. The obtained results of carbon content and calorific value of HTC Palm leaves are close to peat and brown coal [39].

3.3. Thermal and TEM Analysis of HTC and AHTC

Thermal Analysis: HTC and AHTC were heated to 800 °C, where all relevant weight loss was complete. The % mass loss and enthalpy change (J/g) at each peak temperature were shown for AHTC in Figure S3. The minor weight loss at 100 °C is due evaporation of moisture. In the first peak of HTC-PL-208 thermal analysis, 35% mass loss occurred between 150 and 350 °C at 335 °C due to organic materials decomposition and volatilization. The second peak mass loss was 40% from 350 to 550 °C was due to the coking of the carbon materials in the absence of air and the loss of significant amounts of CO2 and CO gases. While for AHTC-PL-208, there was a mass loss of 44% in the range 150–350 °C at 327 °C and 24% at 395 °C in the range 350–550 °C, Figure S3. TGA curves indicated that the samples were not completely carbonized due to the presence of hydroxyl (-OH) and carboxylic (-COOH) groups [9].
TEM analysis: high-resolution transmission electron microscopy (HRTEM) analysis of AHTC-PL-208 showed carbonaceous sponge-like cubic mesoporous nanostructures consisting of very fine nanoparticles with sizes (<20 nm), Figure 2c.

3.4. Effect of pH and Contact Time

Figure 4a shows that the adsorption of MG onto HTC depends strongly on the solution pH because the adsorption capacity of MG increases with increasing pH. The maximum adsorption capacity was reached at pH = 8; lower pH results in increasing the H+ concentration in the system, and hence the surface of HTC gains positive charges by abstracting H+ ions. Consequently, electrostatic repulsion between the positively charged surface and the cationic dye molecules increases, which results in lower adsorption capacity; also, lower adsorption refers to the fact that H+ competes with cationic dyes for the active adsorption sites on the adsorbent surface. On the contrary, the surface of the adsorbent was negatively charged at high pH, which favors the adsorption of the positively charged dye molecules due to electrostatic attraction forces [40,41]. Figure 4b presents the effect of the contact time of MG adsorption onto HTC and AHTC at 25 °C. It indicates that both HTC and AHTC reached their adsorption equilibrium at 4 h. Figure 4b shows that the curves are single, smooth, and continuous, leading to saturation, suggesting a possible monolayer layer coverage on the adsorbent surface [42]. The maximum adsorption capacity was 88% when the concentration of MG solution was 66 ppm.

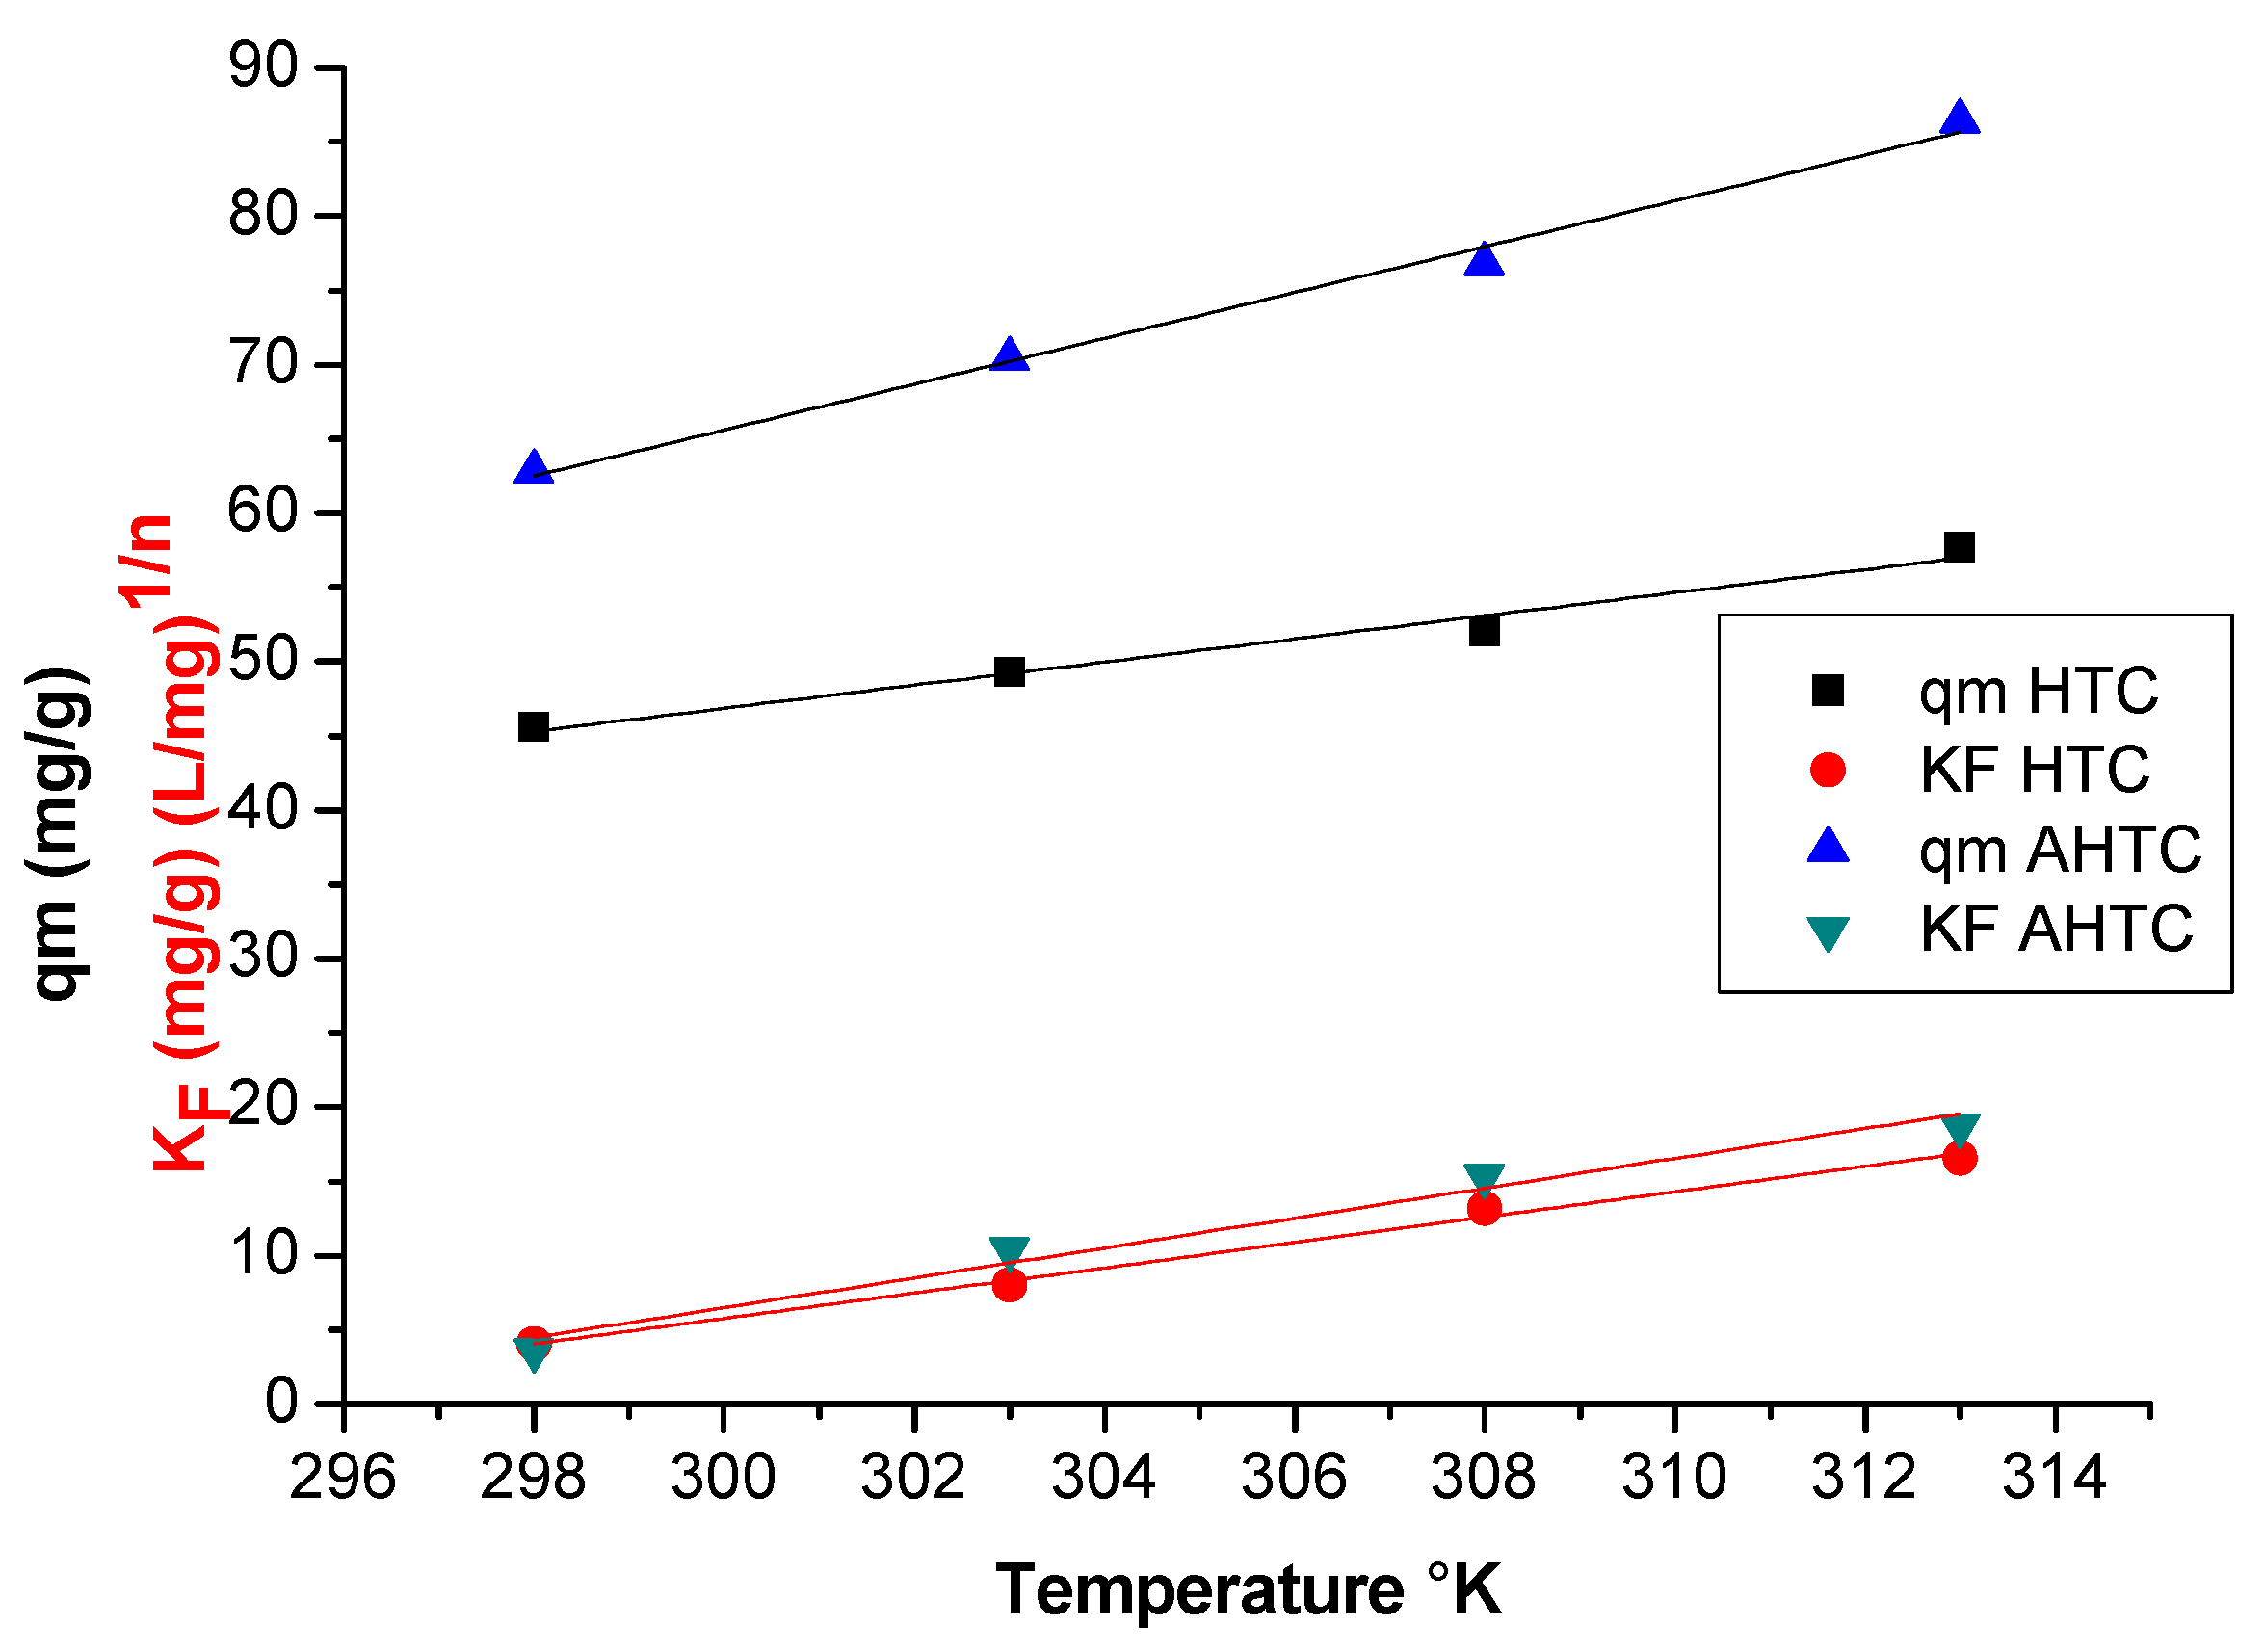
3.5. Isotherm Models Computations

Experimental equilibrium data were fit to the Langmuir, Freundlich, Temkin, and Dubinin–Radushkevich models in order to find the appropriate model that best describes the adsorption process. Sorption data were analyzed according to linear Langmuir Ce/qe (g/L) vs. Ce (mg/L) Figure S4a and linear Freundlich isotherms Ln qe vs. Ln Ce (Supplementary Figure S4b). The non-linear Langmuir and Freundlich isotherms are presented in Figures S5a and S5b, respectively.
In addition, MG adsorption data onto HTC and AHTC were fit to linear Temkin isotherm qe (mg/g) vs. Ln Ce, Figure S4c, and to non-linear Temkin isotherm Figure S5c. Finally, the non-linear Dubinin–Radushkevich isotherm was plotted in Figure S5d.
From the values of SSE (smallest one) and R2 (highest one) of four isotherm models, Table 2A, B (nonlinear) and Table S2A,B (linear). It can be noticed that the Langmuir model represents the best-fitting data for both linear and non-linear expressions. This indicated a monolayer coverage of MG on the outer surface of HTC and AHTC and that the adsorption occurred uniformly on the active adsorption sites. AHTC showed a higher adsorption capacity HTC (65.78 mg/g), which is higher than what was observed for HTC biochar at the same experimental conditions (46.08 mg/g) at 25 °C. The types of equilibrium isotherms are related to the value of RL = 1/[1 + (KLxCo)], where Co (mg/L) is the highest initial MG solution concentration studied [37]. RL values > 1 are referred for unfavorable adsorption, RL equals 1 for linear adsorption, values 0 < RL < 1 for favorable adsorption, and RL = 0 for irreversible adsorption. RL values calculated for Co = 25 ppm were found to be less than 1 and greater than 0, which suggests the favorable adsorption of MG on both HTC and AHTC. In addition, nF values from the Freundlich model were lower than 1. This also indicated strong adsorption between adsorbent and sorbate. The apparent energy E values obtained from D-R isotherm were less than 8 KJ/mol indicating the physical nature of MG adsorption onto HTC and AHTC. AHTC showed lower heat of adsorption and binding energy than HTC, with lower values of B and KT obtained from Temkin isotherm.

3.6. Thermodynamics of Adsorption

The temperature dependency of key parameters qm and KF in the fit Langmuir and Freundlich models is shown in Figure 5. In general, the values of qm and KF increased with an increase in temperature.
The change in Gibbs free energy (ΔG°), enthalpy (ΔH°), and entropy (ΔS°) were calculated from adsorption data at four temperatures (25, 30, 35, and 40° C) using Van’t Hoff equations [25]. The values of entropy change and enthalpy change calculated from the intercept and slope of the plot of ln K and 1/T are shown in Table 3. Where K is the equilibrium partition constant, R is the gas constant (8.314 J/K·mol), and T is the temperature in Kelvin (K). The positive value of ΔH° suggests that the adsorption was an endothermic process, and this result was confirmed by the effect of temperature on the adsorption capacity of both materials. The positive values of ΔS° show the increase in randomness at the solid–solute interface during the adsorption process, and the negative values for ΔG° at most temperatures show the feasibility and the spontaneous nature of the adsorption process. The change in the ΔG° for physical adsorption is between −20 to 0 KJ/mol, while chemical adsorption is from −400 to −80 KJ/mol [9]. The ΔG° tested at different temperatures were in the range of physisorption.

3.7. Kinetics of Adsorption

An ideal adsorbent for wastewater pollution control should have a large sorbate capacity and also reach adsorption equilibrium rapidly. Pseudo-first-order and pseudo-second-order models were tested in this research work.

Kinetics Models Computations

The linear plots of the values of log(qe − qt) versus t (Figure S6a) for pseudo-first-order relationships from which qe and k1 can be predicted from the intercept and the slope, respectively. Where qe and qt (mg/g) are the adsorption capacity at equilibrium and at time t, respectively, k1 (L/min) is the rate constant of pseudo-first-order adsorption. This model is applicable when adsorption is preceded by diffusion through a boundary [43], and the rate of adsorption is proportional to the available sites on the adsorbent surface.
Whereas, if the pseudo-second-order model was applicable [44], then the plot of t/qt versus t (Figure S6b) must be linear and give the values of qe and k2 where k2 is the rate constant of pseudo-second-order adsorption (mg/g/min). Parameters of pseudo-first and pseudo-second-order kinetics are shown in Table 4.
As can be noticed from the results, the correlation coefficients (R2) for the pseudo-first-order plot were less than that of the pseudo-second-order plot (R2 >0.98) [45]. In addition, the fit values of qe in the pseudo-second-order model are closer to the experimental qe values. These results suggested that adsorption follows a pseudo-second-order model.
Intraparticle Diffusion Model: The Weber–Morris intraparticle diffusion model has often been used to determine the rate-determining step [41,46], where a plot of qt versus t1/2 should be linear if the adsorption mechanism involves intraparticle diffusion step, and it must pass through the origin if this step is the sole rate-limiting step [47]. This model also suggests that in instances when qt versus t1/2 is multilinear, then two or more steps govern the adsorption process. Plots of qt versus t1/2 were shown in (Figure S6c) and (Figure S6d). Both HTC and AHTC have the same general features of an initial linear portion with a large steeping slope ki,1 and are followed by a second linear portion with a smaller slope ki,2 [21]. The initial linear portion is attributed to bulk diffusion, and the second linear portion to intraparticle diffusion. This indicates that the transport of MG from solution through the particle solution interfaces into the pores and the adsorption on the available surface of HTC and AHTC particles are responsible for the uptake of MG. The intraparticle diffusion is the rate-controlling step only after a long contact time with rate constants due to the lower slope of the second portion of the plot. The intraparticle diffusion rate constant ki,1 ((mg/g)/min0.5) at 25 °C was equal to 2.064 for HTC and 1.863 for AHTC with intercept (mg/g) 2.261 and 8.575 and R2 0.9529 and 0.9866, respectively. The intraparticle diffusion rate constant ki,2 ((mg/g)/min0.5) at 25 °C was equal to 1.060 for HTC and 0.710 for AHTC with intercept (mg/g) 9.407 and 23.039 and R2 0.9723 and 1.0, respectively.
Thermodynamics of Activation: The values of activation thermodynamic parameters Ea, ΔH, ΔS, and ΔG values for MG adsorption by HTC and AHTC are presented in Table 3. Using the Arrhenius equation, ln k2 versus 1/T was plotted (Figure 6a). Using the Eyring equation, ln k2/T versus 1/T was plotted (Figure 6b). Where k2 is the pseudo-second-order rate constant. The enthalpy was calculated from the slope, and the entropy from the intercept of the straight line. Physisorption has an activation energy between 5 and 40 KJ/mol, while greater values (40–800 KJ/mol) indicate chemisorption. Thus, the obtained low values of Ea suggest the physical mode of adsorption of MG on both HTC and AHTC surfaces [48].

3.8. Comparison of Capacity of Prepared Biochar with Other Adsorbents

The maximum MG adsorption capacity of various adsorbents, including HTC materials, was compared with the prepared biochar in the present work HTC (45.59 mg/g) and AHTC (62.80 mg/g). It is observed that AHTC-PL has better adsorption capacity for MG compared to some other adsorbents, such as modified rice husk (15.49 mg/g) [49], rubberwood sawdust (36.45 mg/g) [50], and laboratory-activated carbons (42.18 mg/g) [51]. While “hydrothermally carbonized phycocyanin-extracted algal bloom residues” HTC-PE-ABR [23] and microalgal biochar [52] showed higher capacities of 89.05 and 166.0 mg/g, respectively. The abundance of pine needles in nature and their simple and cheap method of preparation of biochar elaborates the importance of using these materials for the removal of cationic dyes from water.

3.9. Adsorption in a Fixed Bed Column

The study of sorption kinetics in wastewater treatment is important since it provides valuable insights into the reaction pathways and mechanism of adsorption [29]. In order to examine the mechanism of the adsorption process, a suitable kinetic model is needed to analyze rate data. Three models (Yoon and Nelson, Thomas, and Yan et al.) [8,9,10,11,12,13,14,25,37] were used to analyze the column performance for the removal of MG from an aqueous solution. The Thomas kinetic model assumes that the process follows Langmuir kinetics of adsorption–desorption with no axial dispersion [53]. It describes that the rate driving force obeys second-order reversible reaction kinetics. The linear form of the Thomas model is given in Equation (6).
L n C o C e 1 = K T q T M Q ( k T C o t )
where kT (mL/mg·min) is the Thomas rate constant, qT (mg/g) is the equilibrium adsorbate uptake, Q is the flow rate (mL/min), Co is the initial dye concentration, Ce is the dye concentration in the effluent and m (g) is the mass of the adsorbent in the column. Experimental data were fit to the Thomas model. The rate constant kt and the maximum capacity of sorption qT values were calculated from the slope and intercepts of linear plots of ln[(Co/Ce) − 1] against t (min). The Yoon and Nelson Kinetic Model investigates the breakthrough behavior of adsorbate onto the adsorbent surface [54]. The linear Yoon and Nelson model is expressed in Equation (7):
ln C e C o C e = K Y N t τ K Y N
where kYN (min−1) is the rate constant, and τ is the time required for 50% adsorbate breakthrough. The linear plot of ln[Ce/(CoCe)] against time (t), values of kYN, and τ were obtained from the intercept and slope of the plot, respectively. The empirical equation proposed by Yan et al. [55] was found to provide a better description of the breakthrough curves in a fixed column. The linearized Yan et al. equation is expressed in Equation (8):
L n C e C o C e = K y C o Q ln Q 2 K y q y m + ( K y C o Q ) l n t
where ky is the kinetic rate constant for Yan Model (mL·min−1·mg−1), and qy is the maximum adsorption capacity (mg·g−1) of the adsorbent.
The area under the breakthrough curve gives the total adsorbed mass of MG dye (qtotal) in mg in the column. It can be calculated from the following integration [56]:
q t o t a l = Q 1000 t = o t = t t o t a l C a d s d t = Q A 1000
where t is the time (min), and Q is the volumetric flow rate (mL/min). The maximum capacity of the column can be calculated: qmax (mg/g) = qtotal/m, where m is the sorbent mass (g). The column uptake capacity qmax for the first cycle was calculated to be 15.468 mg/g using the area under the breakthrough curve method Equation (9). Figure 7a shows the breakthrough curve obtained for MG adsorption on AHTC for three column cycles. Column studies showed lower removal capacity than that obtained by batch adsorption due to shorter contact time between the adsorbate and adsorbent. Figure 7b shows the uptake efficiency (% removed) of the three cycles where the decrease in efficiency was not valuable. AHTC can be used repeatedly without significant loss of sorption capacity upon regeneration with 0.1 M HCl (100 mL), showing its feasibility for commercial application, Figure 7c.
The experimental column adsorption results were fit to the Yan et al. model, linear Yoon–Nelson Figure 7d, nonlinear Yoon–Nelson model Figure S7c, linear Thomas model Figure S7a, and nonlinear Thomas model Figure S7b.
The Thomas and Yoon–Nelson models showed higher fitting than Yan’s model with R2 > 0.98. Thus, the highest sorbent capacity given by the Thomas model was qT 33.60 and 33.57 mg/g for linear and nonlinear models, and the rate constants kT were 0.606 and 0.330 (mL·mg−1·min−1). The highest breakthrough time for 50% removal estimated by the Yoon–Nelson model (linear and nonlinear) was averaged at 48.2 min, while the rate constant KYN was 0.059 (min−1). The capacity qY and rate constant kY for Yan et al. (linear model) were 6.083 (mg·g−1) and 45.844 (mL·mg−1·min−1).

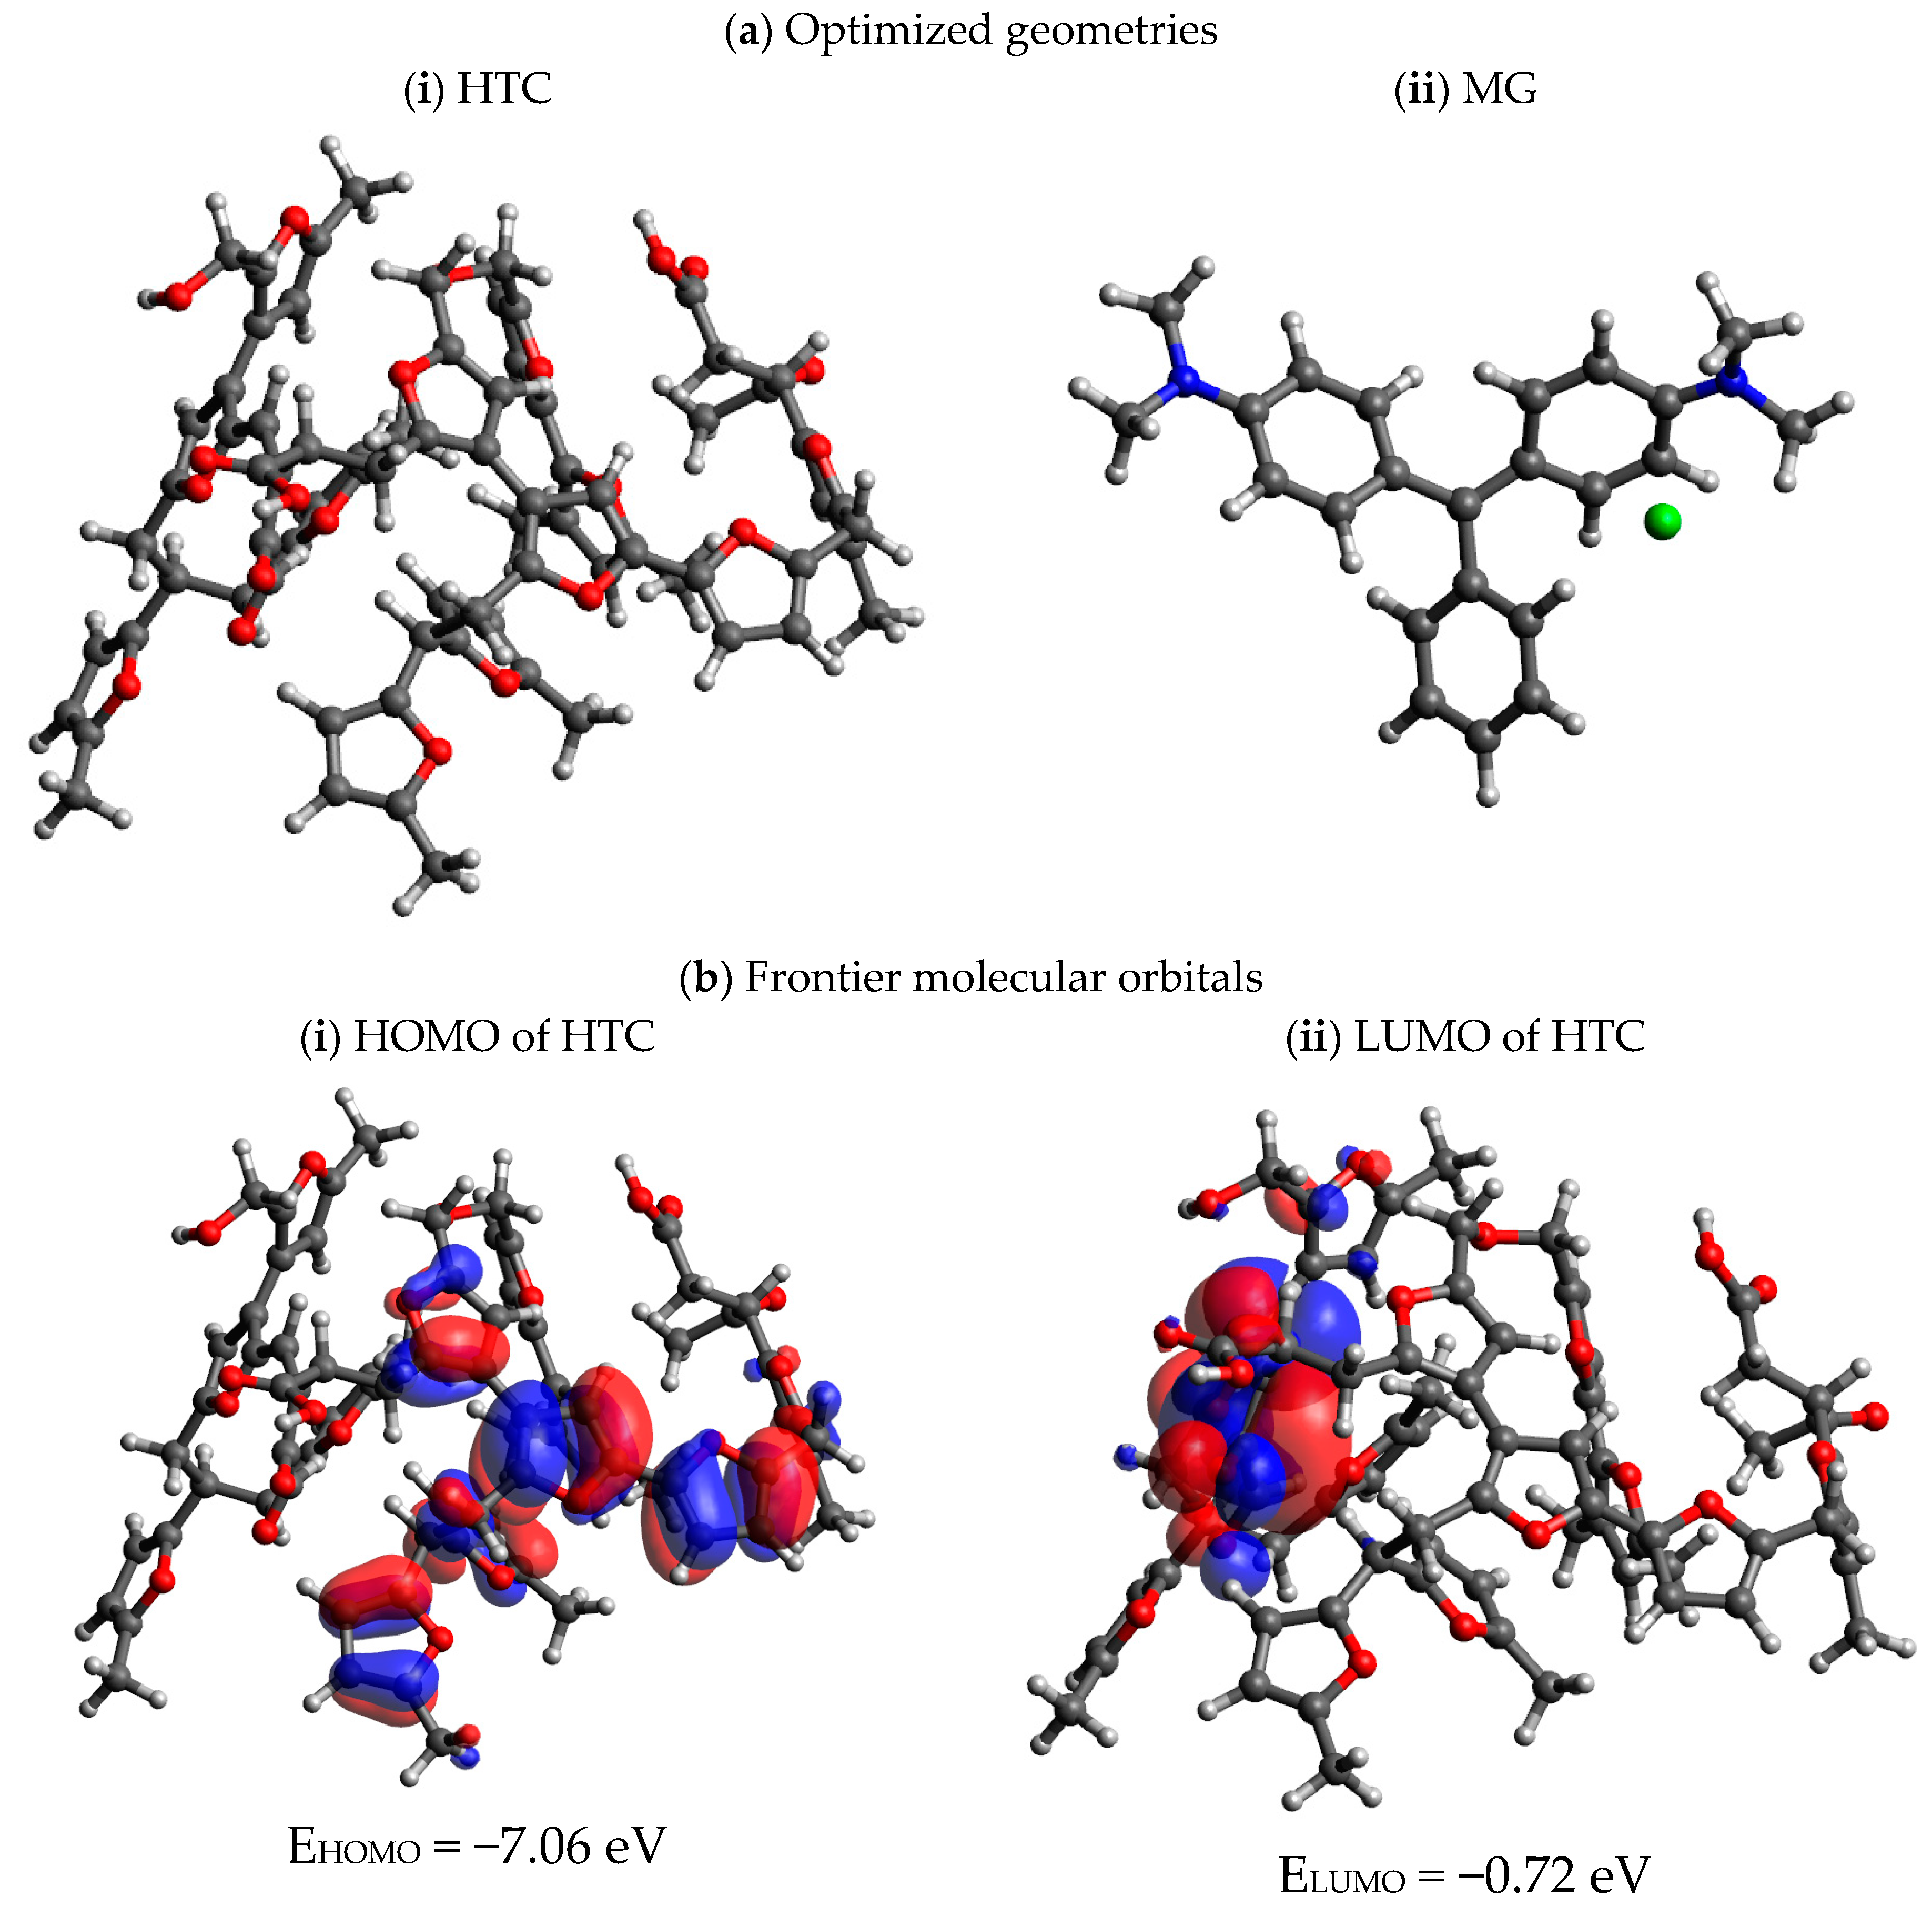
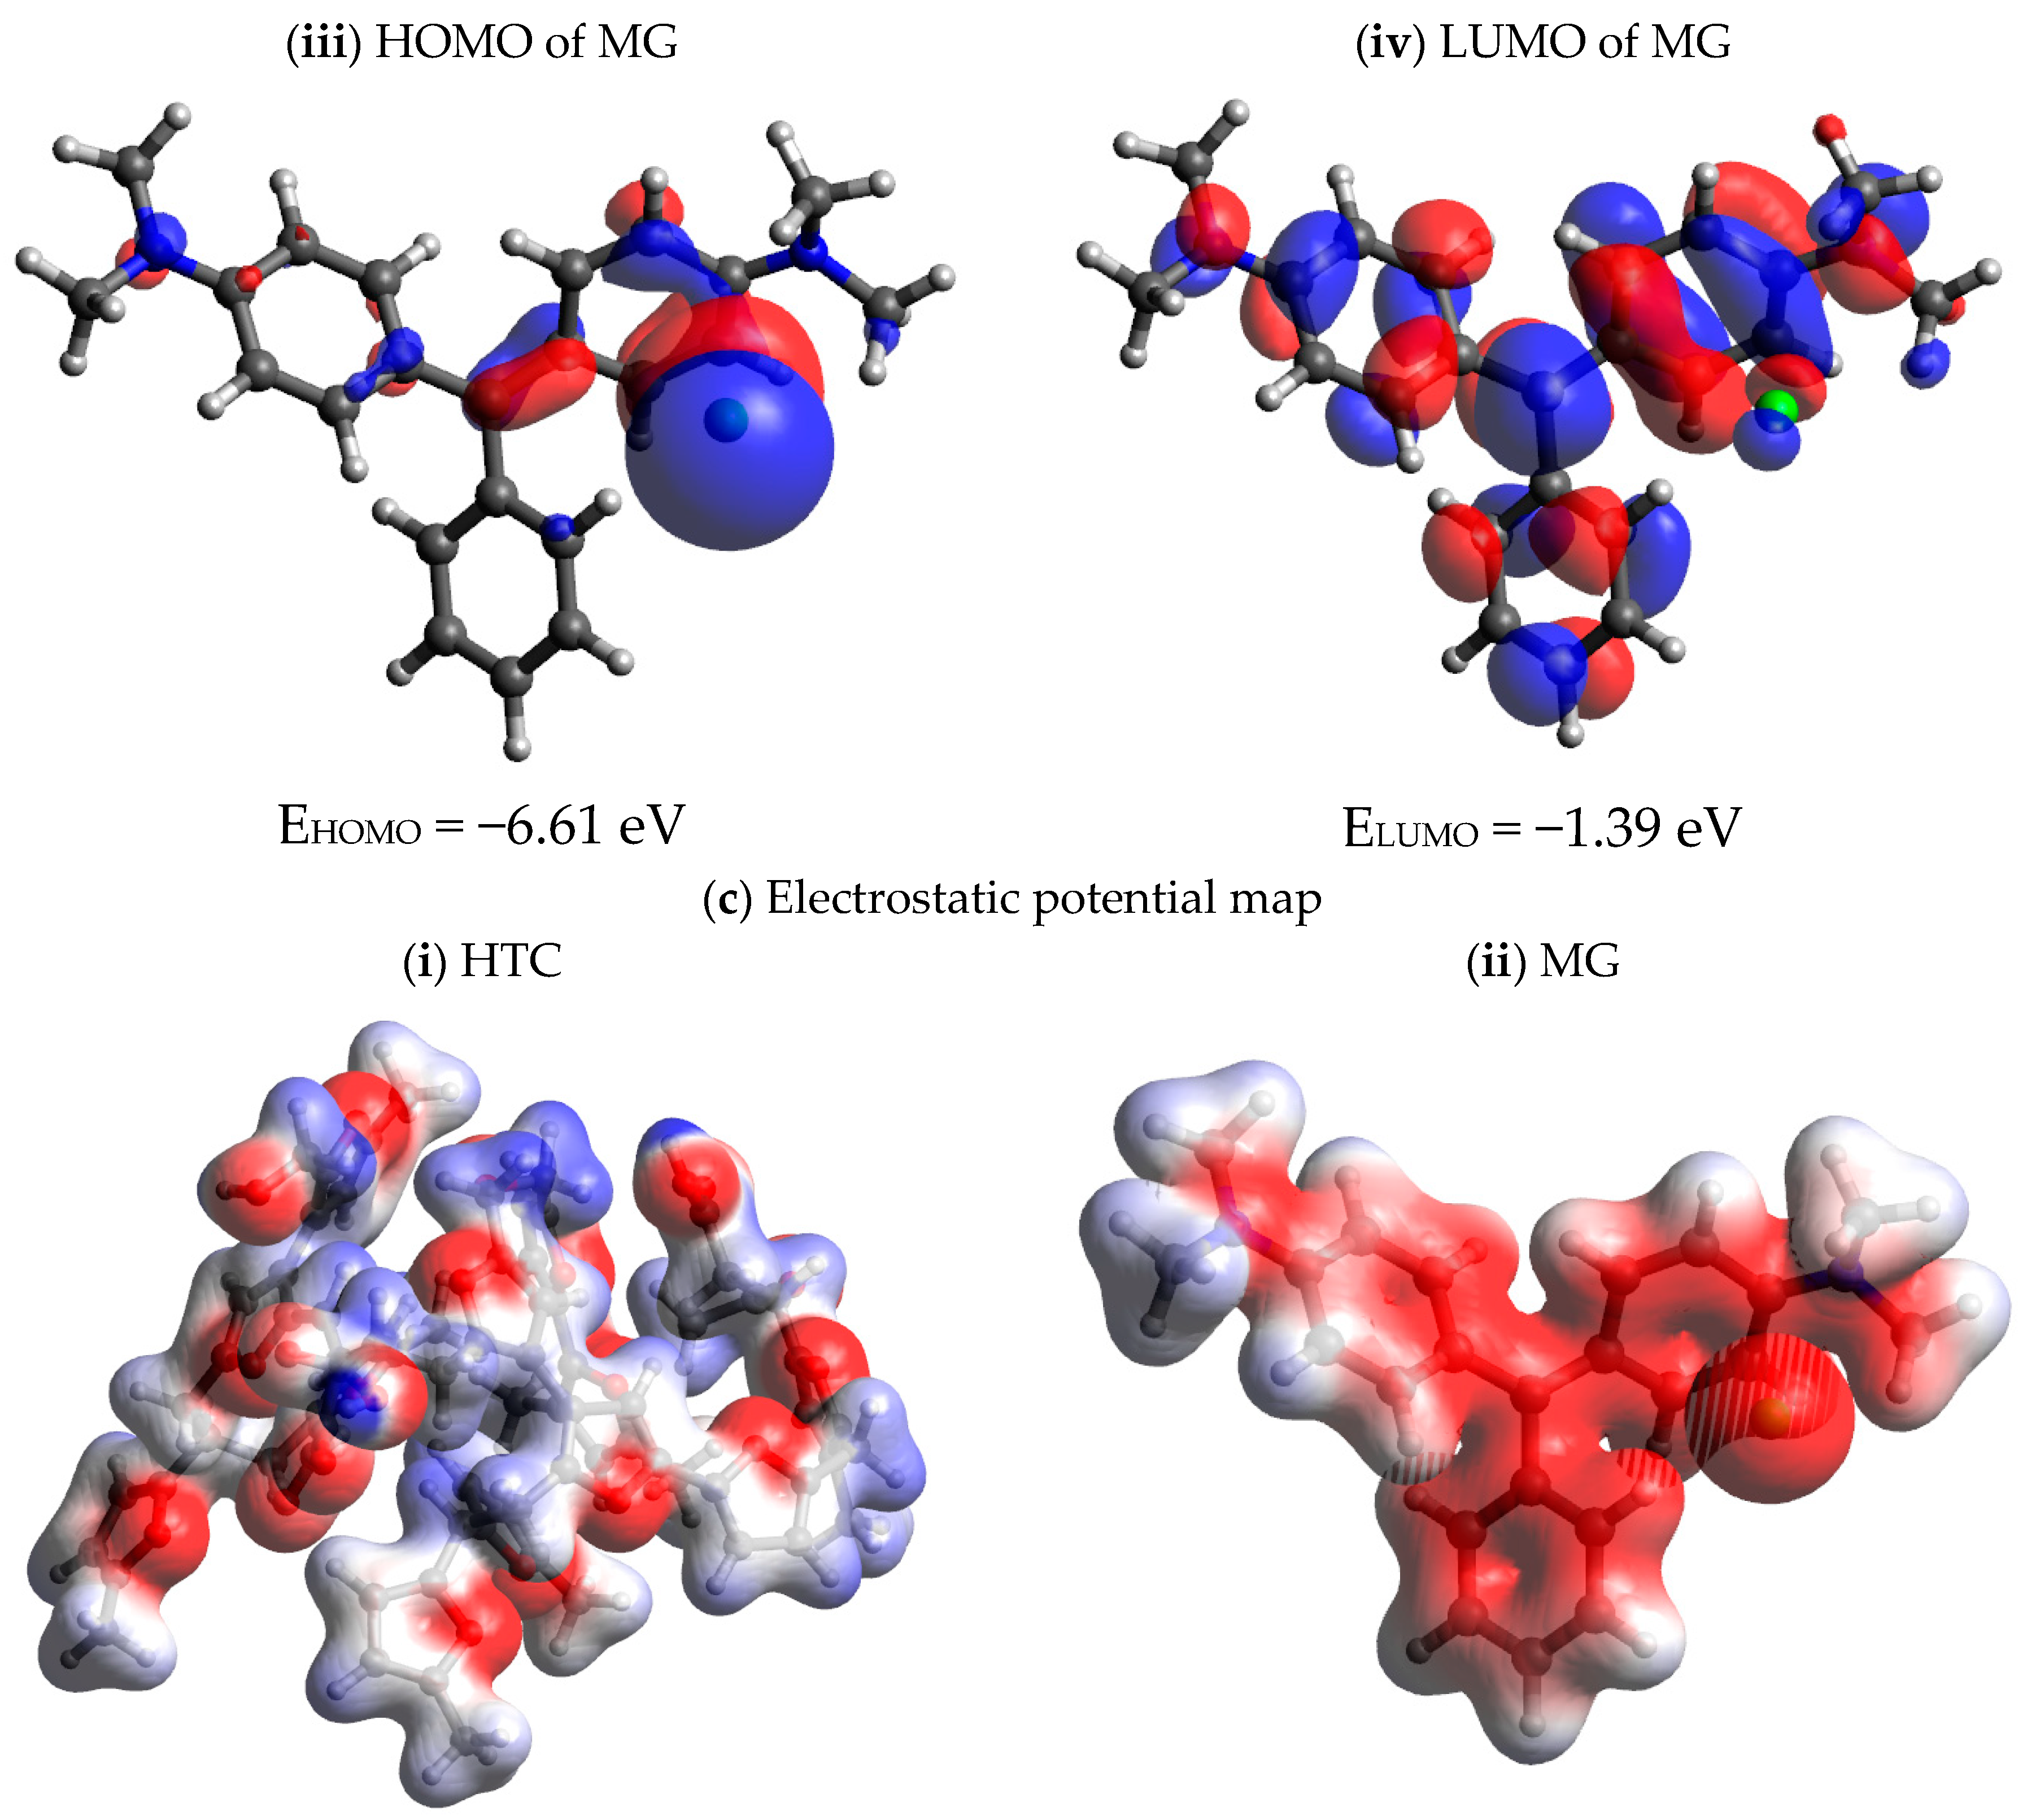
3.10. Computational Methods and Investigations

The interaction between hydrochar adsorbent and malachite green adsorbant has been explored by DFT computation in order to support the adsorption isotherms and kinetics results. Density functional theory (DFT) [57] calculations were performed using Gaussian 16 (revision C.01) [58], and Gaussview [59] was used to generate input geometries and visualize output structures. Regarding geometry optimizations and frequency calculations for HTC and MG, ωB97XD [60] was functionally implemented in the Gaussian program and was used with the 6–311(d, p) basis set. All stationary points were characterized as minima, and thermal corrections were computed from unscaled frequencies, assuming a standard state of 298.15 K and 1 atm. To account for the presence of non-covalent interactions, reduced density gradient (RDG) analysis [61] was performed using the Multiwfn program [62] and visualized by visual molecular dynamics (VMD) [63].
The computational investigation is instrumental in determining the theoretical parameters which are directly associated with envisaging the reactivity behavior of organic molecules, and these parameters have been extensively studied to illustrate the interactions between the surface of adsorbents and dyes [64,65,66,67]
These reactivity descriptors include EHOMO, ELUMO, ionization potential (I), and electron affinity (A). Both I and A can directly be calculated using the EHOMO and ELUMO as described in Equations (26) and (27) [68].
I = −EHOMO
A = −ELUMO
The values of ionization potential (I) and electron affinity (A) are used to calculate other fundamental reactivity parameters, including chemical hardness (η), electronic chemical potential (μ), and electrophilicity index (ω) as reported in the literature [66,69,70].
These parameters provide useful insight to analyze the dye/surface interaction through understanding the reactivity behavior of soft and hard acid–base theory. The concept of chemical hardness (η) is a direct indicator of reactivity, and in general, the molecules with low chemical hardness are more reactive [71]. The electronic chemical potential (μ) highlights the potential of a compound to exchange electronic density with other chemical species. The higher the value of chemical potential, the higher the ability of a molecule to act as a strong electron acceptor [63]. In addition, the electrophilicity index (ω) is a measure of energy lowering due to maximal electronic flow between donor and acceptor. The tendency of a molecule to accept the loading of electrons is explained by this reactivity descriptor [63]. The computed values for these chemical reactivity parameters for the adsorbent (HTC) and the dye (MG) are presented in Table 5. These values provide theoretical data which will be exploited further when compared with the adsorbent behavior of HTC for other dyes.
The optimized geometries of HTC and MG are presented in Figure 8a. Frontier molecular orbital analyses for HTC and MG are provided in Figure 8b, which reveal that the HOMO of HTC is uniformly and predominantly located on the adjacent furan rings. The energy gap for HTC is 6.34 eV. In the case of MG, the energy gap between HOMO and LUMO is 5.22 eV, while the position of HOMO is on the chloride ion and adjacent aromatic ring. In addition, and as expected, ESP maps for HTC and MG illustrate the presence of active sites, which play a pivotal role in the strong interaction between both, Figure 8c. For HTC, the most electron-rich sites are located on oxygen atoms present in the molecule, while in the case of MG, it is uniformly spread over the electrons containing aromatic rings.
Next, we investigated the interaction between HTC and MG Figure 9. The optimized geometry for the adsorption of MG over HTC was calculated and shown by a favorable interaction. The adsorption free energy was calculated to be exergonic at 6.7 kcal/mol at 298.15 K. The electronic adsorption energy was highly negative at 27.7 kcal/mol Figure 9a. These results indicate the possible favorable interaction of MG over HTC. The nature of the interaction was further confirmed by computing the non-covalent interaction (NCI) through the reduced density gradient (RDG) analysis Figure 9b. The results of NCI show a great CH-π interaction between the aromatic rings of MG and the methylene groups on the HTC.

4. Conclusions

This project used a readily available, abundant waste biomass (palm leaves), hydrothermally treating it to form HTC adsorbent and chemically activating it into useful adsorbent AHTC in a cheap and simple way. HTC preparation setup and energetic properties of hydrothermal carbonized palm leaves were investigated. The HHV of hydrochar resulting from carbonization was 24.81 MJ/kg. It increased when the temperature of the reaction increased. This study shows that the hydrochars prepared at 208 °C, HTC and AHTC, are efficient adsorbents of MG from an aqueous solution. H2O2 improved the MG removal ability of HTC. The obtained capacity of AHTC was 65.78 mg/g. The sorption kinetics obeyed the pseudo-second-order model. Langmuir isotherm had the best fit to equilibrium data for MG adsorption, indicating a monolayer coverage mode. RL values show that the sorption process is favorable. The free energy change of adsorption ΔG° indicated that the adsorption process is spontaneous. We also proved the successful application of a column packed with AHTC palm leaves for continuous removal of pollutants with no noticeable deterioration of adsorbent, which was also regenerated and reused in three cycles. The Thomas column adsorption capacity was found to be equal to 16.48 mg/g. Thus, the prepared adsorbent can find application in industry.
The structural and electronic aspects of HTC and MG were further elaborated by performing computational studies related to frontier molecular orbital and electrostatic potential map analyses. The interaction between HTC and MG was also computed, and the value of electronic adsorption energy confirms the possible favorable interaction of MG over HTC. Furthermore, the nature of the interaction was iso determined by computing non-covalent interaction (NCI) via the reduced density gradient (RDG) analysis.

Supplementary Materials

The following are available online at https://www.mdpi.com/article/10.3390/su15118939/s1, Figure S1: (a) Evolution of reaction pressures psi inside the HTC reactor for hydrothermal carbonization of Palm leaves with temperature Tmax 186–225 °C. (b) Image of wet biocoal HTC PL-208 of Palm leaves; Figure S2: (a) Alteration of mass recovery as coal with the preparation temperature of HTC palm leave biochars. (b) Relationship between High heating Values HHV and carbon content of the solids; Figure S3: TG-DTA thermogravimetric analysis curves of AHTC-PL-208; Figure S4: (a) Linear Langmuir, (b) Linear Freundlich (c) Linear Temkin plot; for MG adsorption on HTC-PL-208 and AHTC-PL-208; Figure S5: Non-linear MG adsorption isotherm plot qe (mg/L) vs. Ce (mg/L) for HTC (black) and AHTC (red) (a) Langmuir isotherm; (b) Freundlich isotherm; (c) Temkin isotherm and (d) Dubinin–Radushkevich isotherm at 25 °C; Figure S6: Kinetics for MG adsorption onto 0.1 gm HTC or AHTC (initial MG solution concentration 100 ppm and volume 50 mL) at 25 °C. (a) Pseudo-first-order kinetic; (b) Pseudo-second-order kinetic; and intraparticle diffusion kinetics (c) HTC and (d) AHTC; Figure S7: (a) Linear Thomas and (b) nonlinear Thomas model plot. (c) nonlinear Yoon–Nelson model plot for MG (100 ppm) adsorption onto AHTC (0.5 gm) packed in a 1 cm diameter column, the flow rate is 2 mL/min). Table S1: Data and results of HTC synthesis of PL-208 sample. Table S2: Linear parameters, errors, and correlation coefficients: (A) Langmuir and Freundlich isotherm. (B) Temkin isotherm for the adsorption of MG by HTC and AHTC; Table S3: The energies for the hydrothermal carbon (HTC), malachite green (MG), and HTC-MG [values are in Hartree] calculated at the ωB97XD/6-311(d, p); Table S4: The Cartesian coordinates for the hydrothermal carbon (HTC), malachite green (MG) and HTC-MG, computed at the ωB97XD/6-311(d, p).

Author Contributions

H.H.H. and N.S.S. conceptualized, designed, supervised, and acquired the funding for the project. H.H.H., N.S.S. and A.A.H. methodology. H.H.H. supervision of adsorption and Hydrothermal studies conducted by M.H.H. and Y.B.F. Computational Investigation conducted by A.A.H., M.H.S.A.H. and N.S.S. H.H.H., N.S.S. and A.A.H. analyzed the results and were involved in writing the manuscript. N.S.S. and H.H.H. edited to generate the final version of the manuscript agreed by all the authors M.H.H., Y.B.F., M.H.S.A.H., N.S.S., H.H.H. and A.A.H. All authors have read and agreed to the published version of the manuscript.

Funding

This work was supported by the Deanship of Scientific Research, vice Presidency for Graduate Studies and Scientific Research, King Faisal University Saudi Arabia [Grant No. 3276].

Institutional Review Board Statement

Not applicable.

Informed Consent Statement

Not applicable.

Data Availability Statement

Not applicable.

Acknowledgments

This work was supported by the Deanship of Scientific Research, vice Presidency for Graduate Studies and Scientific Research, King Faisal University Saudi Arabia [Grant No. 3276]. Both M.H.S.A.H. and N.S.S. thank the Universiti Brunei Darussalam for the FIC research grant (UBD/RSCH/1.4/FICBF(b)/2022/049).

Conflicts of Interest

The authors declare no conflict of interest.

References

  1. Jahan, N.; Tahmid, M.; Shoronika, A.Z.; Fariha, A.; Roy, H.; Pervez, M.N.; Cai, Y.; Naddeo, V.; Islam, M.S. A Comprehensive Review on the Sustainable Treatment of Textile Wastewater: Zero Liquid Discharge and Resource Recovery Perspectives. Sustainability 2022, 14, 15398. [Google Scholar] [CrossRef]
  2. Kesari, K.K.; Soni, R.; Jamal, Q.M.S.; Tripathi, P.; Lal, J.A.; Jha, N.K.; Siddiqui, M.H.; Kumar, P.; Tripathi, V.; Ruokolainen, J. Wastewater Treatment and Reuse: A Review of its Applications and Health Implications. Water Air Soil Pollut. 2021, 232, 208. [Google Scholar] [CrossRef]
  3. Li, S.; Wang, C.; Liu, Y.; Liu, Y.; Cai, M.; Zhao, W.; Duan, X. S-scheme MIL-101(Fe) octahedrons modified Bi2WO6 microspheres for photocatalytic decontamination of Cr(VI) and tetracycline hydrochloride: Synergistic insights, reaction pathways, and toxicity analysis. Chem. Eng. J. 2023, 455, 140943. [Google Scholar] [CrossRef]
  4. Cai, M.; Liu, Y.; Wang, C.; Lin, W.; Li, S. Novel Cd0.5Zn0.5S/Bi2MoO6 S-scheme heterojunction for boosting the photodegradation of antibiotic enrofloxacin: Degradation pathway, mechanism and toxicity assessment. Sep. Purif. Technol. 2023, 304, 122401. [Google Scholar] [CrossRef]
  5. Srivastava, S.; Sinha, R.; Roy, D. Toxological effects of malachite green. Aquat. Toxicol. 2004, 66, 319–329. [Google Scholar] [CrossRef]
  6. Santos, S.C.R.; Baoventure, R.A.R. Adsorption modelling of textile dyes by sepiolite. Appl. Clay Sci. 2008, 42, 137–145. [Google Scholar] [CrossRef]
  7. Hammud, H.H.; Fayoumi, L.; Holail, H.; Mostafa, E.-S.M.E. Biosorption Studies of Methylene Blue by Mediterranean Algae Carolina and Its Chemically Modified Forms. Linear and Nonlinear Models’ Prediction Based on Statistical Error Calculation. Int. J. Chem. 2011, 3, 147–163. [Google Scholar] [CrossRef]
  8. Alfrhan, M.A.; Hammud, H.H.; Al-Omair, M.A.; El-Sonbati, M.A. Uptake of crystal violet from water by modified Khalas dates residues. Desalination Water Treat. 2020, 174, 361–375. [Google Scholar] [CrossRef]
  9. Hammud, H.H.; Shmait, A.; Hourani, N. Removal of Malachite Green from water using hydrothermally carbonized pine needles. RSC Adv. 2014, 5, 7909–7920. [Google Scholar] [CrossRef]
  10. Hammud, H.H.; El Hamaoui, B.; Noubani, N.H.; Feng, X.; Wu, Z.-S.; Mullen, K.; Ayub, K. Carbon-Cobalt Nanostructures as an Efficient Adsorbent of Malachite Green. Nanosci. Nanotechnol.-Asia 2018, 8, 263–280. [Google Scholar] [CrossRef]
  11. Alotaibi, N.; Hammud, H.H.; Karnati, R.K.; Hussain, S.G.; Mazher, J.; Prakasam, T. Cobalt–carbon/silica nanocomposites prepared by pyrolysis of a cobalt 2,2’-bipyridine terephthalate complex for remediation of cationic dyes. RSC Adv. 2020, 10, 17660–17672. [Google Scholar] [CrossRef] [PubMed]
  12. Alotaibi, N.; Hammud, H.H.; Al Otaibi, N.; Hussain, S.G.; Prakasam, T. Novel Cobalt-Carbon@Silica Adsorbent. Sci. Rep. 2020, 10, 18652. [Google Scholar] [CrossRef] [PubMed]
  13. Hammud, H.H.; Karnati, R.K.; Alotaibi, N.; Hussain, S.G.; Prakasam, T. Cobalt–carbon silica nanoparticles for uptake of cationic and anionic dye from polluted water. Molecules 2021, 26, 7489. [Google Scholar] [CrossRef] [PubMed]
  14. Alramadhan, S.A.; Hammud, H.H. Graphene Nickel Silica Supported Nanocomposites, Application in Water Treatment. Appl. Nanosci. 2020, 11, 273–291. [Google Scholar] [CrossRef]
  15. Jia, C.; Xu, Z.; Luo, D.; Xiang, H.; Zhu, M. Flexible Ceramic Fibers: Recent Development in Preparation and Application. Adv. Fiber Mater. 2022, 4, 573–603. [Google Scholar] [CrossRef] [PubMed]
  16. Wang, C.; Liu, K.; Wang, D.; Wang, G.; Chu, P.K.; Meng, Z.; Wang, X. Hierarchical CuO–ZnO/SiO2 Fibrous Membranes for Efficient Removal of Congo Red and 4-Nitrophenol from Water. Adv. Fiber Mater. 2022, 4, 1069–1080. [Google Scholar] [CrossRef]
  17. He, J.; Mo, P.; Luo, Y.-S.; Yang, P.-H. Strategies for Solving the Issue of Malachite Green Residues in Aquatic Products: A Review. Aquac. Res. 2023, 2023, 1–17. [Google Scholar] [CrossRef]
  18. Chen, Z.; Lin, B.; Huang, Y.; Liu, Y.; Wu, Y.; Qu, R.; Tang, C. Pyrolysis temperature affects the physiochemi-cal characteristics of lanthanum-modified biochar derived from orange peels: Insights into the mechanisms of tetracycline adsorption by spectroscopic analysis and theoretical calculations. Sci. Total Environ. 2023, 862, 160860. [Google Scholar] [CrossRef]
  19. Zhao, M.; Li, S.; Wang, M.; Guan, X.; Zhao, R. Adsorption of water and formic acid molecules on the (104) surface of calcite: A theoretical study by DFT-D3. New J. Chem. 2023, 47, 8737–8743. [Google Scholar] [CrossRef]
  20. Liu, Z.; Zhang, F.-S.; Wu, J. Characterization and application of chars produced from pinewood pyrolysis and hydrothermal treatment. Fuel 2010, 89, 510–514. [Google Scholar] [CrossRef]
  21. Liu, Z.; Zhang, F.-S. Removal of lead from water using biochars prepared from hydrothermal liquefaction of biomass. J. Hazard. Mater. 2009, 167, 933–939. [Google Scholar] [CrossRef]
  22. Regmi, P.; Moscoso, J.L.G.; Kumar, S.; Cao, X.; Mao, J.; Schafran, G. Removal of copper and cadmium from aqueous solution using switchgrass biochar produced via hydrothermal carbonization process. J. Environ. Manag. 2012, 109, 61–69. [Google Scholar] [CrossRef]
  23. Zhangab, H.; Zhangd, F.; Huang, Q. Highly effective removal of malachite green from aqueous solution by hydrochar derived from phycocyanin-extracted algal bloom residues through hydrothermal carbonization. RSC Adv. 2017, 7, 5790–5799. [Google Scholar] [CrossRef]
  24. Xue, Y.; Gao, B.; Yao, Y.; Inyang, M.; Zhang, M.; Zimmerman, A.R.; Ro, K.S. Hydrogen peroxide modification enhances the ability of biochar (hydrochar) produced from hydrothermal carbonization of peanut hull to remove aqueous heavy metals: Batch and column tests. Chem. Eng. J. 2012, 200–202, 673–680. [Google Scholar] [CrossRef]
  25. Hanbali, M.; Holail, H.; Hammud, H. Remediation of lead by pretreated red algae: Adsorption isotherm, kinetic, column modeling and simulation studies. Green Chem. Lett. Rev. 2014, 7, 342–358. [Google Scholar] [CrossRef]
  26. Cecen, F.; Aktaş, Ö. Activated Carbon for Water and Wastewater Treatment: Integration of Adsorption and Biological Treatment; Wiley-VCH Verlag GmbH & Co. KGaA: Weinheim, Germany, 2012; pp. 1–388. [Google Scholar]
  27. Do, D.D. Adsorption Analysis: Equilibrium and Kinetics, Series on Chemical Engineering (2); Imperial College Press: London, UK, 1998; pp. 1–913. [Google Scholar]
  28. Doğan, M.; Alkan, M.; Onganer, Y. Adsorption of Methylene Blue from Aqueous Solution onto Perlite. Water Air Soil Pollut. 2000, 120, 229–248. [Google Scholar] [CrossRef]
  29. Santhi, T.; Manonmani, S.; Smitha, T. Removal of malachite green from aqueous solution by activated carbon prepared from the epicarp of Ricinus communis by adsorption. J. Hazard. Mater. 2010, 179, 178–186. [Google Scholar] [CrossRef]
  30. Deniz, F.; Karaman, S. Removal of Basic Red 46 dye from aqueous solution by pine tree leaves. Chem. Eng. J. 2011, 170, 67–74. [Google Scholar] [CrossRef]
  31. Wasewar, K.L.; Mohammad, A.; Prasad, B.; Mishra, I.M. Adsorption of Zn using factory tea waste:kinetics equilibrium and thermodynamics. Clean Soil Water Air 2008, 36, 320–329. [Google Scholar] [CrossRef]
  32. Ramnani, S.; Sabharwal, S. Adsorption behavior of Cr(VI) onto radiation crosslinked chitosan and its possible application for the treatment of wastewater containing Cr(VI). React. Funct. Polym. 2006, 66, 902–909. [Google Scholar] [CrossRef]
  33. Nwabanna, J.T.; Igokwe, P.k. Kinetic Modelling of Heavy Metals Adsorption on Fixed Bed column. Int. J. Environ. Res. 2012, 6, 945–952. [Google Scholar]
  34. Marquardt, D.W. An algorithm for least-squares of non-linear parameters. J. Soc. Appl. Ind. Math. 1963, 11, 431–441. [Google Scholar] [CrossRef]
  35. Libra, A.J.; Ro, K.S.; Kammann, C.; Funke, A.; Berge, N.D.; Neubauer, Y.; Titirici, M.-M.; Fühner, C.; Bens, O.; Kern, J.; et al. Hydrothermal carbonization of biomass residuals: A comparative review of the chemistry, processes and applications of wet and dry pyrolysis. Biofuels 2011, 2, 71–106. [Google Scholar] [CrossRef]
  36. McKendry, P. Review paper Energy production from biomass (part 1): Overview of biomass. Bioresour. Technol. 2002, 83, 37–46. [Google Scholar] [CrossRef] [PubMed]
  37. Hammud, H.H.; Karnati, R.K.; Al Shafee, M.; Fawaz, Y.; Holail, H. Activated hydrochar from palm leaves as efficient lead adsorbent. Chem. Eng. Commun. 2019, 208, 197–209. [Google Scholar] [CrossRef]
  38. Demirbaş, A. Relationships between lignin contents and heating values of biomass. Energy Convers. Manag. 2001, 42, 183–188. [Google Scholar] [CrossRef]
  39. Berge, N.D.; Ro, K.S.; Mao, J.; Flora, J.R.V.; Chappell, M.A.; Bae, S. Hydrothermal Carbonization of Municipal Waste Streams. Environ. Sci. Technol. 2011, 45, 5696–5703. [Google Scholar] [CrossRef]
  40. Zhang, D.; Pan, X. Removal of malachite green from water by Firmiana simplex wood fiber. Electron. J. Biotechnol. 2009, 12, 1–10. [Google Scholar] [CrossRef]
  41. Liu, W.; Huang, F.; Liao, Y.; Zhang, J.; Ren, G.; Zhuang, Z.; Zhen, J.; Lin, Z.; Wang, C. Treatment of CrVI-Containing Mg(OH)2 Nanowaste. Angew. Chem. 2008, 47, 5619–5622. [Google Scholar] [CrossRef]
  42. Pimentel, P.M.; Melo, M.A.F.; Melo, D.M.A.; Assucao, A.L.C.; Henrique, D.M.; Silva, C.N., Jr.; Gonzalez, G. Kinetics and thermodynamics of Cu(II)adsorption on oil shale wastes. Fuel Process. Tech. 2008, 89, 62–67. [Google Scholar] [CrossRef]
  43. Revellame, E.D.; Fortela, D.L.; Sharp, W.; Hernandez, R.; Zappi, M.E. Adsorption kinetic modeling using pseudo-first order and pseudo-second order rate laws: A review. Clean. Eng. Technol. 2020, 1, 100032. [Google Scholar] [CrossRef]
  44. Plazinski, W.; Rudzinski, W.; Plazinska, A. Theoretical models of sorption kinetics including a surface reaction mechanism: A review. Adv. Colloid Interface Sci. 2009, 152, 2–13. [Google Scholar] [CrossRef] [PubMed]
  45. Wang, Z.; Hu, L.; Zhao, M.; Dai, L.; Hrynsphan, D.; Tatsiana, S.; Chen, J. Bamboo charcoal fused with polyurethane foam for efficiently removing organic solvents from wastewater: Experimental and simulation. Biochar 2022, 4, 1–16. [Google Scholar] [CrossRef]
  46. Taqvi, S.I.H.; Hasany, S.; Bhanger, M. Sorption Profile of Cd(II) Ions onto Beach Sand from Aqueous Solution. J. Hazard. Mater. 2007, 141, 37–44. [Google Scholar] [CrossRef] [PubMed]
  47. Simonin, J.P.; Boute, J. Intraparticle Diffusion-Adsorption Model to Describe Liquid/Solid Adsorption Kinetics. Rev. Mex. Ing. Quim. 2016, 15, 161–173. [Google Scholar]
  48. Boparai, H.K.; Joseph, M.; O’Caroll, D.M. Kinetics and Thermodynamics of Cadmium Ion Removal by Adsorption onto Nanozero Valent Iron Particles. J. hazard. Mater. 2011, 186, 458–465. [Google Scholar] [CrossRef]
  49. Chowdhury, S.; Mishra, R.; Saha, P.; Kushwaha, P. Adsorption thermodynamics, kinetics and isosteric heat of adsorption of malachite green onto chemically modified rice husk. Desalination 2011, 265, 159–168. [Google Scholar] [CrossRef]
  50. Kumar, K.V.; Sivanesan, S. Isotherms for Malachite Green onto rubber wood (Hevea brasiliensis) sawdust: Comparison of linear and non-linear methods. Dye. Pigment. 2007, 72, 124–129. [Google Scholar] [CrossRef]
  51. Mall, I.D.; Srivastava, V.C.; Agarwal, N.K.; Mishra, I.M. Adsorptive removal of malachite green dye from aqueous solution by bagasse fly ash and activated carbon-kinetic study and equilibrium isotherm analyses. Colloids Surf. A 2005, 264, 17–28. [Google Scholar] [CrossRef]
  52. Pathy, A.; Krishnamoorthy, N.; Chang, S.X.; Paramasivan, B. Malachite green removal using algal biochar and its composites with kombucha SCOBY: An integrated biosorption and phycoremediation approach. Surf. Interfaces 2022, 30, 101880. [Google Scholar] [CrossRef]
  53. Chowdhury, Z.Z.; Zain, S.M.; Khan, R.A.; Rafique, R.F.; Khalid, K. Batch and fixed bed adsorption studies of lead (II) cations from aqueous solutions onto granular activated carbon derived from Mangostana garcinia shell. BioResources 2012, 7, 2895–2915. [Google Scholar]
  54. Yoon, Y.H.; Nelson, J.H. Application of gas adsorption kinetics.Part 1. A theoretical model for respirator catridge service time. Am. Ind. Hyg. Assoc. J. 1984, 45, 509–516. [Google Scholar] [CrossRef] [PubMed]
  55. Sotelo, J.; Rodríguez, A.; Álvarez, S.; García, J. Modeling and Elimination of Atenolol on Granular Activated Carbon in Fixed Bed Column. Int. J. Environ. Res. 2012, 6, 961–968. [Google Scholar] [CrossRef]
  56. Yahaya, N.; Abustan, I.; Latif, M.M.; Bello, O.; Ahmad, M. Fixed-bed Column study for Cr(II) removal from aqueous solutions using rice husk based activated carbon. Int. J. Eng. Technol. 2011, 11, 248–252. [Google Scholar]
  57. Parr, R.G.; Yang, W. Density-Functional Theory of Atoms and Molecules; Oxford University Press: Oxford, UK, 1989. [Google Scholar]
  58. Frisch, M.J.; Trucks, G.W.; Schlegel, H.B.; Scuseria, G.E.; Robb, M.A.; Cheeseman, J.R.; Scalmani, G.; Barone, V.; Peterson, G.A.; Nakatsuji, H.; et al. Gaussian 16, Revision C.01; Gaussian: Wallingford, CT, USA, 2016.
  59. Denningtom, R.; Keith, T.; Millam, J. GaussView, Version 5; Semichem Inc.: Shawnee Mission, KS, USA, 2009.
  60. Chai, J.-D.; Head-Gordon, M. Long-range corrected hybrid density functionals with damped atom–atom dispersion corrections. Phys. Chem. Chem. Phys. 2008, 10, 6615. [Google Scholar] [CrossRef]
  61. Johnson, E.R.; Keinan, S.; Mori-Sánchez, P.; Contreras-García, J.; Cohen, A.J.; Yang, W. Revealing Noncovalent Interactions. J. Am. Chem. Soc. 2010, 132, 6498–6506. [Google Scholar] [CrossRef]
  62. Lu, T.; Chen, F. Multiwfn: A multifunctional wavefunction analyzer. J. Comput. Chem. 2012, 33, 580–592. [Google Scholar] [CrossRef]
  63. Humphrey, W.; Dalke, A.; Schulten, K. VMD: Visual molecular dynamics. J. Mol. Graph. 1996, 14, 33–38. [Google Scholar] [CrossRef]
  64. Olusegun, S.; Rodrigues, G.; Freitas, E.; Lara, L.; Rocha, W.; Mohallem, N. Sequestrating anionic and cationic dyes from wastewater using spray dried biopolymeric magnetic composite: Experimental and theoretical studies. J. Hazard. Mater. 2019, 380, 120872. [Google Scholar] [CrossRef]
  65. El Haouti, R.; Ouachtak, H.; El Guerdaoui, A.; Amedlous, A.; Amaterz, E.; Haounati, R.; Addi, A.A.; Akbal, F.; El Alem, N.; Taha, M.L. Cationic dyes adsorption by Na-Montmorillonite Nano Clay: Experimental study combined with a theoretical investigation using DFT-based descriptors and molecular dynamics simulations. J. Mol. Liq. 2019, 290, 111139. [Google Scholar] [CrossRef]
  66. Domingo, L.R.; Ríos-Gutiérrez, M.; Pérez, P. Applications of the Conceptual Density Functional Theory Indices to Organic Chemistry Reactivity. Molecules 2016, 21, 748. [Google Scholar] [CrossRef] [PubMed]
  67. Jiang, Z.; Huang, X.; Wu, Q.; Li, M.; Xie, Q.; Liu, Z.; Zou, X. Adsorption of sulfonamides on polyamide microplastics in an aqueous solution: Behavior, structural effects, and its mechanism. Chem. Eng. J. 2023, 454, 140452. [Google Scholar] [CrossRef]
  68. Politzer, P.; Abu-Awwad, F. A comparative analysis of Hartree-Fock and Kohn-Sham orbital energies. Theor. Chem. Acta 1998, 99, 83. [Google Scholar] [CrossRef]
  69. Parr, R.G.; Yang, W. Density functional approach to the frontier-electron theory of chemical reactivity. J. Am. Chem. Soc. 1984, 106, 4049–4050. [Google Scholar] [CrossRef]
  70. Parr, R.G.; Szentpály, L.V.; Liu, S. Electrophilicity Index. J. Am. Chem. Soc. 1999, 121, 1922–1924. [Google Scholar] [CrossRef]
  71. Pearson, R.G. The electronic chemical potential and chemical hardness. J. Mol. Struct. Theochem. 1992, 255, 261–270. [Google Scholar] [CrossRef]
Figure 1. Structures of (a) malachite green (MG) dye and (b) hydrothermal carbon (HTC) used as adsorbent.
Sustainability 15 08939 g001
Figure 2. (a) The variation of the recorded temperature and pressure versus time during the hydrothermal preparation of HTC-PL208. (b) dry biocoal HTC PL-208 of palm leaves. (c) TEM image of AHTC-PL-208.
Sustainability 15 08939 g002
Figure 3. Continuous flow adsorption experiment of MG (100 ppm) using a 1 cm diameter glass column packed with AHTC (0.5 gm). The flow rate was 2 mL/min.
Sustainability 15 08939 g003
Figure 4. (a) Effect of system pH on the adsorption capacity of 100 ppm MG solution (50 mL) onto 0.1 g HTC-PL208 at 25 °C, time = 24 h. (b) Effect of contact time on the removal of MG (100 ppm, 50 mL) onto (0.1 g) of HTC-PL-208 and AHTC-PL-208 at 25 °C.
Sustainability 15 08939 g004
Figure 5. Shows the temperature dependency of key parameters qm and KF in the, respectively, fitted Langmuir and Freundlich models.
Sustainability 15 08939 g005
Figure 6. (a) Arrhenius equation’s plots, (b) Eyring equation’s plots for MG adsorption onto 0.1 gm HTC or AHTC (initial MG solution concentration 100 ppm and volume 50 mL).
Sustainability 15 08939 g006
Figure 7. (a) Breakthrough curves for MG adsorption on AHTC for three cycles, (b) Percentage removal of MG during the first, second, and third cycles. (c) Regeneration of column using 0.1 M HCl solution. (d) Linear Yoon–Nelson model plot; For MG (100 ppm) adsorption onto AHTC (0.5 gm) packed in a 1 cm diameter column, the flow rate is 2 mL/min).
Sustainability 15 08939 g007
Figure 8. Optimized structures (a), frontier molecular orbitals (b) electrostatic potential map (c) for HTC and MG, computed at ωB97XD/6–311(d, p) level of theory. The energies and cartesian coordinates are provided in Tables S3 and S4.
Sustainability 15 08939 g008aSustainability 15 08939 g008b
Figure 9. Optimized structure for the adsorption of MG over HTC (a), and plots of non-covalent interaction (NCI) iso-surfaces (iso-value at 0.7) for HTC-MG (b), computed at ωB97XD/6-311(d, p) level of theory.
Sustainability 15 08939 g009
Table 1. The proximate analyses of biocoal properties of selected biomass materials after the HTC process.
Batch
ID
Tmax (°C)Ash
(%) db
Mass Recovery%Volatile Matter VM
(%) db
Fixed Carbon FC
(%) db
Fixed Carbon Yield yFC
(%) db
Carbon
C (%) db
HHV 1
(MJ/kg) db
ηcoal 2 (%) db
PL-1861863.530.9775.3821.1216.0343.520.9579.6
PL-2012013.230.0874.9221.8816.0545.521.7179.7
PL-2072072.9329.9074.3622.7116.5947.522.1080.8
PL-2122122.529.4873.8523.6517.0150.423.3684.0
PL-225244229.3073.4924.5117.5250.924.8188.7
1 High Heating Value, 2 Energy conversion efficiency, db dry basis.
Table 2. Non-linear parameters, errors, and correlation coefficients: (A) Langmuir and Freundlich isotherm. (B) Temkin and Dubinin–Radushkevich (D-R) isotherm; for the adsorption of MG by HTC and AHTC.
(A)
Sample
T °CNon-Linear Langmuir ModelNon-Linear Freundlich Model
qm (mg/g)RLKL (L/mg)SSEχ2R2KF (mg/g) (L/mg) 1/nnSSEχ2R2
HTC25 °C45.590.5620.02634.276.850.944.062.1757.880511.5750.894
30 °C49.280.3860.04324.068.020.958.012.58208.28541.6570.817
35 °C52.030.2870.06716.599.320.9113.184.0649.24912.3120.888
40 °C57.660.2620.07654.069.010.9516.554.0212.8546.5710.990
AHTC25 °C62.800.5030.03360.0915.020.913.581.65142.57128.5140.870
30 °C70.400.4480.04196.2316.040.9410.412.43119.87619.9790.930
35 °C76.780.3420.04843.857.310.9715.352.9150.9608.1920.946
40 °C86.410.2840.06346.709.340.9618.703.1353.53010.8830.933
(B)
Sample
Non-Linear TemkinNon-Linear D-R
Kt (L/mg)B (J/mol)R2βE (KJ/mol)qm (mg/g)R2
HTC25 °C0.206230.240.9740.00797.37530.950.949
30 °C0.622221.850.9100.00577.38249.120.995
35 °C1.027244.470.9090.00787.39653.130.836
40 °C1.762248.450.9890.00817.20153.950.945
AHTC25 °C0.119118.330.9440.00817.86658.420.830
30 °C0.394142.650.9860.00827.80365.270.976
35 °C0.377145.570.9670.00857.65266.170.9927
40 °C0.792146.740.9580.00847.70082.560.938
Table 3. Thermodynamic parameters of adsorption of 125 ppm MG onto HTC and AHTC; And activation thermodynamic parameter for MG (100 ppm) adsorption on HTC and AHTC.
Thermodynamic ParametersActivation Thermodynamic Parameters
SampleTemperature
°C
ΔH° (KJ/mol)ΔS° (J/K·mol)ΔG° (KJ/mol)ΔH
(KJ/mol)
ΔS
(J/K·mol)
ΔG
(KJ/mol)
Ea
(KJ/mol)
HTC29839.79132.180.4045.06−312.7596.697.55
303−0.25798.25
308−0.91899.82
313−1.579101.38
AHTC29854.24185.28−0.97629.05−238.3098.8731.55
303−1.902100.06
308−2.829101.25
313−3.755102.45
Table 4. Parameters of pseudo-first-order and pseudo-second-order kinetics of MG adsorption on HTC and AHTC (100 ppm initial concentration).
SampleTemperature
°C
qe (mg/g) (Exp.)Pseudo-First-OrderPseudo-Second-Order
qe (mg/g)k1 (min−1)R2qe (mg/g)k2 (g/mg·min)R2
HTC2529.9721.820.00850.9323.700.00210.99
3037.6223.080.00921.0032.050.00220.99
3539.3027.590.00940.8830.580.00240.98
4039.5928.540.00990.8430.300.00250.98
AHTC2534.3921.420.00460.9337.740.00080.99
3041.5521.120.00670.9537.740.00120.99
3543.2324.800.00760.8340.490.00130.99
4046.6731.650.03871.0052.080.00151.00
Table 5. The calculated quantum chemical reactivity parameters of the HTC and MG were calculated at ωB97XD/6–311(d, p) level of theory in the gaseous phase.
Chemical Reactivity ParametersHTCMG
EHOMO (eV)22,127.06022,126.610
ELUMO (eV)22,120.72022,121.390
EHOMO–LUMO (eV)6.3405.220
Ionization Potential (I, eV)7.066.61
Electron Affinity (A, eV)0.721.39
Electronic Chemical Potential (μ, eV)22,123.8922,124.00
Global Hardness (η, eV)3.172.61
Global Softness (S, eV)0.320.38
Global Electrophilicity (ω, eV)23.9820.88
Dipole moment (D)4.0011.96
Disclaimer/Publisher’s Note: The statements, opinions and data contained in all publications are solely those of the individual author(s) and contributor(s) and not of MDPI and/or the editor(s). MDPI and/or the editor(s) disclaim responsibility for any injury to people or property resulting from any ideas, methods, instructions or products referred to in the content.

