Abstract
This study presents the impact of an ultrasonic treatment (UT) as an alternative to traditional, standard pasteurization (PT) on selected properties of ice cream. Additionally, an oleogel from strawberry seed oil was included in the ice cream recipe as a fat component in the shares of 5%, 6%, and 7%. To evaluate the ultrasound’s effect on the ice cream’s properties, an analysis of the ice cream’s chemical composition was conducted, including the total content of polyphenols and macro- and microelements, as well as of its physical properties. Fourier transform infrared (FTIR) spectroscopy was used for a more precise molecular-level analysis of the changes. The ice cream containing the oleogel from strawberry seed oil and subjected to ultrasonic treatment was characterized by a significantly higher dry matter (37.43%) and carbohydrate (56.82 g·(100 g)−1) contents and a significantly lower fat content (9.93 g·(100 g)−1) compared to the ice cream subjected to traditional pasteurization. In addition, the values of freezing point temperature and the amount of frozen water for these ice cream samples were significantly higher. Therefore, this study shows that ultrasonic treatment can be a beneficial alternative to traditional pasteurization in ice cream production.
1. Introduction
The use of alternative technologies for sustainable production has recently gained significant importance in the food industry due to new consumer trends regarding innovative food processing methods that minimize processing, increase quality, improve efficiency and process performance, as well as ensure food safety while extending its shelf life [1].
Ultrasound has emerged as an innovative technology in the food industry because it is relatively cheap, simple, fast, non-toxic, environmentally friendly, and energy-efficient. Ultrasound waves are sound waves with frequencies ranging from 20 kHz to 1 GHz and can be generated by mechanical, thermal, optical, and electromagnetic methods. In the food industry, the application of ultrasound is divided into two categories according to the chosen frequency and amount of energy or sound intensity: high-intensity and low-intensity ultrasound [2,3,4,5]. Low-intensity ultrasound (LIU) has frequencies higher than 100 kHz at intensities below 1 W·cm−2 and delivers a very low power, which is insufficient to induce acoustic cavitation. Therefore, it is used for monitoring, analysis, and quality control of food during processing and storage [6,7,8]. High-intensity ultrasound (HIU) has a frequency ranging from 20 to 100 kHz and an intensity ranging from 10 to 1000 W·cm−2 and causes physical, mechanical, and chemical changes in the structure of food due to acoustic cavitation, which provides high temperature and pressure through the collapsing of microbubbles [1,2,9]. Therefore, HIU affects homogenization, mixing, extraction and recovery of polyphenolic compounds [10], filtration, crystallization [11], dehydration, fermentation, foaming, particle size reduction, viscosity, inactivation of microorganisms and enzymes, pasteurization [12], as well as thawing and freezing processes in the food industry [13,14].
Sustainable development requires the protection of the natural environment and a well-balanced management of the natural resources. The use of ultrasound in food production can contribute to shortening the food processing time, lowering the production costs, as well as to the production of better-quality products. Ultrasound can be used to homogenize ice cream mixes. Ultrasonic homogenization produces a uniform ice cream with few ingredients. Sonication can also improve fat and water emulation, leading to the formation of a stable emulsion, which in turn contributes to reducing the amount of fat used and improving the product quality.
There is a number of diverse studies on the use of ultrasonic treatment in dairy products, particularly involving yoghurt and ice cream. For example, in the study by Nguyen and Anema [15], an ultrasonication treatment of whole milk was found to produce highly functional fat globule/milk protein complexes (acid gels) that differed from those produced by conventional homogenization. It was found that sonication (temperature: 25, 30, 35, 40 °C; time: 2, 4, 6 and 8 min) had positive effects on the properties of milk–soymilk yoghurt such as viscosity, firmness, cohesiveness, and consistency. Ultrasonication has been shown to reduce the viscosity of skim milk concentrates [16]. Erfanian and Rasti [17] discovered that sonication (at the temperatures of 25, 30, 35, and 40 °C for durations of 2, 4, 6, and 8 min) had a positive impact on the properties of milk-soy yoghurts, such as viscosity, firmness, cohesiveness, and consistency. By utilizing high-intensity ultrasound at a lower temperature than that of the conventional treatment, greater homogenization, emulsification, and microorganism inactivation were achieved, leading to a higher-quality yoghurt. Yoghurt made from HIU-treated milk exhibited significantly improved firmness, water-holding capacity, viscosity, and gel strength compared to yoghurt made from conventionally heated and/or homogenized milk [1]. Thermosonication (at 45 °C for 10 min at 24 kHz) of preheated milk with various fat concentrations reduced syneresis in yoghurt. The syneresis rate was between 62% and 40% and between 51% and 38% in yoghurt made from conventionally heated and thermosonicated milk, respectively [18]. In the case of ice cream, ultrasound could be used to reduce the freezing time and ice crystal size by preventing crystallization and ensuring a well-dispersed emulsion [1,19] and to reduce the particle size in vegan ice cream mixes with stabilizers [20]. Thus, it can be concluded that ultrasound, in combination with heating, provides visible benefits over traditional methods, such as obtaining submicron-sized particles or more stable emulsions.
Strawberry seed oil is used in the food industry primarily due to its health and nutritional properties. It is rich in essential unsaturated fatty acids, such as linoleic acid and linolenic acid. It contains vitamin E, which is a powerful antioxidant that helps protect the body against the harmful effects of free radicals and also contains small amounts of vitamin C, which is important for the immune system and collagen production. Strawberry seed oil also contains trace amounts of B vitamins, such as thiamine (B1), riboflavin (B2), and niacin (B3), which are important for the metabolism and energy production. This oil contains various minerals, including magnesium, potassium, iron, and manganese. These minerals are essential for maintaining the electrolyte balance, nerve function, and proper metabolism. In the production of strawberry seed oil, there is potential for waste minimization by utilizing seeds that are usually discarded or overlooked. Using these byproducts as raw materials is a sustainable approach to food production.
The pursuit of different methods to transform liquid oils into solid fats has emerged as a result of the new approach aiming to reduce the intake of saturated fatty acids and trans isomers and improve food nutritional quality. Among these methods is oleogelation, which consists in immobilizing vegetable oils within a three-dimensional network by structuring agents, creating a sticky and elastic consistency that maintains the oils’ chemical composition while producing a solid-like structure. Oleogels can be used in various food products to replace solid fats or reduce saturated fats, for example, in ice cream, meat products, confectionery, chocolate products or in the production of commercial fats. Besides the basic benefits resulting from replacing fats, oleogels can increase the availability of bioactive compounds present in plant oils (essential unsaturated fatty acids, flavonoids, polyphenols, antioxidants, vitamins, and natural pigments). The structure of the obtained oleogel is influenced not only by the type of oil and its physical and chemical properties, but also by the composition, type of structuring substance, and preparation parameters (homogenization, temperature, ultrasonic treatment). The structuring substances are divided into two groups, one including compounds with low molecular weight (LMOGs—having properties promoting an independent crystalline network formation in the resulting oleogel, e.g., fatty acids, wax esters, phytosterols, mono- and diglycerides), and the other comprising compounds with high molecular weight (HMOGs—structural substances such as proteins, polymers, and polysaccharides) [21,22,23,24,25]. Despite the great interest in oleogels, which is shown by the rich literature in this field [24,25,26,27,28,29,30], few studies have focused on the application of oleogels in ice cream. Low-fat ice cream has been developed [31] using an oleogel from tomato seed oil [32]; in addition, the efficiency of oleogels from rice bran wax, candelilla wax, camellia or carnauba wax in ice cream with a fat content has been evaluated [33,34,35], ethyl cellulose has been used for structuring an oil in ice cream made from high-oleic sunflower oil [36], and the composition and parameters of the microfluidization process for creating oleogels for ice cream applications have been analyzed [37].
Therefore, the aim of this study was to analyze the influence of ultrasound applied to ice cream mixes as an alternative to traditional pasteurization on the physicochemical properties of the obtained ice creams. Additionally, strawberry seed oil oleogels were included in the ice cream recipe as a fat component. To evaluate the impact of ultrasound on the properties of ice cream in the presence of oleogels, a chemical composition analysis was conducted, taking into account the total content of polyphenols and macro- and microelements, as well as the physical properties. For a more detailed analysis, particularly in terms of monitoring changes in ice cream at the molecular level, Fourier transform infrared (FTIR) spectroscopy was used. The method used is characterized by non-invasiveness, rapidity of results, effectiveness, and, above all, low cost, which makes it suitable for both evaluating the quality of food materials and studying molecular changes occurring in samples under the influence of processing factors.
2. Materials and Methods
2.1. Analysis of the Oil
The method for quality testing of strawberry oil was based on determining the fatty acids content according to ISO Standard 12966-2:2017 [38]. We determined the composition of fatty acids using a Bruker 436GC chromatograph with an FID detector (BPX 70 capillary column (60 m, 0.25 mm, 25 m) using nitrogen as the carrier gas).
2.2. Obtaining and Analyzing the Oleogel
An oleogel containing 60% of the fat phase and 40% of the water phase (2% HPMC solution—hydroxypropyl methylcellulose) was obtained from cold-pressed strawberry seed oil. A Unidrive X1000D rotary homogenizer (CAT, Zülpich, Germany) operating at a speed of 11,000 rpm was used to achieve an oil-in-water emulsion. The emulsion was then dried for 4 h at 80 °C using a laboratory dryer (Figure 1a). After 4 h, a new rigid structure was obtained (Figure 1b), which was then homogenized (11,000 rpm) to achieve a semi-solid mousse consistency (Figure 1c).
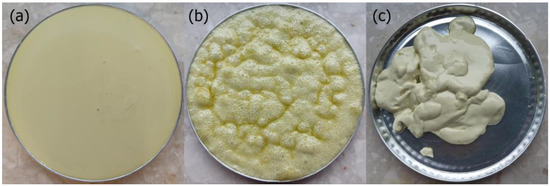
Figure 1.
View of the oleogel and the stages to obtain it: (a) emulsion, (b) emulsion after drying, (c) oleogel after homogenization.
The obtained oleogel was subjected to a stability analysis (SOMW) using a Mikro 220 Classic centrifuge (Hettich, Germany) at 21 °C, at 3000 rpm for 20 min. After removing the liquid phase, the residue (a test tube with the gel) was weighed three times [39,40,41]. The SOMW was calculated according to the modified formula of Żbikowska et al. [39].
2.3. Recipe and Preparation of the Ice Cream
Figure 2 depicts the recipe and stages of creating an ice cream based on the strawberry seed oleogel.
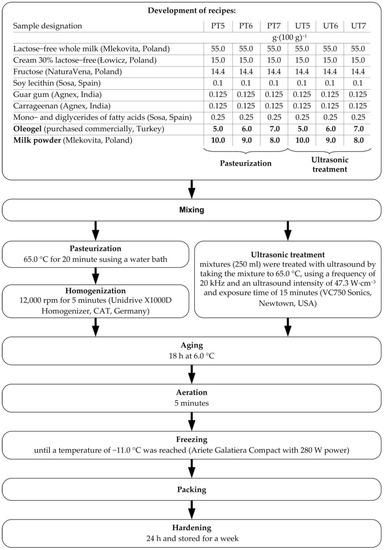
Figure 2.
The recipe and stages of creating an ice cream based on the strawberry seed oleogel.
The prepared ice cream mixes were subjected to two types of treatment: (1) pasteurization and (2) ultrasonic treatment. To conduct physicochemical analyses, the ice cream was freeze-dried.
2.4. Ice Cream Charactrerization
2.4.1. Analysis of the Chemical Composition
According to the AOAC standard [42], the content of dry matter, protein, fat, and ash was determined. The caloric value was calculated using Atwater equivalents [43]. The pH value was measured according to the methodology of Nazarewicz et al. [32].
2.4.2. Determination of the Content of Mineral Compounds
The analysis of mineral compounds was conducted using a Varian model AA 240 FS (Mulgrave, Australia) atomic absorption spectrophotometer equipped with a D2 lamp background correction system. The measured results were compared with a multielemental standard for GF AAS (CertiPUR®, Merck, Darmstadt, Germany). The samples were prepared according to the methodology of Kunová et al. [44]. The sample extracts were analyzed for K, Na, Ca, Mg, P, Fe, Mn, Zn, Cu, Co, and Cr using a fast sequential atomic absorption spectrophotometer (Varian model AA 240 FS) at specific wavelengths: K—766.5 nm, Na—589.6 nm, Ca—393.4 nm, Mg—279.6 nm, P—177.5 nm, Fe—241.8 nm, Mn—279.5 nm, Zn—213.9 nm, Cu—324.8 nm, Co—240.7 nm, Cr—357.9 nm [44].
2.4.3. Free-Radical Scavenging Activity
Each sample (0.2 g) was extracted with 20 mL of 80% ethanol for 2 h. After centrifugation at 3000× g (Himac CT 6E, Hitachi Ltd., Tokyo, Japan) for 20 min, the supernatant was analyzed. The free-radical scavenging activity of the samples was measured using the 2,2-difenyl-1-picrylhydrazyl (DPPH) assay according to the procedures described by Yen and Chen [45]. The extracts (0.1 mL) were reacted with 4 mL of DPPH solution (0.025 g DPPH in 100 mL ethanol). The absorbance of the samples was determined using the spectrophotometer Cary 60 UV–vis, Agilent Technologies, Santa Clara, CA, USA at 515 nm. The free-radical-scavenging activity of the samples was expressed as mg Trolox equivalent antioxidant capacity per g sample (mg TEAC·(100 g)−1).
2.4.4. Total Phenolic Content
The total phenolic content (TCP) of samples was measured spectrophotometrically, using the modified Folin–Ciocalteu method as described by Singleton and Rossi [46]. Each sample extract (0.8 mL) was mixed with 0.8 mL of the Folin–Ciocalteau reagent and 4 mL of 20% sodium carbonate and centrifuged at 11,000× g (Eppendorf MiniSpin, Nijmegen, The Netherlands) for 10 min. The absorbance at 700 nm using the spectrophotometer Cary 60 UV–vis, Agilent Technologies, USA was determined. The total phenolic content was expressed as mg gallic acid equivalent per g of sample (mg GAE·(100 g)−1).
2.4.5. Physical Properties of the Ice Cream
The thermal properties of the ice cream mixes (after the aging step) were measured by a differential scanning calorimeter (DSC) by Mettler Toledo (model DSC1). Approximately 10 mg of the ice cream mix sample was placed in a pre-weighed aluminum sample pan, which was then sealed with a pan crimper. Thermal data were recorded in a nitrogen atmosphere, ranging from −40 °C to +20 °C, with a heating rate of 2 °C per minute. An empty pan was used as the reference. The flow rates of the nitrogen gas for cooling and heating were set at 250 and 50 cm3·min−1, respectively [47,48]. The amount of frozen water was calculated according to the formula provided in the article by Nazarewicz et al. [32].
The overrun was determined based on the weight difference between the ice cream mixture and the ice cream itself in relation to the weight of the ice cream [49].
The determination of the ice cream melting resistance involved measuring the total time of melting for a sample (28 g) in the shape of a cylinder, which was left at room temperature (21 °C) until completely melted [50].
The hardness analysis was conducted according to the modification methodology by Nazarewicz et al. [32] using the LFRA texture analyzer (Brookfield Engineering Laboratories, Inc., Middleboro, MA, USA) [51].
The viscosity of the examined ice cream was determined using a viscometer from IKA (ROTAVISC lo-vi Complete) on melted samples. The viscosity measurement was performed using an SP-4 spindle, which was immersed into a pre-prepared sample at a temperature of 20 °C and a shear rate of 200 rpm. The viscosity value was read after 2 min.
2.4.6. Measurements Using Fourier Transform Infrared Spectroscopy (FTIR)
Measurements using Fourier transform infrared (FTIR) spectroscopy were selected for the analysis of the ice cream samples and were conducted using an IRSprit spectrometer produced by Shimatzu (Kyoto, Japan). Attenuated Total Reflection (ATR) was used as the ZnSe crystal attachment for the measurements, which has the appropriate geometry (45°) to enable the most optimal measurement conditions. Specifically, it ensures multiple internal reflections of the laser beam during the experiment. For all selected ice cream samples, 24 scans were performed. In the next stage, the program automatically averaged the obtained spectra. The attachment was thoroughly cleaned with ultrapure solvents purchased from Sigma-Aldrich after each experiment. The spectra were recorded in the spectral range of 450–3800 cm−1, and the instrument resolution was set to 2 cm−1. The final stage, which involved the analysis and preparation of the spectra for publication, was performed using Grams/AI 8.0 software by ThermoGalactic Industries (Waltham, MA, USA) and Origin Pro 2021 by OriginLab Corporation (Northampton, MA, USA).
2.4.7. Microstructure
The structural analysis was conducted using scanning electron microscopy (SEM) (Carl Zeiss Ultra Plus, Oberkochen, Germany). Prior to examination, the samples were coated with a 20 nm layer of gold using an Emitech SC7620 Sputter Coater. The surface of the samples was imaged at 3 kV using a secondary electron detector [52].
2.5. Statistical Analysis
The obtained results were statistically analyzed using StatSoft Polska STATISTICA 13.1 software. Tukey’s test was employed to assess the significance of the differences among the means of the measured parameters. The calculations were performed with a significance level set at a p-value < 0.05.
3. Results and Discussion
3.1. Properties of the Oleogels
The strawberry seed oil was characterized by a high content of unsaturated fatty acids (Table 1), with the main fatty acids being linoleic acid (n-6) C18:2—47.37%, oleic acid (n-9) C18:1—24.11%, and linolenic acid (n-3) C18:3—17.64%. The content of saturated fatty acids was determined at the level of 89.53%, with palmitic acid (C16:0) (4.88%) being the main saturated fatty acid. The obtained results confirmed previous studies, where the presence of palmitic acid (4.32–6.20%), oleic acid (15.51%, 15.58%, 16.3%), linoleic acid (42.54%, 45.45%, 44.8%), and linolenic acid (29.05%, 33.48%, 31.5%) was found in strawberry seed oil [53,54,55]. Usually, unsaturated fatty acids account for 60–80% of all fatty acids, and the ratio between them ranges from 1:1 to 2:1, indicating that the oil may be a dietary supplement to improve the consumption of n-3 fatty acids [56]. Strawberry seed oil also contains γ-tocopherol (71.77 mg·kg−1), δ-tocopherol (14.57 mg·kg−1), carotenoids (12.21 μg of β-carotene/g sample), β-sitosterol (2987.7 mg·kg−1), and phenolic compounds (salicylic acid—132.88 mg·kg−1, caffeic acid—111.67 mg·kg−1, p-coumaric acid—95.69 mg·kg−1) [54]. Strawberry seed oil is a natural active ingredient characterized by good oxidative stability and high biological activity [53].

Table 1.
Fatty acid content in strawberry seed oil.
The stability index of the oleogel made from strawberry seed oil was 85.27%, indicating high stability of the structure, with 14.73% of the oil being present in the liquid phase. Similar stability values were obtained for the oleogel made from tomato seed oil (88.54%) [32] and carnauba wax (99.9%) [33].
3.2. Chemical Properties of the Ice Cream
Table 2 shows the chemical composition, calorie value, polyphenolic compound content, and antioxidant activity of the ice cream made from lactose-free milk. The ice cream had high dry matter content (36.59–37.43 g·(100 g)−1), protein content (12.16–13.91 g·(100 g)−1), fat content (9.93–12.75 g·(100 g)−1), dietary fiber content (12.92–20.48 g·(100 g)−1), and carbohydrate content (48.60–56.82 g·(100 g)−1). The caloric value of the ice cream ranged from 386 kcal·(100 g)−1 to 404 kcal·(100 g)−1. As the quantity of the strawberry seed oil-derived oleogel increased, the protein content decreased, and the fat content increased. Ultrasonic treatment resulted in ice cream with a significantly lower fat and dietary fiber content and a higher carbohydrate content compared to traditional pasteurization. Nazarewicz et al. [32] obtained similar results for ice cream containing a tomato seed oil-derived oleogel, also subjected to ultrasonic treatment. Güven and Karaca [50] achieved a high dry matter (34.40–42.06%) and fat (11.46–12.00%) content in ice cream by combining different oils (hazelnut and olive oil), obtaining physicochemical properties comparable or better than those of ice cream prepared with milk fat. Bermúdez-Aguirre et al. [57] assessed the impact of ultrasound on milk protein content and reported that termosonicated raw whole milk (400 W, 24 kHz, 36 to 120 μm amplitude, 63 °C) resulted in a decrease in protein content from 3.28 to 3.02%, depending on the intensity of the treatment. Villamiel and de Jong [58] evaluated the effect of continuous-flow high-intensity ultrasound processing (with and without heat) on whey proteins and caseins and reported that ultrasound caused the denaturation of the two whey proteins α-lactalbumin and β-lactoglobulin. This denaturation was higher in whole milk subjected to ultrasound combined with heat due to the modification of the tertiary and quaternary structures of casein, without altering the micelles.
Table 2.
The chemical composition [g·(100 g)−1], antioxidant activity [mg TEAC·(100 g)−1], and caloric value [kcal·(100 g)−1] of the tested ice creams with the addition of oleogels.
The total content of phenolic compounds in the ice creams ranged from 0.78 mg GAE·(100 g)−1 to 1.28 mg GAE·(100 g)−1 (Table 2). As the proportion of oleogel increased in the ice creams, the total polyphenol content decreased. Ultrasonic treatment did not significantly affect the change in total polyphenol content. The highest total polyphenol content (1.28 mg GAE·(100 g)−1) was observed in the ice cream sample with 6% oleogel and subjected to ultrasonic treatment. High levels of polyphenols were also found in ice creams containing sesame seed oil (45.62 mg GAE·(100 g)−1), pomegranate seed oil (46.37 mg GAE·(100 g)−1), grape seed oil (67.13 mg GAE·(100 g)−1) [59], grape pomace flour (197.41 mg GAE·(100 g)−1) [60], and American blueberry concentrate (101.15 μg GAE·(100 mg)−1) [61]. The DPPH method used to determine the antioxidant activity of the ice creams is based on the ability to scavenge free radicals. The results showed that the antioxidant activity of the ice creams ranged from 1.24 to 1.42 mg TEAC·(100 g)−1 and increased with an increasing oleogel content when traditional pasteurization of the ice cream mixture was applied. However, in the case of ultrasonic treatment of the ice cream mixture, the opposite trend was observed, where the antioxidant activity of the ice creams decreased from 2.00 to 0.94 mg TEAC·(100 g)−1. The antioxidant activity of strawberry seed oil is due to the presence of salicylic acid (132.88 mg·kg−1), caffeic acid (111.67 mg·kg−1), p-coumaric acid (95.69 mg·kg−1), and quercetin (26.42 mg·kg−1) [54]. Akca and Akpinar [59] stated that increasing the acidity of the fruit can increase the DPPH radical-scavenging activity; so, acidity of probiotic ice creams causes an increase in the DPPH radical scavenging of the ice cream.
Increasing the share of oleogel significantly and statistically decreased the ash content in the ice cream, both in that subjected to traditional pasteurization and in that subjected to ultrasound treatment. The highest ash content was obtained for ice cream with a 5.0% oleogel share. The ash content in food is related to the total content of mineral components [62]. High levels of K, Na, Mg, P, and Fe were found in the ice cream (Table 3), with K and Ca being the main elements. Increasing the share of oleogel in the ice cream decreased their content (confirming the dependencies obtained for the ash content). An opposite relationship was observed for Ca, since increasing the share of oleogel led to an increase in its content in the ice cream (in the range from 4262.00 to 5057.70 mg∙kg−1). However, ultrasound treatment contributed to a decrease in Ca content in the ice cream in the range from 3632.80 to 3974 mg∙kg−1 of dry matter. In probiotic ice cream with cornelian cherry peel, a significantly lower content of Ca (2481.2 mg∙kg−1), Mg (478.2 mg∙kg−1), P (1018.8 mg∙kg−1), K (3013.1 mg∙kg−1), and Na (670.3 mg∙kg−1) was obtained [63]. Kotan [64] in his studies observed that the addition of blueberries significantly increased the levels of some important minerals in ice cream, such as K, Fe, Mn, and Zn, which are of vital importance for the human body.
Table 3.
The content of macro- and microelements in the ice cream [mg·kg−1 of dry matter].
3.3. Physical Properties of the Ice Cream
Table 4 presents the thermophysical properties of the ice cream containing the oleogel obtained from strawberry seed oil. The freezing point temperature (cryoscopic) of ice cream is one of the main physical characteristics that determine the freezing process. It depends not only on the amount of dissolved compounds, but also on their molecular weight, especially on the type and concentration of the sweetening substance. The value of the freezing point temperature affects the crystallization process of water and the amount of freezable water in ice cream [65]. The freezing point temperature of the tested ice cream ranged from −4.50 to −5.32 °C. Low freezing point temperature values of ice cream are due to the presence of fructose, which lowers the freezing point temperature more than disaccharides such as sucrose, maltose, or lactose. The varying proportion of oleogel and ultrasonic treatment did not significantly affect the freezing point temperature value of the ice cream. The ice cream with 5% oleogel obtained from strawberry seed oil subjected to pasteurization had the lowest amount of freezable water (39.02%), while the ice cream with 7% oleogel obtained from strawberry seed oil subjected to ultrasonic treatment had the highest amount of freezable water (42.51%). Furthermore, the higher the freezing point temperature, the greater the amount of freezable water in the ice cream. The values of the melting heat of the ice cream increased with the percentage of oleogel in the ice cream for both pasteurized and ultrasonically treated samples. The obtained DSC curves of ice cream mixtures were typical for systems with a high water content, such as typical ice cream mixtures. In the conducted research, the water content in the ice cream ranged from 62.57 to 63.41%. The thermophysical properties of ice cream are generally dependent on the dry matter content, mainly in terms of the content of dissolved solid substances (proteins, fats). Moreover, the enthalpy of fusion ice increases with the increase in water content in products [66]. Similar relationships were obtained for vegan ice cream (using soy and coconut milk), where the type of milk had no significant effect on the thermophysical properties of the ice cream. The freezing point temperature of the ice cream ranged from −4.53 to −5.53 °C, the amount of freezable water from 31.68 to 39.61%, and the difference in enthalpy from 106.57 to 132.29 J·g−1 [48]. The obtained relationships confirmed earlier studies conducted by the authors [32], where the freezing point temperature values of ice cream containing oleogels with tomato seed oil and subjected to ultrasonic treatment were in the range from −4.70 to −5.23 °C, and the amount of freezable water was in the range from 34.70 to 42.19%.
Table 4.
Thermal and physical properties of the tested ice cream.
Warren and Hartel [67] found that the degree of overrun has a significant impact on the melting rate of ice cream, as air is an excellent insulator and prevents heat from penetrating the ice cream during the melting process. The overrun of ice cream exhibited an increase as the percentage of oleogel in the ice cream subjected to traditional pasteurization increased. In the case of ice cream subjected to ultrasonic treatment, the opposite relationship was observed. The higher the percentage of oleogel, the lower the degree of overrun in the ice cream. The lowest overrun was observed for ice cream with a 7% oleogel content subjected to ultrasonic treatment (26.01%), while the highest was observed for ice cream with a 7% oleogel content subjected to traditional pasteurization (45.64%). In a study by Jing et al. [34], it was shown that the overrun of ice cream containing an oleogel (33.02%) was higher than that of ice cream containing camellia oil (13.83%). Statistically significant differences were observed during the analysis of the complete melting time. Ice cream with a 5% oleogel content subjected to ultrasonic treatment melted the slowest (33.25 min). In earlier studies, the authors also found that ice cream with 7% oleogel obtained from tomato seed oil and subjected to pasteurization melted the slowest, with a complete melting time of 31 min. Ice cream subjected to ultrasonic treatment exhibited significantly higher hardness (17.71–25.70 N) compared to ice cream subjected to pasteurization (2.04–9.98 N), which was also related to the lower degree of overrun in these samples [32].
Apparent viscosity is a physical property that is particularly important in the design of industrial installations. In the study, such a measurement was adopted to determine the effect of the variable oleogel content in the ice cream, as well as the effect of the two types of processing used (traditional pasteurization and ultrasound treatment). The measurements were conducted for melted ice cream at a specific temperature. For the tested samples, a significant increase in the apparent viscosity of the ice cream (from 332.63 to 395.67 mPa·s) was found with an increasing oleogel content in the case of traditional pasteurization. However, in the case of ice cream subjected to ultrasound treatment, an inverse relationship was observed, with a significant decrease in the apparent viscosity occurring as the oleogel content increased, in the range from 518.63 to 273.63 mPa·s. A study by Bermúdez-Aguirre et al. [55] on ice cream subjected to ultrasound treatment showed a shorter processing time without significant changes in pH, along with better appearance and consistency when compared to ice cream subjected to conventional thermal treatment.
3.4. FTIR Spectroscopy
In order to conduct a detailed analysis of the obtained ice cream samples, Fourier transform infrared (FTIR) spectroscopy was used. Figure 3 presents all spectra in the spectral range of 3600–550 cm−1. Table 5 provides a comprehensive review of the literature data, assigning the vibrations of the most significant functional groups to their corresponding bands.
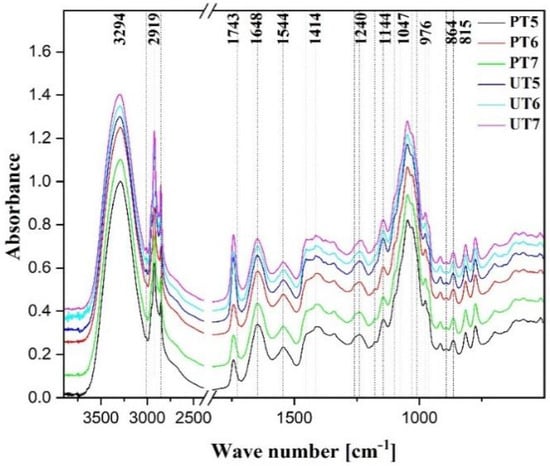
Figure 3.
Normalized FTIR infrared spectra at 3294 cm−1 of ice cream samples treated with ultrasonic (U) and traditional pasteurization (P). The spectra are presented in the spectral range from 3600 to 550 cm−1.
Moving on to the characterization of individual spectral bands, the first very broad spectral region with a characteristic maximum at 3294 cm−1 corresponds to the stretching vibrations characteristic of hydroxyl groups, both free and hydrogen-bonded [68,69]. In the tested ice cream samples, these vibrations mainly originated from the –OH groups in the fat molecules and carbohydrate structures and were enhanced by the vibrations of water molecules. The aforementioned region underlies the characteristic stretching vibrations of C–H, alkyl, and aromatic groups, which are particularly abundant in ice cream samples rich in fats and carbohydrates. These vibrations derive from hydrocarbon molecules [70,71,72,73,74], symmetrical and asymmetrical –CH2 and –CH3 groups. The characteristic broad band of the hydroxyl groups was also influenced by the formation of hydrogen bonds in the samples, whose vibrations are quite strong. In selected oleogels, they derive from dimers of carboxylic acids [68]. In turn, the deformation vibrations of the hydroxyl groups occur with a maximum at 1648 cm−1. This band is influenced by the vibrations of the same structures, as mentioned above [72]. It should be noted that in the tested ice cream samples, this band might be slightly enhanced by the asymmetrical vibrations characteristic of the ν (COO−) group [73]. This band is additionally significantly amplified by the characteristic vibrations of the Amide I structure, which derive from the protein components present in the samples. In turn, a very interesting and reliable band with a maximum at ~1743 cm−1 is due to the stretching vibrations of the functional group ketone C=O of fructose [68]. The samples selected for the analysis had a fairly large amount of this component [68,73], and the intensity of this band noticeably changed depending on the two pasteurization methods used for the ice cream mixtures (traditional or ultrasonic), suggesting that it is a very good spectroscopic marker of the applied techniques. This band was particularly slightly underpinned for ice cream subjected to traditional pasteurization, from the side of lower wavenumbers at ~1725 cm−1. The structure of this underpinning disappeared in samples treated with ultrasound, in favor of an increase in the intensity of this band, which was most likely associated with the possibility of hydrogen bonding between the carbonyl group and the hydroxyl group of the other aforementioned components. This indicates most likely a higher aggregation, in terms of packing and arrangement of molecules in the samples, after the application of traditional pasteurization. This is also an interesting result and is most likely related to the specificity of the given product.
Table 5.
The positions of the absorption band maxima in the FTIR spectra were determined, and the corresponding vibrations were assigned for the selected samples: PT5, PT6, and PT7 and UT5, UT6, and UT7 [69,71,75].
Table 5.
The positions of the absorption band maxima in the FTIR spectra were determined, and the corresponding vibrations were assigned for the selected samples: PT5, PT6, and PT7 and UT5, UT6, and UT7 [69,71,75].
| FTIR | Type and Origin of Vibrations |
|---|---|
| Positioning of Band [cm−1] | |
| 3294 | νst(O–H) and –OH in H2O |
| 2952 | νs+as (C–H) in CH2 and CH3 groups, both in carbohydrates and in fatty acids |
| 2920 | |
| 2870 | |
| 2850 | |
| 1743 | ν (C=O) and ν (C=O)···OH |
| 1725 | |
| 1649/1644 | δvw (–OH) and νvw (–C=C–) and Amide I |
| 1544 | νvw (–C=C–) and Amide II |
| 1452 | δ (–O–CH) and δ (–C–C–H) |
| 1415 | δst (O–H) in C–OH group + δ (C–H) |
| 1376 | δ (–OH) in C–OH group and ν (–C–H, –CH3) and deformation |
| 1342 | |
| 1238 | νm (–C–O) or δm (–CH2–) ν (C–H) in carbohydrates and Amide III |
| 1198/1144 | ν (C–H) in carbohydrates and ν (C–O) in C–O–C group and νst (C–C) in the carbohydrate structure |
| 1097 | |
| 1048 | |
| 1030 | |
| 976 | νst (C–C) in the carbohydrate structure, δ (C–H) |
| 963 | |
| 916 | |
| 892 | ν (C–C) in the carbohydrate structure, δ (C–H) |
| 864 | |
| 815 | |
| 776 | |
| 698 |
ν—stretching vibrations, δ—deformation vibrations, s—symmetric, as—asymmetric, st—strong.
Moving on to the characterization of the so-called fingerprint region (e.g., below 1550 cm−1), many characteristic vibrations for this type of ice cream could be observed. The applied methods of pasteurization, both with ultrasound and traditional, had a significant impact mainly on the intensity of bands in the aforementioned range. The very characteristic vibrations in this region originate from structures such as C–O, C–C, C=C, and C–H and also include the bending vibrations of C–H present in the chemical structure of carbohydrates [68,70,71,72,73]. However, they are also very characteristic of vibrations from the fat fraction in these types of samples, which constitutes a significant percentage of their composition. The characteristic, intense bands in this region are vibrations with maximums at ~1544 cm−1, 1455 cm−1, 1414 cm−1, 1340 cm−1, and 1240 cm−1. They mainly belong to the deformative vibrations of groups such as O–CH and C–C–H in the carbohydrate structure (Table 5). The band with a maximum at 1544 cm−1 corresponds also to vibrations of the Amide II structure, which is also characteristic of protein components. Vibrations with a maximum of ~1414 cm−1 also originate from symmetric vibrations of the ester group COO−. This region is strengthened by the deformative vibrations of the –OH group in the C–OH bond. The band originating from the vibrations of the Amide III structure strengthens the vibrations with a maximum of 1240 cm−1. Another very characteristic spectral region is that containing the vibrations in the range from 1230 cm−1 to ~950 cm−1. A very characteristic vibration with a maximum at ~1047 cm−1 occurred in this range for this type of samples. It originated from stretching vibrations mainly belonging to the C–O groups in the carbohydrate structure. Maximums at ~1144 cm−1 and, above all, at ~1047 cm−1 are vibrations belonging to the C–O groups in the characteristic C–O–C bond (Figure 3). In the case of samples of this type, they are strengthened by vibrations originating from the fat fraction, which enhances the band intensity in this area. These vibrations are also supported by stretching vibrations of the C–O groups in the C–OH and COO− groups, as well as by stretching vibrations of the C–C groups in the carbohydrate structure of the components of the tested samples [70,72,73]. It is also worth examining the region below 960 cm−1. The mainly characteristic vibrations occurring here are for the anomeric region of carbohydrates, as well as for the deformation of C–H and C–C [70,71,72]. Monitoring changes in the intensity of the bands in this area would provide information on modifications in the bonds of the carbohydrate fractions in the tested ice cream. In our study, we did not observe significant changes in the aforementioned range, which may indicate no disturbance to the main structure of the ice samples due to the ultrasound treatment. At the same time, it confirmed a better packing of molecules (in terms of sample uniformity) in the obtained ice, as mentioned above.
To summarize the preliminary results obtained using infrared spectroscopy, it should be emphasized that there were clear differences visible in the spectra of the ice cream samples obtained using different pasteurization methods, especially for ultrasound. The observed differences mainly concerned changes in the intensity of the bands. The largest differences were visible in the region of the vibrations of the C–H groups and carbonyl group, as well as in the area of the vibrations of the C–C, C–H, and C–O groups. These changes concerned regions related to fat fractions and carbohydrate components, which confirmed the chemical analysis of the ice cream. After using the ultrasound treatment, the ice cream had a lower fat content but a noticeably higher carbohydrate content compared to ice cream subjected to traditional pasteurization. The spectra also suggested that traditional pasteurization, in the case of these samples, most likely caused a better packing of the molecules of different compounds in the obtained ice cream.
It is worth emphasizing that especially the fingerprint area for both types of samples is very interesting and shows various changes that indicate differences between the samples. For example, we also observed a band with a maximum of about 1375 cm−1. It occurred for samples subjected to traditional pasteurization (PT) but disappeared for samples subjected to ultrasonic pasteurization (UT). According to the literature data, it may belong mainly to fatty structures in the tested samples and may correspond to the characteristic C–H or C–O stretching vibrations. The disappearance of vibrations in this region may also confirm our assumptions about a better packing of molecules in the given samples. This, in turn, certainly translates into differences in consistency between samples obtained by different pasteurization methods.
In addition, clearly, also in this area (fingerprint area), a more intense vibration was noticeable with a maximum at about 1450 cm−1, which basically, is a slope of this band. The aforementioned area was more pronounced for samples subjected to traditional pasteurization, and its intensity decreased for samples obtained by means of ultrasonic pasteurization. These vibrations derived from similar structures as those mentioned above; however, they corresponded to the deformation vibrations of these groups. Their changes also confirmed the above interpretations.
However, a very important change in the opposite direction was observed in the band of low intensity with a maximum of about 1144 cm−1. This band belongs to the stretching vibrations of such groups as C–C, C–O, or C–H in carbohydrate structures. We observed it for samples subjected to ultrasonic pasteurization, and it practically disappeared in the spectra of samples obtained by traditional pasteurization. These changes confirmed that in the samples obtained by the new method of pasteurization, we obtained a higher level of carbohydrate structures.
This seems to be characteristic of this type of food material, as often observed in the literature, but is generally not typical of the physical treatment method itself. Significant changes in the intensity of bands were observed for the following maxima: 1414 cm−1, 1240 cm−1, 1144 cm−1, and 1047 cm−1. However, the most significant changes were observed at 1743 cm−1, 2920 cm−1 and 1451 cm−1, which mainly corresponded to changes in the quantity of fat structures and in the content of carbohydrate structures in the samples.
3.5. Scanning Electron Microscopy (SEM)
To confirm the results of the conducted research and analysis, microstructure images of the ice creams were taken using scanning electron microscopy (SEM), which are presented in Figure 4.
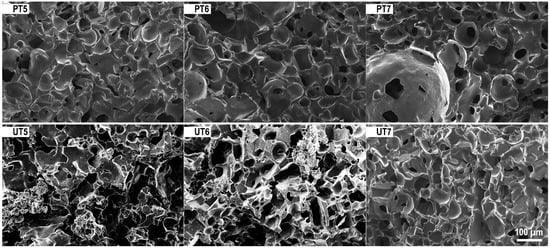
Figure 4.
Scanning electron microscopy was used to examine the structure of the ice cream (pasteurized ice cream: PT5—sample with 5% strawberry-seed oleogel, PT6—sample with 6% strawberry-seed oleogel, PT7—sample with 7% strawberry-seed oleogel; ultrasound-treated ice cream: UT5—sample with 5% strawberry-seed oleogel, UT6—sample with 6% strawberry-seed oleogel, UT7—sample with 7% strawberry-seed oleogel).
Overall, it can be stated that the microstructure of the ice creams was characterized by a high density of air bubbles, confirming a low level of aeration of the ice cream samples. In the case of the ice cream samples obtained from ice cream mixes treated with ultrasound and with the addition of 5% and 6% oleogel, a non-uniform structure could be observed. A more delicate structure was observed in the sample with 7% oleogel. In the remaining samples, small spherical spaces with small air bubbles could be observed. A microstructure analysis can provide crucial information when observing changes in fat globules and the type of destabilization. The method of preparing the ice cream mix (homogenization method) and its composition (presence of stabilizers) are important in shaping the ice crystals in ice cream [20]. Based on the microscopic photos, the agglomeration of fats and considerable diversification were visible in all ice cream mixes.
4. Conclusions
The research demonstrated the potential of ultrasound treatment as a viable alternative to conventional pasteurization methods, with no adverse effects on the physicochemical properties of ice cream. It was shown that ice cream treated with ultrasound had lower fat content and higher carbohydrate content. Our analysis using FTIR spectroscopy confirmed that the biggest changes were characteristic of the fat and carbohydrate fractions. The changes in the spectra only in terms of band intensity also confirmed the lack of a negative impact on the internal structure of the ice cream, thus confirming the quality and benefits of the ultrasound treatment method. They also suggested a better packing of the molecules of different compounds in the ice creams in the presence of the oleogel. In addition, ultrasound treatment increased the apparent viscosity of the ice cream, which contributed to reduced overrun, increased hardness, and resistance to melting. However, it did not affect the change in the freezing point temperature of the ice cream, the amount of freezable water, and the enthalpy difference. Therefore, ultrasound treatment combined with heating provides the possibility of replacing the standard pasteurization method.
Strawberry seed oil is rich in unsaturated fatty acids and can form stable oleogels, which significantly impact the physicochemical properties of ice cream. As the proportion of oleogel increased, various characteristics of the ice cream were affected. These included an increase in fat content, freezable water content, enthalpy of fusion, and degree of overrun, along with a decrease in freezing point temperature. Oleogels derived from strawberry seed oil are a promising alternative to traditional fats in ice cream, particularly for those seeking higher levels of unsaturated fatty acids. In summary, by using ultrasonic treatment of an ice cream mixture and modifying the mixture’s composition with oleogels, ice cream with favorable physicochemical properties could be obtained. The use of ultrasound and oleogels as fat substitutes in ice cream is a future strategy for sustainable production in the face of the increasing consumer demand and changing trends for food producers. Ultrasound can contribute to sustainable production because it is recognized as a non-polluting, economically viable, safe, and healthy technology for consumers.
Author Contributions
Conceptualization, S.N. and K.K.; methodology, K.R., A.M., Z.K., E.I., L.H. and T.S.; software, S.N.; validation, K.K., B.G. and A.M.; formal analysis, K.R., A.M., Z.K., E.I. and T.S.; investigation, S.N.; resources, K.K. and B.G.; data curation, K.K. and L.H.; writing—original draft preparation, K.K. and A.M.; writing—review and editing, S.N. and A.M.; visualization, S.N.; supervision, K.K.; project administration, B.G.; funding acquisition, S.N., K.K. and Z.K. All authors have read and agreed to the published version of the manuscript.
Funding
Publication co-financed by the state budget under the program of the Ministry of Education and Science (Republic of Poland) under the name Excellent Science—Support for Scientific Conferences entitled “XXIII Polish Nationwide Scientific Conference “PROGRESS IN PRODUCTION ENGINEERING” 2023” project number DNK/SP/546290/2022 amount of funding 162,650.00 PLN total value of the project 238,650.00 PLN (Poland).
Institutional Review Board Statement
Not applicable.
Informed Consent Statement
Not applicable.
Data Availability Statement
Not applicable.
Conflicts of Interest
The authors declare no conflict of interest.
References
- Akdeniz, V.; Akalin, A.S. New approach for yoghurt and ice cream production: High-intensity ultrasound. Trends Food Sci. Technol. 2019, 86, 392–398. [Google Scholar] [CrossRef]
- Chavan, P.; Sharma, P.; Sharma, S.R.; Mittal, T.C.; Jaiswal, A.K. Application of high-intensity ultrasound to improve food processing efficiency: A review. Foods 2022, 11, 122. [Google Scholar] [CrossRef] [PubMed]
- Bhargava, N.; Mor, R.S.; Kumar, K.; Sharanagat, V.S. Advances in application of ultrasound in food processing: A review. Ultrason. Sonochem. 2021, 70, 105293. [Google Scholar] [CrossRef] [PubMed]
- Carrillo-Lopez, L.M.; Garcia-Galicia, I.A.; Tirado-Gallegos, J.M.; Sanchez-Vega, R.; Huerta-Jimenez, M.; Ashokkumar, M.; Alarcon-Rojo, A.D. Recent advances in the application of ultrasound in dairy products: Effect on functional, physical, chemical, microbiological and sensory properties. Ultrason. Sonochem. 2021, 73, 105467. [Google Scholar] [CrossRef] [PubMed]
- Gallo, M.; Ferrara, L.; Naviglio, D. Application of ultrasound in food science and technology: A perspective. Foods 2018, 7, 164. [Google Scholar] [CrossRef]
- Firouz, M.S.; Farahmandi, A.; Hosseinpour, S. Recent advances in ultrasound application as a novel technique in analysis, processing and quality control of fruits, juices and dairy products industries: A review. Ultrason. Sonochem. 2019, 57, 73–88. [Google Scholar] [CrossRef] [PubMed]
- Mohammadi, V.; Ghasemi-Varnamkhasti, M.; González, L.A. Analytical measurements of ultrasound propagation in dairy products: A review. Trends Food Sci. Technol. 2017, 61, 38–48. [Google Scholar] [CrossRef]
- Bahram-Parvar, M. A review of modern instrumental techniques for measurements of ice cream characteristics. Food Chem. 2015, 188, 625–631. [Google Scholar] [CrossRef]
- Singla, M.; Sit, N. Application of ultrasound in combination with other technologies in food processing: A review. Ultrason. Sonochem. 2021, 73, 105506. [Google Scholar] [CrossRef]
- Dzah, C.S.; Duan, Y.; Zhang, H.; Wen, C.; Zhang, J.; Chen, G.; Ma, H. The effects of ultrasound assisted extraction on yield, antioxidant, anticancer and antimicrobial activity of polyphenol extracts: A review. Food Biosci. 2020, 35, 100547. [Google Scholar] [CrossRef]
- De Castro, M.L.; Priego-Capote, F. Ultrasound-assisted crystallization (sonocrystallization). Ultrason. Sonochem. 2007, 14, 717–724. [Google Scholar] [CrossRef]
- Baboli, Z.M.; Williams, L.; Chen, G. Design of a batch ultrasonic reactor for rapid pasteurization of juices. J. Food Eng. 2020, 268, 109736. [Google Scholar] [CrossRef]
- Li, D.; Zhao, H.; Muhammad, A.I.; Song, L.; Guo, M.; Liu, D. The comparison of ultrasound-assisted thawing, air thawing and water immersion thawing on the quality of slow/fast freezing bighead carp (Aristichthys nobilis) fillets. Food Chem. 2020, 320, 126614. [Google Scholar] [CrossRef] [PubMed]
- Zhu, Z.; Zhang, P.; Sun, D.W. Effects of multi-frequency ultrasound on freezing rates and quality attributes of potatoes. Ultrason. Sonochem. 2020, 60, 104733. [Google Scholar] [CrossRef] [PubMed]
- Nguyen, N.H.; Anema, S.G. Ultrasonication of reconstituted whole milk and its effect on acid gelation. Food Chem. 2017, 217, 593–601. [Google Scholar] [CrossRef]
- Zisu, B.; Schleyer, M.; Chandrapala, J. Application of ultrasound to reduce viscosity and control the rate of age thickening of concentrated skim milk. Int. Dairy J. 2013, 31, 41–43. [Google Scholar] [CrossRef]
- Erfanian, A.; Rasti, B. Effects of sonication condition on milk-soymilk yogurt properties. Int. Food Res. J. 2019, 26, 1823–1834. [Google Scholar]
- Riener, J.; Noci, F.; Cronin, D.A.; Morgan, D.J.; Lyng, J.G. A comparison of selected quality characteristics of yoghurts prepared from thermosonicated and conventionally heated milks. Food Chem. 2010, 119, 1108–1113. [Google Scholar] [CrossRef]
- Türker, A.D.; Dogan, M. Effects of ultrasound homogenization on the structural and sensorial attributes of ice cream: Optimization with Taguchi and data envelopment analysis. Food Meas. 2021, 15, 4888–4898. [Google Scholar] [CrossRef]
- Kot, A.; Kamińska-Dwórznicka, A.; Jakubczyk, E. Study on the influence of ultrasound homogenisation on the physical properties of vegan ice cream mixes. Appl. Sci. 2022, 12, 8492. [Google Scholar] [CrossRef]
- Manzoor, S.; Masoodi, F.A.; Naqash, F.; Rashid, R. Oleogels: Promising alternatives to solid fats for food applications. Food Hydrocoll. Health 2022, 2, 100058. [Google Scholar] [CrossRef]
- Wang, Z.; Chandrapala, J.; Truong, T.; Farahnaky, A. Oleogels prepared with low molecular weight gelators: Texture, rheology and sensory properties, a review. Crit. Rev. Food Sci. Nutr. 2022, 1–45. [Google Scholar] [CrossRef] [PubMed]
- Zhao, W.; Wei, Z.; Xue, C. Recent advances on food-grade oleogels: Fabrication, application and research trends. Crit. Rev. Food Sci. Nutr. 2022, 62, 7659–7676. [Google Scholar] [CrossRef] [PubMed]
- Banaś, K.; Harasym, J. Natural gums as oleogelators. Int. J. Mol. Sci. 2021, 22, 12977. [Google Scholar] [CrossRef]
- Pușcaș, A.; Mureșan, V.; Socaciu, C.; Muste, S. Oleogels in Food: A Review of Current and Potential Applications. Foods 2020, 9, 70. [Google Scholar] [CrossRef]
- Chaves, K.F.; Barrera-Arellano, D.; Ribeiro, A.P.B. Potential application of lipid organogels for food industry. Food Res. Int. 2018, 105, 863–872. [Google Scholar] [CrossRef]
- Demirkesen, I.; Mert, B. Recent developments of oleogel utilizations in bakery products. Crit. Rev. Food Sci. Nutr. 2019, 60, 2460–2479. [Google Scholar] [CrossRef]
- Demirkesen, I.; Mert, B. Utilization of Beeswax Oleogel-Shortening Mixtures in Gluten-Free Bakery Products. J. Am. Oil Chem. Soc. 2019, 96, 545–554. [Google Scholar] [CrossRef]
- Jimenez-Colmenero, F.; Salcedo-Sandoval, L.; Bou, R.; Cofrades, S.; Herrero, A.M.; Ruiz-Capillas, C. Novel applications of oil-structuring methods as a strategy to improve the fat content of meat products. Trends Food Sci. Technol. 2015, 44, 177–188. [Google Scholar] [CrossRef]
- Patel, A.R.; Rajarethinem, P.S.; Grędowska, A.; Turhan, O.; Lesaffer, A.; De Vos, W.H.; de Walle, D.V.; Dewettinck, K. Edible applications of shellac oleogels: Spreads, chocolate paste and cakes. Food Funct. 2014, 5, 645–652. [Google Scholar] [CrossRef]
- Moriano, M.E.; Alamprese, C. Organogels as novel ingredients for low saturated fat ice creams. LWT 2017, 86, 371–376. [Google Scholar] [CrossRef]
- Nazarewicz, S.; Kozłowicz, K.; Kobus, Z.; Gładyszewska, B.; Matwijczuk, A.; Ślusarczyk, L.; Skrzypek, T.; Sujka, M.; Kozłowicz, N. The Use of Ultrasound in Shaping the Properties of Ice Cream with Oleogel Based on Oil Extracted from Tomato Seeds. Appl. Sci. 2022, 12, 9165. [Google Scholar] [CrossRef]
- Airoldi, R.; da Silva, T.L.T.; Ract, J.N.R.; Foguel, A.; Colleran, H.L.; Ibrahim, S.A.; da Silva, R.C. Potential use of carnauba wax oleogel to replace saturated fat in ice cream. J. Am. Oil Chem. Soc. 2022, 99, 1085–1099. [Google Scholar] [CrossRef]
- Jing, X.; Chen, Z.; Tang, Z.; Tao, Y.; Huang, Q.; Wu, Y.; Zhang, H.; Li, X.; Liang, J.; Liu, Z.; et al. Preparation of camellia oil oleogel and its application in an ice cream system. LWT 2022, 169, 113985. [Google Scholar] [CrossRef]
- Zulim Botega, D.C.; Marangoni, A.G.; Smith, A.K.; Goff, H.D. The potential application of rice bran wax oleogel to replace solid fat and enhance unsaturated fat content in ice cream. J. Food Sci. 2013, 7, C1334–C1339. [Google Scholar] [CrossRef] [PubMed]
- Munk, M.B.; Munk, D.M.; Gustavsson, F.; Risbo, J. Using Ethylcellulose to Structure Oil Droplets in Ice Cream Made with High Oleic Sunflower Oil. J. Food Sci. 2018, 83, 2520–2526. [Google Scholar] [CrossRef]
- Silva-Avellaneda, E.; Bauer-Estrada, K.; Prieto-Correa, R.E.; Quintanilla-Carvajal, M.X. The effect of composition, microfluidization and process parameters on formation of oleogels for ice cream applications. Sci. Rep. 2021, 11, 7161. [Google Scholar] [CrossRef]
- 12966-2:2017; Animal and Vegetable Fats and Oils Gas Chromatography of Fatty Acid Methyl Esters—Part 2: Preparation of Methyl Esters of Fatty Acids. ISO International Organization for Standardization: Geneva, Switzerland, 2017.
- Żbikowska, A.; Kupiec, M.; Onacik-Gür, S. Wpływ karagenu na teksturę i stabilność oleożeli hydroksypropylometylocelulozowych. Acta Agrophysica 2017, 24, 553–561. [Google Scholar]
- Yılmaz, E.; Öğütcü, M. Properties and stability of hazelnut oil organogels with beeswax and monoglyceride. J. Am. Oil Chem. Soc. 2014, 91, 1007–1017. [Google Scholar] [CrossRef]
- Da Pieve, S.; Calligaris, S.; Co, E.; Nicoli, M.C.; Marangoni, A.G. Shear nanostructuring of monoglyceride organogels. Food Biophys. 2010, 5, 211–217. [Google Scholar] [CrossRef]
- AOAC International. Official Methods of Analysis of AOAC International, 17th ed.; Association of Analytical Communities: Gaithersburg, MD, USA, 2000. [Google Scholar]
- Novotny, J.; Gebauer, S.; Baer, D. Discrepancy between the Atwater factor predicted and empirically measured energy values of almonds in human diets. Am. J. Clin. Nutr. 2012, 92, 296–301. [Google Scholar] [CrossRef] [PubMed]
- Kunová, S.; Ivanišová, E.; Žiarovská, J.; Zamiešková, L.; Felsöciová, S.; Petkoska, A.T.; Nedelkoska, D.N.; Kačániová, M. Differences between microbiota, phytochemical, antioxidant profile and DNA fingerprinting of cabernet sauvignon grape from Slovakia and Macedonia. Slovak J. Food Sci. 2020, 14, 945–953. [Google Scholar] [CrossRef] [PubMed]
- Yen, G.C.; Chen, H.Y. Antioxidant activity of various tea extracts in relation to their antimutagenicity. J. Agric. Food Chem. 1995, 43, 27–32. [Google Scholar] [CrossRef]
- Singleton, V.L.; Rossi, J.A. Colorimetry of total phenolics with phosphomolybdic-phosphotungstic acid reagents. Am. J. Enol. Vitic. 1965, 16, 144–158. [Google Scholar] [CrossRef]
- Savanović, D.M.; Grujić, R.D.; Savanović, J.M.; Mandić, S.U.; Rakita, S.M. Analysis of frozen chicken meat using differential scanning calorimetry. Food Feed Res. 2018, 45, 129–137. [Google Scholar] [CrossRef]
- Aboulfazli, F.; Baba, A.S.; Misran, M. Effect of vegetable milks on the physical and rheological properties of ice cream. Food Sci. Technol. Res. 2014, 20, 987–996. [Google Scholar] [CrossRef]
- Akbari, M.; Eskandari, M.H.; Niakosari, M.; Bedeltavana, A. The effect of inulin on the physicochemical properties and sensory attributes of low-fat ice cream. Int. Dairy J. 2016, 57, 52–55. [Google Scholar] [CrossRef]
- Güven, M.; Karaca, O.B. The effect of varying sugar content and fruit concentration on the physical properties of vanilla and fruit ice-cream-type frozen yogurts. Int. J. Dairy Technol. 2002, 55, 27–31. [Google Scholar] [CrossRef]
- Tiwari, A.; Sharma, H.K.; Kumar, N.; Kaur, M. The effect of inulin as a fat replacer on the quality of low-fat ice cream. Int. J. Dairy Technol. 2015, 68, 374–380. [Google Scholar] [CrossRef]
- Skrzypek, T.; Kazimierczak, W.; Zięba, E.; Olszewski, J.; Ferenc, K.; Zabielski, R. Chapter 2—How to Get A Proper 2D and 3D Image? In Atlas of the Pig Gut, Research and Techniques from Birth to Adulthood; Zabielski, R., Skrzypek, T., Eds.; Academic Press: Cambridge, MA, USA, 2021; pp. 3–36. [Google Scholar] [CrossRef]
- Kola, O.; Parıldı, E.; Keçeli, N.; Akkaya, M.R. Fatty Acids Composition and Bioactive Substances of Cold Pressed Oils from Strawberry Seed Çilek Tohumundan Soğuk Sıkımla Elde Edilen Yağların Biyoaktif Bileşenleri ve Yağ Asidi Kompozisyonu. Turk. J. Eng. Res. Educ. 2022, 1, 62–70. [Google Scholar]
- da Silva, A.C.; Jorge, N. Bioactive compounds of oils extracted from fruits seeds obtained from agroindustrial waste. Eur. J. Lipid Sci. Technol. 2017, 119, 1600024. [Google Scholar] [CrossRef]
- Pieszka, M.; Migdał, W.; Gąsior, R.; Rudzińska, M.; Bederska-Łojewska, D.; Pieszka, M.; Szczurek, P. Native Oils from Apple, Blackcurrant, Raspberry, and Strawberry Seeds as a Source of Polyenoic Fatty Acids, Tocochromanols, and Phytosterols: A Health Implication. J. Chem. 2015, 2015, 659541. [Google Scholar] [CrossRef]
- Sikora, E.; Michorczyk, P.; Olszańska, M.; Ogonowski, J. Supercritical CO2 extract from strawberry seeds as a valuable component of mild cleansing compositions. Int. J. Cosmet. Sci. 2015, 37, 574–578. [Google Scholar] [CrossRef]
- Bermúdez-Aguirre, D.; Mawson, R.; Versteeg, K.; Barbosa-Cánovas, G.V. Composition properties, physicochemical characteristics and shelf life of whole milk after thermal and thermo-sonication treatments. J. Food Qual. 2009, 32, 283–302. [Google Scholar] [CrossRef]
- Villamiel, M.; de Jong, P. Influence of high-intensity ultrasound and heat treatment in continuous flow on fat, proteins, and native enzymes of milk. J. Agric. Food Chem. 2000, 48, 472–478. [Google Scholar] [CrossRef] [PubMed]
- Akca, S.; Akpinar, A. The Effects of grape, pomegranate, sesame seed powder and their oils on probiotic ice cream: Total phenolic contents, antioxidant activity and probiotic viability. Food Biosci. 2021, 42, 101203. [Google Scholar] [CrossRef]
- Nascimento, E.D.A.; Melo, E.D.A.; Lima, V.L.A.G.D. Ice cream with functional potential added grape agro-industrial waste. J. Culin. Sci. Technol. 2018, 16, 128–148. [Google Scholar] [CrossRef]
- Sayar, E.; Şengül, M.; Ürkek, B. Antioxidant capacity and rheological, textural properties of ice cream produced from camel’s milk with blueberry. J. Food Process. Preserv. 2022, 46, e16346. [Google Scholar] [CrossRef]
- Storck, C.R.; Basso, C.; Favarin, F.R.; Rodrigues, A.C. Microbiological quality and composition of flour from fruit juice production residues with different granulometries. Braz. J. Food Technol. 2015, 18, 277–284. [Google Scholar] [CrossRef]
- Haghani, S.; Hadidi, M.; Pouramin, S.; Adinepour, F.; Hasiri, Z.; Moreno, A.; Munekata, P.E.S.; Lorenzo, J.M. Application of Cornelian Cherry (Cornus mas L.) Peel in Probiotic Ice Cream: Functionality and Viability during Storage. Antioxidants 2021, 10, 1777. [Google Scholar] [CrossRef]
- Kotan, T.E. Mineral composition and some quality characteristics of ice creams manufactured with the addition of blueberry. Gıda 2018, 43, 635–643. [Google Scholar] [CrossRef]
- Abbasi, S.; Saeedabadian, A. Influences of lactose hydrolysis of milk and sugar reduction on some physical properties of ice cream. J. Food Sci. Technol. 2015, 52, 367–374. [Google Scholar] [CrossRef]
- Carvalho, C.C.; Bodini, R.B.; Sobral, P.J.; Oliveira, A.L. Ice creams made from cow’s and goat’s milks with different fat concentrations: Physical-chemical and sensory properties. Food Sci. Technol. 2022, 42, e79721. [Google Scholar] [CrossRef]
- Warren, M.M.; Hartel, R.W. Effects of emulsifier, overrun and dasher speed on ice cream microstructure and melting properties. J. Food Sci. 2018, 83, 639–647. [Google Scholar] [CrossRef] [PubMed]
- Kozłowicz, K.; Różyło, R.; Gładyszewska, B.; Matwijczuk, A.; Gładyszewski, G.; Chocyk, D.; Samborska, K.; Piekut, J.; Smolewska, M. Identification of sugars and phenolic compounds in honey powders with the use of GC–MS, FTIR spectroscopy, and X-ray diffraction. Sci. Rep. 2020, 10, 16269. [Google Scholar] [CrossRef]
- Dertli, E.; Toker, O.S.; Durak, M.Z.; Yilmaz, M.T.; Tatlısu, N.B.; Sagdic, O.; Cankurt, H. Development of a fermented ice-cream as influenced by in situ exopolysaccharide production: Rheological, molecular, microstructural and sensory characterization. Carbohydr. Polym. 2016, 136, 427–440. [Google Scholar] [CrossRef]
- Pulungan, M.H.; Santoso, E.S.M. Ice cream cup production using purple sweet potato (Ipomoea batatas L. Poir) as a substitute ingredient. Ind. J. Teknol. Dan Manaj. Agroindustri 2020, 9, 184–194. [Google Scholar] [CrossRef]
- Kurt, A.; Atalar, I. Effects of quince seed on the rheological, structural and sensory characteristics of ice cream. Food Hydrocoll. 2018, 82, 186–195. [Google Scholar] [CrossRef]
- Shukri, W.H.Z.; Hamzah, E.N.H.; Halim, N.R.A.; Isa, M.I.N.; Sarbon, N.M. Effect of different types of hydrocolloids on the physical and sensory properties of ice cream with fermented glutinous rice (tapai pulut). Int. Food Res. J. 2014, 21, 1777–1787. [Google Scholar]
- Zaeim, D.; Sarabi-Jamab, M.; Ghorani, B.; Kadkhodaee, R.; Liu, W.; Tromp, R.H. Microencapsulation of probiotics in multi-polysaccharide microcapsules by electro-hydrodynamic atomization and incorporation into ice-cream formulation. Food Struct. 2020, 25, 100147. [Google Scholar] [CrossRef]
- Vladimír, M.; Matwijczuk, A.P.; Niemczynowicz, A.; Kycia, R.A.; Karcz, D.; Gładyszewska, B.; Ślusarczyk, L.; Burg, P. Chemometric approach to characterization of the selected grape seed oils based on their fatty acids composition and FTIR spectroscopy. Sci. Rep. 2021, 11, 19256. [Google Scholar] [CrossRef] [PubMed]
- Kathuria, D.; Dhiman, A.K. Encapsulation of soy isoflavone extract by freeze drying, its stability during storage and development of isoflavone enriched yoghurt. J. Food Sci. Technol. 2022, 59, 4945–4955. [Google Scholar] [CrossRef] [PubMed]


Disclaimer/Publisher’s Note: The statements, opinions and data contained in all publications are solely those of the individual author(s) and contributor(s) and not of MDPI and/or the editor(s). MDPI and/or the editor(s) disclaim responsibility for any injury to people or property resulting from any ideas, methods, instructions or products referred to in the content. |
© 2023 by the authors. Licensee MDPI, Basel, Switzerland. This article is an open access article distributed under the terms and conditions of the Creative Commons Attribution (CC BY) license (https://creativecommons.org/licenses/by/4.0/).