Article

Quantile Dependence between Crude Oil and China’s Biofuel Feedstock Commodity Market

1
Business School, Ningbo University, Ningbo 315211, China
2
College of Business Administration, Hunan University, Changsha 410082, China
3
School of Management and Economics, Beijing Institute of Technology, Beijing 100024, China
4
School of Information and Electrical Engineering, Hangzhou City University, Hangzhou 310015, China
*
Author to whom correspondence should be addressed.
Sustainability 2023, 15(11), 8980; https://doi.org/10.3390/su15118980
Submission received: 28 January 2023 / Revised: 16 May 2023 / Accepted: 31 May 2023 / Published: 2 June 2023

Abstract

:
This paper investigates the heterogeneous dependence between global crude oil futures and China’s biofuel feedstock commodities under different market conditions. Quantile-on-quantile regression and the causality-in-quantiles test are employed to capture comprehensive and informative relationships. The empirical results are as follows: First, there is a positive relationship between the returns on China’s biofuel feedstock commodities and crude oil. The effects are heterogeneous, conditional on the market regimes, where the impacts of the bearish/bullish crude oil market on biofuel feedstock commodity returns are significant when the commodity market in China is in a bearish/bullish state. Second, crude oil returns have reliable predictive power for the returns on China’s biofuel feedstock commodities under the average market condition and move in connection with the volatility of China’s biofuel-related commodity market in normal and bullish market conditions. Third, the risk reduction effectiveness of soybean and corn is significant, while for wheat, this reduction in portfolio risk is less apparent and enhanced, and the risk reduction effectiveness increases significantly during financial and oil crises. Overall, our findings will be helpful in understanding the heterogeneous interplay between global oil and China’s biofuel-related commodities and in evaluating portfolio diversification opportunities under different market conditions.

1. Introduction

Driven by the rising prices of fossil fuel energy from 1999 to 2008, biofuels have surged as substitutes for conventional fuels [1]. Coupled with concerns about climate change triggered by excessive greenhouse gas emissions and to promote energy efficiency, biofuels have a vital influence on the progress of green economics [2]. As a result, the global biofuel production has steadily increased by more than five-fold over the past two decades, attracting the attention of a growing number of researchers [3,4].
Meanwhile, China’s biofuel market has developed dramatically since the end of the last century, helping to fill the fuel gap between steady crude oil production and surging fuel consumption. Up to now, China has played a critical role in the biofuel market as the third largest bioethanol production country globally, following Brazil and the United States. According to China’s biofuel industry development status survey and prospect strategy analysis report released by Market Research Online from 2023 to 2029, by 2019, the market scale of China’s biofuel industry had reached CNY 140 billion, and the industry scale continues to grow. The rapid growth in China’s biofuel production is largely thanks to government policy measures such as related policies to expand the production of biofuel ethanol and to promote the use of automotive ethanol gasoline, which has boosted the demand for agricultural biofuel feedstocks. The boom in the biofuel industry in China is also due to excess grain stocks, which can be consumed in biofuel production to increase the efficiency of grain utilization, such as corn and wheat. The first generation of biofuel production was incompatible with food security, and China is not a unique country in worrying about national food security from feedstock crops of biofuel. However, huge crop stocks still make corn and wheat the primary feedstocks of biofuel production [5,6]. Domestic corn stocks were estimated to amount to about 210 million tons in 2017, including aged corn. At present, biofuel feedstocks, which are essentially popular agricultural commodities, are increasingly financialized [7]. Therefore, it is of constructive significance for the development of China’s biofuel market to promote the stability of their prices from the perspective of risk management and portfolios [8,9].
Crude oil shocks are an important influencing factor of biofuel feedstock price fluctuations [10,11,12]. As a fundamental of global economics, crude oil prices have direct or indirect effects on agricultural commodities [13,14,15,16,17]. Directly, crude oil contributes largely to agricultural production systems such as nitrogen fertilizers and transportation [18,19]. Indirectly, the transmission mechanism through biofuels is worked out by two channels. One is that the rapid growth of biofuel production drives up the demand and increases the price of agricultural biofuel feedstocks [20]. The second is the substitution effect of biofuel on crude oil, which puts a downward pressure on oil prices and then lowers the overall prices of agricultural commodities. Moreover, in recent years, due to the unpredictable international situation and the frequent economic crisis, the price of oil has fluctuated dramatically, affecting the price of biofuel feedstocks, which is not conducive to the healthy, stable, and sustainable development of the biofuel market [21,22,23,24,25]. Thus, revealing the correlation between crude oil and biofuel feedstocks can help us to develop strategies to cope with the effect of crude oil shocks on biofuel feedstocks, so as to promote smooth operation of the biofuel market; to achieve bioenergy price stability to reduce dependence on fossil energy; and further to promote the agricultural industry, environmental sustainability, energy conversion, and the reduction in greenhouse gas emissions.
Despite the economic importance of the relationship between crude oil and biofuel feedstock commodities in China, the quantile dependence between these markets has not yet been fully confirmed. The question of how to capture the comprehensive dependence information conditional on the market regimes is still under debate. Moreover, whether crude oil future returns have reliable predictive power for the returns of China’s biofuel feedstock commodities remains controversial.
Above all, this paper aimed to investigate the dependence between global crude oil futures and China’s biofuel feedstock commodities across quantile levels. First, we employed the quantile-on-quantile regression (QQR) model introduced by Sim and Zhou to analyze the quantile dependence between these markets [26]. This model can uncover heterogeneous dependence and provides a more complete picture of how the dependence between the crude oil market and the biofuel feedstock market would change under different market conditions compared with the conventional regression model. Second, the nonparametric causality-in-quantiles approach was used to test the predictive power of crude oil returns on the returns/volatility of China’s biofuel feedstock commodities. This approach can also perceive the underlying nonlinear dependence structure between series. Finally, to provide a better understanding of portfolio management and risk hedging across different quantile levels, we computed the realized betas for each biofuel feedstock commodity, which are also known as optimal hedging ratios. Our results show that the hedging costs increased during the booming and bustling market conditions, in line with the results of Bonato [27].
Our work provides three contributions to the existing research. First, we test the influence of crude oil on biofuel feedstock commodity futures from the perspective of China’s commodity markets. Because of the complex characteristics of China’s biofuel market, the nexus between crude oil and biofuel feedstock commodities should be paid more attention. Second, based on the QQR model, we investigate the effects of different crude oil market states on the biofuel feedstock commodity market. Little information is available in the existing literature regarding the heterogeneous connections of crude oil and China’s biofuel feedstock commodity futures. Finally, the nonparametric causality-in-quantiles test is applied to test the predictive power of crude oil returns on biofuel feedstock commodity returns/volatility. We find significant causality from crude oil returns for the volatility of all biofuel feedstock commodities for normal and higher quantiles. Our findings reject the neutrality hypothesis for all the selected biofuel feedstock commodities. This precise information is essential for investors in order to hedge their risk exposure efficaciously and to construct their portfolios effectively.
The structure of this paper is arranged as follows. Section 2 is a literature review. Section 3 demonstrates the quantile-based approach QQR and the nonparametric causality-in-quantiles approach. Section 4 presents the data and a discussion of the empirical results. The conclusions are presented in Section 5.

2. Literature Review

Research on the dependences between the prices of energy and agricultural commodities has increased rapidly since the founding of commodity prices’ co-movement [28]. Several studies confirm the theoretical transmission mechanisms from crude oil to agricultural commodity prices, including direct transmission channels and indirect transmission channels. One strand considers agriculture an energy-intensive sector and found a direct influence of crude oil on agricultural commodity prices (e.g., [29,30]). For example, various effects of crude oil prices on different agricultural commodities were found by Hanson et al. [29]. Zhang et al. concluded on the long-term neutral relationship from fuel price shocks to agricultural commodity prices [30]. Umar et al. conducted a spillover method and found return and volatility connectedness between oil price shocks and various agricultural commodities [23].
In the other strand, the literature has revealed the indirect linkage from energy prices to agricultural commodities through macro-economic factors (e.g., [31,32,33,34]). For example, Gohin and Chantret applied a world computable general equilibrium model to investigate the macro-economic linkages between energy and crop prices [31]. Nazlioglu and Soytas tested the interdependence linkage from oil prices to five Turkish agricultural commodities through exchange rates [32]. Their results support the neutrality hypothesis of Turkey’s agricultural commodity markets. Chen researched the co-movement between oil and China’s agricultural commodity prices concerning the domestic underpinning fluctuations [33]. Biofuels are considered a critical transmitter between crude oil and agricultural commodity prices. Ciaian and Kancs found positive effects of oil prices on primary agricultural commodities considering the effect of biofuels [13]. Natanelov et al. offered a contextual study to investigate the complicated relationship between crude oil and corn, the primary feedstock of ethanol [35]. Naeem revealed the association between oil prices and biofuels’ feedstock within the time–frequency domain [24].
However, the dependence between energy and biofuel feedstock prices is not conclusive for different countries and different periods. For example, Filip et al. did not find a uniform price transmission between biofuels and related agricultural commodity prices in Brazil, the EU, and the USA [28]. Fowowe supported the neutral relationship hypothesis between crude oil prices and agricultural commodities with evidence in South Africa [36]. Gomes et al. tested the potential nonlinear effect of crude oil on the biofuel–agricultural commodity relationship for 16 underdeveloped and emerging nations [37]. They found that the effect dissipated for the countries exporting agricultural commodities and importing crude oil at the same time. Considering different periods, Tyner found little correlation between markets of crude oil and agricultural before 2005, while the active link emerged during 2006–2008, with biofuel booming in the U.S. [38]. Meyers et al. and Zhang et al. found strong co-movement over short time horizons, but no significant evidence in the long run [16,30].
A nonlinear and asymmetric nexus was found in some of the studies. For example, Fernandez-Perezreveal et al. revealed the US’s contemporaneous asymmetric interactions between fuel/biofuel and agricultural commodities [39]. Furthermore, Pal and Mitra found that the tail-dependent diesel–soybean linkage relationships varied with quantiles [40]. Su et al. used the time-varying rolling-window technique to examine the causalities of crude oil prices and agricultural commodities [41]. Hau et al. used quantile-on-quantile models to study the heterogeneous volatility dependence between crude oil and China’s agriculture futures [38]. Yoon examined the relationships between biofuel, fossil fuel, and agricultural commodities by applying the cointegration and causality analysis and found a significant short-run bidirectional causality between these series for all or most quantiles of the distribution [42].
However, few studies have investigated the nature of oil–agricultural linkages in the context of the biofuel industry in China. Similar studies include the following: Haixia and Shiping analyzed volatility spillovers among China’s corn, crude oil, and fuel ethanol markets by applying EGARCH and BEKK-MVGARCH models [43]. Their outcomes provided strong evidence of spillover effects since the boom of biofuel. Luo and Ji studied the volatility connectedness between the US crude oil market and China’s agricultural market by applying high-frequency data [44]. Among agricultural commodities, corn and soybean were chosen as the primary feedstocks of the biofuel industry, while volatility connectedness had an asymmetrical effect across markets. Spencer et al. investigated the hedging characteristics of the ethanol and corn commodities at the food–fuel intersection [45]. Our paper contributes to the literature by researching the distributional dependence between global crude oil prices and China’s biofuel feedstock future prices/volatilities, applying the QQR model and nonparametric causality-in-quantiles test.

3. Methodology

3.1. Quantile-On-Quantile Regression

As quantiles possess information about the state (large or small) of variables, the quantile-based method can uncover heterogeneous relationships between variables. However, the conventional quantile regression method overlooks the influence of the circumstances of independent variables. For instance, the relationship between crude oil and biofuel feedstock commodities may differ with the busting and booming of the energy market. In order to estimate the distributional dependence structure, Sim and Zhou proposed the QQR model by linking quantile regression analysis with local linear regression [26], which is a parsimonious way to avoid dimensionality problems associated with the nonparametric model by allocating more weights to immediate neighbor points. For this reason, we applied the QQR model to gain extensive insight into the connections between the quantiles of oil returns and quantiles of other commodity variables, i.e., the returns or volatility of biofuel feedstock commodities in context. We implemented the model by picking several crude oil returns’ quantiles and estimating the local effect that these quantiles have on the conditional quantiles of biofuel feedstock commodity returns/volatility. This model provides a more complete picture than alternative conventional models such as OLS and quantile regression.
We began with the conditional quantile partial linear model, which is specified as follows:
Q y t ( θ   |   x t ) = γ θ ( x t )
where 0 < θ < 1 , x t is the explanatory variable, denoting crude oil returns, and y t is the dependent variable, signifying the return or volatility of biofuel feedstock commodities in China. It should be noted that the residual term conditional on the quantiles of the repressor is 0. Because there was no prior information linking these variables, we utilized an unknown link function γ θ ( x t ) to represent the ambiguous relationship. Furthermore, we examined the neighborhood of a specific quantile x τ to linearize the linkage function by taking the first-order Taylor expansion, leading to the following:
γ θ ( x t ) α 0 θ ( x τ ) + α 1 θ ( x τ ) ( x t x τ )
By substituting Equation (2) into Equation (1), the following QQR model was obtained:
Q y t ( θ   |   x t ) = α 0 θ ( x τ ) + α 1 θ ( x τ ) ( x t x τ )
which represents the overall dependence structure between respective distributions, especially the effects of different states of crude oil returns. Both parameters α 0 θ ( x τ ) and α 1 θ ( x τ ) are functions of θ and τ , meaning that these parameters vary with the τ th quantiles of crude oil returns and the θ th quantiles of biofuel feedstock commodity returns/volatility. α 1 θ ( x τ ) is the partial derivative of Q y t ( θ   |   x t ) concerning x t , measuring the marginal effect of crude oil returns on the return/volatility of biofuel feedstock commodities in China. To estimate the model, we first substituted x t and x t τ with the corresponding counterparts x ^ t and x ^ τ , and then solved the following minimization problem:
min α 0 θ ( x τ ) R p , α 1 θ ( x τ ) R p t = 1 T ρ θ [ y t α 0 θ ( x ^ τ ) + α 1 θ ( x τ ) ( x ^ t x ^ τ ) ] K ( F n ( x ^ t ) τ h )
where ρ θ represents the quantile loss function, which solves for the θ th conditional quantile of y t , and the Gaussian kernel function K ( ) is used to weight the observations around x ^ τ . We chose the bandwidth parameter h = 0.05 to balance the bias and the variance [46]. The weights are inversely related to the distance of x ^ t from x ^ τ , and the empirical distribution function is represented by
F n ( x ^ t ) = 1 n k = 1 n I ( x ^ k < x ^ t )
The constructed model offers the cross-impacts of how the τ th quantiles of crude oil returns influence the θ th quantiles of biofuel feedstock commodity returns/volatility based on their respective distributions.

3.2. Causality-In-Quantiles Test

To detect the nonlinear dynamic causality between respective variables, we applied the nonparametric quantile-based Granger causality method, which was advanced by Balcilar et al. [47]. To test whether x t does not cause y t n in the θ th quantile, we expressed the hypothesis across all quantiles of the distribution as follows:
H 0 : P { F y t n   |   Z t 1 { Q θ ( y t n   |   Z t 1 )   |   Z t 1 } = θ } = 1
H 1 : P { F y t n   |   Z t 1 { Q θ ( y t n   |   Z t 1 )   |   Z t 1 } = θ } < 1
where Z t - 1 = ( X t - 1 , Y t - 1 n ) ; Y t 1 n ( y t 1 n , , y t p n ) ; X t 1 ( x t 1 , , x t p ) ; x t signifies the crude oil returns; y t n signifies the return/volatility of biofuel feedstock commodity futures, where the return is designated as n = 1 and the conditional volatility is designated as n = 2; and p is the lag order. F y t n   |   Z t 1 ( y t n ) is the conditional distribution function of y t n concerning Z t - 1 . Moreover, F y t n   |   Z t 1 ( y t n ) is presumed to be absolutely continuous in y t n for nearly all Z t - 1 . Q θ ( y t n   |   ) is the conditional θ th quantile of y t n depending on t and θ . Then, the quantile-based causality that x t causes y t n in the θ th quantile with respect to Z t - 1 is defined if
Q θ ( y t n   |   Z t 1 ) Q θ ( y t n   |   Y t 1 n )
According to the view of Nishiyama [48], the measure of distance is defined as
J = E [ { F y t 1 n   |   Z t 1 { Q θ ( y t n   |   Y t 1 n )   |   Z t 1 } θ } 2 f Z ( Z t 1 ) ]
Note that the equity J = 0 holds if and only if the null H 0 in Equation (6) is true, while under the alternative hypothesis H 1 as in Equation (7), the distance measure satisfies J > 0 . J can be estimated to follow kernel-based test statistics for a fixed θ :
J ^ T = 1 T ( T 1 ) h 2 p t = p + 1 T s = p + 1 , s t T K ( Z t 1 Z s 1 h ) ε ^ t ε ^ s
where h is the bandwidth of the kernel function K ( ) ; T is the sample size; and ε ^ t represents the regression residual, which can be estimated as follows:
ε ^ t = I { y t n Q ^ θ ( y t n   |   Y t 1 n ) } θ
where I { } is an indicator function and Q ^ θ ( y t n   |   Y t 1 n ) is the estimation of the conditional θ th quantile of y t n with respect to Y t 1 n and is estimated using the nonparametric kernel method as
Q ^ θ ( y t n   |   Y t 1 n ) = F ^ y t n   |   Y t 1 n 1 ( y t n   |   Y t 1 n )
By using the Nadaraya–Watson kernel estimation method, we obtain the following:
F ^ y t n   |   Y t 1 n ( y t n   |   Y t 1 n ) = s = p + 1 , s t T L ( Y t 1 Y s 1 h ) 1 ( y s y t ) s = p + 1 , s t T L ( Y t 1 Y s 1 h )
where L ( ) represents the kernel function and h represents the bandwidth, which is chosen using the least squares cross-validation method. We selected the optimal lag length p = 1 based on the SIC criterion under a VAR framework and employed Gaussian-type kernels for both K ( ) and L ( ) .

4. Data and Empirical Results

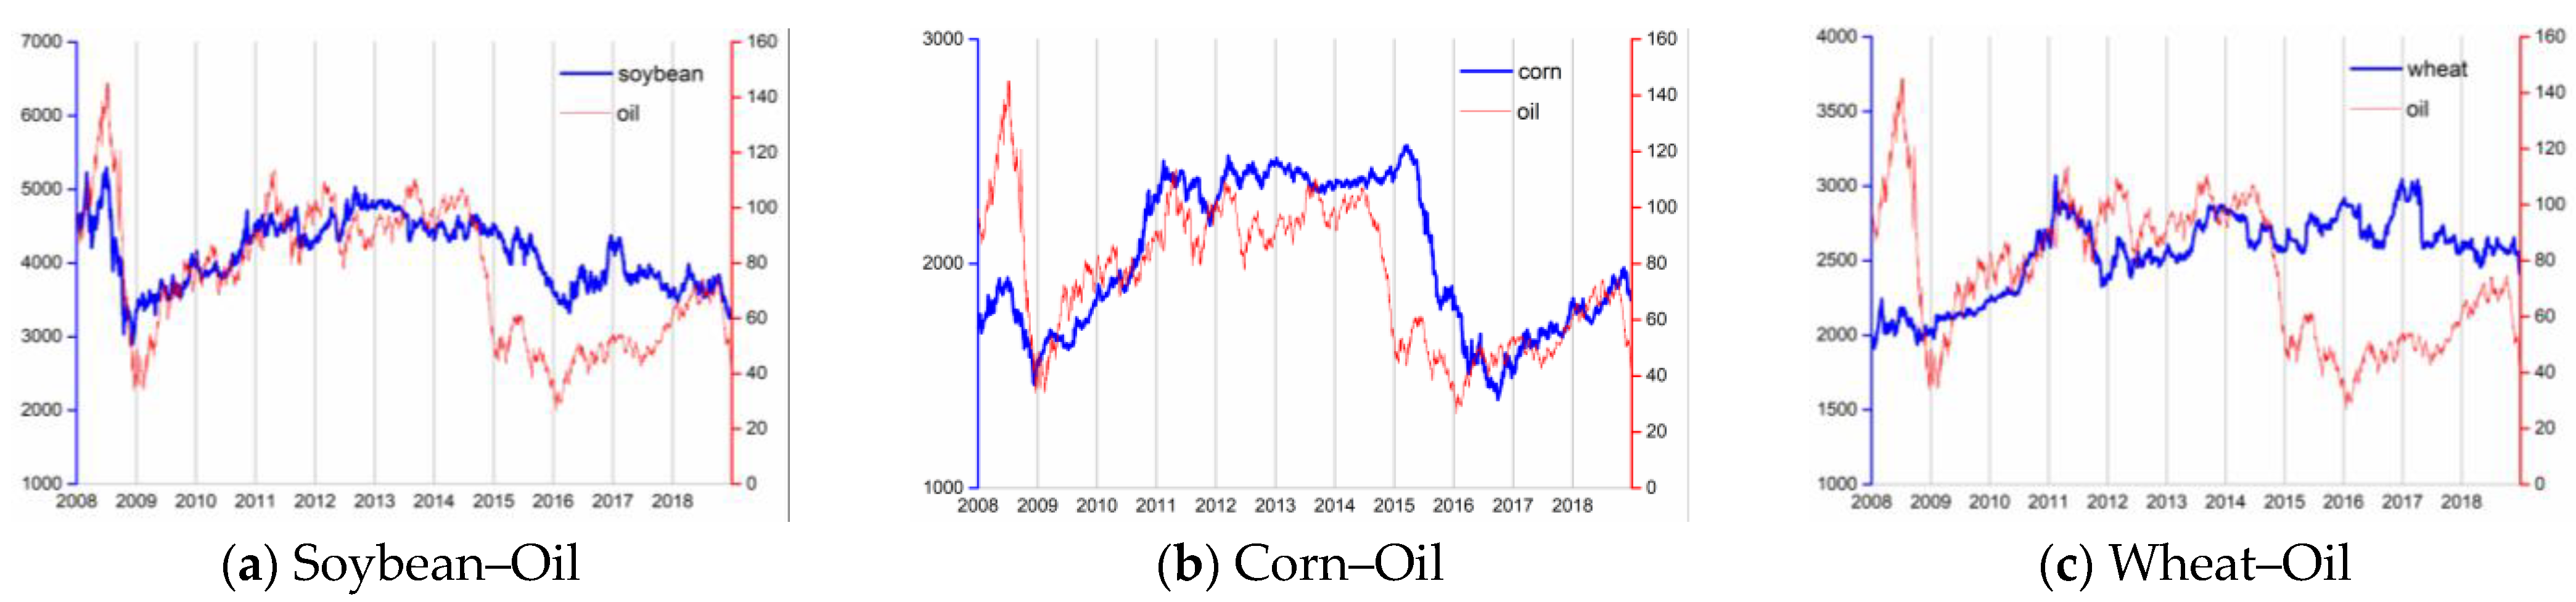
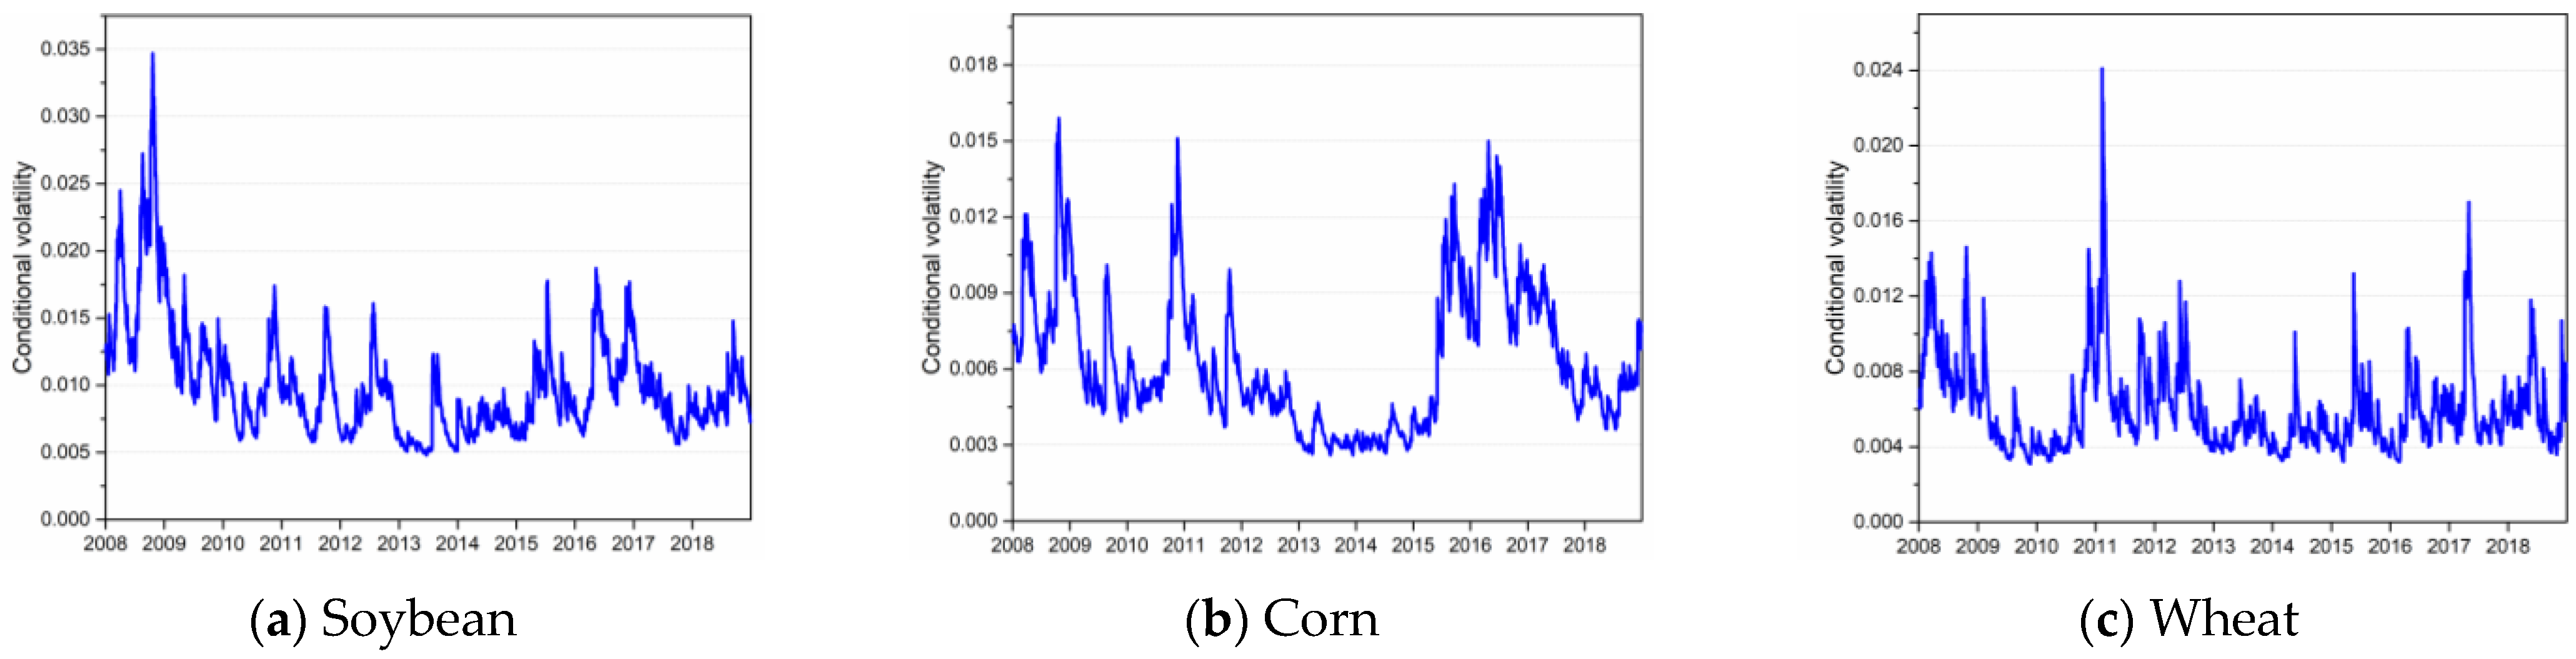
4.1. Data and Descriptive Analysis

We chose three major biofuel feedstock commodity futures (corn, wheat, and soybean) in China, which are traded on the Zhengzhou/Dalian Commodity Exchange markets. Although China is not a unique country in worrying about national food security from feedstock crops of biofuel, huge crop stocks still make corn, wheat, and soybeans the primary feedstock of biofuel production [5,6]. The daily price indices of the three futures covered the period from 2 January 2008 to 28 December 2018. We concentrated on the period of growth of the biofuel industry, where the associated policy instruments strengthened the connection of crude oil and biofuel feedstock commodities. The West Texas Intermediate (WTI) crude oil future prices were sourced from the Wind Database. The future price of WTI crude oil can be extensively regarded as one of the essential prices in the energy complex and financial trading. Additionally, WTI has been used in most of the existing research exploring the connection of crude oil and agricultural commodities [38,49]. Specifically, we chose the daily closing prices of Cushing, Oklahoma Crude Oil Future Contract 1, which is traded on the New York Mercantile Exchange (NYMEX) and specifies the earliest delivery date. The price series’ returns were calculated as ln p t ln p t 1 .
Table 1 shows the results of the descriptive statistics of each return series during the sample period. As shown in Table 1, the standard deviation of WTI crude oil future returns was much greater than any of China’s biofuel feedstock future returns, showing a more significant fluctuation in the international crude oil market, which was also supported by the gap between the maximum and minimum values. We observed that corn and soybean were left-skewed, while wheat and oil were positively skewed. The kurtosis statistics suggest that high-peak and fat-tail properties characterized all returns. In particular, the values of the excess kurtosis for wheat returns were much higher in the three biofuel-related commodities, implying higher probabilities for extreme values than in the other commodities. As evidenced by the Jarque–Bera tests, the normal distribution assumption was strongly rejected for all series. Moreover, the stationary of the series have been examined by the DF-GLS tests. The results show that the null unit root hypothesis was rejected at the 1% significance level for all series, implying that all returns were stationary. Finally, we assessed the dependence in the squared series using Engle’s ARCH test (Lagrange multiplier test) and found significant conditional heteroscedasticity effects existing in all the series.
Figure 1 demonstrates the returns trajectory of crude oil and biofuel feedstock commodities. This preliminary chartist analysis exhibits the co-movements between the prices of global crude oil and biofuel feedstock commodities in China. It reveals that crude oil can play a hedging role against biofuel feedstock commodities in China [50]. Figure 2 shows the conditional volatility of biofuel-related commodity futures, resulting from market demand and military actions. The conditional volatility was measured using a GARCH (1, 1) model. Note that all three commodity futures presented considerable volatility from 2010/4 onwards when China’s first stock index futures (CSI 300 stock index futures) were traded on the open market. As a result, institutional investors had more space to participate in asset allocation.

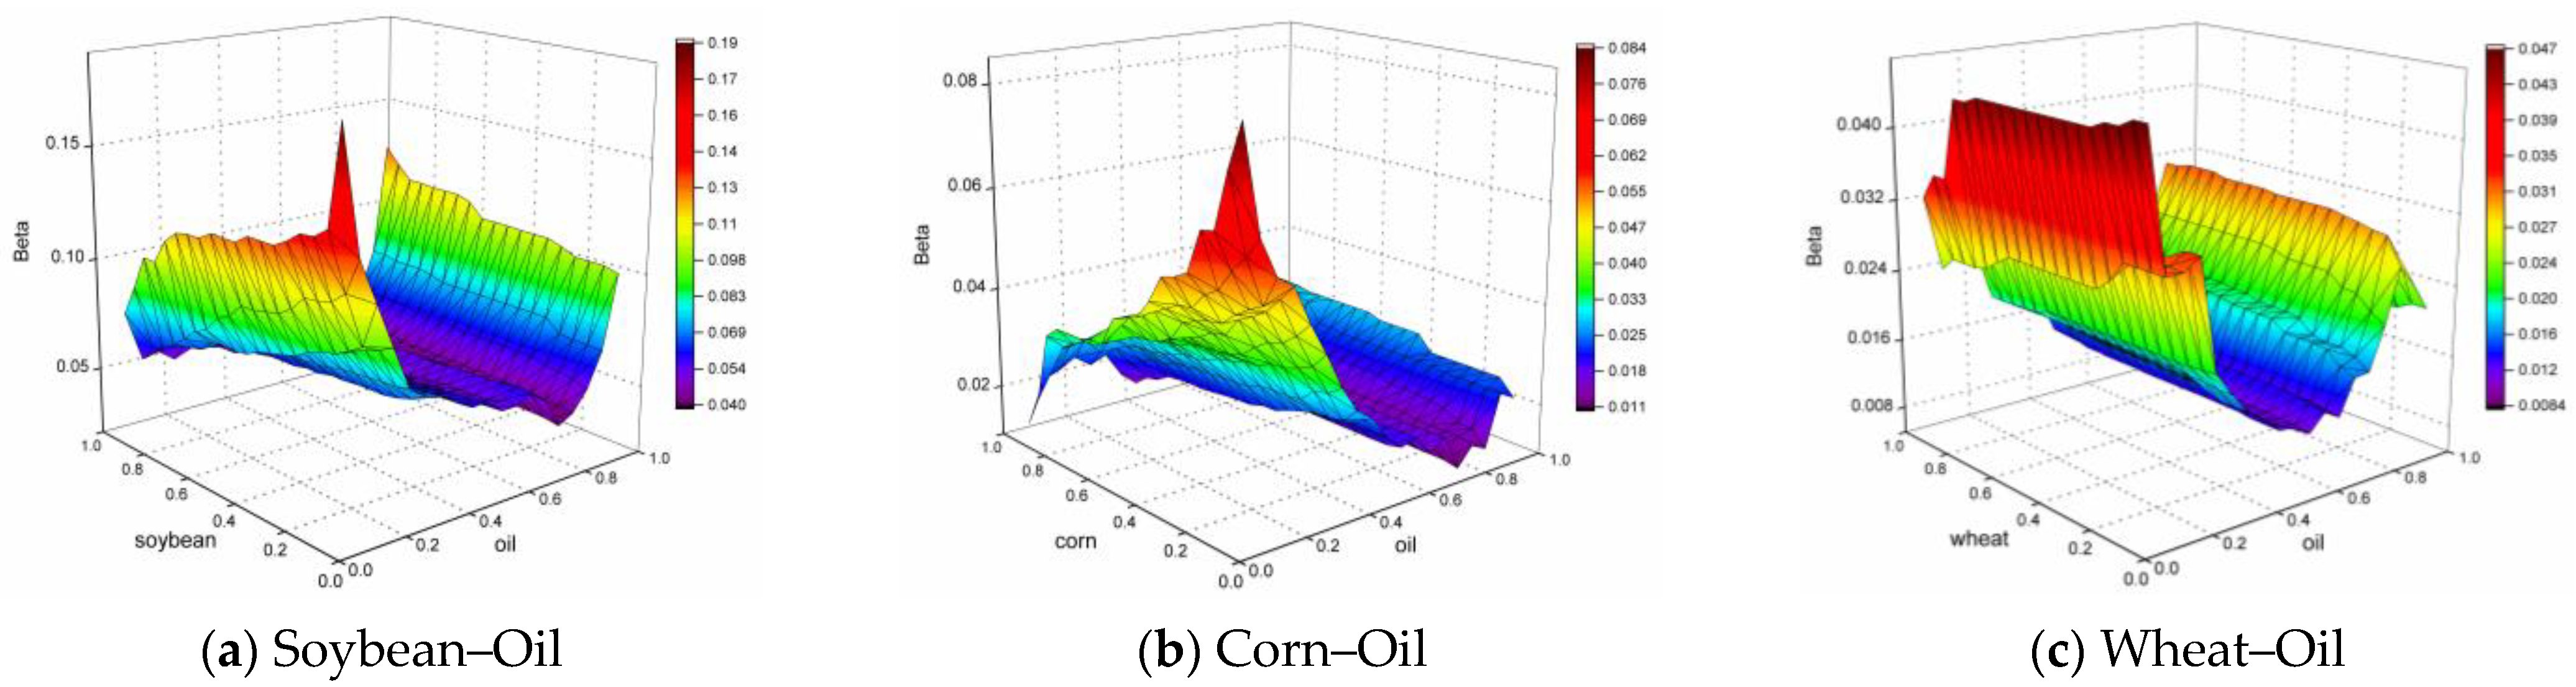
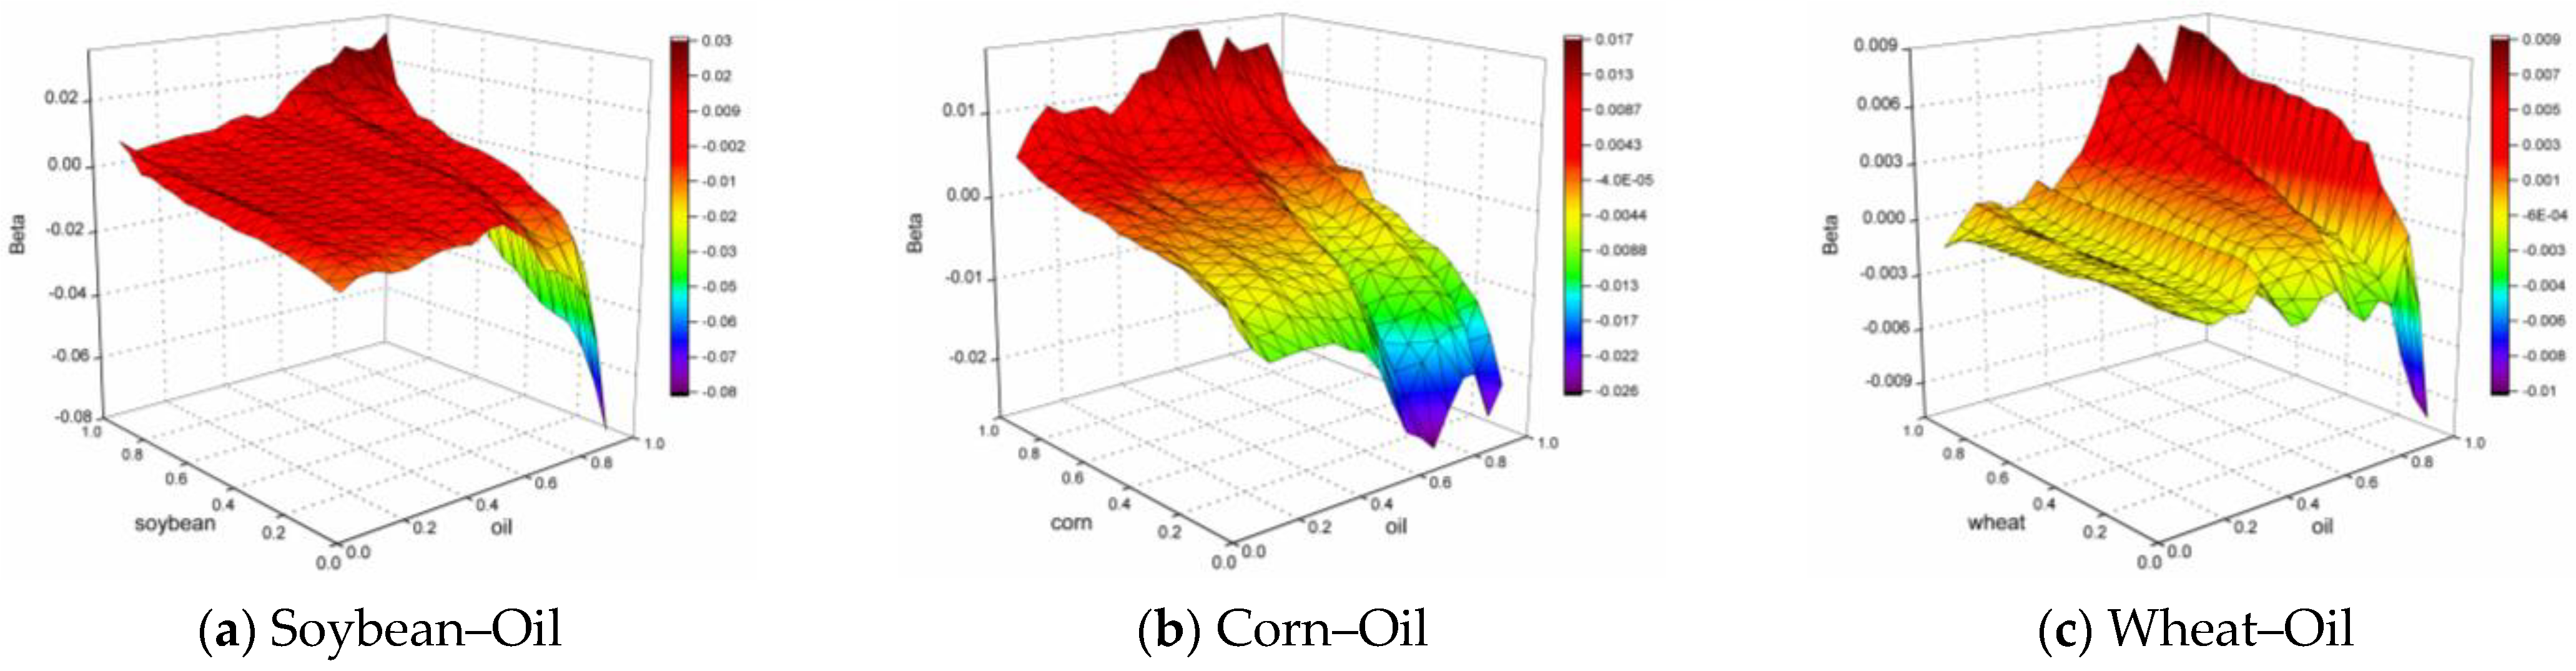
4.2. Quantile-On-Quantile Regression
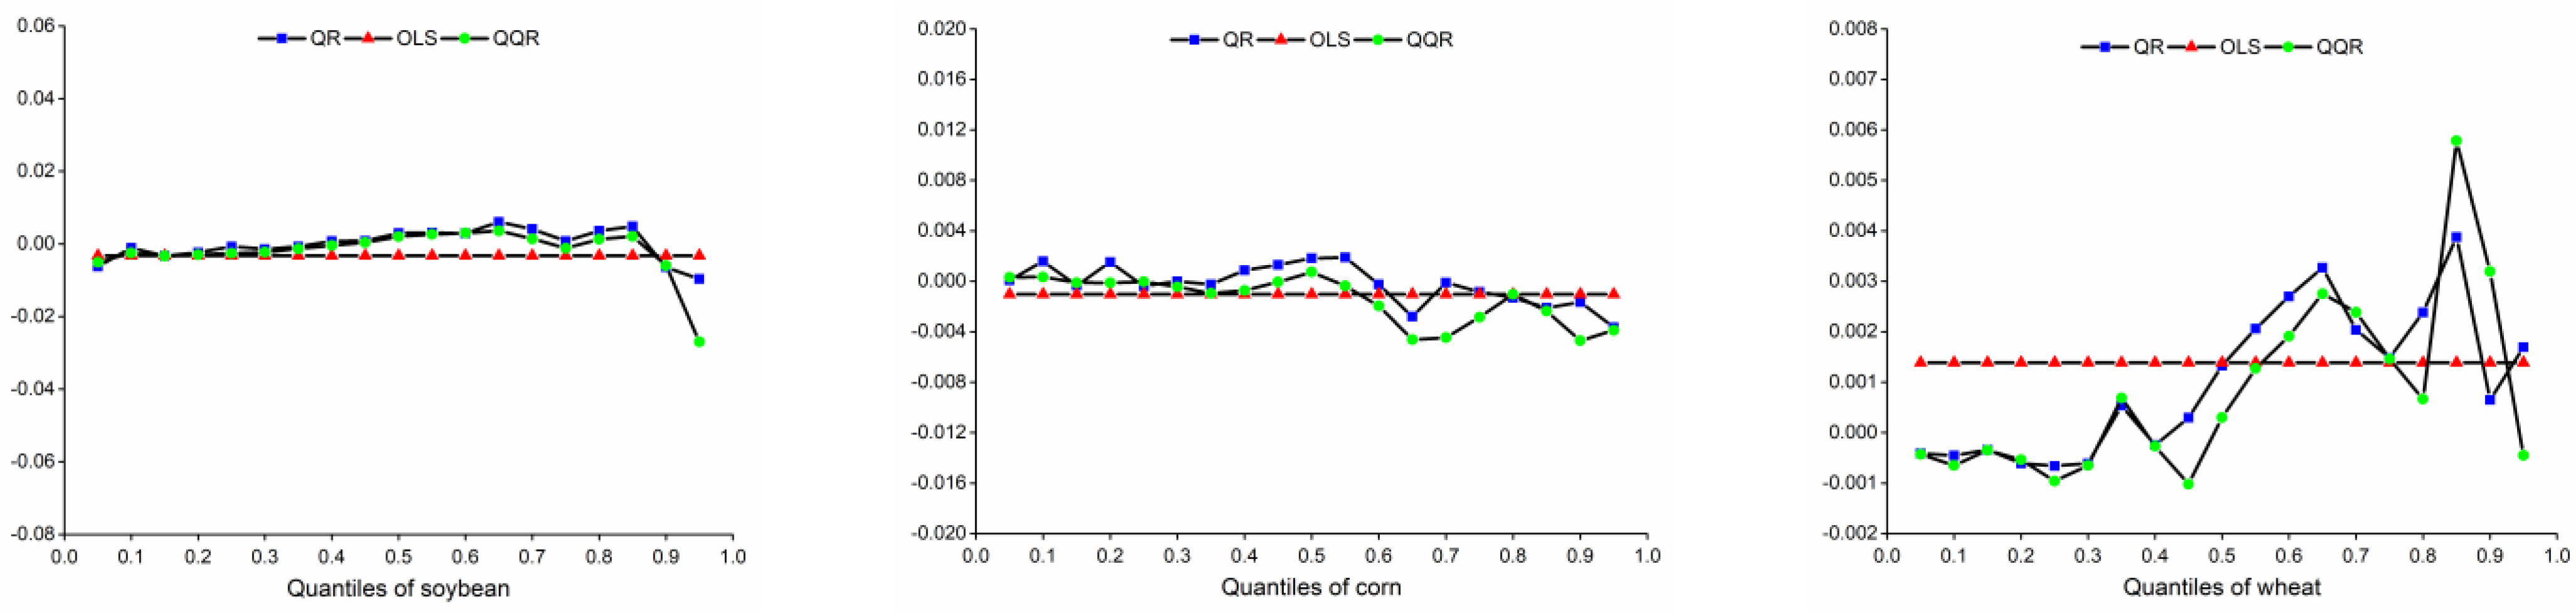
The QQR model was developed to uncover the two-dimensional dependences between the variables considering the impact of the quantiles of independent variables. Figure 3 demonstrates the slope parameter estimates α 1 θ ( x τ ) , which capture the quantile effects of WTI crude oil future returns on China’s biofuel feedstock commodity returns. These estimations can be viewed on the z-axis against the quantiles of commodity future returns ( θ ) and crude oil future returns ( τ ). According to the estimates in Figure 3, we obtained some interesting results. Firstly, there was a generally positive relationship between biofuel feedstock commodities and crude oil futures, making global oil futures suitable for hedging against China’s biofuel feedstock commodities, in line with the findings of Jiang et al. [10], and Mokni and Ben-Salha [11]. Secondly, the QQR model captured some surprising results by considering different τ th quantiles of oil returns. As shown in Figure 3, all the strongest linkages emerged at the extreme quantiles of crude oil or biofuel feedstock commodity returns. Table 2 provides several selected quantile estimates. We found that when the global oil market was in a bearish condition, crude oil returns had significant effects on biofuel feedstock commodity returns when the commodity market in China was in a bearish state. Similarly, we also found significant effects when both markets were in bullish conditions.
Figure 4 shows the estimates of the quantile effects that returns of crude oil futures had on selected commodities’ volatility in China. Tail effects are observed in the results. The influence of the bearish or bullish crude oil market was significant on the lower quantiles of biofuel feedstock commodity volatility, except for wheat. However, we did not find a generally positive or negative effect of crude oil returns on biofuel feedstock commodity volatility in China. The impact of lower/higher quantiles of crude oil future returns was negative/positive on the lower quantiles of China’s biofuel feedstock commodity volatility, which means the linkages between oil returns and commodity volatility were asymmetric across the quantiles and were related to both the sign and size of the oil price movement. We attribute the state-dependent nexus to the overreaction of market participations on the extreme market conditions. For example, in bearish market conditions, the participations tend to be more sensitive to unfavorable, news which leads to the negative effects. In contrast, the predictability of the futures market is enhanced during bullish market conditions, which leads to positive effects [38].
Finally, we found that the nexus between crude oil and biofuel-related commodities was heterogeneous depending on θ and τ , which cannot be fully depicted by the conventional quantile regression method. The movements of oil prices influenced the planting cost of biofuel agricultural commodities through agricultural products. By considering the retail planting of private land, the oil-related costs accounted for 39% of China’s material and service costs after removing land costs and labor costs. The rise in production cost drove the variation in agricultural risk, which is more evident in corn and soybean. The relationship was also associated with the application of policies to improve biofuel production.

4.3. Validity Test

In our study, the innovative modeling feature of the QQR method is the detailed information that the model provides about linkages between movements of crude oil prices and the returns/volatility of biofuel feedstock commodities in China. Because the QQR estimates are analyses of conventional quantile regression estimations, we aggregated the QQR estimates by averaging along τ and compared them with the QR estimates to test the validity of the QQR method. The recovered slope parameter γ ( θ ) was aggregated as follows:
γ ( θ ) β ^ θ _ ( x τ ) = 1 S τ β ^ θ ( x τ )
where S is the number of considered crude oil quantiles.
Figure 5 and Figure 6 compare the aggregated slope parameters of the QQR method against the conventional QR estimates and OLS results. We discovered that the recovered QQR estimates were quite similar to the QR estimates for both return and volatility cases for all θ - th quantiles. Therefore, the critical feather of the QR approach can be stored in the QQR method. However, it shows more thorough information indexed by τ , accounting for the impact of the predicted variables.

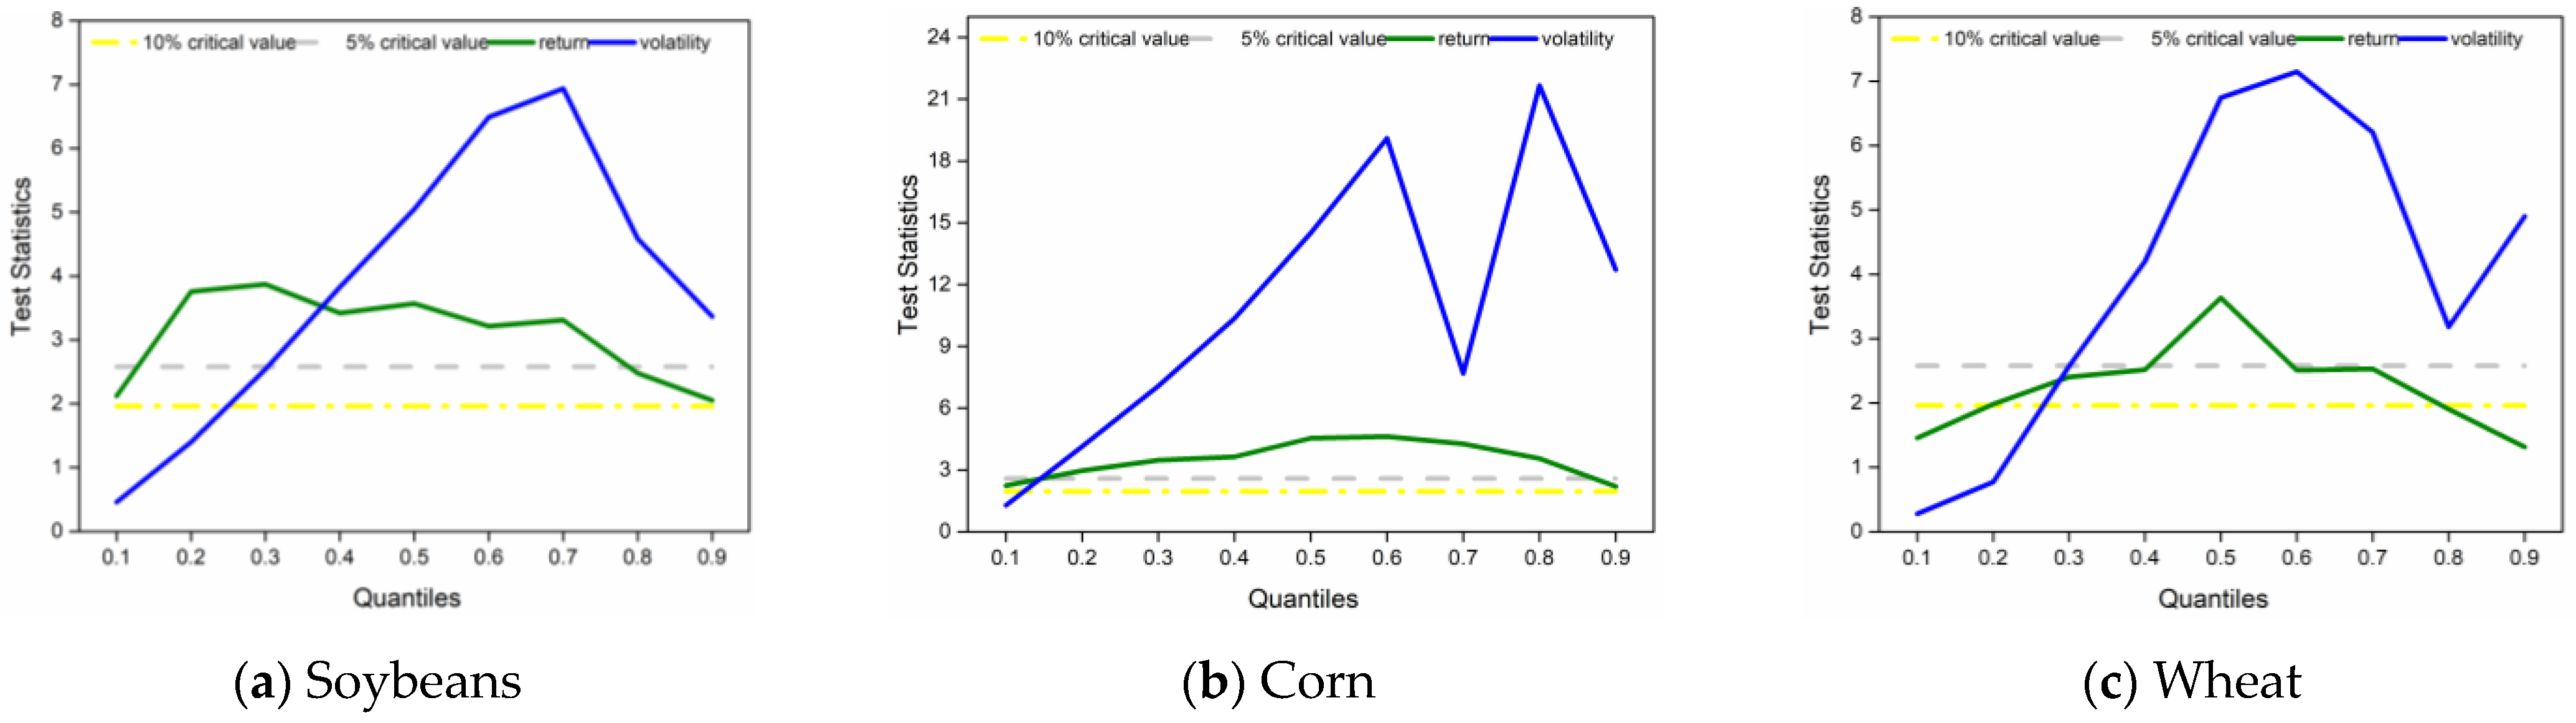
4.4. Causality-In-Quantiles Test

Subsequently, we tested the nonlinear causality from crude oil returns to the returns/volatility of the biofuel feedstock commodity futures in China using the nonparametric causality-in-quantiles approach. The causality-in-quantiles approach is data-driven and is insensitive to outliers, structural breaks, nonlinear dependence, etc. Moreover, asymmetric causality relationships can be captured, taking care of fat tails in the commodity return series by applying Granger causality tests conditional on all market states, instead of just the distribution center [51]. Firstly, we used the BDS test to detect the nonlinear relationship of the residuals of the VAR (1) model for the oil returns–commodity returns nexus and oil returns–commodity volatility nexus. The test outcomes are presented in Table 3.
For all the commodities, significant statistics against the null hypothesis were observed at embedded dimensions m = 2,3 , 4,5 , 6 , presenting strong and robust evidence of nonlinearity in both nexuses. In other words, linear Granger causality tests may not be reliable because of the nonlinear dependence of the variables (The linear Granger causality test can be found in Appendix A, and we can’t find significant causality from crude oil returns to the returns of corn and wheat, and from oil returns to the volatility of soybeans and wheat). For this reason, we turned to the causality-in-quantiles test to examine the causality across the whole distribution.
Figure 7 presents the trajectory evolution of the causality-in-quantiles results from the oil returns to the returns/volatility of China’s biofuel feedstock commodities. The horizontal gray dashed line represents the 5% critical value line, and the horizontal dot-dashed line represents the 10% critical value line. The solid green lines show the test statistics for the oil returns–commodity returns nexus, and the blue lines correspond to the oil returns–commodity volatility nexus. Further, the estimated statistics and p-values for all three commodities at selected quantiles are summarized in Table 4. According to the quantiles of the distribution, we categorized the markets as normal (0.4–0.6 quantile range), bullish (0.9–1 quantile range), and bearish (0–0.1 quantile range).
According to Figure 7, the trajectory evolution of the causality tests for all the selected Chinese biofuel feedstock commodity returns reveals significant causality over the entire conditional distribution, except for wheat at higher and lower quantiles. According to the test statistics and the classification of the quantiles above, the null hypothesis, which claims crude oil returns do not have Granger causality concerning China’s biofuel feedstock commodity returns, was rejected under normal market conditions at the significance level of 5% for all three commodities. We conclude that crude oil returns have strong predictive power for the returns of China’s biofuel feedstock commodities at a significance level of 10% under all types of market conditions, in accordance with the findings of Yoon [42]. The only exception is wheat in both bullish and bearish market conditions, consistent with the results of Hernandez et al. in the US commodity futures market [52]. To be noticed, the transmission mechanism can also be affected by the imperfect feedstock marketization and the consumption from the food industry [6].
Regarding volatility, we found significant Granger causality from crude oil returns to the volatility of China’s biofuel feedstock commodities for all quantiles, except for the lower quantiles. The results provide evidence of the predictive power of crude oil on the GARCH-based volatility of China’s commodity futures over the quantile range greater than 0.3, indicating that the global oil market changes in connection with the volatility of China’s biofuel feedstock commodity futures in normal and bullish market conditions. From the results, we suggest that investors in the biofuel feedstock commodity market in China should try to obtain information from the global oil predictors to possibly further their investment decisions when the market is in a normal or bullish mode. Note that the causality curves are all hump-shaped, indicating a robust conditional causality around the normal phase. The strength of the causality nexus declines when the quantiles are extremely low and high. Further, the left-tailed curves show asymmetric causality across the quantiles, where the linear and nonlinear models cannot detect the causality, indicating that investment and risk management strategies should be adjusted during recessions.

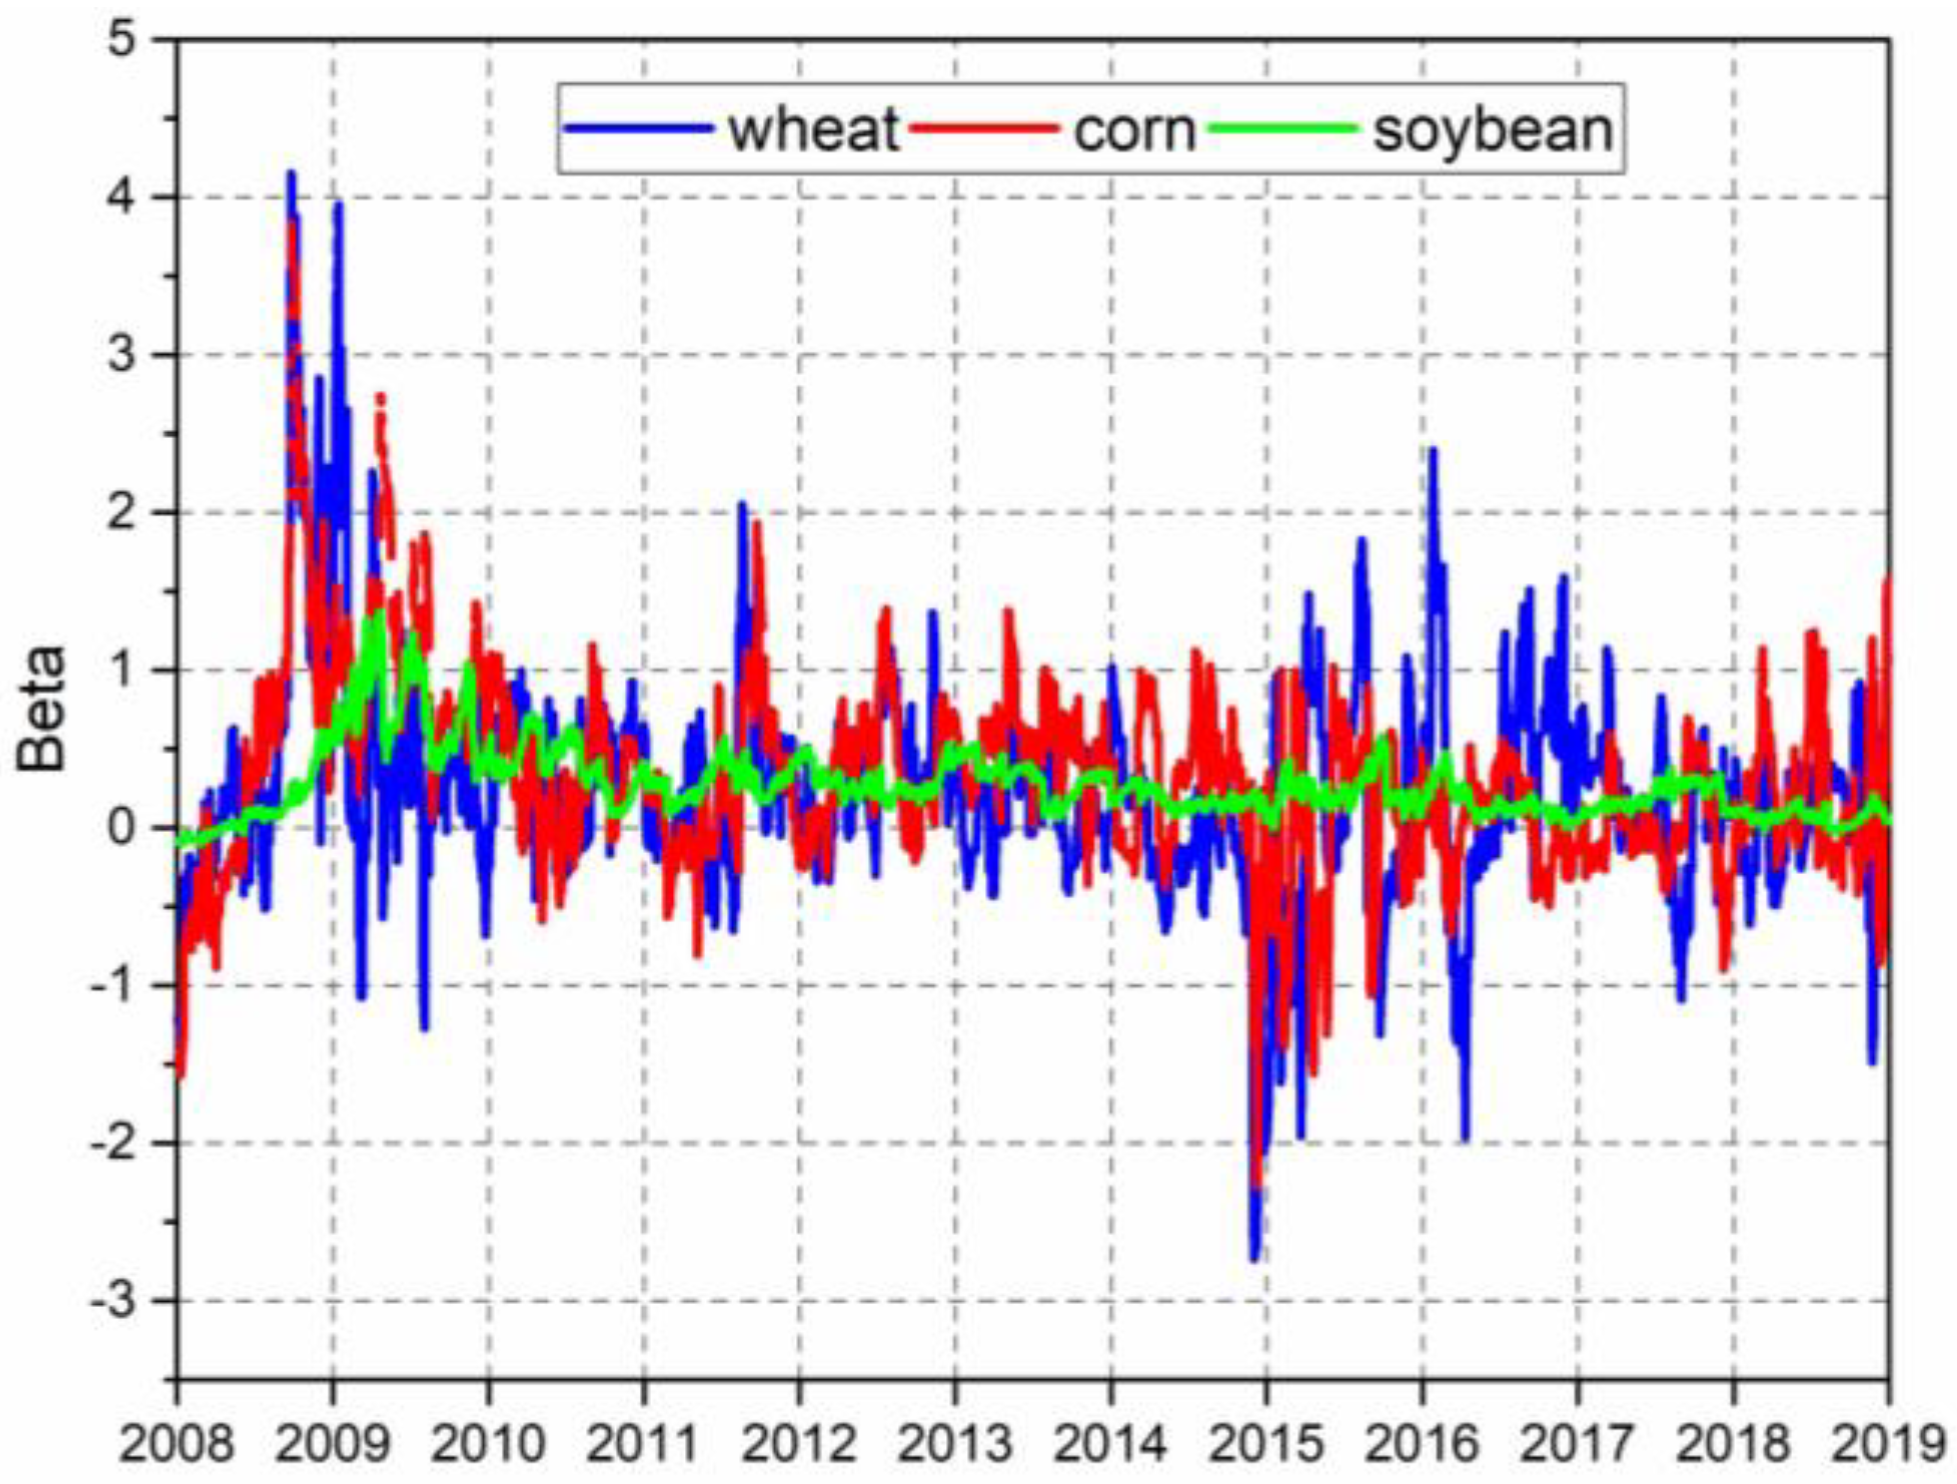
4.5. Portfolio Hedging Analysis and Policy Implications

We conducted a portfolio risk analysis by assessing the impact of the biofuel-related commodity dynamics in China on oil portfolio hedging strategies and risk management. The optimal weights of the respective commodity in the oil portfolio at time t are provided by the following:
w i , t = h o i l , t h ( o i l , i ) , t h i , t 2 h ( o i l , i ) , t + h o i l , t
where h o i l , t represents the conditional volatility of crude oil and h i , t is the conditional volatility of i (where i represents corn, wheat, and soybean); h ( o i l , i ) , t is the conditional covariance between oil and biofuel-related commodities; and w i , t ranges between 0 and 1, where w i , t = 0 if w i , t < 0 and w i , t = 1 if w i , t > 1 . We applied the GARCH (1, 1) model to compute the conditional volatility and covariance. Based on the optimal weights, single-period log returns of the portfolio were calculated as follows:
R t i , o i l = log ( w t e R i , t + ( 1 w t ) e R o i l , t )
where R i , t and R o i l , t are the compounded log returns for biofuel commodities and crude oil, respectively. Furthermore, we calculated the optimal hedge ratios as follows:
β i , t = h ( o i l , i ) , t h i , t
To minimize the risk of the portfolio, we invested β i , t dollars at a short position in crude oil to hedge a one-dollar long position in the commodity (corn, wheat, or soybean). Note that β i , t is also considered a realized beta, as shown in Figure 8. The trajectory of realized betas has important implications, such as the peaks in late 2008, implying that holding a position in the biofuel feedstock commodities at that time would result in higher hedging costs, and more positions in crude oil are needed in the portfolio to minimize the risk.
Moreover, to evaluate the performance of the hedging portfolios, we tested the risk reduction effectiveness of the oil–commodity portfolio with a benchmark portfolio composed of biofuel feedstock commodities only. The risk reduction effectiveness index is as follows:
R R E t = ( Var u n h e d g e d Var h e d g e d ) / Var u n h e d g e d
where Var u n h e d g e d and Var h e d g e d represent the variances for the benchmark portfolio and portfolio hedged with oil futures, respectively. Figure 9 displays the risk reduction effectiveness for each biofuel feedstock commodity in China year after year. A higher value indicates a larger risk reduction and higher hedging effectiveness. As shown in Figure 9, There is particular evidence of all the biofuel feedstocks with apparent and enhanced reduction in portfolio risk. The improvement in the risk reduction effectiveness of the portfolios was associated with the global financial crisis in 2008 and the oil crisis in 2015. Moreover, because soybean is considered both a food crop and a cash crop, it can receive a higher hedging effectiveness than wheat and corn [53]. Both the realized betas and the risk reduction effectiveness index support the co-movement of China’s biofuel feedstock commodities with global crude oil [33].
Overall, our findings reject the oil–commodity neutrality hypothesis for biofuel feedstock commodities, which is in keeping with the conclusions of Gohin and Chantret, and Hernandez et al. for the US agricultural prices [31,33], and Luo and Ji for China’s agricultural commodity market [44]. More market-oriented agricultural products would make the domestic market more sensitive to international crude oil prices. However, our results contradict the findings from Turkey based on a linear causality analysis reported by Nazlioglu and Soytas [32]. They suggest re-examining this issue using the nonlinear method to explore the asymmetric effect. Moreover, according to Zhang et al. and Chen [33,53], the irrationality of many individual investors in China generates asymmetric impacts on the commodity market, making the commodity market more sensitive to the international oil market. Due to the irrational behavior of investors, more speculation will occur in the commodity market and increase the risk of the commodity futures market in China.

5. Conclusions

Biofuel production has increased steadily over the past two decades, and food crops are the primary feedstocks for conventional biofuel production in emerging and developing countries. As a substitute of traditional fuels, the considerable increase in biofuel production strengthens the linkage of fossil energy and biofuel feedstock commodities. However, the dependence between prices of energy and biofuel feedstocks is not conclusive for China, whose biofuel production process greatly depends on agricultural commodities. At present, China has a large impact on the biofuel market as the third largest bioethanol production country in the world. This has important implications for exploring the links between oil and China’s biofuel feedstock commodities. This research examined the distributional dependence of crude oil and biofuel feedstock commodities in China using the QQR model, showing a comprehensive and conducive picture of the linkage. Furthermore, the nonparametric causality-in-quantiles test was applied to test the predictive power of crude oil returns on the returns/volatility of biofuel feedstock commodities in China.
First, the nexus between crude oil and biofuel-related commodities was heterogeneous across quantiles. There existed a generally positive relationship between crude oil and biofuel feedstock commodity returns, which makes global oil futures suitable for hedging against China’s biofuel feedstock commodities. In particular, the impacts of the bearish/bullish crude oil market on biofuel feedstock commodity returns were more significant when the commodity market in China was in a bearish/bullish state compared with when in a normal state. However, although we did not find a generally positive or negative impact of crude oil returns on biofuel feedstock commodity volatility in China, sufficient evidence of asymmetry and tail effects is shown in the results. For example, the impact of lower/higher quantiles of crude oil returns was negative/positive on the lower quantiles of China’s biofuel feedstock commodity volatility. Second, all the selected Chinese biofuel feedstock commodity returns revealed significant causality over the entire conditional distribution, except for wheat at higher and lower quantiles. The global oil market changes matter for the volatility of China’s biofuel-related commodity market in normal and bullish market conditions. Note that the causality curves are all hump-shaped, indicating a robust conditional causality around the normal phase. The strength of the causality nexus declines when the quantiles are extremely low and high. Third, the risk reduction effectiveness of soybean and corn was significant, while for wheat, this reduction in portfolio risk was less apparent and enhanced. Additionally, it is worth noting that the risk reduction effectiveness increased significantly during the financial and oil crises.
The implications of the empirical results suggest that investors of China’s biofuel feedstock commodities need to take into account global crude oil futures to possibly improve their investment decisions, considering the entire conditional distribution rather than just the center of the distribution. In extremely depressed oil market conditions, investors can consider biofuel feedstocks as a hedging tool in crude oil portfolios to be used against oil market risk. Especially under the shock of extreme events, investors can prioritize corn and soybean as effective risk reduction tools. These findings are crucial to understanding the interplay between global oil and biofuel-related commodities in China and evaluating portfolio diversification opportunities. In addition, the government should advocate the green investment concept to investors and promote the smooth operation of the biofuel feedstock market, so as to increase the production and consumption of biofuel as a clean energy, to reduce greenhouse gas emissions, and to promote food security and environmental sustainability. Overall, our findings can help investors in financial markets to optimize asset allocation and risk management, and policy makers to maintain the stability of energy-related commodity markets, as the commodities analyzed in this study are important assets traded in financial markets after the financialization of commodity markets.

Author Contributions

Conceptualization, L.H.; methodology, L.H., H.Z. and K.H.; software, L.H. and M.S.; investigation, L.H., H.Z. and K.H.; Writing—review and editing, L.H., M.S. and K.H.; visualization, H.Z. and L.H.; funding acquisition, K.H., L.H. and H.Z. All authors have read and agreed to the published version of the manuscript.

Funding

This research was funded by the National Natural Science Foundation of China with grant numbers 72101228 and 71671062, and was funded by the Zhejiang Province Social Science Foundation, grant number 21NDJC182YB.

Institutional Review Board Statement

Not applicable.

Informed Consent Statement

Not applicable.

Data Availability Statement

The data will be made available upon reasonable request.

Conflicts of Interest

The authors declare no conflict of interest.

Appendix A

Table A1. Linear Granger causality tests.
StatisticsF-Statisticp-ValueOrder of VAR (p)
Null hypothesis (1): Crude oil does not Granger cause agricultural commodities returns
Soybean19.42430.00001
Corn1.045680.30661
Strong Wheat0.014370.90461
Null hypothesis (2): Crude oil does not Granger cause agricultural commodities volatility
Soybean0.694720.40461
Corn5.708880.01701
Strong Wheat0.638050.42451
Note: Order of the VAR model is selected based on SIC.

References

  1. Raschke, A.; Hernandez-Suarez, J.S.; Nejadhashemi, A.P.; Deb, K. Multidimensional Aspects of Sustainable Biofuel Feedstock Production. Sustainability 2021, 13, 1424. [Google Scholar] [CrossRef]
  2. Dumortier, J.; Carriquiry, M.; Elobeid, A. Where does all the biofuel go? Fuel efficiency gains and its effects on global agricultural production. Energy Policy 2021, 148, 111909. [Google Scholar] [CrossRef]
  3. Tiwari, A.K.; Abakah, E.J.A.; Adewuyi, A.O.; Lee, C.C. Quantile risk spillovers between energy and agricultural commodity markets: Evidence from pre and during COVID-19 outbreak. Energy Econ. 2022, 113, 106235. [Google Scholar] [CrossRef]
  4. Guo, J.; Tanaka, T. Energy security versus food security: An analysis of fuel ethanol-related markets using the spillover index and partial wavelet coherence approaches. Energy Econ. 2022, 112, 106142. [Google Scholar] [CrossRef]
  5. Cao, B.; Bai, C.; Zhang, M.; Lu, Y.; Gao, P.; Yang, J.; Xue, Y.; Li, G. Future landscape of renewable fuel resources: Current and future conservation and utilization of main biofuel crops in China. Sci. Total Environ. 2022, 806, 150946. [Google Scholar] [CrossRef]
  6. Zhang, J.; Lin, Z.; Li, J. Analyzing the risk spillovers of international crude oil on China’s corn and biofuel ethanol markets: A transition toward green economy and environmental sustainability. Energy Environ. 2022, 0958305X221140566. [Google Scholar] [CrossRef]
  7. El Montasser, G.; Belhoula, M.M.; Charfeddine, L. Co-explosivity versus leading effects: Evidence from crude oil and agricultural commodities. Resour. Policy 2023, 81, 103331. [Google Scholar] [CrossRef]
  8. McKnight, C.; Qiu, F.; Luckert, M.; Hauer, G. Prices for a second-generation biofuel industry in Canada: Market linkages between Canadian wheat and US energy and agricultural commodities. Can. J. Agric. Econ. /Rev. Can. D’agroeconomie 2021, 69, 337–351. [Google Scholar] [CrossRef]
  9. Cui, J.; Goh, M.; Zou, H. Coherence, extreme risk spillovers, and dynamic linkages between oil and China’s commodity futures markets. Energy 2021, 225, 120190. [Google Scholar] [CrossRef]
  10. Jiang, Y.; Lao, J.; Mo, B.; Nie, H. Dynamic linkages among global oil market, agricultural raw material markets and metal markets: An application of wavelet and copula approaches. Phys. A Stat. Mech. Its Appl. 2018, 508, 265–279. [Google Scholar] [CrossRef]
  11. Mokni, K.; Ben-Salha, O. Asymmetric causality in quantiles analysis of the oil-food nexus since the 1960s. Resour. Policy 2020, 69, 101874. [Google Scholar] [CrossRef]
  12. Youssef, M.; Mokni, K. On the nonlinear impact of oil price shocks on the world food prices under different markets conditions. Int. Econ. J. 2021, 35, 73–95. [Google Scholar] [CrossRef]
  13. Ciaian, P.; Kancs, D. Food, energy and environment: Is bioenergy the missing link? Food Policy 2011, 36, 571–580. [Google Scholar] [CrossRef] [Green Version]
  14. Serra, T.; Zilberman, D.; Gil, J.M.; Goodwin, B.K. Nonlinearities in the US corn-ethanol-gasoline price system. Agric. Econ. 2011, 42, 35–45. [Google Scholar] [CrossRef]
  15. Wu, F.; Guan, Z.; Myers, R.J. Volatility Spillover Effects and Cross Hedging in Corn and Crude Oil Futures. J. Futures Mark. 2011, 31, 1052–1075. [Google Scholar] [CrossRef]
  16. Myers, R.J.; Johnson, S.R.; Helmar, M.; Baumes, H. Long-run and Short-run Co-movements in Energy Prices and the Prices of Agricultural Feedstocks for Biofuel. Am. J. Agric. Econ. 2014, 96, 991–1008. [Google Scholar] [CrossRef]
  17. Shahzad, S.J.H.; Hernandez, J.A.; Al-Yahyaee, K.H.; Jammazi, R. Asymmetric risk spillovers between oil and agricultural commodities. Energy Policy 2018, 118, 182–198. [Google Scholar] [CrossRef]
  18. Mensi, W.; Tiwari, A.; Bouri, E.; Roubaud, D.; AI-Yahyaee, K.H. The dependence structure across oil, wheat, and corn: A wavelet-based copula approach using implied volatility indexes. Energy Econ. 2017, 66, 122–139. [Google Scholar] [CrossRef]
  19. Umar, Z.; Gubareva, M.; Naeem, M.; Akhter, A. Return and volatility transmission between oil price shocks and agricultural commodities. PLoS ONE 2021, 16, e0246886. [Google Scholar] [CrossRef] [PubMed]
  20. Lucotte, Y. Co-movements between crude oil and food prices: A post-commodity boom perspective. Econ. Lett. 2016, 147, 142–147. [Google Scholar] [CrossRef]
  21. Kang, S.H.; Tiwari, A.K.; Albulescu, C.T.; Yoon, S.M. Exploring the time-frequency connectedness and network among crude oil and agriculture commodities V1. Energy Econ. 2019, 84, 104543. [Google Scholar] [CrossRef]
  22. Kumar, S.; Tiwari, A.K.; Raheem, I.D.; Hille, E. Time-varying dependence structure between oil and agricultural commodity markets: A dependence-switching CoVaR copula approach. Resour. Policy 2021, 72, 102049. [Google Scholar] [CrossRef]
  23. Umar, Z.; Jareño, F.; Escribano, A. Agricultural commodity markets and oil prices: An analysis of the dynamic return and volatility connectedness. Resour. Policy 2021, 73, 102147. [Google Scholar] [CrossRef]
  24. Naeem, M.A.; Karim, S.; Hasan, M.; Lucey, B.M.; Kang, S.H. Nexus between oil shocks and agriculture commodities: Evidence from time and frequency domain. Energy Econ. 2022, 112, 106148. [Google Scholar] [CrossRef]
  25. Wang, K.H.; Kan, J.M.; Qiu, L.; Xu, S. Climate policy uncertainty, oil price and agricultural commodity: From quantile and time perspective. Econ. Anal. Policy 2023, 78, 256–272. [Google Scholar] [CrossRef]
  26. Sim, N.; Zhou, H. Oil prices, US stock return and the dependence between their quantiles. J. Bank. Financ. 2015, 55, 1–8. [Google Scholar] [CrossRef]
  27. Bonato, M. Realized correlations, betas and volatility spillover in the agricultural commodity market: What has changed? J. Int. Financ. Mark. Inst. Money 2019, 62, 184–202. [Google Scholar] [CrossRef]
  28. Filip, O.; Janda, K.; Kristoufek, L.; Zilberman, D. Food versus fuel: An updated and expanded evidence. Energy Econ. 2019, 82, 152–166. [Google Scholar] [CrossRef] [Green Version]
  29. Hanson, K.; Robinson, S.; Schluter, G. Sectoral effects of a world oil price shock: Economywide linkages to the agricultural sector. J. Agric. Resour. Econ. 1993, 18, 96–116. [Google Scholar]
  30. Zhang, Z.; Lohr, L.; Escalante, C.; Wetzstein, M. Food versus fuel: What do prices tell us? Energy Policy 2010, 38, 445–451. [Google Scholar] [CrossRef]
  31. Gohin, A.; Chantret, F. The long-run impact of energy prices on world agricultural markets: The role of macro-economic linkages. Energy Policy 2010, 38, 333–339. [Google Scholar] [CrossRef] [Green Version]
  32. Nazlioglu, S.; Soytas, U. World oil prices and agricultural commodity prices: Evidence from an emerging market. Energy Econ. 2011, 33, 488–496. [Google Scholar] [CrossRef]
  33. Chen, P. Global oil prices, macroeconomic fundamentals and China’s commodity sector co-movements. Energy Policy 2015, 87, 284–294. [Google Scholar] [CrossRef]
  34. Fernandez-Diaz, J.M.; Morley, B. Interdependence among agricultural commodity markets, macroeconomic factors, crude oil and commodity index. Res. Int. Bus. Financ. 2019, 47, 174–194. [Google Scholar] [CrossRef] [Green Version]
  35. Natanelov, V.; McKenzie, A.M.; Huylenbroeck, G.V. Crude oil-corn-ethanol—Nexus: A contextual approach. Energy Policy 2013, 63, 504–513. [Google Scholar] [CrossRef]
  36. Fowowe, B. Do oil prices drive agricultural commodity prices? Evidence from South Africa. Energy 2016, 104, 149–157. [Google Scholar] [CrossRef]
  37. Gomes, G.; Hache, E.; Mignon, V.; Paris, A. On the current account—Biofuels link in emerging and developing countries: Do oil price fluctuations matter? Energy Policy 2018, 116, 60–67. [Google Scholar] [CrossRef] [Green Version]
  38. Hau, L.; Zhu, H.; Huang, R.; Ma, X. Heterogeneous dependence between crude oil price volatility and China’s agriculture commodity futures: Evidence from quantile-on- quantile regression. Energy 2020, 213, 118781. [Google Scholar] [CrossRef]
  39. Fernandez-Perez, A.; Frijns, B.; Tourani-Rad, A. Contemporaneous interactions among fuel, biofuel and agricultural commodities. Energy Econ. 2016, 58, 1–10. [Google Scholar] [CrossRef]
  40. Pal, D.; Mitra, S.K. Diesel and soybean price relationship in the United States: Evidence from a quantile autoregressive distributed lag model. Empir. Econ. 2017, 52, 1609–1626. [Google Scholar] [CrossRef]
  41. Su, C.W.; Wang, X.-Q.; Tao, R.; Oana-Ramona, L. Do oil prices drive agricultural commodity prices? Further evidence in a global bio-energy context. Energy 2019, 172, 691–701. [Google Scholar] [CrossRef]
  42. Yoon, S.M. On the interdependence between biofuel, fossil fuel and agricultural food prices: Evidence from quantile tests. Renew Energy 2022, 199, 536–545. [Google Scholar] [CrossRef]
  43. Haixia, W.; Shiping, L. Volatility spillovers in China’s crude oil, corn and fuel ethanol markets. Energy Policy 2013, 62, 878–886. [Google Scholar] [CrossRef]
  44. Luo, J.; Ji, Q. High-frequency volatility connectedness between the US crude oil market and China’s agricultural commodity markets. Energy Econ. 2018, 76, 424–438. [Google Scholar] [CrossRef]
  45. Spencer, S.; Bredin, D.; Conlon, T. Energy and agricultural commodities revealed through hedging characteristics: Evidence from developing and mature markets. J. Commod. Mark. 2018, 9, 1–20. [Google Scholar] [CrossRef]
  46. Mo, B.; Chen, C.; Nie, H.; Jiang, Y. Visiting effects of crude oil price on economic growth in BRICS countries: Fresh evidence from wavelet-based quantile-on-quantile tests. Energy 2019, 178, 234–251. [Google Scholar] [CrossRef]
  47. Balcilar, M.; Gupta, R.; Kyei, C.; Wohar, M.E. Does economic policy uncertainty predict exchange rate returns and volatility? Evidence from a nonparametric causality-in-quantiles test. Open Econ. Rev. 2016, 27, 229–250. [Google Scholar] [CrossRef] [Green Version]
  48. Nishiyama, Y.; Hitomi, K.; Kawasaki, Y.; Jeong, K. A consistent nonparametric test for nonlinear causality—Specification in time series regression. J. Econom. 2011, 165, 112–127. [Google Scholar] [CrossRef] [Green Version]
  49. Chiu, F.-P.; Hsu, C.-S.; Ho, A.; Chen, C.-C. Modeling the price relationships between crude oil, energy crops and biofuels. Energy 2016, 109, 845–857. [Google Scholar] [CrossRef]
  50. Luo, J.; Zhang, Q. Risk contagions between global oil markets and China’s agricultural commodity markets under structural breaks. Appl. Econ. 2021, 53, 628–649. [Google Scholar] [CrossRef]
  51. Jena, S.K.; Tiwari, A.K.; Hammoudeh, S.; Roubaud, D. Distributional predictability between commodity spot and futures: Evidence from nonparametric causality-in- quantiles tests. Energy Econ. 2019, 78, 615–628. [Google Scholar] [CrossRef]
  52. Hernandez, J.A.; Shahzad, S.J.H.; Uddin, G.S.; Kang, S.H. Can agricultural and precious metal commodities diversify and hedge extreme downside and upside oil market risk? An extreme quantile approach. Resour. Policy 2019, 62, 588–601. [Google Scholar] [CrossRef]
  53. Zhang, C.; Qu, X. The effect of global oil price shocks on China’s agricultural commodities. Energy Econ. 2015, 51, 354–364. [Google Scholar] [CrossRef]
Figure 1. Time series of crude oil (red) and biofuel feedstock commodity (blue) prices.
Sustainability 15 08980 g001
Figure 2. GARCH-based conditional volatility of biofuel feedstock commodity futures.
Sustainability 15 08980 g002
Figure 3. Distributional dependence between biofuel feedstock commodity returns and oil returns applying the QQR approach. Note: The diagrams are the estimates of the slope parameters.
Sustainability 15 08980 g003
Figure 4. Distributional dependence between agricultural commodity volatility and oil returns applying the QQR approach. Note: The diagrams are the estimates of the slope parameters.
Sustainability 15 08980 g004
Figure 5. A comparison of the QQR, QR, and OLS estimates for the relationships between biofuel feedstock commodity and oil returns. Note: The left graph shows the test for the soybean–oil relationship, the middle graph shows the test for the corn–oil relationship, and the left graph shows the test for the wheat–oil relationship.
Sustainability 15 08980 g005
Figure 6. A comparison of the QQR, QR, and OLS estimates for the relationships between agricultural commodity volatility and oil returns. Note: The right graph shows the test for the soybean–oil relationship, the middle graph shows the test for the corn–oil relationship, and the left graph shows the test for the wheat–oil relationship.
Sustainability 15 08980 g006
Figure 7. Nonparametric causality-in-quantiles from oil market to the returns/volatility of biofuel-related commodities at different quantiles. Note: The horizontal dot-dashed and gray dashed lines indicate the 10% and 5% critical values, respectively. The horizontal axis signifies the quantiles, and the vertical axis shows the test statistics across quantiles.
Sustainability 15 08980 g007
Figure 8. Realized betas between oil and commodities in China.
Sustainability 15 08980 g008
Figure 9. The risk reduction effectiveness of the optimal hedging portfolios.
Sustainability 15 08980 g009
Table 1. Descriptive statistics of the returns.
StatsCrude OilWheatCornSoybean
Mean−0.00030.00010.0000−0.0002
Maximum0.16410.07200.04190.0648
Minimum−0.1307−0.0357−0.0550−0.0607
Std. Dev.0.02440.00630.00670.0109
Skewness0.12830.6273−0.4032−0.2393
Kurtosis7.659114.34049.87137.7046
Jarque–Bera2346.074014,026.84005157.47702409.5340
p-value0.00000.00000.00000.0000
DF-GLS−53.3531−3.2769−5.1562−3.9426
p-value0.00000.00110.00000.0001
ARCH (12)58.867310.544314.280045.9604
p-value0.00000.00000.00000.0000
Table 2. Quantile-on-quantile estimates of effects of oil futures on the biofuel feedstock market across quantiles.
θ τ ReturnVolatility
Soybean
Return
Corn
Return
Wheat
Return
Soybean
Volatility
Corn
Volatility
Wheat
Volatility
0.050.050.1857 ***0.0838 ***0.0465 **−0.0138 ***−0.0054 ***−0.0001
0.050.100.1435 ***0.0751 ***0.0465 **−0.0124 ***−0.0029 ***−0.0001
0.100.050.1325 ***0.0637 ***0.0316 **−0.0112 ***−0.0083 ***−0.0009
0.100.100.1173 ***0.0597 ***0.0316 **−0.0086 ***−0.0055 ***−0.0009
0.050.900.0892 ***0.01850.03520.0051 **0.0041 ***−0.0010
0.050.950.0755 ***0.01240.03240.0079 ***0.0049 ***−0.0014
0.100.900.0600 ***0.0275 **0.0254 *0.00250.0063 ***−0.0005
0.100.950.0528 ***0.0206 *0.0239 *0.0043 **0.0083 ***−0.0004
0.500.500.0551 ***0.0204 ***0.0120 ***0.00290.00100.0004
0.900.050.0673 ***0.0229 *0.0244 **−0.0493 ***−0.0245 ***−0.0037
0.900.100.0680 ***0.0229 *0.0267 **−0.0285 ***−0.0202 ***−0.0017
0.950.050.1000 ***0.02120.0214−0.0781 ***−0.0211 ***−0.0100
0.950.100.1017 ***0.02430.0214−0.0638 ***−0.0155 **−0.0092
0.900.900.0783 ***0.0307 **0.0282 **0.0187 **0.00940.0072
0.900.950.0783 ***0.0307 **0.0282 **0.0258 ***0.0144 **0.0079
0.950.900.1218 ***0.02880.00840.01410.00510.0022
0.950.950.1284 ***0.02880.00840.03040.01040.0045
Note: ***, **, and * indicate significance at the 1%, 5%, and 10% levels, respectively.
Table 3. The results of the BDS nonlinearity test.
Commoditym = 2m = 3m = 4m = 5m = 6
Strong wheat–crude oil8.9721
(0.0000)
11.6308
(0.0000)
12.8260
(0.0000)
14.1440
(0.0000)
15.6290
(0.0000)
Corn–crude oil9.7627
(0.0000)
11.8639
(0.0000)
13.6839
(0.0000)
15.7347
(0.0000)
17.4378
(0.0000)
Soybean–crude oil8.4444
(0.0000)
10.5052
(0.0000)
11.9044
(0.0000)
13.3646
(0.0000)
15.2567
(0.0000)
Notes: Entries indicate the z-statistic of the BDS test on the residuals of the VAR (1) model of oil futures and the agricultural market for various commodities. The probability value in brackets corresponds to the test with the null hypothesis of i.i.d., and m denotes the embedding dimension of the test.
Table 4. Causality-in-quantiles test.
Quantile0.10.20.30.40.50.60.70.80.9
Panel A: Return series
Soybean2.1253
(0.0168)
3.7575
(0.0001)
3.8715
(0.0001)
3.4177
(0.0003)
3.5704
(0.0002)
3.2153
(0.0007)
3.3093
(0.0005)
2.4788
(0.0066)
2.0531
(0.0200)
Corn2.2438
(0.0124)
2.9667
(0.0015)
3.4712
(0.0003)
3.6351
(0.0001)
4.5470
(0.0000)
4.6271
(0.0000)
4.2650
(0.0000)
3.5558
(0.0002)
2.1951
(0.0141)
Wheat1.4569
(0.0726)
1.9828
(0.0237)
2.4027
(0.0081)
2.5160
(0.0059)
3.6321
(0.0001)
2.5080
(0.0061)
2.5304
(0.0057)
1.9031
(0.0285)
1.3152
(0.0942)
Panel B: Volatility series
Soybean0.4595
(0.3229)
1.4008
(0.0806)
2.5371
(0.0056)
3.8287
(0.0001)
5.0473
(0.0000)
6.4913
(0.0000)
6.9388
(0.0000)
4.5854
(0.0000)
3.3668
(0.0004)
Corn1.2827
(0.0998)
4.1392
(0.0000)
7.0703
(0.0000)
10.3565
(0.0000)
14.5056
(0.0000)
19.1041
(0.0000)
7.6828
(0.0000)
21.6686
(0.0000)
12.7312
(0.0000)
Strong Wheat0.2771
(0.3909)
0.7751
(0.2191)
2.5714
(0.0051)
4.1992
(0.0000)
6.7443
(0.0000)
7.1475
(0.0000)
6.2050
(0.0000)
3.1839
(0.0007)
4.9007
(0.0000)
Note: The test is conditional on the exchange rate. The null hypothesis is that the oil future does not cause agricultural commodity returns in panel A, and the oil future does not cause agricultural commodity volatility in panel B. Entries in brackets are p-values.
Disclaimer/Publisher’s Note: The statements, opinions and data contained in all publications are solely those of the individual author(s) and contributor(s) and not of MDPI and/or the editor(s). MDPI and/or the editor(s) disclaim responsibility for any injury to people or property resulting from any ideas, methods, instructions or products referred to in the content.

