Abstract
Park green spaces serve as essential urban public recreation spaces and represent significant components of urban construction land. Investigating the quality of park green spaces is a vital requirement for the establishment of a high-quality urban living environment and the enhancement of land use efficiency. This study developed a quality evaluation index system for park green spaces in Shenyang, considering the constituent elements of recreational spaces. By categorizing 168 park spaces into four size grades and employing the entropy-TOPSIS method with multiple data sources, the research assessed and analyzed the generally quality of park green spaces in Shenyang. Additionally, the study analyzed factors limiting park green spaces and introduced the Recreational Quality Index (RQI) to represent the distribution of park green space resources within the study area. The results demonstrated that 46 low-quality park green spaces require urgent improvement, and the riverside area and the vicinity of the second ring road possess high-quality park green space resources. Barriers of the same scale in park green spaces exhibited similar characteristics. Park green spaces in Huanggu District were allocated recreational resources optimally. The analysis determined that system construction and deep cultural heritage are crucial factors. This study can offer a scientific basis and recommendations for the development of park green spaces and the enhancement of efficient urban land use.
1. Introduction
Recreation constitutes one of the four fundamental functions of modern cities. As stipulated by the “CJJT 85-2017 Standard for classification of urban green space” [1], the primary purpose of parks and green spaces is recreation, rendering them critical elements of urban public recreation spaces [2,3]. Concurrent with China’s rapid economic and social development, the spiritual and living needs of the population are continuously growing, rendering recreation an essential requirement for residents. Park green spaces, owing to their temporal and spatial convenience, are the preferred locations for daily recreation [4]. As cities transition into a stage of a high-quality development, park green spaces, as urban construction land, have entered a phase of “quality” improvement, and high-quality outdoor recreation areas have become scarce spatial resources within cites. Research on the quality of park green spaces is a crucial prerequisite for constructing a high-quality urban living environment [5].
The quality of park green spaces, also referred to as quality, reflects the appeal of park green spaces to users. This quality is associated with the frequency of visitor engagement with green spaces, and represents a key factor influencing the physical and mental well-being of urban residents [6,7,8,9,10]. Park green spaces foster various leisure and recreation activities by providing venues, facilities, environments, and services, consequently promoting physical and mental health and enhancing residents’ happiness [11]. Research has indicated that the quality of green spaces significantly contributes to the satisfaction and happiness of urban residents [12]. In Western countries, studies on park health benefits and fairness have been conducted, and tools such as the Community Park Audit Tool (CPAT), Environment Assessment of Public Recreation Spaces (EAPRS), and Quality Index of Park for Youth aimed at attracting young people’s physical activities, have been widely employed [13,14,15]. In recent years, analogous evaluation systems have been studied in China [16].
In light of the distinct functional positioning of park green space, some scholars consider factors such as the degree of beauty or visual landscape of green space landscape structure, ecological environment or ecological value, quality of public service, and quality of tourist experience as evaluation targets [17,18,19,20,21]. These evaluation tools encompass park-internal details and comprehensive indicators, but they accentuate management and construction, overlooking people-oriented recreational needs and perceptions. Evaluations based on different functions primarily concentrate on a single aspect of park green space. The aforementioned research approaches are challenging to implement on a large scale due to human and material constraints.
Owing to data availability, prior assessments of park green space quality have predominantly depended on subjective methods, such as satisfaction surveys and field surveys. With the progression of spatial information technology, spatial big data, including POI data, have grown increasingly prevalent. POI data offer information on the location and category of park green spaces, possessing the advantages of easy accessibility and extensive area coverage [22]. Remote sensing data can also rapidly collect information on temperature, vegetation, and other ground-level features [23]. These technologies supply more reliable data for the quantification of evaluation indicators, rending the results of park green space quality evaluations more scientific and objective [24,25].
Focusing on the recreational function of park green spaces, this paper develops an evaluation index system for park green spaces in Shenyang city. By integrating field surveys and spatial data, this study assesses and analyzes park green space quality, furnishing a solid, robust scientifically based foundation for enhancing urban living and municipal governance.
2. Study Area and Data
2.1. Study Area
Shenyang serves as the capital of Liaoning Province, a megacity, the core city of the national metropolitan circle, and a national historical and cultural city. According to data from the 7th census, the permanent population of Shenyang City’s jurisdiction is 6.42 million, the urbanization ratio of the city is 84.52%, and the population over 60 constitutes 23.24%. Given the high degree of urbanization and aging, the city has a pressing need for park green space construction. This study area encompasses the three-ring region of Shenyang City, which includes the city’s primary built-up area and spans seven districts, covering a total area of 455 km2 (Figure 1).
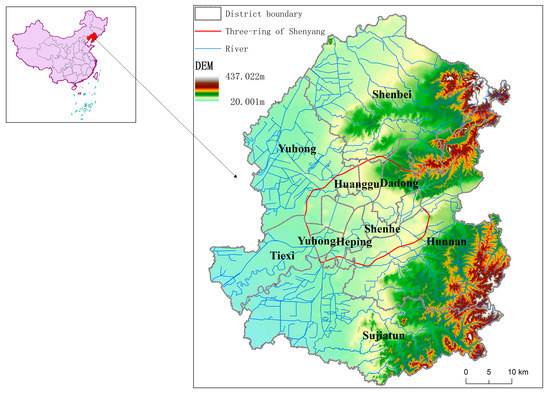
Figure 1.
A map of the study area.
Shenyang City features urban park green spaces established in various periods and featuring an array of types. The earliest modern city parks in Shenyang were founded in the early 20th century, such as Wanquan Park (1906), Dadong Park (1925), Zhongshan Park (1926), and others. As of 2021, the green area within the built-up zone is 221.5 km2, with a green coverage rate of 40.68%, a green rate of 38.87%, and a per capita park green space area of 13.65 m2. At present, the total area of park green spaces in the three-ring region of Shenyang City is approximately 2518 hm2, encompassing diverse comprehensive parks and community parks, as well as the Shenyang Riverside slow lane system, comprising a strip park along the Hunhe River and the coastal parks alongside several canals in the city.
The construction of park green spaces in Shenyang City has yielded favorable results in terms of both quantity and quality. As the city’s population density increases and the demand for an enhanced quality of life grows, park green spaces serve a crucial function in improving urban quality. In December 2021, Shenyang City unveiled the “Shenyang Park City Construction and Greening Implementation Plan in the Near Future”, which establishes new objectives for the development of park green spaces within the city.
2.2. Data
The data employed in this paper encompass the third national land survey data, park facilities survey and evaluation data, Landsat 8 remote sensing data, POI data, and road network data.
The data source for the parks and green spaces is derived from the “Park and Green Space” land category in the third national land survey data. In this paper, the park green spaces must satisfy the following two criteria: (1) the area exceeds 0.5 hm2; (2) it is accessible to the public and possesses at least one recreational facility, exhibiting a recreational function. Based on these conditions, the park green spaces conforming the area criteria requirements were screened using the third national land survey data. Through Baidu Street View and actual surveys, a total of 168 park green spaces were finally identified (Figure 2).
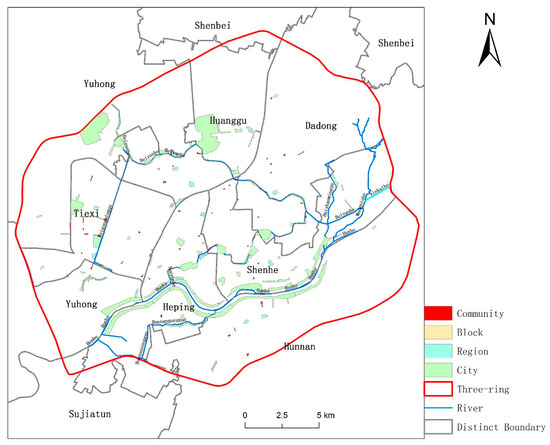
Figure 2.
Distribution map of park green space.
3. Methods
3.1. Construction of Urban Park Green Space Quality Evaluation Index System
3.1.1. Framework for Recreational Space
Drawing from the study of urban recreation theory, and considering the binary spatial level, recreational space is conceptualized as a space system comprising physical space and recreational behavior space [26]. While emphasizing the regional aspect of the venue, it is also essential to concentrate on recreational activities and behaviors [27].
Physical space can be subdivided into natural physical environment space and artificial environment space. The genesis of urban park green spaces lies in the artificial transformations executed within cities to satisfy people’s yearning for proximity to natural landscapes. Based on the analysis of recreational physical space components, it can be divided into artificial natural elements and artificial facilities elements [28]. Natural elements refer to landscapes created in park green spaces to mimic the natural environment, such as mountains, water, and vegetation. Facilities elements pertain to various recreational facilities constructed in park green spaces to accommodate recreational activity needs.
Recreational behavior space arises from users’ recreational activities within physical space, and recreational space cannot exist without individuals. Based on the shifts in recreational users’ spatial positions, an uncertain flow space is generated, and any space where a person’s recreational activity extends constitutes part of the recreational space [29]. In reality, the space where recreational users participate in recreational activities in park green spaces is not confined to the park itself, and the entire recreation process, including traveling, arriving, playing, resting, and returning, involves areas external to park green spaces.
Drawing the aforementioned theories and empirical situations, the ecological environment of the park constitutes a man-made natural component of the recreational physical space and an elemental prerequisite of park visitors. The facilities provided by the park are both man-made facilities catering to the recreational physical and behavioral space, domains, encompassing an array of sports venues and facilities. The subjective perception of the diverse activities occurring within the recreational domain is strongly contingent upon the quality and variety of facilities. Whether one is engaged in leisurely sports or using a park’s amenities, the convenience of options such as accessible transportation, shopping, or dining have an important impact on one’s perceptual and decision-making processes. Hence, the grounded composition of the recreational space, the landscape ecology, the facilities of the park, and the location support conditions constitute the framework for the quality evaluation index system (Figure 3).
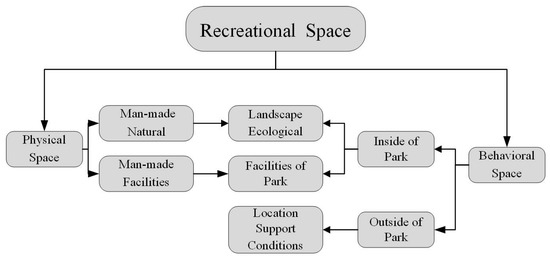
Figure 3.
Recreation perspective index system framework.
3.1.2. Indicator Selection
The park green space’s landscape ecology environment, facilities of the park, and location support conditions have been selected as primary indicators. In line with the feasibility principle of index system construction and bearing in mind the availability of data and index quantification, a quality evaluation index system for leisure and recreation in Shenyang City’s park green space has been established, consisting of 15 secondary indicators (Table 1).

Table 1.
The index system of Shenyang park green space quality evaluation.
- Landscape ecology: The landscape ecology of park green space comprises man-made natural components. The “blue” component refers to water bodies, and the “green” component refers to green space. The presence of water systems or lakes within the park provides visitors with more opportunities for recreational activities, while the water adjacent to the park also enhances its aesthetic value. Vegetation is a primary feature of park construction, as it serves as an important public resource that influences the quality of leisure and recreational experiences by providing ecological and ornamental value. Given that Shenyang is a northern city, water bodies and vegetation provide significant ecological and scenic values for visitors. Due to the subjective nature of ornamental value, “whether adjacent to the water” and “vegetation coverage rate” have been identified as secondary indicators based on ecological values. Additionally, due to the climate conditions of the study area and the cooling effect of park green space [30], the “summer temperature” is selected as another secondary indicator, given that citizens’ outdoor activities are primarily concentrated during the summer months.
- Facilities of park: The criteria for facilities of park are specified in the “GB51192-2016 Code for the design of public park” [31]. Facilities are categorized into recreational facilities, service facilities, and management facilities. This paper focuses on recreational facilities. Depending on the park’s scale, relevant requirements for facility placement are established, including “mandatory” and “optional”. Owing to the extensive area covered by the assessed park green spaces, the assessed facilities include “mandatory” and “optional” facilities for all park types. Moreover, signs, garbage bins, and toilets within service facilities significantly impact visitors’ recreational quality and should be employed as evaluation indicators. Consequently, the secondary indicators for park facilities in this study comprise rest seats (B1), sports and fitness facilities (B2), garbage bin facilities (B3), pavilions and galleries (B4), road signs (B5), and public toilets (B6). Indicators B1-B5 should be evaluated based on their existence, quantity, maintenance status or quality, and diversity.
- Location support conditions: Location support conditions encompass spatial location conditions and business activity, representing recreational behavior space. Spatial location conditions refer to the accessibility of the park green spaces. Residents utilize various transportation modes to access parks, including walking, cycling, public transportation, and driving. Therefore, considering the different transportation modes, the number of bus routes within a certain range (C3), the number of bus stops (C4), road density (C5), and the number of parking lots (C6) are selected as secondary indicators. Urban forms exhibit numerous types, and in light of the actual recreational needs of recreation, dining and convenient shopping are the primary requirements during recreational activities. Thus, the number of surrounding restaurants (C1) and the number of supermarkets and convenience stores (C2) are selected as secondary indicators.
3.1.3. Indicator Calculation
- Landscape ecology indicator A
A1 is assigned a value of 1, 0.5, or 0 based on the topological relationship between water bodies and park green spaces. A2 and A3 are computed using remote sensing images; the Landsat 8 image from 22 July 2021 with high vegetation coverage in summer is selected as the data source. The Landsat 8 data undergo radiometric calibration, and the linear spectral mixture decomposition method is used to calculate the vegetation coverage using multispectral bands 1–7, while the surface temperature is inverted utilizing the Landsat 8-based band 10 single window algorithm. The average values within each park green space represent the A2 and A3 indicator values.
- 2
- Facilities of park indicator B
Values for indicators B1 to B5 are derived from the scores of each facility, with the evaluation data obtained from on-site surveys conducted between June and August 2021. Following the “GB51192-2016 Code for the design of public park”, the facilities are evaluated based on three factors: the presence or lack of facilities, the quantity and quality of the facilities, and the diversity of the facilities. The score range spans 0–10 points, the utilization of park green spaces is observed, and representative populations are chosen for questionnaire surveys to evaluate the demand for the facilities. The B6 indicator value is acquired through calculation.
- 3
- Location supporting condition indicator C
The location supporting condition indicator encompasses POI data, public transportation routes, and city road network data. The POI data and public transportation route data were obtained from Baidu Maps in 2020, including attributed information such as name and spatial location. The city road network data is derived from the third national land survey data. Convenience stores and supermarkets are screened from the POI shopping data. The number of public transportation routes at each bus stop is computed using ArcGIS. The number of various data points in the park green space buffer zone is determined as C1, C2, C3, C4, and C6 indicator values. The total length of roads and area in the buffer zone are computed, and the road density is calculated as the C5 indicator value.
3.2. Quality Evaluation
3.2.1. Park Green Space Scale Division
To reduce the impact of scale on the evaluation results, the park green spaces are classified into four categories based on area, namely community, block, regional, and city scales, referencing the “Park Design Standards” (GB51192-2016) and the “Urban Green Space Classification Standards” (CJJT 85-2017). The study area comprises the urban built-up area with a relatively small number of large park green spaces, encompassing a limited number of sizable park green spaces. Parks larger than 10 hm2 are grouped into city scale, those smaller than 2 hm2 are of community scale, those between 2 and 5 hm2 are of block scale, and those between 5 and 10 hm2 are of regional scale.
3.2.2. Entropy Weight-TOPSIS Park Green Space Quality Evaluation
This study aims to evaluate the quality of the park green spaces themselves. The entropy value method is employed to objectively assign weights to each of the four levels of park green spaces, reducing subjective influence. The specific calculation steps are not elaborated in detail [32].
Based on the weights of the indicators determined by the entropy method, the TOPSIS model is utilized to rank the park green spaces in terms of comprehensive scores. As a distance-based comprehensive evaluation method, TOPSIS possesses the advantage of obtaining original data information and objectively reflecting the gaps between different schemes [33].
The weights of quality evaluation indicators for park green spaces of varying sizes are displayed in Table 2.
Table 2.
Entropy weights of quality evaluation indicators for park green spaces of different sizes.
3.2.3. Kernel Density Estimation
Kernel Density Estimation (KDE) is a nonparametric test method for unknown probability density functions capable of reflecting the distance attenuation effect in the spatial distribution of geographical phenomena and is suitable for detecting spatial hot spots and identifying concentrated areas. The kernel function formula is:
In Formula (1): n represents the number of park green spaces; h denotes the bandwidth, which is the search radius; k refers to the distance weight; x − xi is the distance from the center point to the sample point.
In accordance with the “15-min Living Circle” concept, a search radius of 1500 m and a spatial resolution of 100 m were established.
3.3. Quality of Recreation in Park Green Spaces
Park green spaces represent scarce recreational resources in urban areas, correlating not only to quantity but also to quality. It is indisputable that larger park green spaces can provide more recreation space and functions for residents, while scale factors play a role in the evaluation index in this study. Consequently, the Recreation Quality Index (RQI) is defined. The RQI of park green spaces reflects the recreational service capacity of park green spaces. Under the same quality level, a larger scale correlates to stronger recreation service capacity. The calculation formula is expressed as follows:
represents the recreation quality index of park green space i, A represents the area index calculated according to the scale level, represents the average value of urban park green spaces, and represents the quality score of the park green space.
4. Results and Analysis
4.1. Evaluation Results of Park Green Space Quality
4.1.1. Quality and Quality Level of Park Green Spaces
The TOPSIS comprehensive score reflects the distance between the evaluated object and the optimal solution; a higher score corresponds to a smaller difference from the optimal solution. Utilizing MATLAB software based on the entropy-weighted TOPSIS method, the quality evaluation of park green spaces at four scale levels is conducted, and the TOPSIS comprehensive score box plot of park green space quality is depicted (Figure 4).
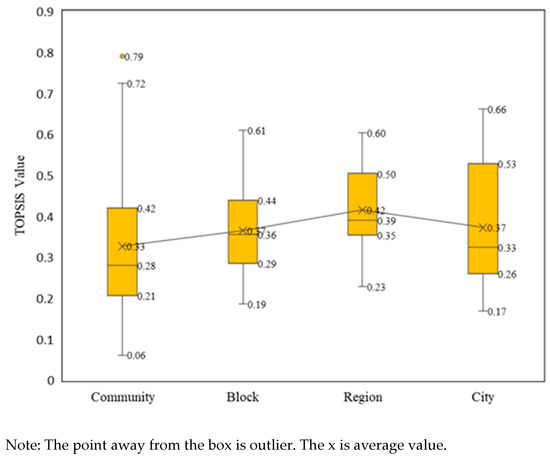
Figure 4.
Box plot of quality scores for different scales of park green spaces.
In general, the quality score box plot of park green spaces in the study area occupies a relatively low position, with lower scores. When comparing the quality scores of park green spaces of various scales, the scale emerges as the primary factor limiting the quality of park green spaces. Once the scale exceeds a certain range (regional parks), the quality no longer increases with the growth of the park green space scale. The scores of urban parks and neighborhood parks appear similar or even lower. In comparing the box body length, the internal differences in quality of urban parks and community parks are relatively large, while those of neighborhood parks and regional parks are relatively small. The quality characteristics of park green spaces on different scales are as follows: community parks have an overall low score and large internal differences; urban parks exhibit high scores in leading positions, but large internal differences, revealing a two-level differentiation; neighborhood parks maintain overall low scores and small differences; regional parks display high overall scores and small differences, rendering them the most balanced park type in terms of quality.
Employing the natural breakpoint method, parks can be divided into three levels from high to low (Table 3). Among them, 75 medium-quality park green spaces are the most numerous, followed by 47 high-quality and 46 low-quality park green spaces. The proportion of high-quality park green spaces is relatively small. In terms of different scales of park green spaces, regional parks exhibit the highest proportion of high-quality green spaces, while neighborhood parks possess a significantly higher proportion of low-quality green spaces compared to other scales.
Table 3.
The statistics of quality level of different scale park green spaces (unit: number).
4.1.2. Spatial Characteristics of Park Green Space Quality
The spatial distribution of park green space quality levels is illustrated in Figure 5. To depict the spatial distribution of park green space quality in Shenyang, kernel density analysis was performed and is displayed in Figure 6.
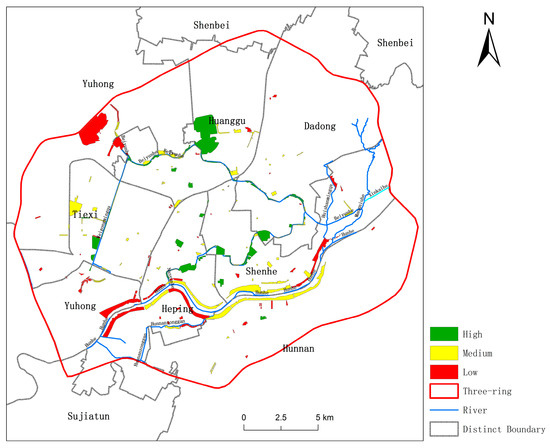
Figure 5.
The evaluation results of park green space quality in Shenyang.
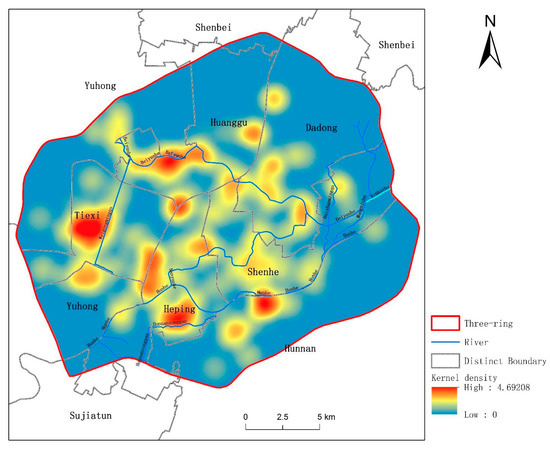
Figure 6.
Spatial distribution of scale and quality level kernel density of park green space.
High-quality park green spaces predominantly reside within the Second Ring Expressway and primarily consist of urban parks along the canal. Based on Figure 6, the spatial distribution of Shenyang’s park green space quality levels exhibits the following characteristics: high-density areas are situated near the Second Ring and along the Hun River and canal, with a wide-ranging sub-high-density area near the Second Ring and a smaller sub-high-density area along the central urban area’s canal. Consequently, waterfront areas and regions near the Second Ring Road constitute the concentrated zones of high-quality park green spaces in Shenyang.
4.2. Analysis of Limiting Factors for Park Green Space Quality
Employing the obstacle degree model, this study calculates the obstacle degree of each indicator for the leisure and recreation quality of park green spaces in Shenyang. Obstacle factors are identified based on an obstacle degree greater than 10% [34], and the frequency and total obstacle degree of these factors are presented in Figure 7 and Table 4.
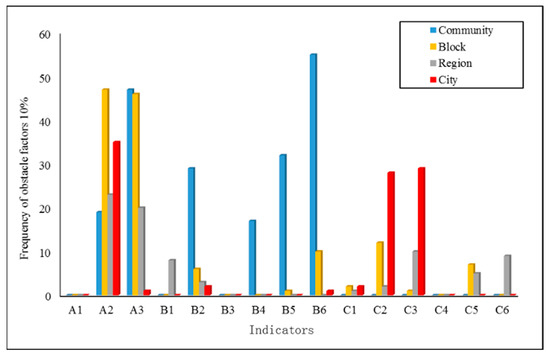
Figure 7.
The statistical chart of 10% obstacle factor frequency of green space in parks of different scales.
Table 4.
The factors affecting leisure quality of green space in various parks.
According to the results in Figure 7 and Table 4, the obstacle factors for community parks center around the ecological environment A and park facilities B. The primary obstacle factors for neighborhood parks are vegetation coverage (A2) and summer temperature (A3), with the secondary obstacle factor being number of supermarkets and convenience stores (C2). Regional parks and urban parks feature larger scales, and park facilities are generally well-developed. The main obstacle factor for regional parks is vegetation coverage (A2), with summer temperature (A3) as the secondary factor. For urban parks, the primary obstacle factor is vegetation coverage (A2), and the secondary obstacle factors are number of supermarkets and convenience stores (C2) and number of bus lines (C3).
Obstacle factors of park green spaces yield the following findings: (1) Due to spatial scale constraints, community parks grapple with insufficient environment and facilities. Enhancing space utilization and incorporating multifunctional technology and intelligent facilities can compensate for the space deficiency. (2) Supporting facilities surrounding neighborhood parks require improvement. Offering mobile points can assist in meeting visitors’ needs. (3) Public transportation and parking lots near regional parks do not yet satisfy residents’ travel requirements. Some park recreation facilities necessitate an increase in quantity or replacement of outdated facilities. (4) Urban parks experience relatively poor public transportation due to their geographical location. As urban built-up areas expand, bus and subway lines and station settings should take into account favoring park green spaces to boost recreational resource utilization. (5) Urban parks demonstrate excellent water friendliness. However, due to the scale limitations of community and neighborhood parks, water bodies become the primary limiting factor. Small, refined water elements can be suitably added to enhance aesthetic and ecological value. (6) Shenyang’s park green spaces maintain good vegetation coverage but the cooling effect remains debatable. Recreational facilities, such as corridors and indoor venues, can be increased. Adding greenery outside the park may also help mitigate high temperatures caused by the urban heat island effect.
4.3. Park Green Space Recreation Resources
The Recreation Quality Index (RQI) comprehensively reflects the allocation of park and green space recreation resources in a region, encompassing both quantity and quality. The RQI results of 168 park green spaces were calculated and divided into five levels (Figure 8). Based on the district as a unit, the distribution of park and green space recreation resources in various districts within the third ring of Shenyang city was analyzed, including the number of park green spaces, total area of park green spaces, per capita area of park green spaces, and recreation quality (Figure 9).
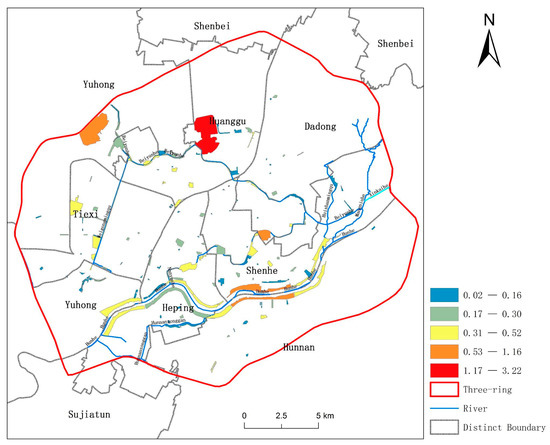
Figure 8.
Recreation Quality Index of park green space.
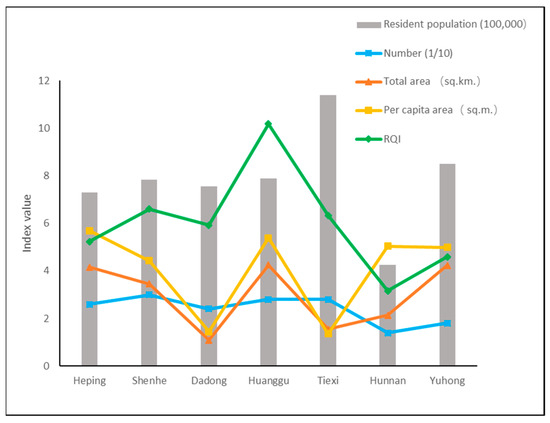
Figure 9.
The distribution of green space recreational resources in parks of each administrative region.
According to Figure 8 and Figure 9, the distribution of the number of park green spaces in various districts appears to be relatively balanced, while a significant difference exists in the total area of park green spaces between districts. Huanggu District features the highest recreation quality, and the total area and per capita area of park green spaces also remain at a relatively high level. The total and per capita areas of park green spaces in Tiexi and Dadong Districts are notably lower, with Tiexi having the largest population. Hunnan and Yuhong Districts exhibit the lowest number and recreation quality of park green spaces. Heping and Shenhe Districts maintain a medium level in all aspects. Overall, Huanggu District represents the area with the highest quantity and quality of park and green space recreation resources, featuring a reasonable scale composition and balanced quality. There are 10 high-quality, 13 medium-quality, and 5 low-quality park green spaces, with a substantial number of medium- and high-quality park green spaces.
Considering the actual situation, the advantages of park and green space recreation resources in Huanggu District encompass: (1) System construction and investment. The Xinkai River flows from east to west through Huanggu District, connecting the North Canal Garden, and serving as an essential component of Shenyang’s waterfront slow lane system. The construction and investment of facilities are substantial, offering a favorable ecological environment and high-quality recreational facilities. (2) Rich cultural heritage. Huanggu District hosts parks with deep historical heritage, such as Beiling Park, Beita Park, and Sheli Pagoda Beach Park; early parks in New China that attract a large number of residents to participate in cultural and sporting activities, becoming an integral part of their daily lives; and parks with distinct cultural themes, such as Huanggu Heroes Park and the 724 Fitness Corridor, reflecting Shenyang’s heroic spirit and industrial core. Moreover, Beiling Park in Huanggu District is a World Cultural Heritage site, featuring a considerable amount of green space and an extensive radiation range, playing a significant role in enhancing the service capacity of park green space resources in the region.
5. Conclusions and Discussion
In 2018, General Secretary Xi Jinping first proposed the concept of “Park City”, which represented the future direction of urbanization in China. Park green spaces serve as prerequisite carriers for the construction of “Park Cities”. Enhancing the quality of park green spaces is vital and a crucial means to improve the quality of the living environment. In this study, according to the composition of recreational elements, park green space recreational spaces are divided into material spaces and activity spaces, and a quality evaluation index system for parks and green spaces in Shenyang City is established. By integrating multi-source heterogeneous data, this study balances the accuracy of research evaluation with the scientific nature of spatial data, achieving an evaluation of park and green space quality and analyzing the quality and limiting factors of park green spaces. The introduction of the Recreation Quality Index (RQI) has elucidated the advantages and weak areas of recreational resources in park green spaces in Shenyang City.
The disparity in park green space quality, in terms of quantity and space, accentuates the inequity experienced by residents in enjoying park green space recreation resources and public facilities. This study reveals that 46 low-quality park green spaces in the study area urgently require improvement. Waterfront areas and the vicinity of the Second Ring Road are concentrated areas of high-quality park green space resources, while other regions still necessitate further enhancement of park green space quality and a reduction in the number of low-quality park green spaces. Comparing the evaluation results of park green space quality across different scales, it becomes evident that scale and quality exhibit a certain correlation, but scale does not equate to quality. High-quality park green spaces of regional scale account for the majority and display the most balanced quality. The introduction of the Park Green Resources Recreation Quality Index (RQI), integrating park green resource quantity and quality elements, demonstrates that Huanggu District possesses the optimal overall allocation of park and green space resources. It is concluded that system construction and exceptional cultural connotation are two crucial factors representing the direction of urban park green space recreation resource planning and construction. The statistical results indicate that obstacle factors of the same scale of park green space exhibit certain similar characteristics, and improvement measures should be implemented according to their respective features. Moreover, the water body is a significant factor in enhancing the quality of park green space in the study area.
This research can offer suggestions for ameliorating the quality of park green spaces and optimizing recreational resources. Measures to enhance the quality of park green spaces of different sizes vary. Firstly, small-scale park green spaces should receive increased investment. In this study area, community parks are the most numerous, serving a large population of residents. However, due to poor management and space constraints, certain issues exist with their internal environment and facilities. Secondly, attention should also be directed towards the external support and environment of parks. For large-scale park green spaces, external supporting facilities are even more crucial, as they both improve resource utilization and provide superior public services to residents. Lastly, in addition to hardware facilities, the construction of park green spaces should also incorporate soft cultural characteristics, expanding the range of recreational activities offered in park green spaces and satisfying residents’ pursuit of a better life.
Park City represents the most recent theoretical advancement in urban development. Catering to human settlement activities, forming cultural connotation characteristics, and integrating “production-living-ecological spaces” are the construction objectives of high-quality park green spaces. However, there are certain limitations to the research methods employed in this study. The index system in this paper is not sufficiently comprehensive, as it primarily focuses on the content that users can utilize and must possess according to park green space construction standards. Structures other than pavilions are not considered because they are not essential projects within park green spaces and lack evaluation standards. Due to challenges in acquiring information, cultural activities such as exhibitions in park green spaces were not incorporated into the evaluation indicators. Digitalization and information management for park and green space management can enhance the feasibility and universality of the methods compensating for these shortcomings. Building upon the evaluation of park and green space quality, the issue of resource allocation fairness for park green spaces is the next topic to be researched.
Author Contributions
Methodology, Y.G. and G.L.; Formal analysis, Y.G.; Investigation, Y.G. and L.Z.; Data curation, Y.G.; Supervision, G.L.; Funding acquisition, G.L. All authors have read and agreed to the published version of the manuscript.
Funding
This research was funded by National Natural Science Foundation of China grant number 42101255 and Social Science Planning Fund of Liaoning Province grant number L20CGL003.
Conflicts of Interest
The authors declare no conflict of interest.
References
- CJJT 85-2017S; Standard for Classification of Urban Green Space. China Architecture & Building Press: Beijing, China, 2017.
- Yu, S. The Research of Urban Recreational Greenbelt. Mod. Urban Res. 2002, 2, 4–7. [Google Scholar]
- Zhao, J.; Xua, G.; Zhu, Y. Motivation and Behavioral Characteristics of the Park-based Recreation for Urban Residents in Transitional Period: A Case Study of Xuanwu Lake Park in Nanjing. Areal Res. Dev. 2016, 35, 113–118, 133. [Google Scholar]
- Tian, F.; Wang, D.; Lian, H.; Li, G. Analysis on Residents’ Recreational Travel Choice in Wu’an. Mod. Urban Res. 2021, 7, 125–129. [Google Scholar]
- Zhang, H.; Zhou, L. Factor Components and Differences of the Park-based Recreational Happiness for Urban Residents: A Case Study of Hangzhou. Sci. Geogr. Sin. 2013, 33, 1074–1081. [Google Scholar]
- Astell-Burt, T.; Mitchell, R.; Hartig, T. The Association Between Green Space and Mental Health Varies Across the Life course. A Longitudinal Study. J. Epidemiol. Community Health 2014, 68, 578–583. [Google Scholar] [CrossRef]
- Wolf, I.D.; Wohlfart, T. Walking, Hiking and Running in Parks: A Multidisciplinary Assessment of Health and Well-being Benefits. Landsc. Urban Plan. 2014, 130, 89–103. [Google Scholar] [CrossRef]
- Zhang, Y.; Van den Berg, A.E.; Van Dijk, T.; Weitkamp, G. Quality Over Quantity: Contribution of Urban Green Space to Neighborhood Satisfaction. Int. J. Environ. Res. Public Health 2017, 14, 535. [Google Scholar] [CrossRef]
- Wyles, K.J.; White, M.P.; Hattam, C.; Pahl, S.; King, H.; Austen, M. Are Some Natural Environments More Psychologically Beneficial Than Others? the Importance of Type and Quality on Connectedness to Nature and Psychological Restoration. Environ. Behav. 2019, 51, 111–143. [Google Scholar] [CrossRef]
- Akpinar, A. How Is Quality of Urban Green Spaces Associated with Physical Activity and Health? Urban For. Urban Green. 2016, 16, 76–83. [Google Scholar] [CrossRef]
- Xu, M.; Xin, J.; Su, S.; Weng, M.; Cai, Z. Social Inequalities of Park Accessibility in Shenzhen, China: The Role of Park Quality, Transport Modes, and Hierarchical Socioeconomic Characteristics. J. Transp. Geogr. 2017, 62, 38–50. [Google Scholar] [CrossRef]
- Feng, X.; Astell-burt, T. Residential Green Space Quantity and Quality and Child Well-being: A Longitudinal Study. Am. J. Prev. Med. 2017, 53, 616–624. [Google Scholar] [CrossRef] [PubMed]
- Lee, C.; Kim, H.J.; Dowdy, D.M.; Hoelscher, D.M.; Ory, M.G. Tcoppe School Environmental Audit Tool: Assessing Safety and Walkability of School Environments. J. Phys. Act. Health 2013, 10, 949–960. [Google Scholar] [CrossRef]
- Rigolon, A. Parks and Young People: An Environmental Justice Study of Park Proximity, Acreage, and Quality in Denver, Colorado. Landsc. Urban Plan. 2017, 165, 73–83. [Google Scholar] [CrossRef]
- Saelens, B.E.; Frank, L.D.; Auffrey, C.; Whitaker, R.C.; Burdette, H.L.; Colabianchi, N. Measuring Physical Environments of Parks and Playgrounds: Eaprs Instrument Development and Inter-rater Reliability. J. Phys. Act. Health 2006, 3, S190. [Google Scholar] [CrossRef] [PubMed]
- Li, Y. A Research of Methods and Standards to Evaluate the Environmental Quality of Urban Parks. Chin. Landsc. Archit. 2013, 29, 63–66. [Google Scholar]
- Zhang, Z.; Xu, C.; Gong, L.; Cai, B.; Li, C.; Huang, G.; Li, B. Assessment on Structural Quality of Landscapes in Green Space of Beijing Suburban Parks by SBE Method. Sci. Silvae Sin. 2011, 47, 53–60. [Google Scholar]
- Song, Y.; Xu, S.; Liu, Z.; Zhang, Y.; Qiu, P.; Niu, A.; Xu, G. Time and Space Differences of Water Environmental Quality of the Mangrove Wetland Park in Nansha: Based on the Improved Twice-slope Clustering Method. Sci. Geogr. Sin. 2016, 36, 303–311. [Google Scholar]
- Xu, H.; Li, Q. Analysis of the Evaluative Dimensions and Causal Relationship on Theme Park Visitors’ Experience Quality: Based on a C-trip Comments Review of Disney and Happy Valley. Tour. Sci. 2017, 31, 57–68. [Google Scholar]
- Xiao, N.; Huang, Y.; Liu, J. Evaluation and Spatial Differentiation of Tourism Experience Quality of Theme Park in China. Sci. Geogr. Sin. 2019, 39, 978–986. [Google Scholar]
- Zhao, J.; Xuan, G. Experience Quality and Gender Differences of the Urban Park-based Recreation: A Case Study of Xuanwu Lake Park in Nanjing. Chin. Landsc. Archit. 2015, 31, 113–116. [Google Scholar]
- Huang, Q.; Yang, B.; Xu, X.; Hao, H.; Liang, L.; Wang, M. Location selection and prediction of SexyTea store in Changsha City based on multi-source spatial data and random forest model. J. Geo-Inf. Sci. 2022, 24, 723–737. [Google Scholar]
- Guo, Y.; Lei, G.; Zhang, L.; Zhao, M.; Yu, H.; Dai, L. Impervious surface extraction in Shenyang City based on OLI/TIRS data. Resour. Sci. 2019, 41, 1758–1768. [Google Scholar]
- Qin, S.; Yang, J.; Feng, Y.; Yan, S. Spatiotemporal Vitality and Influencing Factors of Urban Parks Based on Multi-Source Data: A Case Study of Nanjing. Chin. Landsc. Archit. 2021, 37, 68–73. [Google Scholar]
- Stessens, P.; Canters, F.; Huysmans, M.; Khan, A.Z. Urban Green Space Qualities: An Integrated Approach Towards GIS-based Assessment Reflecting User Perception. Land Use Policy 2020, 91, 104319. [Google Scholar] [CrossRef]
- Lyu, L.; Zhu, J.; Wang, Z. Comprehensive Evaluation of Suitability of Spatial Land Use in Fuzhou Coastal Recreation Based on GIS. Mod. Urban Res. 2022, 4, 67–72. [Google Scholar]
- Yu, L.; Liu, J.M.; Li, T.; Zhu, H. Research progress of urban public recreational space in China. Acta Geogr. Sin. 2018, 73, 1923–1941. [Google Scholar]
- Daniels, B.; Zaunbrecher, B.S.; Paas, B.; Ottermanns, R.; Ziefle, M.; Roß-Nickoll, M. Assessment of Urban Green Space Structures and Their Quality From a Multidimensional Perspective. Sci. Total Environ. 2018, 615, 1364–1378. [Google Scholar] [CrossRef] [PubMed]
- Qin, X. Systematic Study on Urban Recreational Spatial Structure—A Case Study of Ningbo City. Econ. Geogr. 2003, 23, 267–271, 288. [Google Scholar]
- Monteiro, M.V.; Doick, K.J.; Handley, P.; Peace, A. The Impact of Greenspace Size on the Extent of Local Nocturnal Air Temperature Cooling in London. Urban For. Urban Green. 2016, 16, 160–169. [Google Scholar] [CrossRef]
- GB 51192-2016; Code for the Design of Public Park. Ministry of Housing and Urban-Rural Development of the People’s Republic of China: Beijing, China, 2016.
- Wang, F.X.; Mao, A.H.; Li, H.L.; Jia, M. Quality Measurement and Regional Difference of Urbanizationin Shandong Province Based on the Entropy Method. Sci. Geogr. Sin. 2013, 33, 1323–1329. [Google Scholar]
- Du, T.; Xie, X.J.; Liang, H.Y.; Huang, A.; Han, Q.F. County Economy Comprehensive Evaluation and Spatial Analysis in Chongqing City Based on Entropy Weight-TOPSIS and GIS. Econ. Geogr. 2014, 34, 40–47. [Google Scholar]
- Hu, Z.; Zhang, X. Quality Evaluation and Obstacle Factor Diagnosis of Economic Development in Coastal Provinces of China. Stat. Decis. 2022, 38, 112–117. [Google Scholar]


Disclaimer/Publisher’s Note: The statements, opinions and data contained in all publications are solely those of the individual author(s) and contributor(s) and not of MDPI and/or the editor(s). MDPI and/or the editor(s) disclaim responsibility for any injury to people or property resulting from any ideas, methods, instructions or products referred to in the content. |
© 2023 by the authors. Licensee MDPI, Basel, Switzerland. This article is an open access article distributed under the terms and conditions of the Creative Commons Attribution (CC BY) license (https://creativecommons.org/licenses/by/4.0/).