Abstract
AI is playing an important role in promoting sustainable development, but the carbon footprint caused by AI is scaling quickly and may partly offset the effort to reduce carbon emissions. However, recommendations for limiting the AI carbon footprint are lacking. In order to address this gap in the literature, this paper first constructs a tripartite evolutionary game model by taking governments, AI industry alliances, and consumers into consideration, and then exploring the impacts of key factors on these three players’ strategy selection based on the case of smart air conditioner consumption in China. The results show that the behavior of governments has an important influence on the behavior of AI industry alliances and consumers. The ideal consequence is that governments adopt an unregulated strategy, AI industry alliances adopt a green development strategy, and consumers adopt a green purchase strategy. Regulation by governments is indispensable for limiting the AI carbon footprint during an early stage but becomes dispensable when the system reaches an optimal state. Although a tendency toward green consumption, image benefit, regulatory cost, carbon price, and the subsidies given to consumers and AI industry alliances can largely influence the strategy selection of governments, governments are most sensitive to carbon prices and the subsidies given to consumers. AI industry alliances are not sensitive to subsidies, reputation improvement, and reputation loss but are most sensitive to carbon prices. Consumers are most sensitive to green consumption tendencies, self-satisfaction, and utility but are not sensitive to subsidies.
1. Introduction
Artificial intelligence (AI) may be defined as a set of techniques that empower computers to accomplish complicated assignments that require intelligence [1]. Recently, AI has developed rapidly and has been deployed in many fields [2]. For example, the performance of AI models—such as computer vision models, natural language processing models, and time-series analysis models—has been rapidly improved upon, and these AI models are shaping our lives. With the widespread application of AI and the aggravation of global warming, the impacts of AI on carbon emissions have gained attention.
AI can both decrease and increase carbon emissions [3,4,5,6]. On the one hand, the application of AI can reduce worldwide greenhouse gas emissions [5]. On the other hand, the information and communication technology (ICT) sector, such as data centers, which are the critical infrastructure for training AI models, is generating a mass of carbon emissions [7,8]. Therefore, there has been a substantial need to combat climate change by using AI and limiting the carbon emissions from AI. This paper mainly focuses on limiting the AI carbon footprint.
Existing studies suggest that governments [5,6,9], AI industry alliances, including AI device and service supply enterprises [5], AI researchers [10,11,12], and consumers [13] are the important participants in limiting the AI carbon footprint. Further, some policy proposals for limiting the AI carbon footprint have been proposed. It is clear that governments, AI industry alliances, and consumers will influence one another’s behaviors in the process of limiting the AI carbon footprint. However, the interactions between these three players have not been taken seriously enough by the current literature. The overall aim of this article is to fill this gap in the literature by using a tripartite evolutionary game model, which can be used to quantitatively describe the interactions between these three players.
The article is structured as follows: Section 2 briefly reviews the related studies. Section 3 introduces the basic principles of the evolutionary game model and establishes the tripartite evolutionary game model based on the corresponding assumptions. Section 4 analyzes the stability of the strategies of the three participants and proposes the optimal strategy combination. Section 5 uncovers the evolution paths of the three players and explores the impacts of key factors on the three players’ strategy selection based on the case of smart air conditioner consumption in China. Section 6 addresses the conclusions, discussion, recommendations, and limitations.
This paper makes two main contributions to the literature. First, the existing studies mainly keep a watchful eye on the emission reduction effect of using AI, yet the carbon footprint caused by AI is not focused on widely. Although some studies point out that governments, AI industry alliances, and consumers are the critical participants in limiting the AI carbon footprint, the interactions between these three players in the process of limiting the AI carbon footprint have not been revealed in detail and have not been described quantitatively. This paper reveals these interactions by constructing a tripartite evolutionary game model and quantitatively analyzing these interactions. Second, the existing studies put forward some actionable recommendations that governments, AI industry alliances, and consumers should take to limit the AI carbon footprint, but they do not probe the impacts of these actions on the strategy selection of these three players from an evolutionary perspective. This paper explores the impacts of key factors on the three players’ strategy selection by simulating the evolutionary game process and pointing out the most sensitive factors regarding the three players’ strategy selection, as well as the transition role of governments during the different stages of limiting the AI carbon footprint.
2. Literature Review
In general, the existing studies related to our work can be divided into three parts: the influencing mechanisms of AI on carbon emissions, the sources of the AI carbon footprint, and the actions for limiting the AI carbon footprint.
2.1. Influencing Mechanisms of AI on Carbon Emissions
AI can positively and negatively impact carbon emissions [3,4,5,6]. On the one hand, AI can help to reduce carbon emissions in two ways. First, the energy and resource utilization efficiency of the energy sector, manufacturing sector, and agriculture sector can be improved by using AI technologies [2,12]; thus, the energy consumption and carbon emissions from these sectors can be diminished. For instance, AI can help to advance the operational efficiency of complex systems, such as industrial heating and cooling systems [5]; thus, energy consumption and carbon emissions can be reduced. AI can also help to reduce food-related carbon emissions [14]. Second, AI devices can limit their own carbon emissions by using AI technologies. For example, the energy efficiency of data centers has been enhanced by adopting an intelligent carbon-computing platform [15] and specialized “AI accelerator” hardware, such as application-specific integrated circuits [5]; thus, energy consumption and carbon emissions from centers can be reduced.
On the other hand, AI can contribute to increasing carbon emissions in three ways. First, running computationally hungry AI models consumes vast amounts of energy and generates carbon emissions. For instance, the carbon emissions generated by training a transformer model using a neural architecture search can be comparable to the lifetime carbon emissions of five cars [16]. Using generative AI technologies, such as ChatGPT, will generate vast amounts of carbon emissions [17]. AI devices, such as computers, are also responsible for embodied emissions from raw material extraction, manufacturing, transportation, and hardware disposal [5,6,13,18]. Second, AI can be used as a general-purpose tool to reduce the cost of high-emitting activities, which could, in turn, incentivize more emission-intensive activities and generate more carbon emissions. For example, oil companies can unlock and sell more oil and gas in a more cost-effective way by using AI technologies [5,19]; however, oil and gas are two of the most significant sources of carbon emissions. Third, when AI increases the efficiency of production and service, rebound effects will occur, because the rebound effect itself means more production and consumption of goods and services and more carbon emissions. For instance, intelligent recommendation systems can improve the effectiveness of advertising communication, which can increase the production and consumption of goods and services and generate more carbon emissions. This may offset or even counteract the effort of reducing carbon emissions [5].
2.2. Sources of the AI Carbon Footprint
The sources of the AI carbon footprint constitute carbon emissions, from the extraction of raw materials for producing AI devices (e.g., data centers, desktops, laptops, smartphones, and so on), the manufacturing process of AI devices, the shipment process of AI devices, the lifetime usage of AI devices (e.g., using AI devices for data collection and storage, training AI models using data centers, employing AI models via smart terminals), and hardware disposal [5,6,13].
Although we can roughly describe the sources of the AI carbon footprint based on the perspective of the life cycle of AI devices, it is difficult to estimate the total amount of the AI carbon footprint now [8,12], because the boundary definition of the AI carbon footprint is blurry, and the related data and reliable evaluation methodology for estimating the quantity of the AI carbon footprint are also scarce [5]. We can only be sure that a substantial portion of carbon emissions from the ICT sector belongs to the AI carbon footprint [5].
2.3. Actions for Limiting the AI Carbon Footprint
Recent studies suggest that there are four actions for limiting the AI carbon footprint: disclosing the AI carbon footprint, reducing the AI carbon footprint, removing the AI carbon footprint, and offsetting the AI carbon footprint. Existing studies also point out that governments, AI industry alliances, and consumers are the three main stakeholders in limiting the AI carbon footprint. What should receive special mention is that AI industry alliances include AI device producers, such as the producers of data centers; AI service suppliers, such as data center operators; and AI researchers, such as those researchers in the field of machine learning (ML). Based on the existing studies, the actions that governments, AI industry alliances, and consumers can take to limit the AI carbon footprint are displayed in Table 1.

Table 1.
The actions taken by three stakeholders for limiting the AI carbon footprint.
In summary, existing studies reveal the influencing mechanisms of AI on carbon emissions, the sources of the AI carbon footprint, the participants, including governments, AI industry alliances, and consumers, who are the significant actors in limiting the AI carbon footprint, and the actions for limiting the AI carbon footprint. However, so far, the AI carbon footprint has not been taken seriously by governments, AI industry alliances, and consumers. For example, large data centers that have massive carbon footprint in their life cycle play a critical role in AI model training and development and have not been covered by the carbon trading market in many countries. Furthermore, the interactions between governments, AI industry alliances, and consumers in the process of limiting the AI carbon footprint have not been revealed in depth. Therefore, we will construct a tripartite evolutionary game model to fill this gap in the literature.
3. Methodology and Model Construction
3.1. Methodology
Evolutionary game modeling is a development of traditional game modeling, and it was first applied in the field of ecology. Currently, the evolutionary game model is widely applied in modeling sustainable development problems [24,25]. In terms of limiting the AI carbon footprint, the evolutionary game model can be used to quantitatively analyze the interactions between three players, the influencing factors of the three players’ strategy selection, and the dynamic evolution of the three players’ strategy selection.
The basis of the evolutionary game model is game theory and biological evolution theory [26]. There are four pivotal concepts in evolutionary game modeling. The first is the connotation of a bounded rational. In contrast to the traditional game model, the evolutionary game model assumes that the players are bounded rational participants, which means the decision information obtained by the players is incomplete; namely, their strategies may not always be optimal in each round of the game. The second is the connotation of imitation. The evolutionary game model assumes that the participants have an imitation ability and are supposed to maximize their own benefits. This means that the players can imitate the behavior of the other players and adjust their strategies gradually according to the payoff in each round of the game, which is similar to the principles of biological evolution. In general, the mechanisms of imitation and adjustment can be depicted by differential equations, stochastic processes, optimization algorithms, and so on. The most widely used mechanism of imitation and adjustment is the dynamic replicator equation [26]. The third is the connotation of mixed strategies. The evolutionary game model uses the proportion of individuals who choose different pure strategies in the group to represent the mixed strategies, while the mixed strategies in a traditional game model represent the probability that the players will choose a certain strategy. The fourth is the connotation of the evolutionary stability strategy (ESS). The strategies of the players in the same group may be diverse at the beginning, but with the extension of the evolutionary time, the strategies of the players will gradually converge to an ESS, which means most of the individuals in the group steadily adopt a certain strategy and other strategies cannot invade the group.
3.2. Tripartite Evolutionary Game Model Construction
3.2.1. Model Assumptions
The model assumptions that are in accordance with the practice of limiting the AI carbon footprint are as follows:
Hypothesis 1.
There are three players in the process of limiting the AI carbon footprint: governments, AI industry alliances, and consumers. These three parties are bounded rational participants with an imitation ability and are supposed to maximize their own benefits.
Hypothesis 2.
Assume that the consumers have a green consumption tendency. This assumption is consistent with practice. According to the China Sustainable Consumption Report 2022, a research report that was jointly launched by SynTao and Jiemian News, which are well-known consulting agencies in China, observed that 90% of the respondents believed that low carbon was closely related to everyone, and most respondents thought of electronic products first when it came to low-carbon products [27]. In addition, although consumers have a tendency for green consumption, the level of green consumption tendency might be diverse for different consumers [28]. Therefore, the parameter can be used to describe the level of consumers’ green consumption tendency. Without loss of generality, we set the interval of as [1, 2]; the higher the value of , the higher the levels of green consumption tendency.
Hypothesis 3.
The government’s strategy space is defined as D = (S, NS). S represents that governments supervise the AI carbon footprint. NS represents that governments do not supervise the AI carbon footprint. Suppose that the probability that governments implement an S strategy is (), and that the probability that governments adopt an NS strategy is (). The AI industry alliances’ strategy space is defined as E = (GD, NGD). GD indicates that AI industry alliances with a green development strategy limit the AI carbon footprint. NGD indicates that AI industry alliances with a traditional strategy do not reduce the AI carbon footprint. Suppose that the probability that AI industry alliances adopt a GD strategy is (), and that the probability that AI industry alliances adopt an NGD strategy is (). The consumers’ strategy space is defined as F = (P, NP). P denotes that consumers with a green consumption tendency purchase AI products and services. NP denotes that consumers with a green consumption tendency do not purchase AI products and services. Suppose that the probability that consumers adopt a P strategy is (), and that the probability that consumers adopt an NP strategy is (). The above parameters are the functions of time.
Hypothesis 4.
When governments adopt strategy S, the government must bear the monitoring cost, , such as human resource costs and law enforcement costs. Governments using strategy S can obtain image improvement, , via consumers that can purchase green AI products and services. When governments adopt strategy NS, governments will suffer image loss, , if the consumers’ green consumption demand is not being met. No matter if governments supervise or not, governments can obtain additional governance savings, , when AI industry alliances adopt a GD strategy, but governments must bear environmental governance costs, , when AI industry alliances adopt an NGD strategy.
Hypothesis 5.
When AI industry alliances adopt a GD strategy, the output of green AI products and services is , the total cost of production and service is , and the total carbon footprint caused by production and service is . When governments adopt an S strategy and consumers adopt a P strategy, the carbon tax of the AI industry alliances is . The AI industry alliances with a GD strategy can also obtain green technological innovation subsidies, , from governments, along with sales revenue, , and reputation improvement, , from consumers. Apparently, we should assume that . When AI industry alliances adopt an NGD strategy, the output of traditional AI products and services is . Ordinarily, the cost of production and service is lower than that of adopting a GD strategy because the green investment can be saved. The carbon footprint caused by production and service is relatively higher than that of adopting a GD strategy. At this time, the total cost of production and service is , and the total carbon footprint of production and service is . Therefore, when governments adopt an S strategy and consumers adopt a P strategy, the AI industry alliances with an NGD strategy must bear the carbon tax and penalty from governments due to excess emissions, along with the sales revenue and fame loss from consumers. Apparently, we should assume that , , , .
Hypothesis 6.
Because AI products and services produced in a low-carbon manner or produced in a traditional manner have no distinct differences in their nature and performance [24,25,28], the unit utility, , that consumers obtain by purchasing green and traditional AI products and services, is equivalent [24]. In addition, we can also suppose that the unit utility of traditional AI products and services is greater than their price, whereas the unit utility of green AI products and services may be less than their price () [24]. When consumers adopt a P strategy and purchase green AI products and services, they will obtain utility, , by using the AI products and services, gain self-satisfaction, , by purchasing green AI products and services, and receive subsidies, , from governments with an S strategy. When consumers adopt a P strategy and purchase traditional AI products and services, they can obtain utility, , by using AI products and services. Whether consumers purchase AI products and services or not, consumers can obtain health benefits, , when AI industry alliances adopt a GD strategy; consumers must bear the loss of health, , resulting from environmental pollution when AI industry alliances adopt an NGD strategy. Apparently, we should assume that and .
Hypothesis 7.
Assume that the quantity of AI products and services produced by AI industry alliances is equal to the quantity of AI products and services purchased by consumers [24]. Without loss of generality, we should also assume that because, according to the general law of price and demand, the higher the price is, the lower the demand is. Based on this, we can find , , and . AI industry alliances must bear the value loss when consumers adopt an NP strategy. Suppose that the value loss of unsalable green AI products and services is , and the value loss of unsalable traditional AI products and services is [24]. The notations of the parameters mentioned above are presented in Table 2.
Table 2.
The notations of the parameters mentioned above.
3.2.2. The Relationships between the Three Participants and the Payoff Matrix of the Three Parties
According to the model assumptions mentioned above, the relationships between these three participants for limiting the AI carbon footprint can be described in Figure 1, and the payoff matrix of these three players is shown in Table 3.
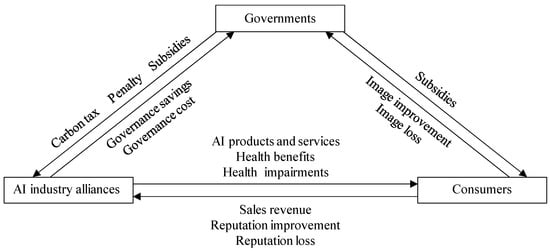
Figure 1.
The relationships between these three participants for limiting the AI carbon footprint.
Table 3.
The payoff matrix of these three players.
4. Stability Analysis of These Three Players’ Strategies
4.1. Stability Analysis of Governments’ Strategies
The expected revenue of governments using strategy S, the expected revenue of governments using strategy NS, the average expected revenue of governments, the dynamic replicator equation for governments, and the first derivative of the dynamic replicator equation can be expressed as , , , and respectively. The mathematical expressions of , , , and can be written as follows:
According to the differential equation stability theorem, if, and only if, and , the equilibrium strategy of governments can be determined. However, due to the sign of the coefficients of and being indefinite, we cannot unpack the equilibrium strategy of governments when the strategies of AI industry alliances and consumers vary.
4.2. Stability Analysis of AI Industry Alliances’ Strategies
The expected revenue of AI industry alliances using the GD strategy, the expected revenue of AI industry alliances using the NGD strategy, the average expected revenue of AI industry alliances, the dynamic replicator equation of AI industry alliances, and the first derivative of the dynamic replicator equation can be set as , , , and respectively. The mathematical expression of , , , and can be written as follows:
According to the differential equation stability theorem, if, and only if, and , the equilibrium strategy of AI industry alliances can be determined.
Proposition 1.
such that when , the equilibrium strategy of AI industry alliances is GD; when , the equilibrium strategy of AI industry alliances is NGD; when , the equilibrium strategy of AI industry alliances cannot be determined.
Proof of Proposition 1.
Let . Apparently, ; that is, is an increasing function of . When , , , , and the equilibrium strategy of AI industry alliances is, therefore, GD. When , , , , and the equilibrium strategy of AI industry alliances is, therefore, NGD. When , , , Therefore, ; that is, the equilibrium strategy of AI industry alliances cannot be determined. Proposition 1 is proven. □
Proposition 1 suggests that the proportion of AI industry alliances selecting strategy GD will be enhanced when the proportion of governments adopting strategy S increases.
4.3. Stability Analysis of Consumers’ Strategies
The expected revenue of consumers using strategy P, the expected revenue of consumers using strategy NP, the average expected revenue of consumers, the dynamic replicator equation of consumers, and the first derivative of the dynamic replicator equation can be set as , , , and , respectively. The mathematical expressions of , , , and can be written as follows:
According to the differential equation stability theorem, if, and only if, and , the equilibrium strategy of consumers can be determined.
Proposition 2.
such that when , the equilibrium strategy of consumers is P; when , the equilibrium strategy of consumers is NP; when , the equilibrium strategy of consumers cannot be determined.
Proof of Proposition 2.
Let . Apparently, ; that is, is an increasing function of . When , , , , and the equilibrium strategy of consumers is, therefore, P. When , , , , and the equilibrium strategy of consumers is, therefore, NP. When , , , . Therefore, ; that is, the equilibrium strategy of consumers cannot be determined. Proposition 2 is proven. □
Proposition 2 suggests that the proportion of consumers choosing strategy P will be enhanced when the proportion of governments adopting strategy S increases.
4.4. Stability Analysis of These Three Players’ Strategy Profiles
We can combine the three dynamic replicator equations mentioned above into a three-dimensional dynamic replicator system, which constitutes the following:
If the three equations are all zero, this indicates that equilibrium has been achieved in the system and that the system will no longer evolve. At this time, eight pure strategy equilibrium points, including (1,1,1), (1,1,0), (1,0,1), (1,0,0), (0,1,1), (0,1,0), (0,0,1), and (0,0,0), can be obtained, and some mixed strategy equilibrium points can also be obtained. However, subject to certain scenarios, some of these equilibrium points may be unstable equilibrium points or saddle points. The stability of these equilibrium points needs further analysis.
The stability analysis can be divided into two stages. First, according to evolutionary game theory, the stable equilibrium points and asymptotically stable equilibrium points must be strict Nash equilibrium points, namely pure strategy equilibrium points. Therefore, the mixed strategy equilibrium points are unstable equilibrium points, and we will only consider the stability and its conditions for the eight pure strategy equilibrium points. Second, the stability and its conditions for the eight pure strategy equilibrium points can be analyzed by using the Jacobian matrix. The Jacobian matrix of the three-dimensional dynamic replicator system can be written as follows:
Eight constant matrices can be obtained when substituting the eight pure strategy equilibrium points mentioned above into the Jacobian matrix , respectively. For these constant matrices, the elements located in the diagonal are not equal to zero, but the elements located in other places are equal to zero. Therefore, the elements located in the diagonal are the eigenvalues of these constant matrices. The eigenvalues of these constant matrices are displayed in Table 4.
Table 4.
Eigenvalues of the eight constant matrices.
According to the Lyapunov stability condition, the equilibrium points are asymptotically stable when all the eigenvalues of the Jacobian matrix are lower than zero, namely, , and . If at least one of the eigenvalues of the Jacobian matrix is greater than zero, then the equilibrium points are unstable [29].
According to the above assumptions, . Therefore, it is clear that the equilibrium points (1,0,0) and (0,0,0) are unstable equilibrium points based on Lyapunov stability conditions. The stability of the other pure strategy equilibrium points will be analyzed under different scenarios.
Scenario 1.
When , and , (1,1,1) is the unique stable equilibrium point, the stable equilibrium strategy profile is now (S,GD,P), where governments adopt strategy S, AI industry alliances adopt strategy GD, and consumers adopt strategy P. At this moment, (1,1,0), (1,0,1), and (0,1,1) are unstable equilibrium points, and (0,1,0) and (0,0,1) are saddle points.
Scenario 2.
When , and , then (1,1,0) is the unique stable equilibrium point. Therefore, the stable equilibrium strategy profile is now (S,GD,NP), where governments adopt strategy S, AI industry alliances adopt strategy GD, and consumers adopt strategy NP. At this moment, (1,1,1), (0,1,0), and (0,0,1) are unstable equilibrium points, and (0,1,1) and (1,0,1) are saddle points.
Scenario 3.
When , and , (1,0,1) is the unique stable equilibrium point, the stable equilibrium strategy profile is now (S,NGD,P), where governments adopt strategy S, AI industry alliances adopt strategy NGD, and consumers adopt strategy P. At this moment, (1,1,1) and (0,0,1) are unstable equilibrium points, and (1,1,0), (0,1,0), and (0,1,1) are saddle points.
Scenario 4.
When , and , (0,1,1) is the unique stable equilibrium point, the stable equilibrium strategy profile is now (NS,GD,P), where governments adopt strategy NS, AI industry alliances adopt strategy GD, and consumers adopt strategy P. At this moment, (1,1,1), (0,1,0), (0,1,1), (1,0,1), and (0,0,1) are unstable equilibrium points. Obviously, (0,1,1) is the ideal consequence. When the evolutionary game system reaches (0,1,1), although there is no government supervision, AI industry alliances provide green AI products and services, and the green consumption demand of consumers can be met. Therefore, when the evolutionary game system reaches (0,1,1), this means that the system has reached the optimal state.
Scenario 5.
When , and , (0,1,0) is the unique stable equilibrium point, the stable equilibrium strategy profile is now (NS,GD,NP), where governments adopt strategy NS, AI industry alliances adopt strategy GD, and consumers adopt strategy NP. At this moment, (1,1,0) and (0,1,1) are unstable equilibrium points, and (1,1,1), (1,0,1), and (0,0,1) are saddle points.
Scenario 6.
When , and , (0,0,1) is the unique stable equilibrium point, the stable equilibrium strategy profile is now (NS,NGD,P), where governments adopt strategy NS, AI industry alliances adopt strategy NGD, and consumers adopt strategy P. At this moment, (1,1,0), (1,0,1), and (0,1,1) are unstable equilibrium points, and (1,1,1) and (0,1,0) are saddle points.
5. Numerical Simulation
In this section, we will first assign values to the key parameters based on the case of smart air conditioner consumption in China and related studies. Second, we will use MATLAB to verify the stability of the optimal strategy profile mentioned above and to analyze the evolution paths of the three players based on the initial values. Third, we will conduct parameter sensitivity analysis based on the initial values and further explore the impacts of the key factors on these three players’ strategy selection.
5.1. Case Choosing and Parameter Settings
The procedure for assigning values to the key parameters is as follows. First, we will assign values to the key parameters based on a true case and related studies. Second, because some of the parameters are abstract, it is difficult to assign values to these parameters according to the true case and related studies. Therefore, the related values will be assigned subjectively, which is a practice that is widely adopted by other researchers in the field of evolutionary game study [24,25].
This paper will take Gree smart air conditioner consumption in China as a case for simulation. The reasons are as follows. First, the production and use of air conditioners will generate a vast carbon footprint. The worldwide carbon emissions from air conditioner operation will rise to 2070 million metric tons of CO2 by 2050 [30]. With the rapid improvement of AI technologies, smart air conditioners have been produced and favored by consumers. Smart air conditioners have become one of the most important parts of distributed AI devices. Therefore, the carbon footprint from smart air conditioners is becoming the most significant source of the AI carbon footprint. Second, limiting the carbon footprint of smart air conditioners is closely related to these three players mentioned above. Therefore, the case is consistent with the above model assumptions. Third, Gree is a world-famous air conditioner manufacturer, and Gree smart air conditioners are used widely in China. However, more importantly, starting in 2022, China’s local governments took some measures to promote the consumption of green smart air conditioners. Thus, o the values of the key parameters can be obtained based on this case.
To be more specific, when compared with other smart air conditioners, we took smart air conditioner A, with the product number KFR-72LW/(72530) FNhAm-B1, and smart air conditioner B, with the product number KFR-72LW/(72530) FNhAc-B3, as the research objects for simulation analysis. Both of these smart air conditioners were produced by Gree in 2021. The reasons are as follows. First, according to the assumptions in this paper, the chosen smart air conditioners must be produced in a green way and in a traditional way. Obviously, smart air conditioners cannot be produced in two ways simultaneously. Therefore, we not only had to choose the smart air conditioners that are produced in a green way but also had to select another smart air conditioner that was similar to the former but was produced in a traditional way. Fortunately, we found that the Gree smart air conditioners A and B satisfy these research needs because both of them have a smart defrosting function, meaning the two Gree smart air conditioners have a similar function. However, Gree smart air conditioner A was included in the list of green products manufactured in a green way, as per the 2021 Ministry of Industry and Information Technology of China publication, and so it belongs to the category of green smart air conditioners. In contrast, Gree smart air conditioner B was not included in this list, so it belongs to nongreen smart air conditioners. Second, we also considered other smart air conditioners that are produced by Midea, Haier, Changhong, and so on. However, we found that the other smart air conditioners could not satisfy the research needs because of the lack of comparisons, missing data, and poor timeliness.
Currently, the prices of smart air conditioners A and B are CNY 6799 and 5999, respectively [31,32]. According to PWC’s 2022 Global Consumer Insight China Report, 45% of the respondents in China are willing to pay more than average for products that use recycled, sustainable, or environmentally friendly materials [33]. Therefore, we can roughly assume that the production and sales volume of smart air conditioner A is = 5 if the production and sales volume of smart air conditioner B is = 10. Thus, the production and sales revenue of smart air conditioner A is CNY = 6799 5 = 33,995, and the production and sales revenue of smart air conditioner B is CNY = 5999 10 = 59,990. According to the relevant research report, in 2021, the revenue from Gree air conditioners actually accounted for 91.75% of the total revenue of Gree electric appliances, and the net profit rate of Gree electric appliances was 12.15% [34]. In addition, young consumers in China are willing to pay a 10–20% premium for environmentally friendly products and services [35]. Therefore, if we suppose that the two smart air conditioners have the same net profit rate and that the green premium of smart air conditioner A is 10%, then we can roughly estimate the total cost of the two smart air conditioners. The price that does not include the green premium of smart air conditioner A is CNY 6799/1.1 = 6180.91. The total cost of smart air conditioner A is CNY = [6180.91 (6180.91 0.1215)] 5 = 27,149.65, and the total cost of smart air conditioner B is CNY = [5999 (5999 0.1215)] 10 = 52,701.22. The coefficient of value loss can be set as = 0.2 [24].
Because China has yet to impose a carbon tax on air conditioner manufacturers, the above total cost does not include the carbon tax. Therefore, the carbon tax should also be estimated. China’s carbon price is relatively low when compared to that of the EU and the US. In 2022, the peak carbon price was CNY 62/ton, and the annual average carbon price was CNY 55.30/ton in China [36]. Therefore, we suppose the potential carbon price of China is CNY 100/ton [28]. The total carbon emissions of an air conditioner over its entire life cycle (10 years) are 5128 kg [37]. According to the air conditioner carbon emission reduction potential assessment report released by Midea, which is also a well-known manufacturer of air conditioners in China, the annual emission reduction potential of an air conditioner over its service stage is 135.5 kg/year [38]. Therefore, we assume that the carbon emissions of smart air conditioner B are 5128 kg, and the carbon emissions of smart air conditioner A are 5128 133.5 10 = 3793 kg. Based on this, the carbon tax that should be paid for producing and selling smart air conditioner A is CNY = 3.793 5 100 = 1896.5, and the carbon tax that should be paid for producing and selling smart air conditioner B is CNY = 5.128 10 100 = 5128. It should be pointed out that the carbon tax mentioned above was calculated according to the connotation of Scope 3 emissions; that is, AI industry alliances should be responsible for the carbon emissions generated during the entire life cycle of AI products and services. In other words, AI industry alliances should be responsible for the carbon emissions caused by the downstream use of AI products.
At present, the subsidy offered by governments to consumers who purchase green smart air conditioners is 10% of the selling price [39]. Therefore, the subsidy value for consumers is CNY = 6799 0.1 5 = 3399.5. Without loss of generality, we set the value of to 1.5; namely, the green consumption tendency of consumers is at a moderate level under the initial condition. The values of the rest of the parameters were assigned subjectively by considering the practice of China and borrowing from other studies [24]. The initial values of the parameters are shown in Table 5.
Table 5.
The initial values of the parameters.
5.2. Stability Verification of Optimal Strategy Profile
In terms of the evolutionary result, under the initial condition, the inequality conditions of Scenario 4 can be satisfied, and the evolutionary game system will reach the optimal state (0,1,1). The simulation results are shown in Figure 2a,b. It can be seen from Figure 2a,b that the initial values of , , and are 0.1 and are taken in steps of 0.2 from 0.1 to 0.9, meaning the initial strategies of the three participants are diverse. However, with the continuous extension of evolutionary time, the values of eventually converge to 0, and the values of and gradually converge to 1. The reasons are as follows. In this scenario, the total carbon tax that the governments gained from AI industry alliances adopting strategy GD and the image benefits that the governments obtained from consumers adopting strategy P are lower than the total supervision cost that governments must bear and the subsidies they offer to AI industry alliances and consumers: . The benefits obtained by AI industry alliances adopting strategy GD outweigh those of adopting strategy NGD: . The benefits obtained by consumers adopting the P strategy are greater than the costs of green AI products and services: . Therefore, whatever the initial strategies of the three players are, the governments will adopt strategy NS gradually, the AI industry alliances will ultimately adopt strategy GD, and the consumers will adopt strategy P finally.
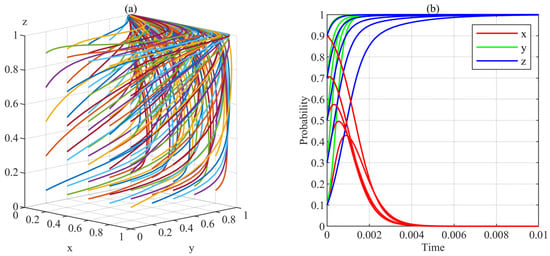
Figure 2.
The evolutionary results of Scenario 4. (a) the evolutionary paths; (b) the evolutionary speed.
In terms of evolutionary speed, it can be seen in Figure 2b that the speed at which these three players achieve a stable state is different under the initial condition. Whatever the initial values of , , and are, the AI industry alliances will be the first to reach a steady state; then, the governments achieve a stable state, and the speed at which consumers achieve a stable state is the slowest. This indicates that under the initial condition, the speed of adjusting the strategy is the fastest under AI industry alliances, the consumers’ speed of adjusting their strategy is the slowest, and the speed of governments adjusting their strategy is at a medium level.
In terms of the evolutionary process, it can also be seen in Figure 2b that the evolutionary strategy paths of governments have a tendency to increase first and then decrease when the initial values of , , and are at a relatively low level. This indicates that regulation by governments is indispensable for limiting the AI carbon footprint when the probability that AI industry alliances will adopt strategy GD and the probability that consumers will adopt strategy P are relatively low. In general, the participants’ motivation might be underpowered for limiting the AI carbon footprint during the early stage because the uncertainty of the strategies of other players is higher, and the risks are also higher. Therefore, regulation by governments is indispensable for limiting the AI carbon footprint during the early stages. In order to drive the system to an optimal state, governments should first put forward some policy measures for limiting the AI carbon footprint.
5.3. Parameters Sensitivity Analysis
5.3.1. Key Parameters Choice and Parameter Variation Range Settings
In order to explore the influence of key variables on these three players’ strategy selection, we had to first choose the key parameters that impact these three players’ strategy selection and then set the variation range of these key parameters.
In terms of key parameter choice, we selected the key parameters that impacted these three players’ strategy selection based on the inequality conditions of Scenario 4 because Scenario 4 is the optimal state of the system. First, according to the inequality conditions of Scenario 4, the green consumption tendency, , the image benefits, , the regulatory cost, , the carbon price, , the subsidies, , to consumers, and the subsidies, , to AI industry alliances are the critical factors regarding the strategy selection of governments. Thus, we investigated how these variables influence the strategy selection of governments. Second, according to the inequality conditions of Scenario 4, the green consumption tendency, , the carbon price, , the subsidies, , to AI industry alliances, the reputation improvement, , and the reputation loss, , are the crucial factors in the strategy selection of AI industry alliances. Thus, we investigated how these variables influence the strategy selection of AI industry alliances. Third, according to the inequality conditions of Scenario 4, the green consumption tendency, , the subsidies, , to consumers, the self-satisfaction, obtained from green consumption, and the utility, , gained from green consumption are the significant factors for the strategy selection of consumers. Thus, we investigated how these variables influence the strategy selection of consumers.
In terms of key parameter variation range settings, we set the range of key parameter variation based on the initial values of the abovementioned parameters. When the other initial values remain unchanged, we set the values for green consumption tendency, , as 1, 1.5, and 2, which represent a low, medium, and high level of green consumption tendency, respectively. All of the following values were set under the conditions that remaining other values/parameters were kept the same: When the other initial values are kept unchanged, set the values of image benefits, , as CNY 250, 500 and 750, which represents a low, medium, and high level of image benefit, respectively; set the values of regulatory cost, , as CNY 500, 1000, 1500, which represents a low, medium, and high level of regulatory cost, respectively; set the values of carbon price, as CNY 50, 100, 150, which represents a low, medium, and high level of carbon price, respectively; set the values of the subsidies to consumers, , as CNY 1699.75, 3399.5, 5099.25, which represents that the subsidies to consumers are 5%, 10%, and 15% of the selling price, respectively; namely, a low, medium, and high level of subsidies to the consumers, respectively; set the values of the subsidies to AI industry alliances, , as CNY 60, 100, 140, which represents a low, medium, and high level of subsidies to AI industry alliances, respectively; set the values for the reputation improvement, , as CNY 100, 200 and 300, which represents a low, medium, and high level of reputation improvement, respectively; set the values of the reputation loss as CNY 250, 500, 750, which represents a low, medium, and high level of reputation loss, respectively; set the values of self-satisfaction as CNY 1000, 2000, 3000, which represents a low, medium, and high level of self-satisfaction, respectively; set the values of utility as CNY 30,000, 31,500, 33,000, which represents a low, medium, and high level of utility, respectively. Without loss of generality, the initial values of , , were set as 0.5.
5.3.2. The Impacts of Key Factors on Strategy Selection of Governments
Figure 3 shows the impacts of key variables on the strategy selection of governments. As depicted in Figure 3a–c, with the extension of evolutionary time, the same ESS can be reached regardless of the green consumption tendency, image benefits, or carbon price. Meanwhile, the evolutionary strategy paths take on a tendency of increasing first and then decreasing regardless of the green consumption tendency, image benefits, or carbon price, which indicates that regulation by governments is indispensable for limiting the AI carbon footprint during the early stages. Besides, the higher the green consumption tendency, image benefits, and carbon price are, the slower the ESS is reached. The higher the green consumption tendency, image benefits, and carbon price are, the higher the maximum adoption rate of strategy S is to achieve. The results indicate that governments are sensitive to these factors, and that these factors can play a positive role in promoting government adoption of strategy S. In addition, the probability that governments adopt strategy S is the lowest when the carbon price is at a low level, but the probability that governments adopt strategy S is the highest when the carbon price is at a high level. Therefore, governments are most sensitive to the carbon price.
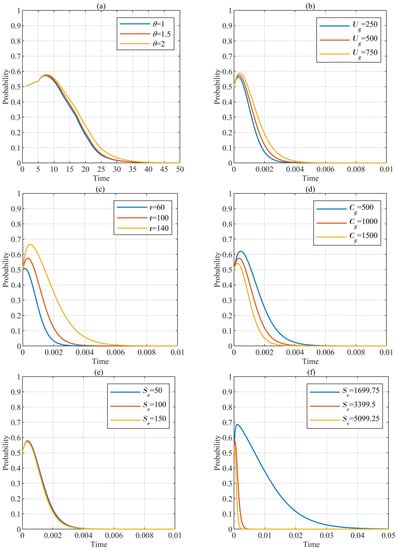
Figure 3.
The impacts of key variables on strategy selection of governments. (a) shows the impact of green consumption tendency on strategy selection of governments. (b) shows the impact of image benefits on strategy selection of governments. (c) shows the impact of carbon price on strategy selection of governments. (d) shows the impact of regulatory cost on strategy selection of governments. (e) shows the impact of subsidies to consumers on strategy selection of governments. (f) shows the impact of subsidies to AI industry alliances on strategy selection of governments.
As shown in Figure 3d–f, with the prolonging of time elapsed, all the evolutionary paths gradually converge at the same ESS regardless of the regulatory cost or the subsidies to consumers and AI industry alliances. Meanwhile, the strategy evolution paths take on a tendency to increase first and then decrease regardless of the regulatory cost or the subsidies to consumers and AI industry alliances. Besides, the higher the regulatory cost and the subsidies to consumers and AI industry alliances are, the faster the ESS is reached. The higher the regulatory cost and the subsidies to consumers and AI industry alliances are, the lower the maximum adoption rate of strategy S is achieved. The results indicate that governments are also sensitive to these factors, but these factors can play a negative role in promoting government adoption of strategy S. In addition, the probability that governments adopt strategy S is the highest when the subsidies to consumers are at a low level, but the probability that governments adopt strategy S is the lowest when the subsidies to consumers are at a high level. Therefore, governments are most sensitive to the subsidies to consumers.
5.3.3. The Impacts of Key Variables on Strategy Selection of AI Industry Alliances
Figure 4 shows the impacts of key variables on the strategy selection of AI industry alliances. As depicted in Figure 4, as time goes on, all the evolutionary paths gradually converge at the same ESS regardless of green consumption tendency, carbon price, subsidies, reputation improvement, and reputation loss. Still, all the times taken to reach the ESS are nearly identical, regardless of green consumption tendency, subsidies, reputation improvement, and reputation loss. However, the higher the carbon price is, the faster the ESS is reached. This implies that AI industry alliances are not sensitive to subsidies, reputation improvement, or reputation loss but are most sensitive to carbon prices.
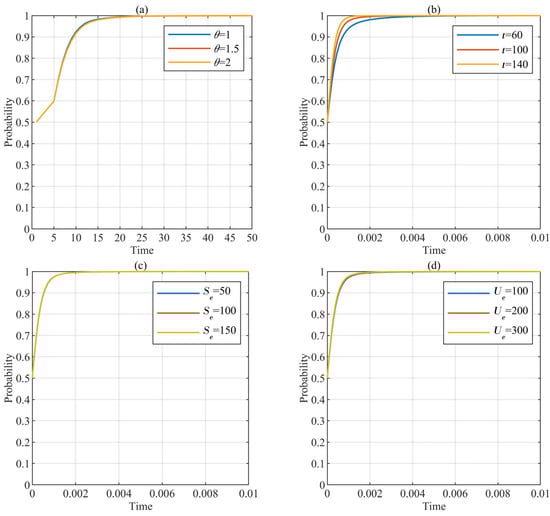
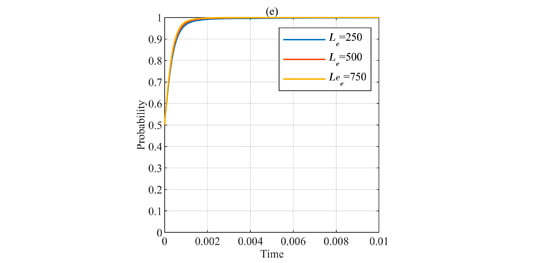
Figure 4.
The impacts of key variables on strategy selection of AI industry alliances. (a) shows the impact of green consumption tendency on strategy selection of AI industry alliances. (b) shows the impact of carbon price on strategy selection of AI industry alliances. (c) shows the impact of subsidies on strategy selection of AI industry alliances. (d) shows the impact of reputation improvement on strategy selection of AI industry alliances. (e) shows the impact of reputation loss on strategy selection of AI industry alliances.
5.3.4. The Impacts of Key Variables on Strategy Selection of Consumers
Figure 5 shows the impacts of key variables on the strategy selection of consumers. As shown in Figure 5a,c,d, when the values of green consumption tendency, self-satisfaction, and utility are at a low level, the evolutionary paths of consumers exhibit periodic fluctuations. However, the ESS can be reached when the values of green consumption tendency, self-satisfaction, and utility are at a medium or high level, and the higher the green consumption tendency, self-satisfaction, and utility are, the faster the ESS is reached. These results demonstrate that consumers are most sensitive to green consumption tendency, self-satisfaction, and utility. As shown in Figure 5b, all the evolutionary paths gradually converge at the same ESS regardless of subsidies, and the higher the subsidies are, the faster the ESS is reached. Moreover, it can also be found that the time taken to achieve the ESS is almost the same when the subsidies offered by governments to consumers who purchase green smart air conditioners are 10% and 15% of the selling price. This indicates that the consumers are not sensitive to subsidies, meaning that green consumption subsidies cannot adequately stimulate consumers’ green consumption behavior.
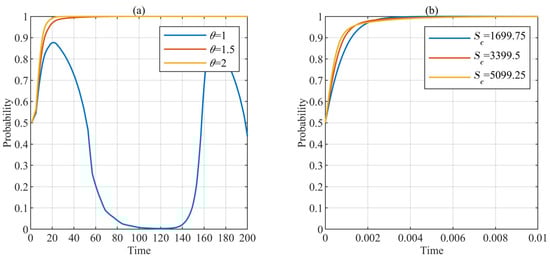
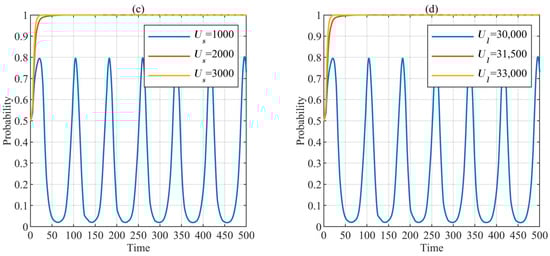
Figure 5.
The impacts of key variables on strategy selection of consumers. (a) shows the impact of green consumption tendency on strategy selection of consumers. (b) shows the impact of subsidies on strategy selection of consumers. (c) shows the impact of self-satisfaction on strategy selection of consumers. (d) shows the impact of utility on strategy selection of consumers.
6. Discussion and Implications
6.1. Discussion
On the one hand, the results in this paper corroborate the findings of the previous work. More precisely, this study concludes that governments can play an important role in limiting the AI carbon footprint. This finding is in accordance with the studies conducted by Kaack et al. [5] and Cowls et al. [6], which emphasize the importance of governments in limiting the AI carbon footprint. On the other hand, when compared to other studies, there are some new findings in this paper. First, this study suggests that regulation by governments is indispensable for limiting the AI carbon footprint during the early stages but is dispensable when the system achieves an optimal state. In other words, our study emphasizes the transition role of governments in the process of limiting the AI carbon footprint. However, other studies merely highlight the importance of regulation by governments of the AI carbon footprint and do not further discuss the different roles of governments during different stages [5,6]. Second, when compared to other factors, this paper finds that governments and AI industry alliances are most sensitive to carbon prices. This indicates that carbon tax can be regarded as the most important policy tool for governments in the process of limiting the AI carbon footprint generated from AI industry alliances. However, previous studies do not put a particular emphasis on this point [5,6]. There is no doubt that our findings have important practical guidance value in limiting the AI carbon footprint. Third, this study also concludes that governments are sensitive to the subsidies given to consumers. This means that in terms of limiting the AI carbon footprint, consumers can influence the behavior of governments. However, other studies do not fully highlight the influence of consumers in limiting the AI carbon footprint.
6.2. Recommendations
Based on the above results, we can put forward four important insights when limiting the AI carbon footprint. First, governments have a great influence on the strategy selection of AI industry alliances and consumers, and regulation by governments is indispensable for limiting the AI carbon footprint during the early stages but is dispensable when the system achieves an optimal state. Therefore, governments should realize the importance of limiting the AI carbon footprint and fulfill regulatory responsibility at the beginning of this process. Meanwhile, with the gradual establishment of the market mechanism for limiting the AI carbon footprint, the interventions by governments should be reduced inch by inch. Second, governments are most sensitive to carbon prices and subsidies to consumers, and the AI industry alliances are also most sensitive to carbon prices. Therefore, if governments decide to adopt a regulatory strategy, carbon markets that have more industry sectors and a higher trading efficiency must be constructed so as to shape a reasonable carbon price and motivate AI industry alliances to reduce their carbon footprint. Although governments are most sensitive to subsidies given to consumers, the consumers are not sensitive to subsidies. Therefore, when governments adopt a regulatory strategy, higher subsidies that are given to consumers are not always better for limiting the AI carbon footprint, and the amounts of subsidies given to consumers should be set according to the revenues of governments. Third, consumers are sensitive to green consumption tendencies, self-satisfaction, and utility. Therefore, AI industry alliances should realize the importance of green development and formulate a green development strategy so as to meet the green consumption needs of consumers and push forward the AI industry’s green transition. To be more specific, AI industry alliances can take action by building green supply chains, setting unified energy efficiency standards for green AI products and services, increasing investment in green AI product and service research and development, and disseminating the environmental value of green AI products and services to consumers. Last but not least, consumers should stick to the concept of green consumption and purchase green AI products and services if possible. For instance, consumers can inquire about the potential negative impact of AI products and services on the environment before purchasing them.
6.3. Limitations
The main limitations of this paper are as follows. First, the evolutionary game model constructed in this paper primarily describes the interactions between governments, AI industry alliances, and consumers in the process of limiting the AI carbon footprint. However, AI industry alliances contain many diverse participants, such as cloud providers, AI researchers, and different companies using AI models, and these will influence each other in the process of limiting the AI carbon footprint. However, this paper does not consider the interactions between said participants that belong to AI industry alliances. Second, this paper verifies the stability of the optimal strategy profile and conducts parameter sensitivity analysis based on the case of smart air conditioner consumption in China, but China’s market circumstances and institutional environment may be different from other countries’. Therefore, some conclusions may not be applicable in other countries.
6.4. Conclusions
With the ever-growing adoption of AI, AI is now considered to play an important role in tackling climate change. At the same time, the carbon footprint caused by AI is also scaling quickly and may offset the effort to reduce carbon emissions to some extent. In order to explore effective approaches for limiting the AI carbon footprint, we first constructed a tripartite evolutionary game model by taking governments, AI industry alliances, and consumers into consideration. Then, the stability of the strategies of the three players was analyzed. Third, we verified the stability of the optimal strategy profile and explored the impacts of key factors on the three players’ strategy selection, based on the case of smart air conditioner consumption in China. There are four main findings in this paper.
First, the proportion of AI industry alliances that select strategy GD and the proportion of consumers that choose strategy P are enhanced when the proportion of strategy S adopted by governments increases. Second, the ideal consequence is (0,1,1); at this time, governments adopt strategy NS, AI industry alliances adopt strategy GD, and consumers adopt strategy P. However, regulation by governments is indispensable for limiting the AI carbon footprint during the early stages. Third, the speed of strategy adjustment by AI industry alliances is the fastest, whereas that by consumers is the slowest, and governments operate at a medium speed. Last but not least, although the green consumption tendency, image benefit, regulatory cost, carbon price, and subsidies given to consumers and AI industry alliances can largely influence the strategy selection of governments, governments are most sensitive to the carbon price and the subsidies given to consumers. AI industry alliances are not sensitive to subsidies, reputation improvement, and reputation loss but are most sensitive to carbon prices. Consumers are sensitive to green consumption tendencies, self-satisfaction, and utility but are not sensitive to subsidies.
Author Contributions
Conceptualization, K.J. and X.W.; methodology, K.J. and X.W.; software, X.W. and T.X.; validation, X.W.; formal analysis, T.X. and X.W.; investigation, X.W.; resources, X.W.; data curation, X.W.; writing—original draft preparation, K.J. and X.W.; writing—review and editing, K.J. and X.W.; visualization, X.W.; supervision, K.J.; project administration, K.J. All authors have read and agreed to the published version of the manuscript.
Funding
This research was supported by the National Social Science Foundation of China (Grant No. 22BJY139), the Major Project of National Social Science Foundation of China (Grant No. 20&ZD068), and the Jiangxi Province Graduate Innovation Fund Project (Grant No. YC2022-B078).
Institutional Review Board Statement
Not applicable.
Informed Consent Statement
Not applicable.
Data Availability Statement
Not applicable.
Conflicts of Interest
The authors declare no conflict of interest.
References
- Kaur, D.; Uslu, S.; Rittichier, K.J.; Durresi, A. Trustworthy Artificial Intelligence: A Review. ACM Comput. Surv. 2023, 55, 1–38. [Google Scholar] [CrossRef]
- Rolnick, D.; Donti, P.L.; Kaack, L.H.; Kochanski, K.; Lacoste, A.; Sankaran, K.; Ross, A.S.; Milojevic-Dupont, N.; Jaques, N.; Waldman-Brown, A.; et al. Tackling Climate Change with Machine Learning. ACM Comput. Surv. 2023, 55, 1–96. [Google Scholar] [CrossRef]
- Vinuesa, R.; Azizpour, H.; Leite, I.; Balaam, M.; Dignum, V.; Domisch, S.; Felländer, A.; Langhans, S.D.; Tegmark, M.; Fuso Nerini, F. The Role of Artificial Intelligence in Achieving the Sustainable Development Goals. Nat. Commun. 2020, 11, 233. [Google Scholar] [CrossRef] [PubMed]
- Nishant, R.; Kennedy, M.; Corbett, J. Artificial Intelligence for Sustainability: Challenges, Opportunities, and a Research Agenda. Int. J. Inf. Manag. 2020, 53, 102104. [Google Scholar] [CrossRef]
- Kaack, L.H.; Donti, P.L.; Strubell, E.; Kamiya, G.; Creutzig, F.; Rolnick, D. Aligning Artificial Intelligence with Climate Change Mitigation. Nat. Clim. Chang. 2022, 12, 518–527. [Google Scholar] [CrossRef]
- Cowls, J.; Tsamados, A.; Taddeo, M.; Floridi, L. The AI Gambit: Leveraging Artificial Intelligence to Combat Climate Change-Opportunities, Challenges, and Recommendations. AI Soc. 2023, 38, 283–307. [Google Scholar] [CrossRef]
- Avgerinou, M.; Bertoldi, P.; Castellazzi, L. Trends in Data Centre Energy Consumption under the European Code of Conduct for Data Centre Energy Efficiency. Energies 2017, 10, 1470. [Google Scholar] [CrossRef]
- Bieser, J.C.T.; Hintemann, R.; Hilty, L.M.; Beucker, S. A Review of Assessments of the Greenhouse Gas Footprint and Abatement Potential of Information and Communication Technology. Environ. Impact Assess. Rev. 2023, 99, 107033. [Google Scholar] [CrossRef]
- Taddeo, M.; Tsamados, A.; Cowls, J.; Floridi, L. Artificial Intelligence and the Climate Emergency: Opportunities, Challenges, and Recommendations Comment. One Earth 2021, 4, 776–779. [Google Scholar] [CrossRef]
- Henderson, P.; Hu, J.; Romoff, J.; Brunskill, E.; Jurafsky, D.; Pineau, J. Towards the Systematic Reporting of the Energy and Carbon Footprints of Machine Learning. J. Mach. Learn. Res. 2020, 21, 248. [Google Scholar]
- Luccioni, A.; Lacoste, A.; Schmidt, V. Estimating Carbon Emissions of Artificial Intelligence [Opinion]. IEEE Technol. Soc. Mag. 2020, 39, 48–51. [Google Scholar] [CrossRef]
- Tamburrini, G. The AI Carbon Footprint and Responsibilities of AI Scientists. Philosophies 2022, 7, 4. [Google Scholar] [CrossRef]
- Wu, C.-J.; Raghavendra, R.; Gupta, U.; Acun, B.; Ardalani, N.; Maeng, K.; Chang, G.; Aga, F.; Huang, J.; Bai, C.; et al. Sustainable AI: Environmental Implications, Challenges and Opportunities. Proc. Mach. Learn. Syst. 2022, 4, 795–813. [Google Scholar]
- Chiu, M.-C.; Tu, Y.-L.; Kao, M.-C. Applying Deep Learning Image Recognition Technology to Promote Environmentally Sustainable Behavior. Sustain. Prod. Consum. 2022, 31, 736–749. [Google Scholar] [CrossRef]
- Cao, Z.; Zhou, X.; Hu, H.; Wang, Z.; Wen, Y. Toward a Systematic Survey for Carbon Neutral Data Centers. IEEE Commun. Surv. Tutor. 2022, 24, 895–936. [Google Scholar] [CrossRef]
- Strubell, E.; Ganesh, A.; Mccallum, A. Energy and Policy Considerations for Deep Learning in NLP. In Proceedings of the 57th Annual Conference of the Association for Computational Linguistics (ACL), Florence, Italy, 28 July–2 August 2019; pp. 3645–3650. [Google Scholar] [CrossRef]
- An, J.; Ding, W.; Lin, C. ChatGPT: Tackle the Growing Carbon Footprint of Generative AI. Nature 2023, 615, 586. [Google Scholar] [CrossRef]
- Samuel, G.; Lucivero, F.; Somavilla, L. The Environmental Sustainability of Digital Technologies: Stakeholder Practices and Perspectives. Sustainability 2022, 14, 3791. [Google Scholar] [CrossRef]
- Ligozat, A.-L.; Lefevre, J.; Bugeau, A.; Combaz, J. Unraveling the Hidden Environmental Impacts of AI Solutions for Environment Life Cycle Assessment of AI Solutions. Sustainability 2022, 14, 5172. [Google Scholar] [CrossRef]
- Dodge, J.; Prewitt, T.; des Combes, R.T.; Odmark, E.; Schwartz, R.; Strubell, E.; Luccioni, A.S.; Smith, N.A.; DeCario, N.; Buchanan, W. Measuring the Carbon Intensity of AI in Cloud Instances. In Proceedings of the FAccT’22: 2022 ACM Conference on Fairness, Accountability, and Transparency, Seoul, Republic of Korea, 21–24 June 2022; ACM: Rochester, NY, USA, 2022; pp. 1877–1894. [Google Scholar]
- Gibney, E. How to Shrink Ai’s Ballooning Carbon Footprint. Nature 2022, 607, 648. [Google Scholar] [CrossRef]
- Zhang, J.; Cherian, J.; Sandhu, Y.A.; Abbas, J.; Cismas, L.M.; Negrut, C.V.; Negrut, L. Presumption of Green Electronic Appliances Purchase Intention: The Mediating Role of Personal Moral Norms. Sustainability 2022, 14, 4572. [Google Scholar] [CrossRef]
- Schwartz, R.; Dodge, J.; Smith, N.A.; Etzioni, O. Green AI. Commun. ACM 2020, 63, 54–63. [Google Scholar] [CrossRef]
- Long, Q.; Tao, X.; Shi, Y.; Zhang, S. Evolutionary Game Analysis Among Three Green-Sensitive Parties in Green Supply Chains. IEEE Trans. Evol. Comput. 2021, 25, 508–523. [Google Scholar] [CrossRef]
- Chen, W.; Hu, Z.-H. Using Evolutionary Game Theory to Study Governments and Manufacturers’ Behavioral Strategies under Various Carbon Taxes and Subsidies. J. Clean. Prod. 2018, 201, 123–141. [Google Scholar] [CrossRef]
- Wang, G.; Chao, Y.; Cao, Y.; Jiang, T.; Han, W.; Chen, Z. A Comprehensive Review of Research Works Based on Evolutionary Game Theory for Sustainable Energy Development. Energy Rep. 2022, 8, 114–136. [Google Scholar] [CrossRef]
- China Sustainable Consumption Report. 2022. Available online: https://www.163.com/dy/article/HPJG7SQG0534A4SC.html (accessed on 13 May 2023). (In Chinese).
- Chen, W.; Hu, Z.-H. Analysis of Multi-Stakeholders’ Behavioral Strategies Considering Public Participation under Carbon Taxes and Subsidies: An Evolutionary Game Approach. Sustainability 2020, 12, 1023. [Google Scholar] [CrossRef]
- Allameh, G.; Saidi-Mehrabad, M. A Game Theory Approach in Long-Term Strategy Selection in Biofuel Supply Chain. Environ. Prog. Sustain. Energy 2019, 38, 13122. [Google Scholar] [CrossRef]
- Karali, N.; Shah, N.; Park, W.Y.; Khanna, N.; Ding, C.; Lin, J.; Zhou, N. Improving the Energy Efficiency of Room Air Conditioners in China: Costs and Benefits. Appl. Energy 2020, 258, 114023. [Google Scholar] [CrossRef]
- The Price and Performance Parameters of Green Smart Air Conditioners Produced by Gree. Available online: https://product.yesky.com/product/1116/1116045/ (accessed on 13 May 2023). (In Chinese).
- The Price and Performance Parameters of Traditional Smart Air Conditioners Produced by Gree. Available online: https://product.yesky.com/product/1116/1116784/ (accessed on 13 May 2023). (In Chinese).
- Global Consumer Insight Survey China Report. 2022. Available online: https://baijiahao.baidu.com/s?id=1745291770751725860&wfr=spider&for=pc (accessed on 13 May 2023). (In Chinese).
- The Sales Profit of Gree Air Conditioners. Available online: https://baijiahao.baidu.com/s?id=1732133393944830826&wfr=spider&for=pc (accessed on 13 May 2023). (In Chinese).
- Green Brand Premium in China. Available online: https://baijiahao.baidu.com/s?id=1739689940201355652&wfr=spider&for=pc (accessed on 13 May 2023). (In Chinese).
- China’s Average Carbon Price in 2022. Available online: https://m.thepaper.cn/baijiahao_21372500 (accessed on 13 May 2023). (In Chinese).
- The Carbon Footprint of an Air Conditioner over Its Entire Life Cycle. Available online: http://mp.weixin.qq.com/s?__biz=MzkzNzMwNDMxMA==&mid=2247489290&idx=1&sn=2b860794f0d41264999f57e1eeace8f3&chksm=c290de93f5e75785a3ed4bac06a41c0f6f2345f453a18423483cc71662bb7bf0d899a60a8126#rd (accessed on 13 May 2023). (In Chinese).
- Technical Report on Carbon Footprint and Carbon Reduction Assessment of Air Conditioning Products. Available online: https://finance.sina.com.cn/jjxw/2022-07-16/doc-imizmscv1883791.shtml (accessed on 13 May 2023). (In Chinese).
- The Subsidies Offered by Governments to Consumers. Available online: https://baijiahao.baidu.com/s?id=1759155233488196941&wfr=spider&for=pc (accessed on 13 May 2023). (In Chinese).


Disclaimer/Publisher’s Note: The statements, opinions and data contained in all publications are solely those of the individual author(s) and contributor(s) and not of MDPI and/or the editor(s). MDPI and/or the editor(s) disclaim responsibility for any injury to people or property resulting from any ideas, methods, instructions or products referred to in the content. |
© 2023 by the authors. Licensee MDPI, Basel, Switzerland. This article is an open access article distributed under the terms and conditions of the Creative Commons Attribution (CC BY) license (https://creativecommons.org/licenses/by/4.0/).