Article

Impact of Economic Growth, Trade Openness, Urbanization and Energy Consumption on Carbon Emissions: A Study of India

by
Arvind Goswami
1,
Harmanpreet Singh Kapoor
2,
Rajesh Kumar Jangir
1,
Caspar Njoroge Ngigi
1,
Behdin Nowrouzi-Kia
3,* and
Vijay Kumar Chattu
3,4,5,*
1
Department of Economic Studies, Central University of Punjab, Ghudda, Bathinda 151401, India
2
Department of Mathematics and Statistics, Central University of Punjab, Ghudda, Bathinda 151401, India
3
Department of Occupational Science and Occupational Therapy, Temerty Faculty of Medicine, University of Toronto, Toronto, ON M5G 1V7, Canada
4
Center for Transdisciplinary Research, Saveetha Dental College, Saveetha Institute of Medical and Technical Sciences, Saveetha University, Chennai 600077, India
5
Department of Community Medicine, Faculty of Medicine, Datta Meghe Institute of Medical Sciences (DMIMS), Wardha 442107, India
*
Authors to whom correspondence should be addressed.
Sustainability 2023, 15(11), 9025; https://doi.org/10.3390/su15119025
Submission received: 14 April 2023 / Revised: 25 May 2023 / Accepted: 31 May 2023 / Published: 2 June 2023

Abstract

:
(1) Background: Global warming is one of the most severe environmental problems humans are facing now. This study aims to assess the impacts of economic growth, trade openness, urbanization, and energy consumption on carbon emissions in India; (2) Methodology: In this longitudinal study, data have been collected from World Development Indicators and Our World in Data from 1980 to 2021. Two models have been used in this study, which are ARDL and the random forest model, which is a machine learning algorithm that uses the aggregated prediction for final prediction; (3) Results: The ARDL model revealed that the variables were cointegrated. In the short run, CO2 emissions at previous lag, economic growth, and trade openness negatively correlated with CO2 emissions, while energy consumption and urbanization exhibited a positive correlation. In the long run, energy consumption, urbanization, and trade openness positively correlated with CO2 emissions, while economic growth and CO2 emissions at previous lag demonstrated a negative correlation. The high value of the R2 and low values of RMSE and M.A.E. in the Random Forest model shows the model’s fitness; (4) Conclusions: The study’s findings have been briefly discussed, and a few suggestions have been provided based on the results.

1. Introduction

Global warming is one of the most severe environmental problems that human beings are currently facing. The rising level of carbon dioxide (CO2), the primary contributor to the greenhouse effect, appears to exacerbate the situation. The greenhouse effect is mainly the result of human-induced emissions of greenhouse gases (GHGs). According to Our World in Data, out of the total GHG emissions in 2016, the energy sector alone accounted for about 73.2%, and CO2 contributed about 74% of it [1]. There has been a tremendous increase in CO2 emissions, especially after industrialization [2], as shown below in Figure 1.
Based on the information presented in Figure 1, it is evident that there has been a significant increase in the level of CO2 emissions over time. In particular, the annual CO2 emissions have risen from 5 billion tons annually in the mid-20th century to 35 billion tons annually in 2021. Additionally, the concentration of CO2 in the atmosphere has also increased, from 280 parts per million (PPM) in 1750 to 420 PPM in 2021. This represents a growth of 50% over the period. The primary root cause for this increase in the emissions and concentration of CO2 is the Industrial Revolution. The advent of the industrial revolution led to a notable transformation in the functioning of society, with various countries experiencing significant socioeconomic changes commonly referred to as urbanization and industrialization [3]. Since the commencement of the Western industrial revolution, the concept of a link between urbanization and industrialization has been widely accepted worldwide [4]. This connection was founded on the apparent desire of economies to attain higher economic growth and economic prosperity [3]. On one hand, this interdependence has proven to be a boon by increasing production size and thus supporting economic growth in both developed and emerging economies. On the other hand, it has also led to changes in climate [3].
As a result, urbanization and industrialization equipped society with modernity and higher living standards, with significant implications in the form of unavoidable health difficulties [3]. With the increase in the living standard, the demand for foreign goods has also increased, which has led to the expansion of trade, and the transportation of goods across borders requiring extensive use of energy, which results in a surge in energy demand and, consequently, CO2 emissions [5]. This is particularly true in the case of long-distance transportation, which involves using multiple modes of transportation, such as ships, airplanes, and trucks. The manufacturing process of goods in countries specializing in their production also demands a significant amount of energy, which further contributes to the increase in energy demand and CO2 emissions. Similarly, the production and transportation of agricultural products to international markets result in a substantial carbon footprint. Energy-intensive industries such as steel or cement manufacturing may relocate to countries where energy is cheaper, which can lead to increased CO2 emissions due to the reliance on fossil fuels. However, it is essential to note that international trade can also have positive environmental impacts, such as adopting cleaner technologies and transferring environmentally friendly practices. Therefore, the present study has considered several independent variables, namely trade openness, energy consumption, economic growth, and urbanization, to examine their impact on CO2 emissions. To accomplish this objective, the study has employed an empirical research approach to investigate the relationships between these variables and their effect on CO2 emissions.
The present study focuses on India, the most populous country in the world, with a population of around 1.4 billion people and the World’s fifth-largest economy [6]. By 2030, India’s per capita income is expected to be USD 5000 or more than double its current level [7]. This economic growth will increase energy consumption, international trade, urbanization, and CO2 emissions [8]. All these variables are highly interlinked. Therefore, it is important to understand how these factors are connected and affect the level of GHG emissions so that required steps can be taken to combat the effects of climate change. The relationship among all the selected variables is depicted below in Figure 2.
Figure 2 depicts the relationship between all selected variables, where economic growth is the foundation for industrialization. As the economy grows, industries become concentrated in urban areas, attracting people from rural areas to seek better job opportunities. This, in turn, creates a favorable environment for investors to start production, leading to reduced production costs and increased exports, while people’s desire for foreign goods drives up imports. As trade and investment continue to increase, the concentration of industries in urban areas encourages further migration and faster urbanization. Additionally, increased demand for products due to urbanization leads to increased investments in industries, which complements trade openness and increases production and exports. However, this process also leads to a surge in energy demand, mainly fulfilled by burning fossil fuels, ultimately leading to higher greenhouse gas emissions. In India, in 2021, 42% of the overall energy was consumed in transportation, 30% in industry, and 21% in the residential, services, and agriculture sectors [9]. Most of these energy requirements are satisfied by native coal and petroleum reserves and imported crude oil. As per the Ministry of Power, Government of India (GoI), up to 2022, in total energy generation, the contribution of fossil fuels is approximately 57.5%, hydropower is 11.4%, solar is 15.1%, the wind is 10.2%, and nuclear is only 1.7% [10]. Therefore, it is essential to study the behavior of these variables to combat climate change.

Significance of the Study

The primary goal of this research is to determine the impact of economic growth, trade openness, urbanization, and energy consumption on CO2 emissions in India. These variables have been selected for the study since these are primary contributors to the rising CO2 emissions and can also play a crucial role in achieving sustainable development goals by providing the resources, infrastructure, and opportunities needed to improve the social, economic, and environmental outcomes. Here are some examples given by the UN [11].
  • Economic growth can help to achieve S.D.G. 1 (no poverty), S.D.G. 2 (zero hunger), and S.D.G. 8 (decent work and economic growth) by raising earnings, generating jobs, and reducing hunger and poverty.
  • Trade openness can help achieve S.D.G. 9 (industry, innovation, and infrastructure) and S.D.G. 10 (reduced inequalities) by facilitating the transfer of technology, knowledge, and resources between countries and reducing trade barriers that can impede economic growth and development.
  • Urbanization can help achieve S.D.G. 11 (sustainable cities and communities) by providing essential services like water, sanitization, and healthcare access and promoting sustainable transportation, land use, and building design.
  • Energy consumption can help achieve S.D.G. 7 (affordable and clean energy) and S.D.G. 13 (climate action) by increasing access to affordable and clean energy, promoting energy efficiency, and utilizing renewable energy sources.
However, it is essential to note that achieving the S.D.G.s requires a comprehensive and integrated approach that takes into account the inter-linkages between social, economic, and environmental factors. For example, economic growth and trade openness must be balanced with environmental sustainability and social equity to ensure that the benefits of development are shared by all members of society, including future generations. Similarly, urbanization and energy consumption must be managed in a way that reduces CO2 emissions and promotes resource efficiency while also providing equitable access to essential services and opportunities for all. The remainder of the study is separated into various sections. The materials and methods are described in Section 2. Section 3 contains the results. Section 4 and Section 5 present the discussion and conclusions, respectively.

2. Literature Review

The literature on the factors influencing carbon emissions is relatively extensive. As the amount of study on this topic grows, it can be classified into three groups. The first group looked into the connection between economic progress and carbon emissions. The second group combined urbanization and energy into the economic development and carbon emissions study paradigm. In addition to urbanization and energy, the third group covers control variables such as trade openness [12]. The current study in corporates all three categories and provides an in-depth analysis of the impact of economic growth, energy consumption, trade openness, and urbanization on CO2 emissions in India.

2.1. The Relationship between Economic Growth and Environmental Quality

Environmentalists and policymakers in developing and developed countries have extended divergences about environmental quality and its determinants. This controversy arose due to the environmental Kuznets curve (EKC) hypothesis. It claims that at the beginning of development, the environment’s quality degrades, stabilizes, and finally begins to improve. In a study by Bildirici and Ersin (2018), the authors checked the presence of EKC in case of USA and UK, and the results revealed that the shape of EKC is not stable [13]. In addition to this, various studies have also been carried out to check the presence of EKC [14,15,16,17,18,19,20,21,22,23,24,25].

2.2. The Relationship between Urbanization, Industrialization, and Economic Growth

In 2015, a study by Guan et al. concluded that urbanization is an engine for growth in the Jiangsu Province of China [26], whereas Chen et al., 2014, found that there is no correlation between the rate of urbanization and economic growth at a global level [27]. Frick and Rodríguez (2018) also found that urbanization benefits developed countries; however, this does not hold true in developing countries [28]. Similarly, to find out therelationship between industrialization and the environment, Cherniwchan (2012) applied a two-sector model of neoclassical growth and the environment in a small open economy to examine the impact of industrialization on the environment. The results show that a 1% increase in industrialization leads to a 24% increase in per capita emissions [29]. The relationship between urbanization and industrialization has been extensively covered in the literature [30,31,32,33,34,35].

2.3. The Relationship between Energy Consumption, Economic Growth, and Carbon Emission

Energy consumption is also a significant determinant of economic growth and carbon emissions. In 2010, Acaravci found that in Europe, energy consumption and GDP positively impacts CO2 emissions, while the fair value of GDP harms it [36]. It also reveals the existence of an inverted U-shaped EKC in Denmark and Italy [36]. The study of Zhang and Cheng, 2009 reveals a unidirectional causality running from GDP growth to energy consumption and energy consumption to emissions [37]. It has also been found that both energy consumption and CO2 emissions do not affect economic growth; therefore, the government can design policies related to reducing CO2 emissions without hampering economic growth. In this line, Ali et al., 2016 have also found that economic growth and energy consumption positively impact CO2 emissions, while trade openness negatively impacts CO2 emissions [38]. Other than these studies, a significant amount of work has also been carried out on this relationship [39,40,41,42,43].

2.4. The Relationship between Economic Growth, Trade Openness, Urbanization, Energy Consumption, and Carbon Emission

Ahmad and Zhao (2018) investigated the relationship among urbanization, industrialization, energy consumption, CO2 emissions, and economic growth; it has been found that the impact of urbanization on economic growth varies across different regions as per the level of development; it is positive for developed regions and negative for least developed regions [3]. It has also been found that the impact of CO2 emissions on economic growth is negative [3]. Ghosh and Kanjilal (2014) also tried to explore the relationship between urbanization, energy consumption, and economic growth in India from 1971 to 2008 by using the ARDL model [44]. Unidirectional causality from energy consumption to economic activity and urbanization has been found. Recently, the findings of Wang and Zhang (2021) demonstrated that trade openness reduces carbon emissions in high-income and upper-middle-income countries while having little effect on lower-middle-income countries. In contrast to this, trade openness has increased carbon emissions in low-income countries [12]. The diverse effects of trade openness on carbon emissions suggest that trade openness benefits rich countries by decoupling economic growth from carbon emissions but harms poor countries. Addressing climate change through the mitigation of GHGs and adaptation to its impacts is a serious concern today to save the planet, protect life, and achieve sustainable development [45].
Furthermore, rising individual income and population disrupt the decoupling of economic growth and carbon emissions. Renewable energy and high oil costs helped to decouple economic growth from carbon emissions. The results of another study by Al-Mulali et al. (2015) reveal that economic growth, urbanization, and energy consumption positively impact CO2 emissions. In contrast, trade openness has a negative impact on it [45]. Similarly, Hossain (2011) has also studied the relationship between economic growth and trade openness and carbon dioxide emissions, economic growth and energy consumption, trade openness and economic growth, urbanization, and economic growth, and trade openness and urbanization [46]. The long-run elasticity of carbon dioxide emissions to energy consumption (1.2189) is greater than the short-run elasticity of 0.5984. This suggests that when energy consumption increases in newly industrialized countries, carbon dioxide emissions increase, and our environment becomes more polluted [46]. Other than these studies, various studies have also been carried out to assess the impact of the variables mentioned above on CO2 emissions [38,47,48,49,50].
A few other essential studies are presented in Table 1 below.

3. Materials and Methodology

The focus of this study is to investigate the impact of economic growth, energy consumption, urbanization, and trade openness on CO2 emissions with particular reference to India. The description of the selected variables is given below in Table 2. To investigate this, ARDL and random forest models have been used. L. Breiman created the random forest algorithm in 2001, which has been tremendously successful as a general-purpose classification and regression approach. The method, which combines numerous randomized decision trees and averages their predictions, has demonstrated exceptional performance in scenarios where the number of variables is substantially more significant than the number of observations [62]. Furthermore, it is versatile enough to be applied to large-scale problems, adaptable to various ad hoc learning activities, and returns metrics of varying relevance. It applies to a wide range of prediction problems and requires a few parameters to be tuned. Apart from its ease of use, the approach is well-known for its accuracy and capacity to deal with tiny sample quantities and high-dimensional feature spaces. At the same time, it is easily parallelizable and capable of dealing with massive real-world systems.
The duration of the data used in this study is from 1980 to 2021. The sources used to collect data are World Development Indicators and Our World in Data (Oxford). The general form of the model is given below.
C O 2 = f ( Y , E C , T O , U B , U )
Here, CO2 is carbon emissions, Y is per capita income, EC is energy consumption, TO is trade openness, UB is urbanization, and U includes all the remaining variables which affect the carbon emissions. The augmented Dickey–Fuller, Kwiatkowski–Phillips–Schmidt–Shin (KPSS), and DF-GLS tests have been used to check the stationarity. To check the cointegration, the F-bounds test has been applied, and the results support the presence of cointegration. The Granger causality test was also applied to check the causality among the variables. In the end, various diagnostic tests have been used to check the model’s assumption about the residual, which are shown in Table 3, and summary statistics of the variables presented given in Table 4.
ARDL equation:
Δ log C O 2 t = Ψ 0 + Ψ 1 l o g C O 2 t 1 + Ψ 2 l o g T O t 1 + Ψ 3 l o g U B t 1 + Ψ 4 l o g Y t 1 + Ψ 5 l o g E C t 1 + Σ i = 1 p θ i Δ l o g C O 2 t i        + Σ i = 1 q β i Δ l o g T O t i + Σ i = 1 q γ i Δ l o g U B t i + Σ i = 1 q φ i Δ l o g Y t i + Σ i = 1 q ω i Δ l o g E C t i + ε t
ECM equation:
Δ log C O 2 t = α 1 + Σ i = 1 p θ i Δ l o g C O 2 t i + Σ i = 1 q β i Δ l o g T O t i + Σ i = 1 q γ i Δ l o g U B t i + Σ i = 1 q φ i Δ l o g Y t i + Σ i = 1 q ω i Δ l o g E C t i                + λ i E C T t 1 + ε t
Here, Ψ0 is the intercept, Ψ1, Ψ2, Ψ3, Ψ4, and Ψ5 are the long-term slope coefficients, and θi, βi, γi, φi, and ωi are the short-term slope coefficients. ECT is an error correction term that shows the speed of the adjustment toward equilibrium.

4. Results

The results of the model have been discussed in this section. It has been divided into two sections. In the first section, the trend of all the variables has been shown, and in the second part, the results of the model have been discussed.

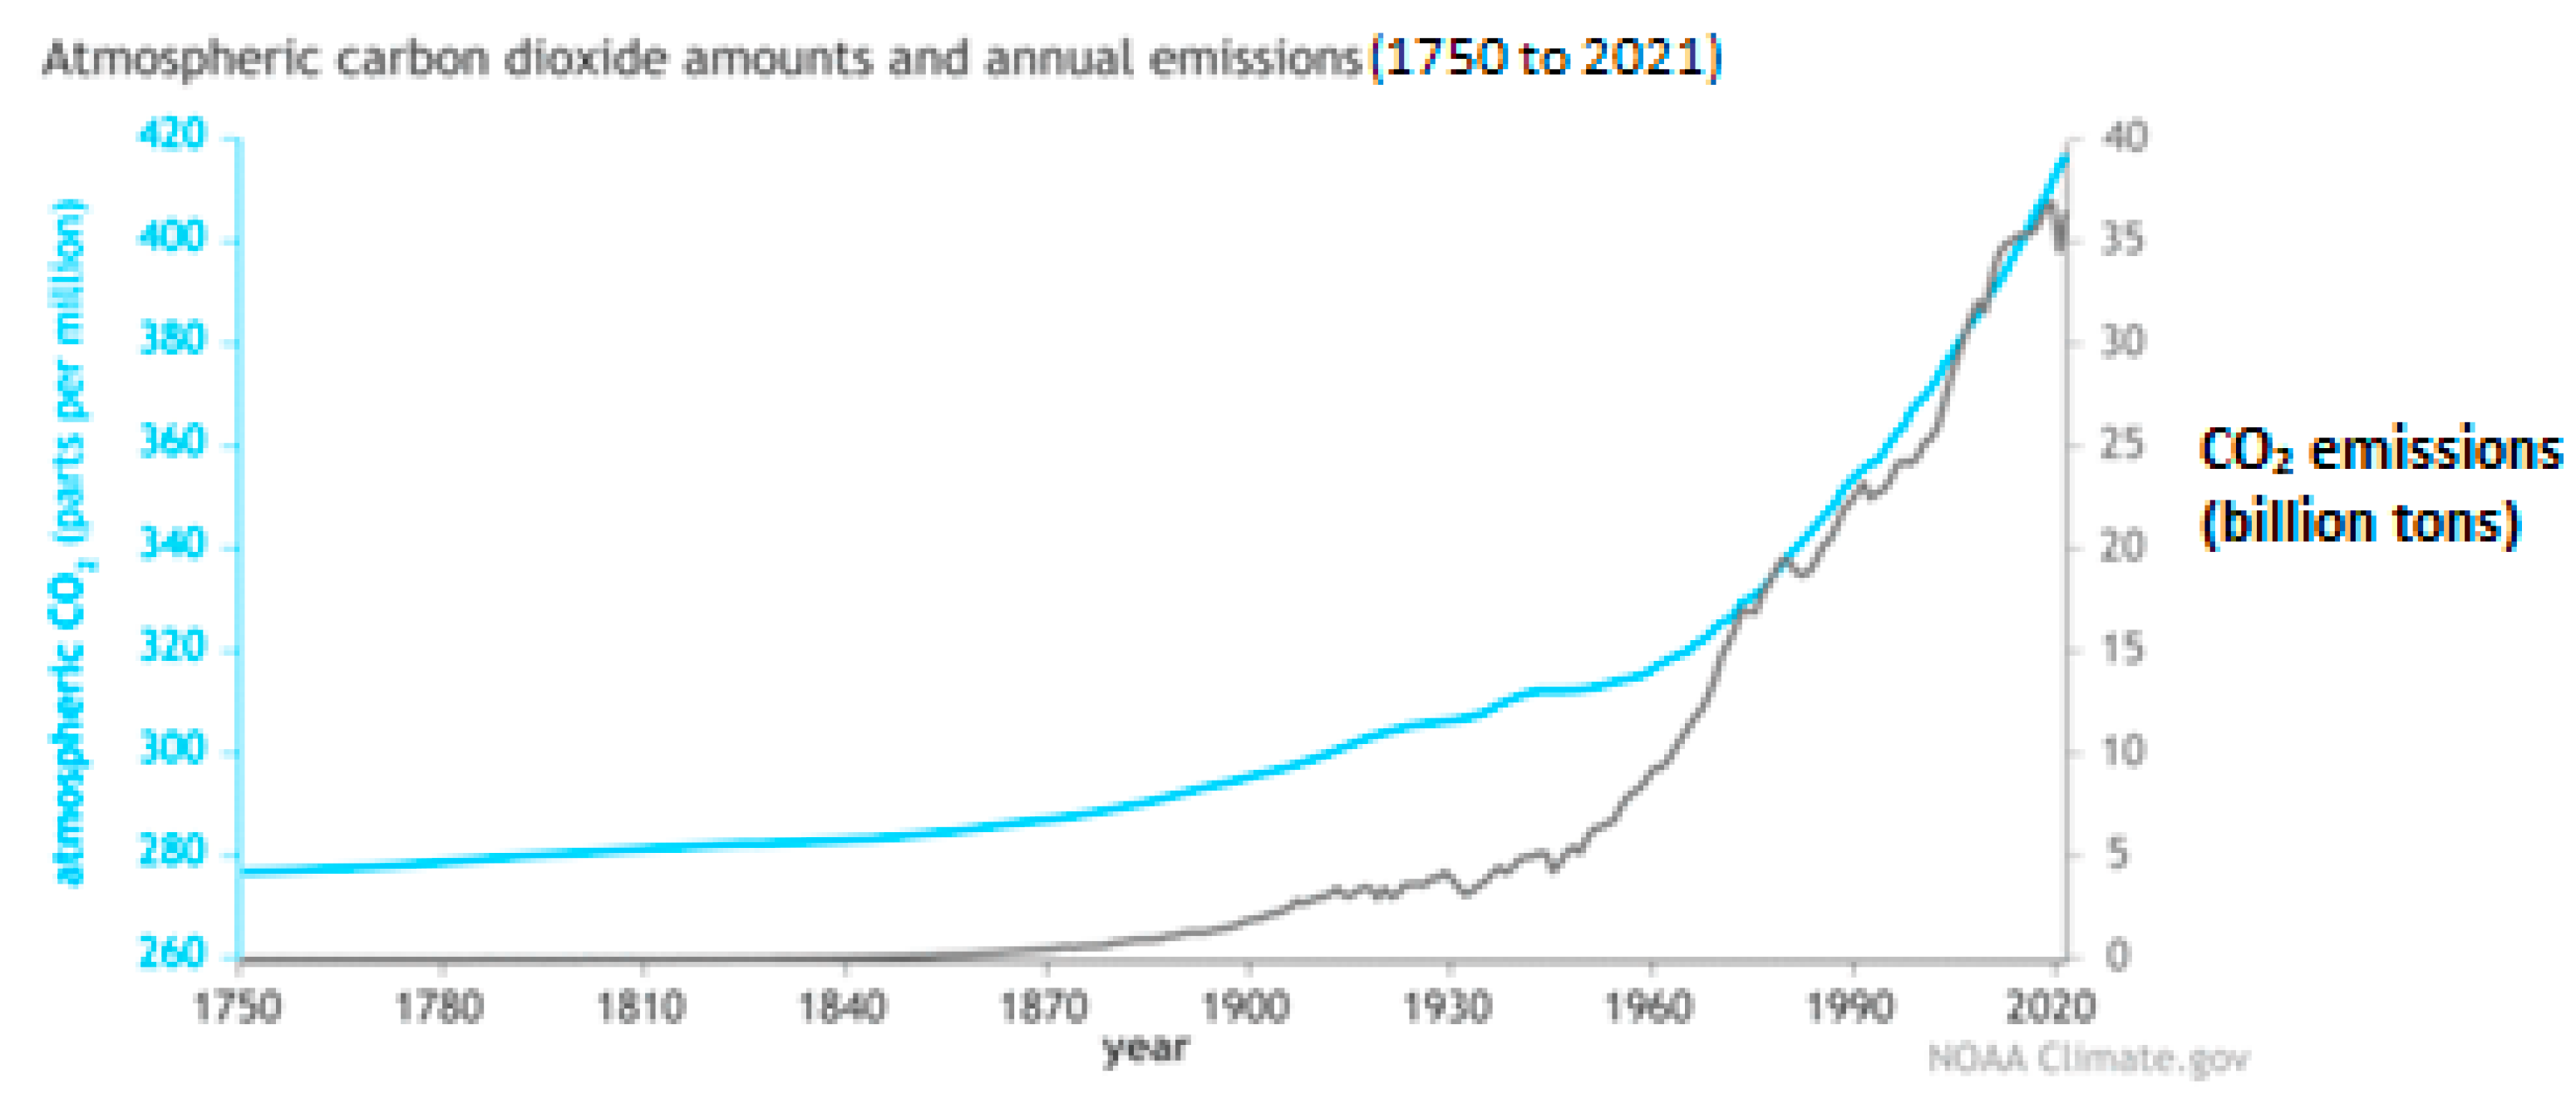
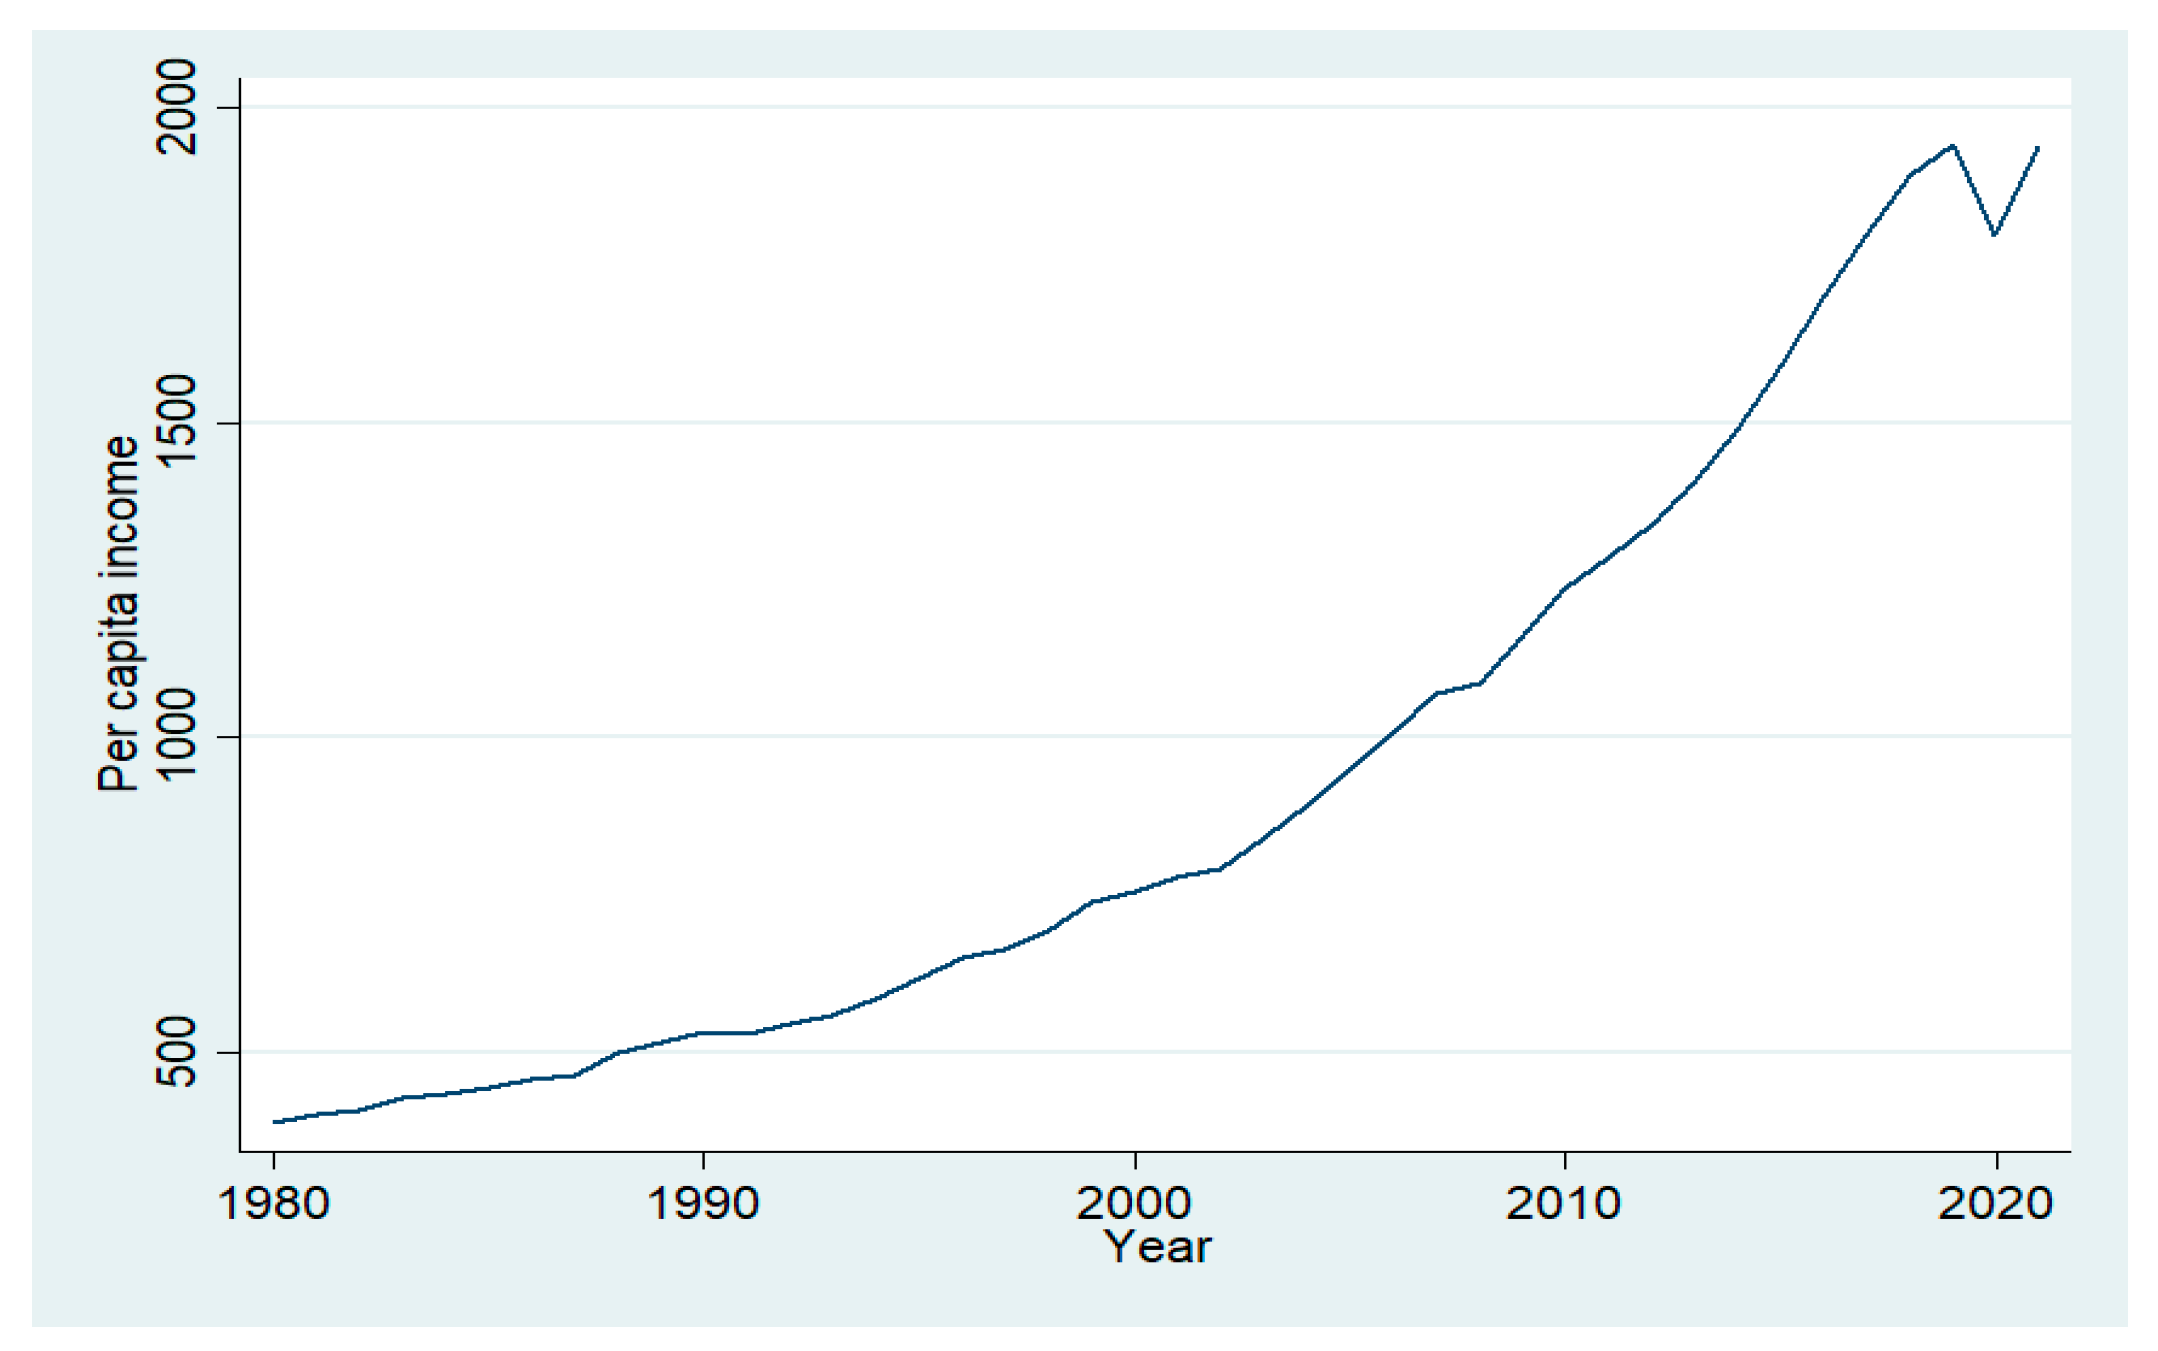
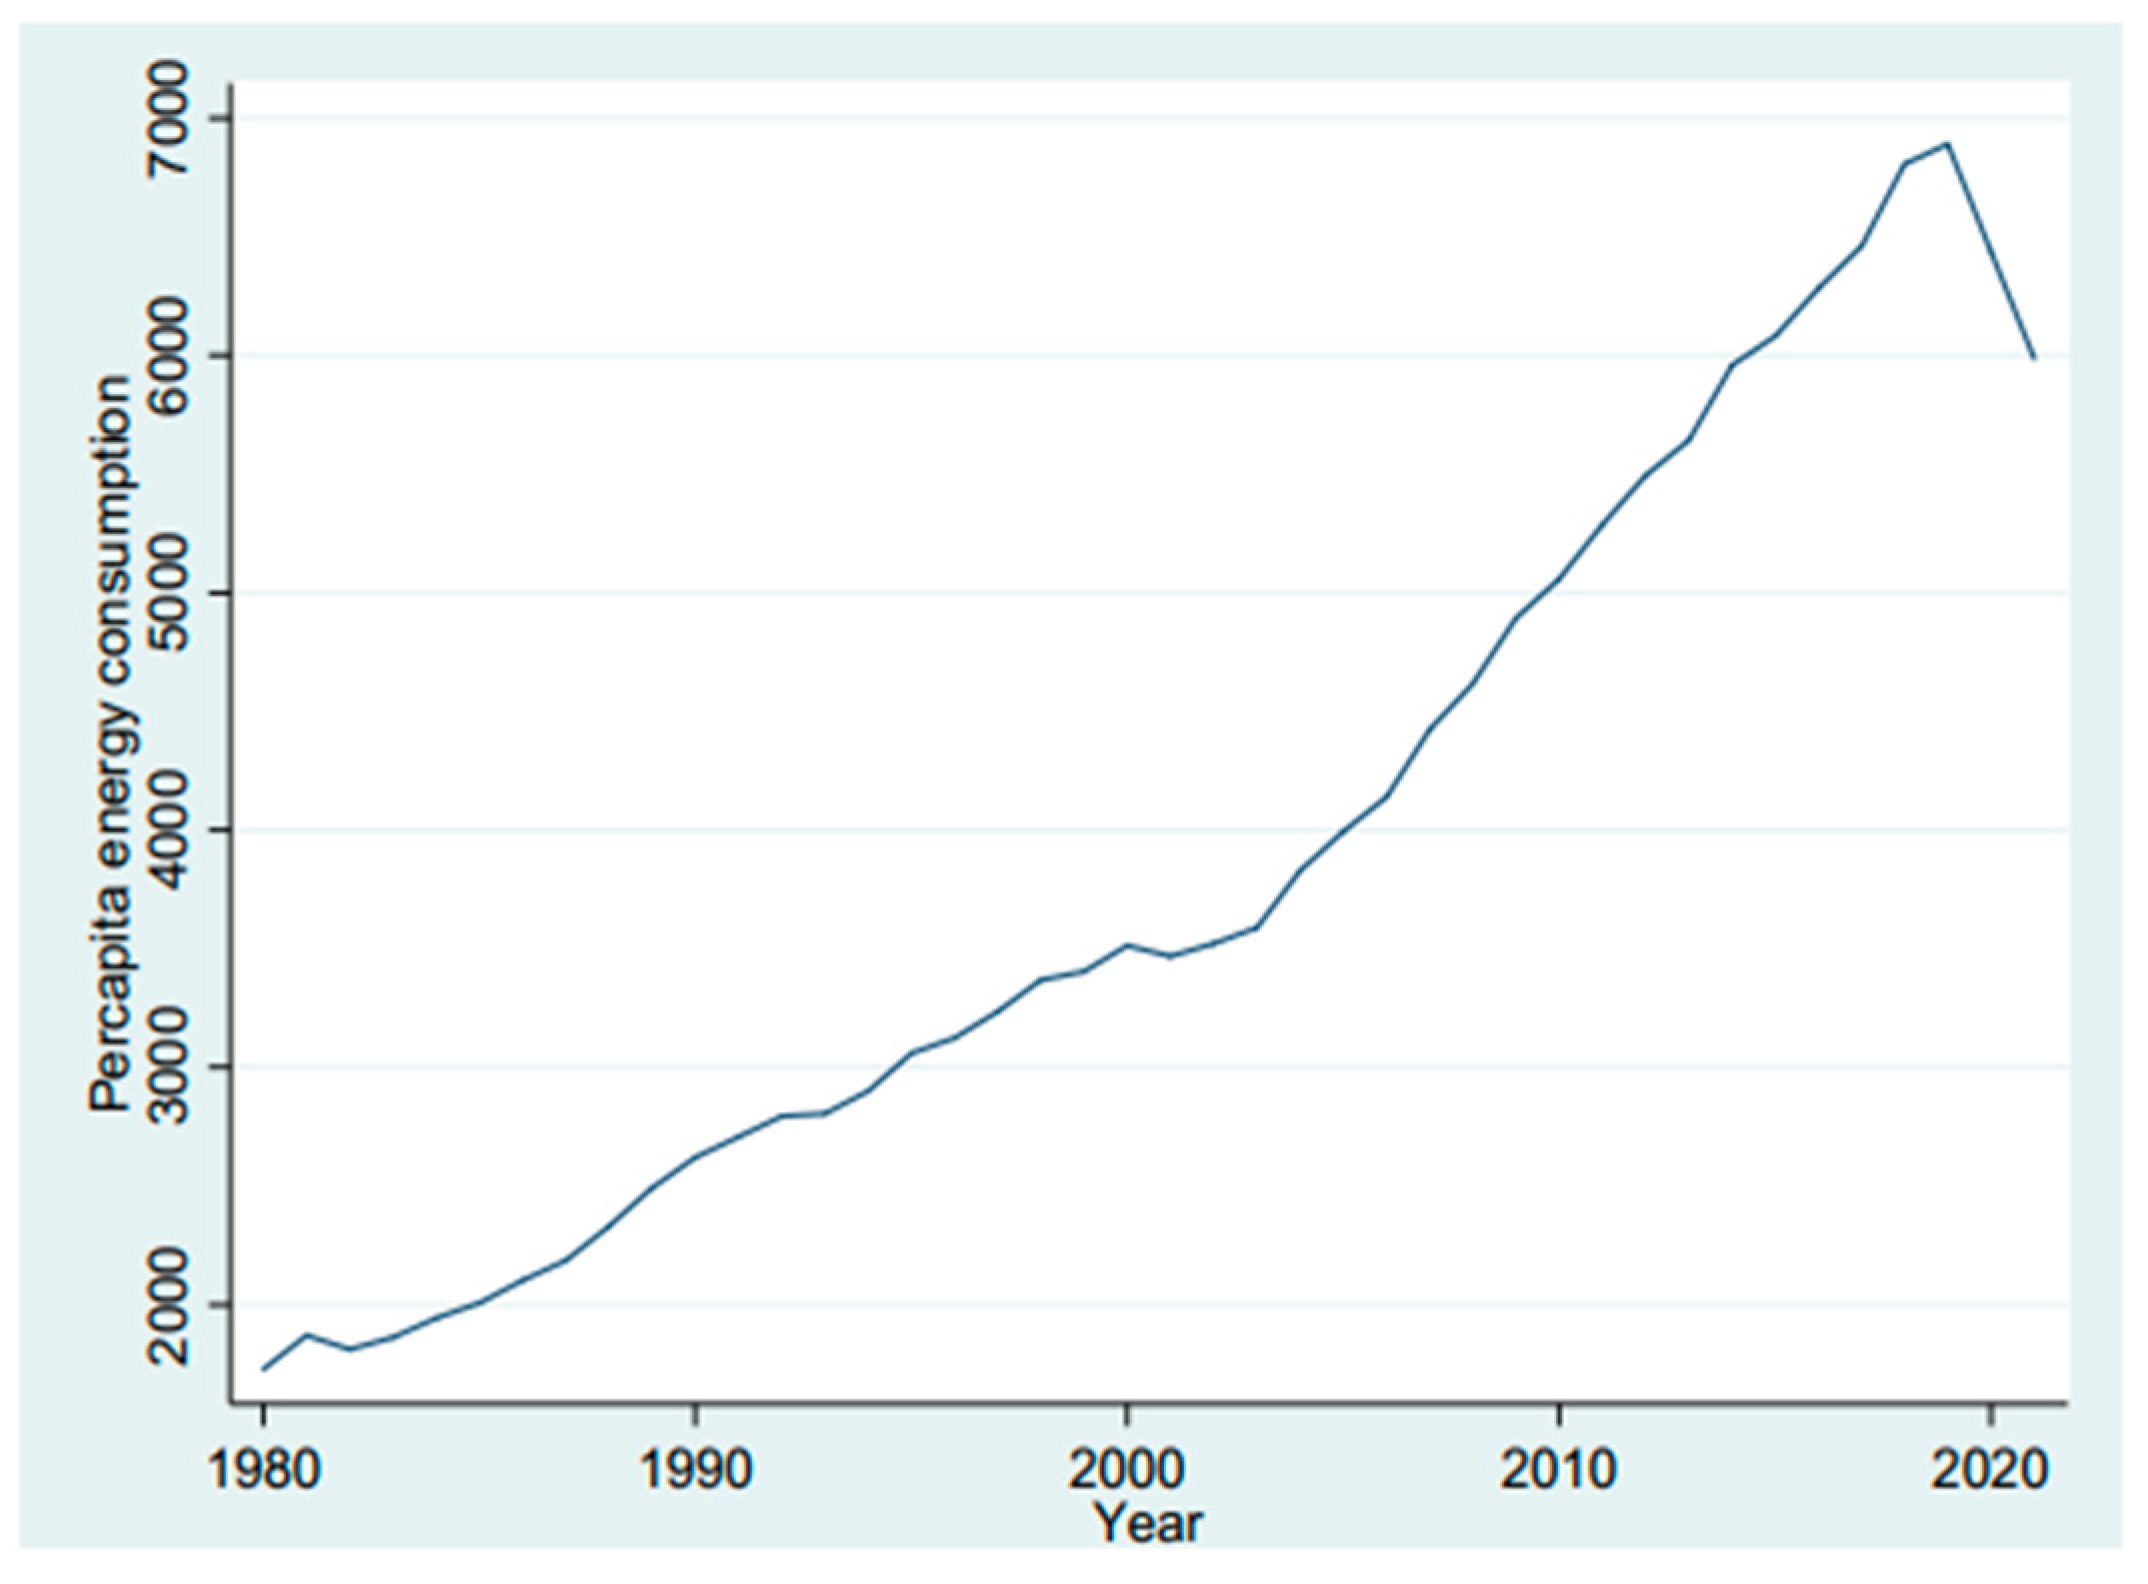
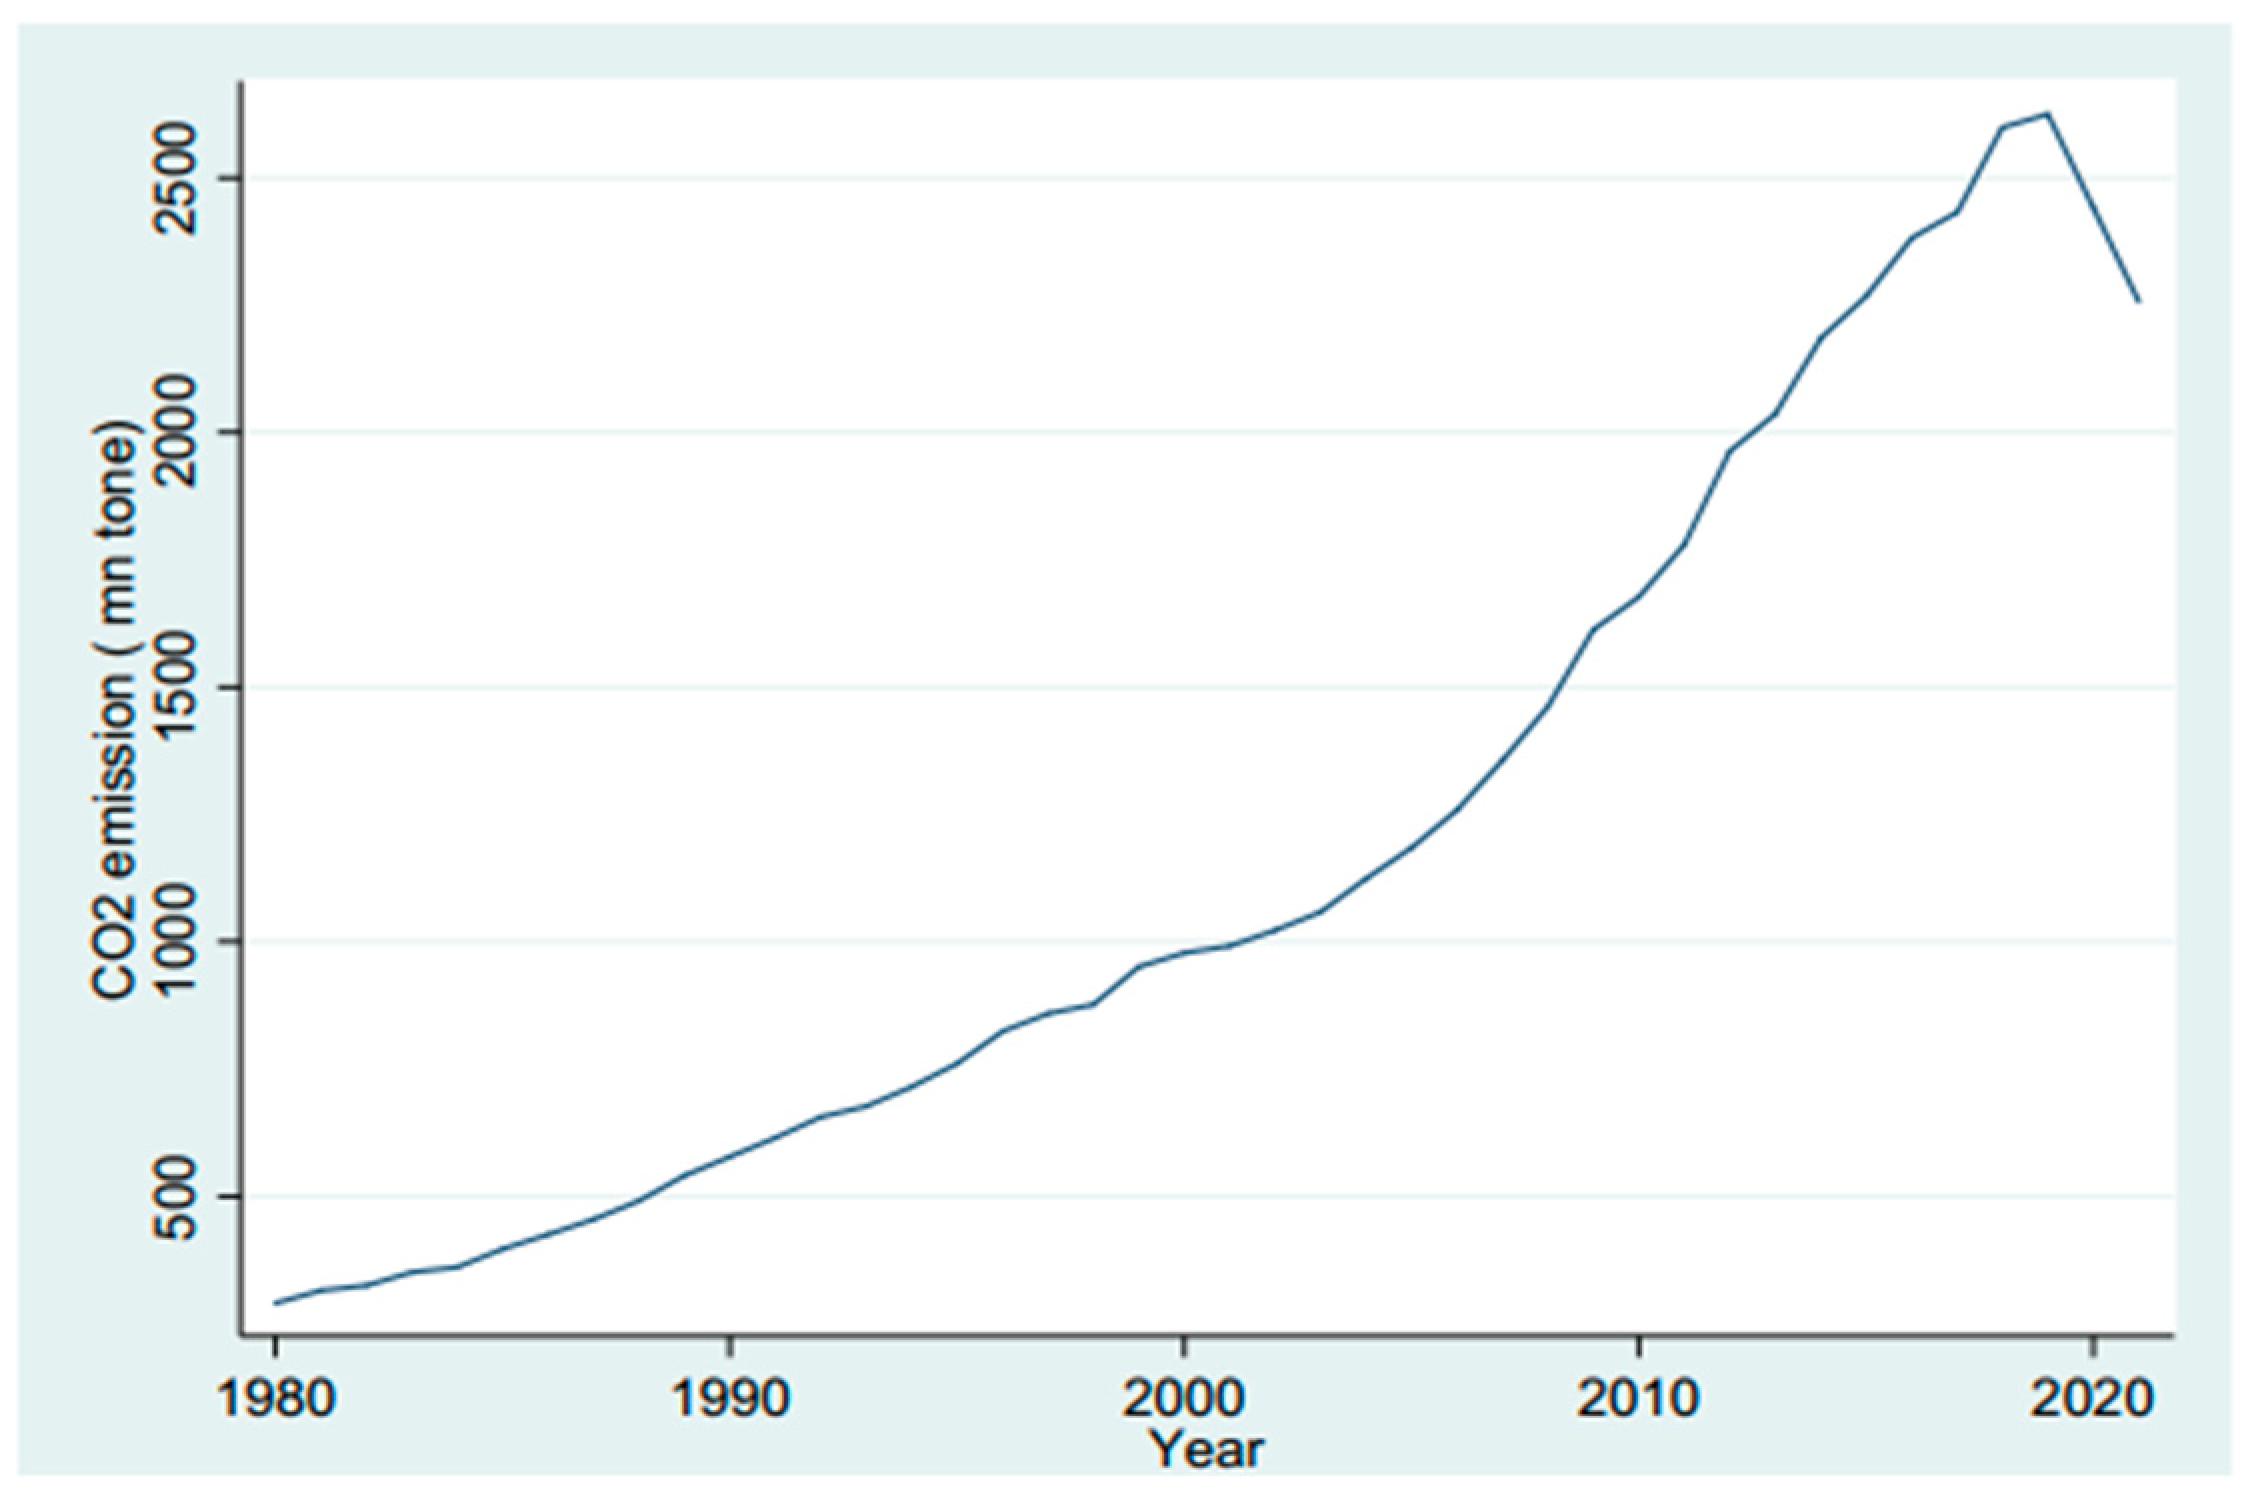
4.1. Trend of the Variables

India, the most populated country and fifth largest economy worldwide, has urbanized more than 35% of its population, less than the global average, i.e., 56% [63]. Nevertheless, the size of the population is so significant that, in absolute numbers, the size of the urban population is quite significant. Since 1991, after economic reforms, the Indian economy has shown a tremendous growth in per capita income, as depicted below in Figure 3; per capita, energy consumption, trade openness, urbanization growth rate, and CO2 emissions are shown below in Figure 4, Figure 5, Figure 6 and Figure 7, respectively.
CO2 emissions from developing and transition economies, particularly India, have been steadily increasing since 1980 [64]. Figure 7 shows that the increase in CO2 emissions is quite steady, showing a declining trend in 2020 due to COVID-19. Over the period, all the variables projected positive growth, which can be seen in Figure 3, Figure 4, Figure 5, Figure 6 and Figure 7. As per the data of world development indicators, since 1980, the per capita income of India has augmented 5 times, CO2 emissions 6.6 times, trade openness and total urban population 3 times, and energy consumption has grown by 2.46 times.
Global GHG emissions are expected to grow by about 52% by 2050 without any serious action, as per the simulations prepared by the Organization for Economic Cooperation and Development [65]. For 2005–2050, energy-related CO2 emissions are forecasted to grow by 78%. This would raise the global mean temperature by 1.7 °C–2.4 °C in 2050 compared to pre-industrial levels [65].

4.2. Empirical Results of the ARDL and Random Forest Model

In this section, the empirical results of the ARDL model have been discussed. To proceed with the ARDL model, stationarity has been checked with the help of the augmented Dickey–Fuller (A.D.F.) test, KPSS and DF-GLS test. Table 5 presents the results of the all tests, which show that all variables are stationary at either I (0) or I (1) and a mixture of both.
The results of the various unit root tests show that all variables are either stationary at level or at 1st difference; therefore, the ARDL model can be applied, as it can be applied if series are stationary at I (0), I (1), and a mixture of both. To check the cointegration, the F-bounds test has been used, the results of which are shown in Table 6.
Table 6 shows that the value of F statistics is greater than the upper bound [I (1)] at the 1% level, confirming a long-term relationship among the variables. The A.I.C. criteria have been used to select the optimal lag length and 4 is selected as the optimal lag. In Table 7, the coefficients of the long run and short run are given.
From Table 7, it can be observed that in the long run, energy consumption positively affect CO2 emissions, which is significant at the 1% level, and urbanization, and trade also positively affect CO2 emissions, which are significant at the 5% level. However, CO2 emissions at the previous lag and economic growth show a negative relationship that is significant at 1% level. In the short run, CO2 emissions at previous lag are negatively related to CO2 emissions, which is significant at the 1% level. Similarly, trade openness also show a negative relation with significant carbon emissions at 5% levels, whereas energy consumption and urbanization show a positive relationship as both are significant at 1%. In the short run, the relation between economic growth and CO2 emissions is insignificant.

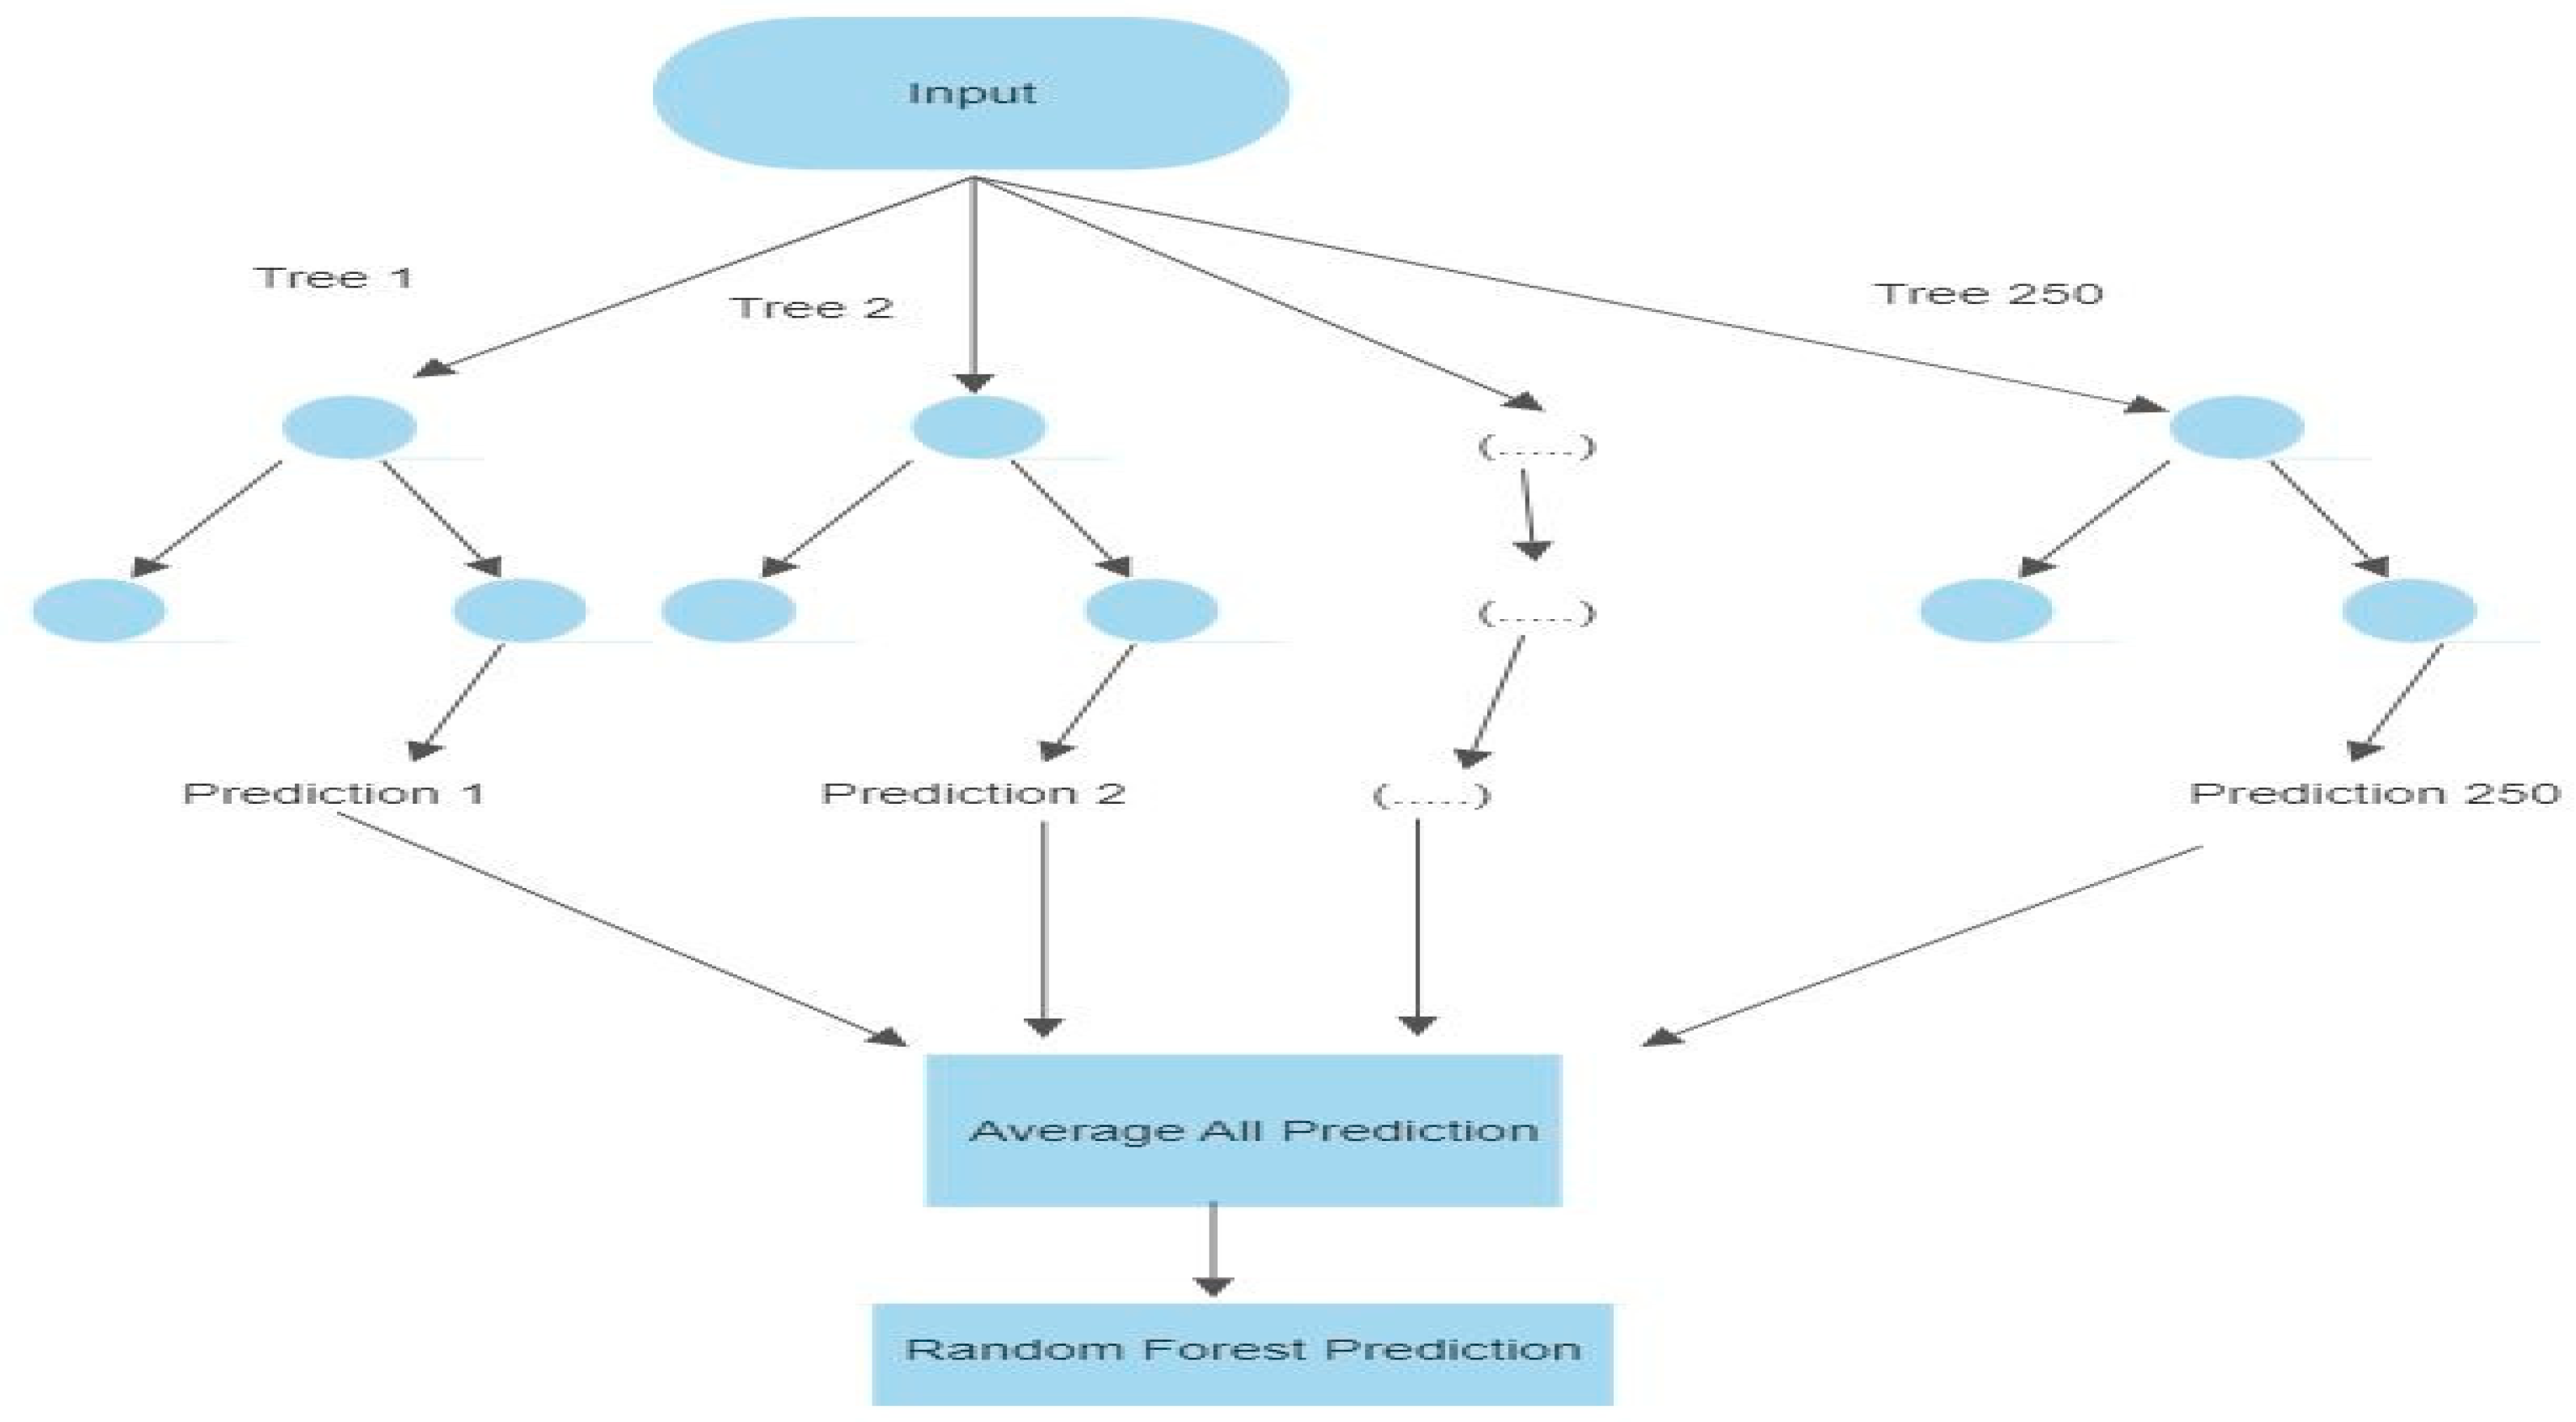
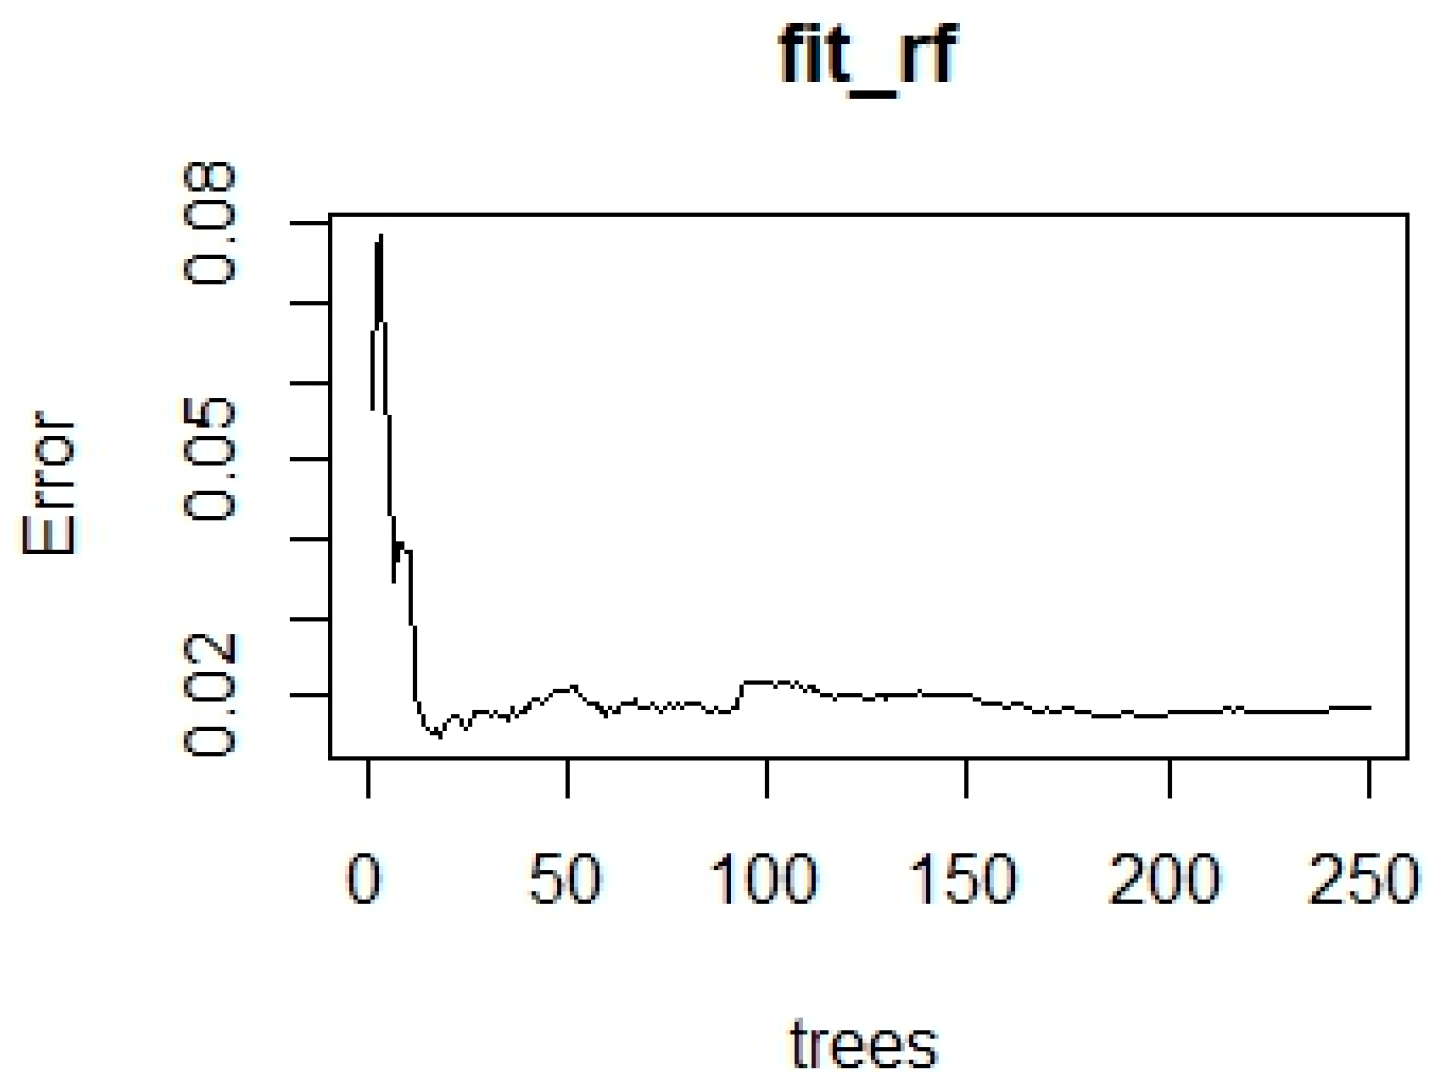
4.3. Random Forest Model

Random forest is a machine learning algorithm that has gained widespread popularity due to its ability to effectively handle complex classification and regression tasks. It is a type of ensemble learning method that constructs many decision trees and aggregates their predictions to produce a final output [66]. In this approach, each decision tree is trained on a random subset of the available data and a random subset of the available features, thereby reducing the risk of over fitting and improving the model’s generalization. Additionally, random forest provides feature importance rankings that can be used for feature selection and interpretation. Its robustness, accuracy, an interpretability make it a popular choice in various domains, including biology, finance, and engineering.
The original dataset has been partitioned in an 80:20 ratio to facilitate the application of machine learning algorithms. Table 8, depicting the performance of the model, indicates that the random forest (R.F.) model exhibited a high level of accuracy, with R2 values of 0.988 and 0.992 for the training and testing datasets, respectively. The statistical evaluation criteria revealed satisfactory performance for all models, as evidenced by R2 values approaching unity and lower root mean square error (RMSE) and mean absolute error (M.A.E.) values. However, the lower error values achieved by the model on the training dataset, relative to the testing dataset, suggest that this model is better suited for fitting than for prediction.
  • Architecture of the Random Forest model
Figure 8 shows the architecture of random forest. There are 250 trees that have been considered. The average prediction has been derived by taking average of prediction values from each tree. This will lead to further random forest prediction. Additionally from Figure 9, it can also be observed that error term is moving towards zero over the period. The relative importance of all the selected variables can be understood with the help of Figure 10, which is given below. It depicts that in CO2 emissions, energy consumption is most important variable, whereas trade openness is the least important.
  • Pairwise Granger causality test
The pairwise Granger causality test has also been applied to verify the pairwise causality between the variables and 2 has been selected as optimal lag. The analysis has been carried out after taking the first difference of the variables. The results of the test are shown in Table 9.
From Table 9 above, the results of the pairwise Granger causality can be seen. Unidirectional causation exists between energy consumption and CO2 emissions, trade openness and CO2 emissions, and urbanization to energy consumption at 5% level of significance. Additionally, there is also a unidirectional causality between per capita income and energy consumption, which is statistically significant at the 10% level. These results show that urbanization and economic growth both lead to energy consumption, which causes a rise in carbon emissions; at the same time, trade openness also causes CO2 emissions. This indicates that the government should focus on sustainable urban planning and also needs to decouple economic growth form CO2 emissions. Trade is also an important contributor of CO2 emissions; therefore, governments should develop and enforce environmental regulations that account for the carbon footprint associated with trade activities. This can include imposing stricter emission standards on imported goods, promoting sustainable supply chains, and encouraging the adoption of eco-friendly production processes by businesses engaged in international trade.

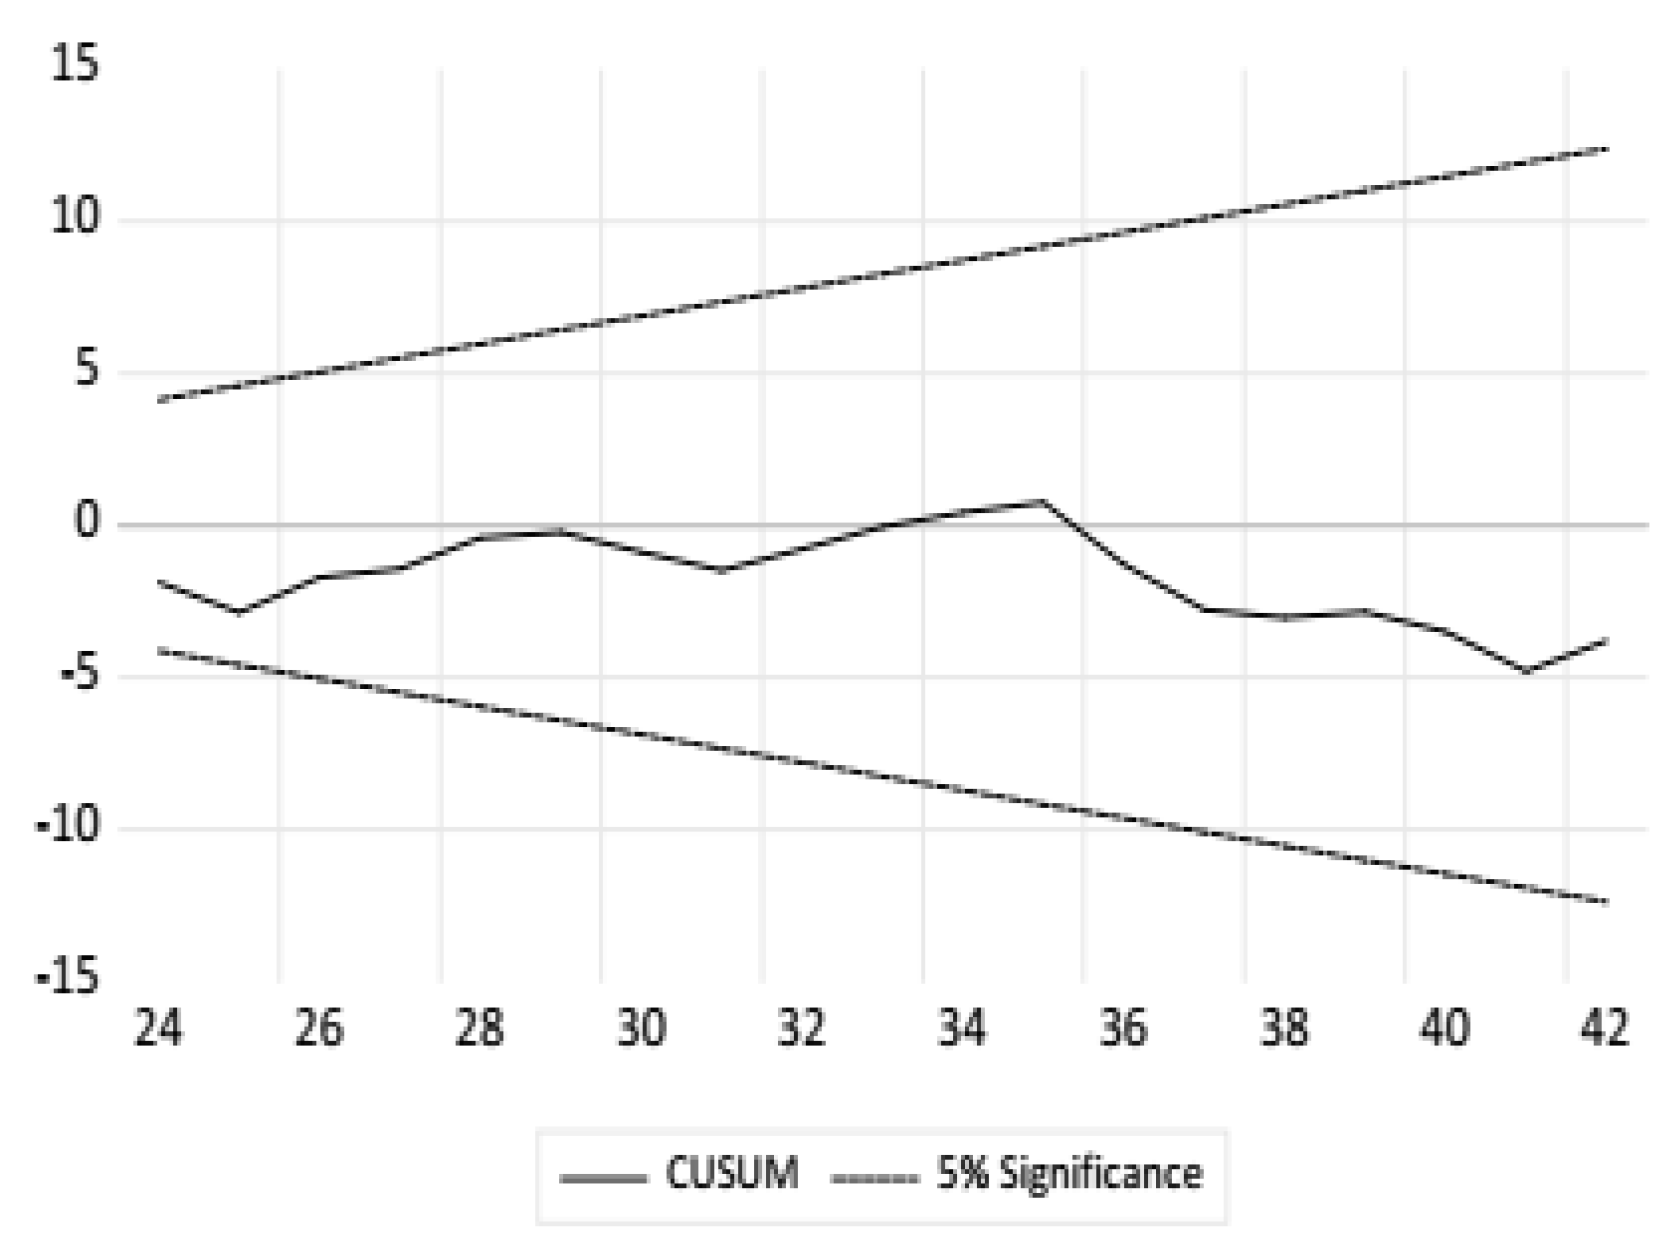
4.4. Diagnostic Tests

In the end, various diagnostic tests were applied to verify the model’s assumption about the residual. The results of these tests are given in below Table 7.
It can be seen from Table 10 above that the p-value in both tests is higher than 0.05, which means there is no serial autocorrelation, and the data are homoscedastic.
CUSUM and CUSUM of Square have been applied to check the stability, shown in Figure 11 and Figure 12.
It can be seen that the cumulative sums of the standardized deviations fall within the lower and upper limit, which show that the series is stable.

5. Discussion

In a developing nation such as India, climate change poses a formidable challenge as the country’s economic prosperity is founded on traditional methods of resource and energy generation [64]. This study’s recommendations for policy have significant implications for India’s efforts toward reducing CO2 emissions. To achieve this, India has implemented several strategies, including the United Nations’ Sustainable Development Goals (S.D.G.s), which provide a framework for balancing economic, social, and environmental concerns in pursuit of a more sustainable future. This research holds particular significance for S.D.G. 7 (affordable and clean energy), S.D.G. 11 (sustainable cities and communities), and S.D.G. 13 (climate action) as it sheds light on the determinants of CO2 emissions and the complex interplay between economic growth, energy consumption, trade openness, urbanization, and CO2 emissions. It provides a comprehensive examination of the impact of economic growth, energy consumption, trade openness, and urbanization on carbon dioxide emissions in India. Given that India ranks as the third-largest global emitter of CO2 [63], the study’s findings are of considerable academic interest, especially in light of India’s ambitious targets to mitigate climate change by reducing CO2 emissions.
Despite the significant technological advancements, India finds itself in opposing positions when it comes to addressing climate change through the mitigation of CO2emissions and adaptation to its impacts, which are pressing concerns for preserving the planet, protecting life, and achieving sustainable development goals. This study recommends that policymakers focus on supporting sustainable development techniques that decrease CO2 emissions while promoting economic growth, and enhancing the standard of living for all inhabitants. To mitigate climate change, India needs to reduce GHG emissions, and this can be accomplished by reducing CO2 emissions in the energy sector through the development and diffusion of energy efficiency technologies (EETs) and promoting renewable energy technologies (RETs). The first approach involves increasing energy efficiency through improved technologies, which reduces energy inputs for a given level of service or enhances service for a given input level. The second approach involves investing in low-CO2 climate-friendly alternative energy technologies.
Based on the results of the empirical investigation, economic growth exhibits a negative impact on CO2 emissions, while energy consumption, urbanization and trade openness have significant positive effects, as indicated by the long-run coefficients. This suggests that CO2 emissions decrease as the economy grows in the long run. The long-run positive coefficient of energy use confirms that rising energy consumption is linked to increased pollution, indicating that energy use is a primary driver of CO2 emissions in India. The positive long-run coefficient of trade openness supports the assertion that trade stimulates economic growth, increasing CO2 emissions. This is in line with previous research linking globalization and trade to CO2 emissions. However, trade can also play a role in reducing CO2 emissions by promoting energy-efficient technologies and adopting cleaner production processes. Trade can facilitate the diffusion of innovative technologies and practices that help to reduce CO2 emissions. Additionally, trade policies can be designed to incentivize businesses to adopt sustainable practices, such as emissions trading systems or the imposition of tariffs on goods with high carbon footprints.
Promoting renewable energy sources and energy-saving measures can also lead to long-term reductions in non-renewable energy consumption and CO2 emissions. Sustainable urbanization policies, such as the promotion of green cities and transportation infrastructure, can reduce the harmful environmental effects of urbanization. According to the EKC hypothesis, which is supported by these results, economic development causes an increase in environmental degradation at first but then lowers it as nations progress and adopt cleaner technology. This study’s findings suggest that policymakers must focus on implementing sustainable policies to reduce CO2emissions in India, such as promoting renewable energy, sustainable urbanization, and green technology investments.
Based on these findings, some policy recommendations can be proposed to reduce CO2 emissions in India. Firstly, there is a need to increase the use of renewable energy sources and promote energy conservation practices to reduce energy consumption. Secondly, the government should encourage green technology investments, especially in manufacturing, to reduce CO2 emissions [67]. Thirdly, the government should promote sustainable urbanization by implementing policies that support the development of green cities and transportation systems. In addition, it is imperative to enhance regulatory measures about commerce to guarantee that enterprises function in an ecologically sustainable fashion. Fourthly, it is recommended that the government implements measures to encourage the utilization of public transportation to mitigate the proliferation of private vehicles on roadways, consequently leading to a reduction in CO2 emissions. Ultimately, it is recommended that policies be established to encourage adopting sustainable production and consumption practices. Public authorities can offer fiscal incentives and financial support to enterprises that implement sustainable measures, such as embracing renewable energy sources, utilizing environmentally-friendly materials, and minimizing their waste output. Using educational and awareness-raising initiatives, as well as financial incentives, it is possible to motivate consumers to embrace sustainable practices, including but not limited to recycling, minimizing energy usage, and utilizing public transportation. Apart from providing incentives for sustainable practices, policies ought to tackle the fundamental drivers of CO2 emissions, such as the excessive consumption of fossil fuels. One possible approach to achieving this objective is implementing policy measures such as CO2 taxes, which increase the cost of carbon-intensive goods and activities, and cap-and-trade programs, which restrict CO2 emissions and permit companies to trade emissions. It is important to note that the transition toward a sustainable economy will take time. It will require significant investment, innovation, and collaboration between governments, businesses, and individuals. However, the long-term benefits, both for the environment and for the economy, will be substantial. Reducing CO2 emissions and promoting sustainable practices can create a healthier and more resilient planet while unlocking new economic opportunities and creating a more equitable and prosperous society.

6. Conclusions

This research seeks to experimentally investigate the short-run and long-run causal relationship between carbon dioxide emissions, energy consumption, economic growth, trade openness, and urbanization in India by using time series data from 1980 to 2021.The ARDL model has been applied along with the random forest model developed by L. Breiman, an ensemble of multiple decision trees, each of which makes a prediction independently and then combines the predictions to form an overall prediction. The results of the ARDL model demonstrate that in the long run, energy, urbanization, and trade openness have a positive impact on carbon emissions, whereas CO2 emissions at previous lag and economic growth have a negative impact. In the short run, carbon emissions at previous lag, economic growth, and trade openness have a negative relationship with carbon emissions, while energy consumption and urbanization have a positive relationship.
Investing in renewable energy can assist India to shift the load away from fossil fuels, reduce air pollution, and provide more job possibilities. Creating new mass transit systems and expanding existing ones can cut automobile emissions while creating new jobs. In the future, it will also boost economic growth through agglomeration economies. Wetland and forest conservation and enhancement will boost agricultural production, reduce CO2 emissions, and increase resilience to environmental shocks.

Author Contributions

Conceptualization, R.K.J. and B.N.-K.; methodology, R.K.J. and V.K.C.; software, A.G. and H.S.K.; validation, A.G., C.N.N. and R.K.J.; formal analysis, A.G. and H.S.K.; investigation, A.G. and H.S.K.; resources, R.K.J. and V.K.C.; data curation, A.G., and H.S.K.; writing—original draft preparation, A.G., H.S.K. and R.K.J.; writing review and editing, V.K.C. and B.N.-K.; supervision, R.K.J. and B.N.-K.; project administration, R.K.J. All authors have read and agreed to the published version of the manuscript.

Funding

The first author A.G, acknowledges the financial support under the scheme “UGC JRF” vide application no. 190520417508. The second author H.S.K acknowledges the financial support provided under the scheme “Fund for Improvement of S&T Infrastructure (FIST)” of the Department of Science & Technology (DST), Government of India as evidenced by letter number: SR/FST/MS-I/2021/104 to the Department of Mathematics & Statistics, Central University of Punjab and Research Seed Money (R.S.M.) grant, Central University of Punjab vide no: CUPB/Acad./20-21/1037.

Data Availability Statement

Data are collected from open sources, and the names of the sources are given. Therefore, anyone can collect the data from the given sources.

Acknowledgments

The authors acknowledge the support provided by the Department of Mathematics& Statistics, Central University of Punjab.

Conflicts of Interest

The authors declare no conflict of interest.

References

  1. Our World in Data. Available online: https://ourworldindata.org (accessed on 11 December 2022).
  2. Kivyiro, P.T. Foreign Direct Investment, Clean Development Mechanism, and Environmental Management: A case of Sub-Saharan Africa; Lappeenranta University of Technology: Lappeenranta, Finland, 2015. [Google Scholar]
  3. Ahmad, M.; Zhao, Z.Y. Empirics on linkages among industrialization, urbanization, energy consumption, CO2 emissions, and economic growth: A heterogeneous panel study of China. Environ. Sci. Pollut. Res. 2018, 25, 30617–30632. [Google Scholar] [CrossRef]
  4. Dia, K.B.; Baudelaire, D.W. Climate Variability, and Urbanization in Sub-Saharan Africa: Mitigating the Effects on Economic Growth. African Economic Research Consortium. 2021. Available online: http://3.65.68.50/bitstream/handle/123456789/2819/Working%20Paper%20Series%20CC-010.pdf?sequence=1&isAllowed=y (accessed on 25 March 2023).
  5. Wang, A.; Lin, B. Assessing CO2 emissions in China’s commercial sector: Determinants and reduction strategies. J. Clean. Prod. 2017, 164, 1542–1552. [Google Scholar] [CrossRef]
  6. World Economic Forum. Available online: https://www.weforum.org/agenda/2022/08/world-population-countries-india-china-2030/ (accessed on 7 January 2023).
  7. Times of India. Available online: https://timesofindia.indiatimes.com/blogs/The-underage-optimist/let-this-be-indias-goal-for-this-decade-5000-per-capita-income-by-2030/ (accessed on 8 January 2023).
  8. Lin, B.; Omoju, O.E. Does private investment in the transport sector mitigate the environmental impact of urbanization? Evidence from Asia. J. Clean. Prod. 2017, 153, 331–341. [Google Scholar] [CrossRef]
  9. India Energy Information Enerdata. Available online: https://www.enerdata.net/estore/energymarket/india/ (accessed on 18 December 2022).
  10. Ministry of Power, Government of India. Available online: https://powermin.gov.in/en/content/power-sector-glance-all-india (accessed on 31 January 2023).
  11. United Nations Development Programme. Sustainable Development Goals. Available online: https://www.undp.org/sustainable-developmentgoals#:~:text=The%20Sustainable%20Development%20Goals%20(SDGs)%2C%20also%20known%20as%20the,people%20enjoy%20peace%20and%20prosperity (accessed on 25 March 2023).
  12. Wang, Q.; Zhang, F. The effects of trade openness on decoupling carbon emissions from economic growth–evidence from 182 countries. J. Clean. Prod. 2021, 279, 123838. [Google Scholar] [CrossRef]
  13. Bildirici, M.; Ersin, Ö. Markov-switching vector autoregressive neural networks and sensitivity analysis of environment, economic growth and petrol prices. Environ. Sci. Pollut. Res. 2018, 25, 31630–31655. [Google Scholar] [CrossRef] [PubMed]
  14. Grossman, G.M.; Krueger, A.B. Environmental Impacts of a North American Free Trade Agreement. 1991. Available online: https://www.nber.org/system/files/working_papers/w3914/w3914.pdf (accessed on 27 March 2023).
  15. Cole, M.A.; Rayner, A.J.; Bates, J.M. The environmental Kuznets curve: An empirical analysis. Environ. Dev. Econ. 1997, 2, 401–416. [Google Scholar] [CrossRef]
  16. Andreoni, J.; Levinson, A. The simple analytics of the environmental Kuznets curve. J. Public Econ. 2001, 80, 269–286. [Google Scholar] [CrossRef] [Green Version]
  17. Dasgupta, S.; Laplante, B.; Wang, H.; Wheeler, D. Confronting the environmental Kuznets curve. J. Econ. Perspect. 2002, 16, 147–168. [Google Scholar] [CrossRef] [Green Version]
  18. Yandle, B.; Vijayaraghavan, M.; Bhattarai, M. The environmental Kuznets curve. A Primer PERC Res. Study 2002, 2, 1–38. [Google Scholar]
  19. Dinda, S. Environmental Kuznets curve hypothesis: A survey. Ecol. Econ. 2004, 49, 431–455. [Google Scholar] [CrossRef] [Green Version]
  20. Stern, D.I. The rise and fall of the environmental Kuznets curve. World Dev. 2004, 32, 1419–1439. [Google Scholar] [CrossRef]
  21. Shahbaz, M.; Ozturk, I.; Afza, T.; Ali, A. Revisiting the environmental Kuznets curve in a global economy. Renew. Sustain. Energy Rev. 2013, 25, 494–502. [Google Scholar] [CrossRef] [Green Version]
  22. Stern, D.I. The environmental Kuznets curve after 25 years. J. Bioeconomics 2017, 19, 7–28. [Google Scholar] [CrossRef] [Green Version]
  23. Sarkodie, S.A.; Ozturk, I. Investigating the environmental Kuznets curve hypothesis in Kenya: A multivariate analysis. Renew. Sustain. Energy Rev. 2020, 117, 109481. [Google Scholar] [CrossRef]
  24. Ansari, M.A. Re-visiting the Environmental Kuznets curve for ASEAN: A comparison between ecological footprint and carbon dioxide emissions. Renew. Sustain. Energy Rev. 2022, 168, 112867. [Google Scholar] [CrossRef]
  25. Wang, Q.; Wang, X.; Li, R. Does urbanization redefine the environmental Kuznets curve? An empirical analysis of 134 Countries. Sustain. Cities Soc. 2022, 76, 103382. [Google Scholar] [CrossRef]
  26. Guan, X.; Zhou, M.; Zhang, M. Using the ARDL-ECM approach to explore the nexus among urbanization, energy consumption, and economic growth in Jiangsu Province, China. Emerg. Mark. Financ. Trade 2015, 51, 391–399. [Google Scholar] [CrossRef]
  27. Chen, M.; Zhang, H.; Liu, W.; Zhang, W. The global pattern of urbanization and economic growth: Evidence from the last three decades. PLoS ONE 2014, 9, e103799. [Google Scholar] [CrossRef] [Green Version]
  28. Frick, S.A.; Rodríguez-Pose, A. Change in urban concentration and economic growth. World Dev. 2018, 105, 156–170. [Google Scholar] [CrossRef]
  29. Cherniwchan, J. Economic growth, industrialization, and the environment. Resour. Energy Econ. 2012, 34, 442–467. [Google Scholar] [CrossRef]
  30. Uttara, S.; Bhuvandas, N.; Aggarwal, V. Impacts of urbanization on environment. Int. J. Res. Eng. Appl. Sci. 2012, 2, 1637–1645. [Google Scholar]
  31. Li, K.; Lin, B. Impacts of urbanization and industrialization on energy consumption/CO2emissions: Does the level of development matter? Renew. Sustain. Energy Rev. 2015, 52, 1107–1122. [Google Scholar] [CrossRef]
  32. Liu, X.; Bae, J. Urbanization and industrialization impact of CO2 emissions in China. J. Clean. Prod. 2018, 172, 178–186. [Google Scholar] [CrossRef]
  33. Li, M.; Li, L.; Strielkowski, W. The impact of urbanization and industrialization on energy security: A case study of China. Energies 2019, 12, 2194. [Google Scholar] [CrossRef] [Green Version]
  34. Mahmood, H.; Alkhateeb, T.T.Y.; Furqan, M. Industrialization, urbanization and CO2 emissions in Saudi Arabia: Asymmetry analysis. Energy Rep. 2020, 6, 1553–1560. [Google Scholar] [CrossRef]
  35. Voumik, L.C.; Sultana, T. Impact of urbanization, industrialization, electrification and renewable energy on the environment in BRICS: Fresh evidence from novel CS-ARDL model. Heliyon 2022, 8, e11457. [Google Scholar] [CrossRef] [PubMed]
  36. Acaravci, A.; Ozturk, I. On the relationship between energy consumption, CO2 emissions and economic growth in Europe. Energy 2010, 35, 5412–5420. [Google Scholar] [CrossRef]
  37. Zhang, X.P.; Cheng, X.M. Energy consumption, carbon emissions, and economic growth in China. Ecol. Econ. 2009, 68, 2706–2712. [Google Scholar] [CrossRef]
  38. Ali, H.S.; Law, S.H.; Zannah, T.I. Dynamic impact of urbanization, economic growth, energy consumption, and trade openness on CO2 emissions in Nigeria. Environ. Sci. Pollut. Res. 2016, 23, 12435–12443. [Google Scholar] [CrossRef]
  39. Ardakani, M.K.; Seyedaliakbar, S.M. Impact of energy consumption and economic growth on CO2 emissions using multivariate regression. Energy Strategy Rev. 2019, 26, 100428. [Google Scholar] [CrossRef]
  40. Sharif, A.; Raza, S.A.; Ozturk, I.; Afshan, S. The dynamic relationship of renewable and non-renewable energy consumption with carbon emissions: A global study with the application of heterogeneous panel estimations. Renew. Energy 2019, 133, 685–691. [Google Scholar] [CrossRef]
  41. Waheed, R.; Sarwar, S.; Wei, C. The survey of economic growth, energy consumption, and carbon emissions. Energy Rep. 2019, 5, 1103–1115. [Google Scholar] [CrossRef]
  42. Osobajo, O.A.; Otitoju, A.; Otitoju, M.A.; Oke, A. The impact of energy consumption and economic growth on carbon dioxide emissions. Sustainability 2020, 12, 7965. [Google Scholar] [CrossRef]
  43. Ali, U.; Guo, Q.; Kartal, M.T.; Nurgazina, Z.; Khan, Z.A.; Sharif, A. The impact of renewable and non-renewable energy consumption on carbon emissions intensity in China: Fresh evidence from novel dynamic ARDL simulations. J. Environ. Manag. 2022, 320, 115782. [Google Scholar] [CrossRef] [PubMed]
  44. Ghosh, S.; Kanjilal, K. Long-term equilibrium relationship between urbanization, energy consumption, and economic activity: Empirical evidence from India. Energy 2014, 66, 324–331. [Google Scholar] [CrossRef]
  45. Al-Mulali, U.; Ozturk, I.; Lean, H.H. The influence of economic growth, urbanization, trade openness, financial development, and renewable energy on pollution in Europe. Nat. Hazards 2015, 79, 621–644. [Google Scholar] [CrossRef]
  46. Hossain, M.S. Panel estimation for CO2 emissions, energy consumption, economic growth, trade openness and urbanization of newly industrialized countries. Energy Policy 2011, 39, 6991–6999. [Google Scholar] [CrossRef]
  47. Anwar, A.; Younis, M.; Ullah, I. Impact of urbanization and economic growth on CO2 emissions: A case of far east Asian countries. Int. J. Environ. Res. Public Health 2020, 17, 2531. [Google Scholar] [CrossRef] [Green Version]
  48. Nurgazina, Z.; Ullah, A.; Ali, U.; Koondhar, M.A.; Lu, Q. The impact of economic growth, energy consumption, trade openness, and financial development on carbon emissions: Empirical evidence from Malaysia. Environ. Sci. Pollut. Res. 2021, 28, 60195–60208. [Google Scholar] [CrossRef]
  49. Azam, M.; Rehman, Z.U.; Ibrahim, Y. Causal nexus in industrialization, urbanization, trade openness, and carbon emissions: Empirical evidence from OPEC economies. Environ. Dev. Sustain. 2022, 24, 13990–14010. [Google Scholar] [CrossRef]
  50. Su, M.; Wang, Q.; Li, R.; Wang, L. Per capita renewable energy consumption in 116 countries: The effects of urbanization, industrialization, G.D.P., aging, and trade openness. Energy 2022, 254, 124289. [Google Scholar] [CrossRef]
  51. Fakher, H.A.; Ahmed, Z.; Acheampong, A.O.; Nathaniel, S.P. Renewable energy, non-renewable energy, and environmental quality nexus: An investigation of the N-shaped Environmental Kuznets Curve based on six environmental indicators. Energy 2023, 263, 125660. [Google Scholar] [CrossRef]
  52. Begum, R.A.; Sohag, K.; Abdullah, S.M.S.; Jaafar, M. CO2 emissions, energy consumption, economic and population growth in Malaysia. Renew. Sustain. Energy Rev. 2015, 41, 594–601. [Google Scholar] [CrossRef]
  53. Zhang, Y.J.; Yi, W.C.; Li, B.W. The impact of urbanization on carbon emissions: Empirical evidence in Beijing. Energy Procedia 2015, 75, 2963–2968. [Google Scholar] [CrossRef] [Green Version]
  54. Sikder, M.; Wang, C.; Yao, X.; Huai, X.; Wu, L.; Kwame Yeboah, F.; Dou, X. The integrated impact of G.D.P. growth, industrialization, energy use, and urbanization on CO2 emissions in developing countries: Evidence from the panel ARDL approach. Sci. Total Environ. 2022, 837, 155795. [Google Scholar] [CrossRef]
  55. Dogan, E.; Seker, F. Determinants of CO2 emissions in the European Union: The role of renewable and non-renewable energy. Renew. Energy 2016, 94, 429–439. [Google Scholar] [CrossRef]
  56. Xu, B.; Lin, B. How industrialization and urbanization process impacts on CO2 emissions in China: Evidence from nonparametric additive regression models. Energy Econ. 2015, 48, 188–202. [Google Scholar] [CrossRef]
  57. Farhani, S.; Chaibi, A.; Rault, C. CO2 emissions, output, energy consumption, and trade in Tunisia. Econ. Model. 2014, 38, 426–434. [Google Scholar] [CrossRef]
  58. Arouri, M.E.H.; Youssef, A.B.; M’henni, H.; Rault, C. Energy consumption, economic growth and CO2 emissions in Middle East and North African countries. Energy Policy 2012, 45, 342–349. [Google Scholar] [CrossRef] [Green Version]
  59. Liu, X. Explaining the relationship between CO2 emissions and national income—The role of energy consumption. Econ. Lett. 2005, 87, 325–328. [Google Scholar] [CrossRef]
  60. Sadiq, M.; Kannaiah, D.; Yahya Khan, G.; Shabbir, M.S.; Bilal, K.; Zamir, A. Does sustainable environmental agenda matter? The role of globalization toward energy consumption, economic growth, and carbon dioxide emissions in South Asian countries. Environ. Dev. Sustain. 2022, 25, 76–95. [Google Scholar] [CrossRef]
  61. Zhang, Z.; Zhao, M.; Zhang, Y.; Feng, Y. How does urbanization affect public health? New evidence from 175 countries worldwide. Front. Public Health 2022, 10, 1096964. [Google Scholar]
  62. Gupta, P.K.; Maiti, S. Enhancing data-driven modeling of fluoride concentration using new data mining algorithms. Environ. Earth Sci. 2022, 81, 89. [Google Scholar] [CrossRef]
  63. World Bank. Available online: https://data.worldbank.org/country/india (accessed on 10 December 2022).
  64. Singh, K.; Adhana, P.; Garg, V. Impact on the economy of India due to variations in climate. Int. J. Zool. Appl. Biosci. 2022, 7, 5–8. [Google Scholar] [CrossRef]
  65. OECD. Available online: https://www.oecd.org/newsroom/40556222.pdf (accessed on 18 November 2022).
  66. Yuk, E.H.; Park, S.H.; Park, C.S.; Baek, J.G. Feature-learning-based printed circuit board inspection via speeded-up robust features and random forest. Appl. Sci. 2018, 8, 932. [Google Scholar] [CrossRef] [Green Version]
  67. Ali, W.; Abdullah, A.; Azam, M. The dynamic relationship between structural change and CO2 emissions in Malaysia: A cointegrating approach. Environ. Sci. Pollut. Res. 2017, 24, 12723–12739. [Google Scholar] [CrossRef]
Figure 1. Atmospheric carbon dioxide amounts and annual emissions.
Sustainability 15 09025 g001
Figure 2. Relationship among all variables.
Sustainability 15 09025 g002
Figure 3. Per capita income.
Sustainability 15 09025 g003
Figure 4. Per capita energy consumption.
Sustainability 15 09025 g004
Figure 5. Total urban population.
Sustainability 15 09025 g005
Figure 6. Trade openness.
Sustainability 15 09025 g006
Figure 7. CO2 emissions.
Sustainability 15 09025 g007
Figure 8. Architecture of the random forest model.
Sustainability 15 09025 g008
Figure 9. Trend of the error term.
Sustainability 15 09025 g009
Figure 10. Importance of the variables.
Sustainability 15 09025 g010
Figure 11. CUSUM.
Figure 11. CUSUM.
Sustainability 15 09025 g011
Figure 12. CUSUM square.
Sustainability 15 09025 g012
Table 1. Various international studies related to carbon emissions.
AuthorOriginPeriodMethodResults
Fakher et al., 2023 [51]OPEC1994–2019RegressionAn N-shaped relationship exists between per capita income and measures of environmental deterioration.
Begum et al., 2015 [52]Malaysia1970–1980ARDL modelThe negative relation between carbon emissions and per capita income.
Zhang et al., 2015 [53]China1980–2013ARDL modelThe positive relation between urbanization and carbon emissions.
Sikder et al., 2022 [54]Developing Countries1995–2018ARDL modelResults show that economic growth, energy consumption, urbanization, and industrialization increase carbon emissions.
Hossain, M.S., 2011 [45]8 newly industrialized countries1971–2007Granger causality testUnidirectional short-run causality from economic growth and trade openness to carbon emissions.
Dogan &Seker, 2016 [55]European Union1980–2012Panel estimation techniquesThere is a negative impact of renewable energy and trade on carbon emissions.
Xu and Lin, 2015 [56]China1990–2011Nonparametric additive regression modelIt has been found that the impact of industrialization and urbanization on carbon emissions varies across regions.
Farhani et al., 2014 [57]Tunisia1971–2008ARDL modelShort-run unidirectional causality has been found, which runs from GDP, GDP square, and energy consumption to carbon emissions.
Arouri et al., 2012 [58]Middle East and North African countries1981–2005Bootstrap panel unit root test and cointegrationResults depict positive relation between energy consumption and carbon emissions. There is poor support for the EKC theory.
Liu, X., 2005 [59]24 OECD countries1975–1990Regression equationsA negative relation has been found between income and carbon emissions.
Sadiq et al., 2022 [60]South Asian countries1972–2019Fully modified O.L.S.Results indicate that energy consumption, globalization, and economic growth increase carbon emissions.
Zhang et al., 2022 [61]175 countries2000–2018Coefficient stability test, GMM, instrumental variable methodImprovement in living standard can improve public health in urban areas.
Table 2. Description of the variable.
S. No.VariableSource
1CO2 emissions (mn tones)World Development Indicators
2Per capita energy consumption (kWh)Our World in Data
3Per capita income (constant 2015 U.S. USD )World Development Indicators
4Trade openness (% of GDP)World Development Indicators
5Total urban populationWorld Development Indicators
Table 3. Tests used to check the assumptions of the model.
S. No.AssumptionTest/Criteria
1HomoscedasticityBreusch–Pagan–Godfrey test
2StabilityCUSUM and CUSUM Square
3Serial AutocorrelationLagrange multiplier(LM) test
4NormalityHistogram and Jarque–Bera
Table 4. Summary statistics.
VariableObs.MeanStd.
Dev.
MinMax
(Y)42936.0226494.5419388.82271941.815
(EC)423874.641598.3561729.0396889.742
(CO2)421.20 × 1097.43 × 1082.92 × 1082.63 × 109
(TO)4230.4635814.5001212.2192755.79372
(UB)422.751390.3911207 2.2949133.889168
Table 5. Unit root tests.
VariablesKPSSADFDF-GLS
At Level
Log(CO2)0.798668 ***−1.875902−0.553597
log(Y)0.752899 *** 0.874516−0.075082
log(TO)0.714984 ** −0.668131 0.010759
log(UB)0.812034 ** −0.953089 0.633703
log(EC)0.795104 ***−1.213025−0.166812
1st difference
Log(CO2)0.406172 *−3.648016 ***−2.597612 **
log(Y)0.479092 **−6.128427 ***−2.211544 **
log(TO)0.615581 **−5.195471 *** −4.803803 ***
log(UB)0.776082 ***−4.439020 ***−1.970005 **
log(EC)0.481169 **−3.297859 ***−2.748679 ***
*** “at 1% level”, ** “at 5% level”, * at 10% level.
Table 6. Cointegration results (F bounds test).
F Bounds TestH0: No Level Relationship
Test StatisticsValueSig. LevelI (0)I (1)
Dependent variable: CO2 emissions
F-statistics
K
9.28288910%2.463.46
45%2.9474.088
1%4.0935.532
Dependent variable: energy consumption
F-statistics
K
7.27050010%2.4273.395
45%2.8934
1%3.9675.455
Dependent variable: per capita income
F-statistics
K
8.10004010%2.4273.395
45%2.8934
1%3.9675.455
Dependent variable: trade openness
F-statistics
K
7.31745110%2.4273.395
45%2.8934
1%3.9675.455
Dependent variable: total urban population
F-statistics
K
4.38346310%2.4273.395
45%2.8934
1%3.9675.455
Table 7. Long run and short run coefficients.
VariablesCoefficientStd. Errort-Statisticsp-Value
Long Run
log (CO2)−0.691342 ***0.231607 −2.9849820.0073
log(Y)−0.491969 ***0.082263−5.9804650.0000
log (TO)0.133460 **0.0606372.2009750.0396
log (UB)0.245248 **0.3277342.7483160.0463
log (EC)1.839673 ***0.225141 8.171198 0.0000
Short Run
D(logCO2(−1))−0.377986 ***0.100887−3.7466340.0013
D(logEC)1.034088 ***0.08121112.733280.0000
D(logY)−0.012747 0.063207−0.2016680.8422
D(logTO)−0.051640 **0.021257−2.4293290.0247
D(logUB)6.941345 ***0.7792438.9078080.0000
ECT−0.691342 ***0.077182−8.9572360.0000
*** “at 1% level”, ** “at 5% level”.
Table 8. Results of the random forest model..
R2RMSEMAE
Train0.9885650.1280520.102064
Test0.9925830.09148580.080175
Table 9. Pairwise Granger causality test.
H0: Does Not Granger CauseObs.F-StatisticProb.
CO2 to EC
EC to CO2
391.36053
3.47464
0.2701
0.0424 **
Y to CO2
CO2 to Y
390.46512 0.640700.6320 0.5332
TO to CO2
CO2 to TO
393.46636 1.590060.0427 **
0.2187
UB to CO2
CO2 to UB
392.43585 0.103630.1027 0.9018
Y to EC
EC to Y
392.72418 0.257540.0799 *
0.7744
TO to EC
EC to TO
390.32598 1.549710.7240 0.2269
UB to EC
EC to UB
393.19282 0.372300.0536 **
0.6919
TO to Y
Y to TO
391.52782 1.591070.2315 0.2185
UB to Y
Y to UB
390.30966 0.709140.7357 0.4992
UB to TO
TO to UB
390.43255 1.013800.6524 0.3735
** “at 5% level”, * at 10% level.
Table 10. Diagnostic tests.
TestF-Statisticp Value
Breusch-Godfrey Serial Correlation LM Test1.1652770.3343
Breusch-Pagan-Godfrey: Heteroskedasticity Test0.8482130.6268
Disclaimer/Publisher’s Note: The statements, opinions and data contained in all publications are solely those of the individual author(s) and contributor(s) and not of MDPI and/or the editor(s). MDPI and/or the editor(s) disclaim responsibility for any injury to people or property resulting from any ideas, methods, instructions or products referred to in the content.

