
Identification of Ecological Management Zoning on Arid Region from the Perspective of Risk Assessment


Abstract
1. Introduction
2. Materials and Methods
2.1. Study Area
2.2. Data Sources
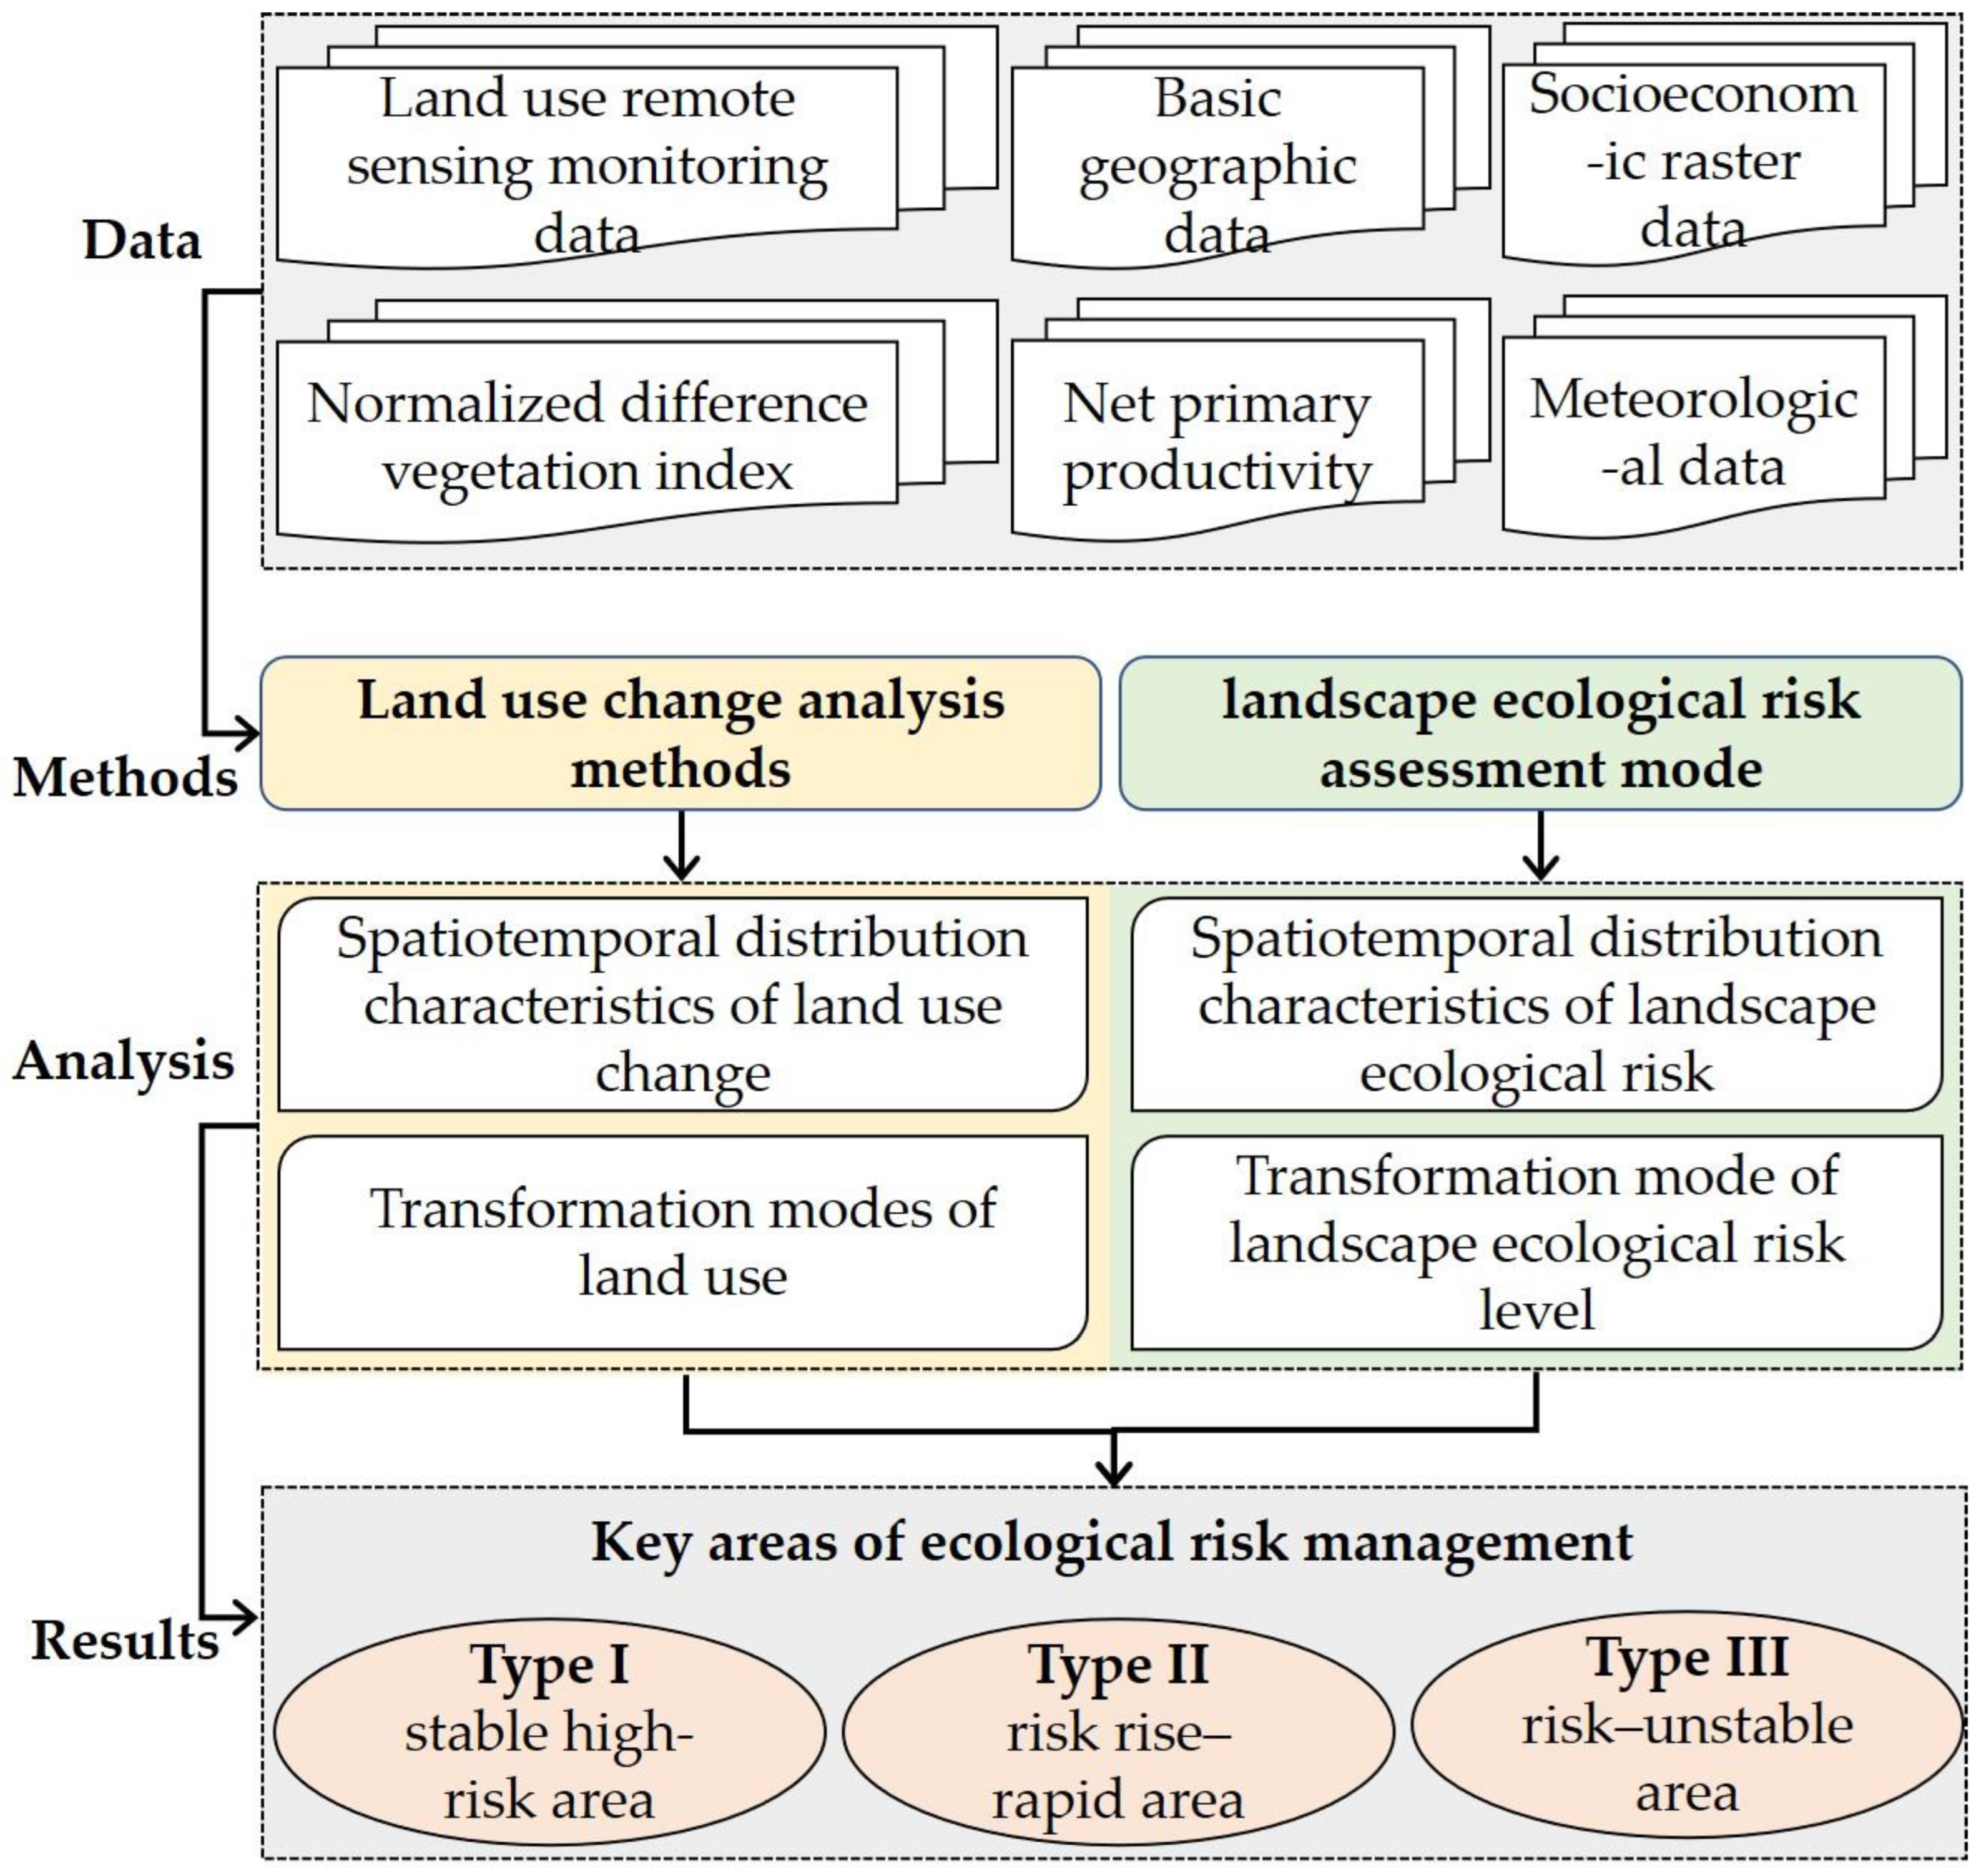
2.3. Methods
2.3.1. Land Use Transfer Matrix
2.3.2. Construct Landscape Ecological Risk Assessment Mode
2.3.3. Change Rate of Landscape Ecological Risk
2.3.4. Variation Coefficient of Landscape Ecological Risk Index
3. Results
3.1. Spatiotemporal Dynamics of Land Use from 1980 to 2020
3.1.1. Spatiotemporal Distribution Characteristics of Land Use Change
3.1.2. Transformation Modes of Land Use
3.2. Spatiotemporal Dynamics of Landscape Ecological Risks from 1980 to 2020
3.2.1. Spatiotemporal Distribution Characteristics of Landscape Ecological Risk
3.2.2. Transformation Mode of Landscape Ecological Risk Level
3.3. Key Areas of Ecological Risk Management
4. Discussions
4.1. Attribution Analysis of Land Use and Landscape Ecological Risk Change
4.2. Spatial Correlation between Land Use Structure and Landscape Ecological Risk Structure
4.3. Ecological Risk Management Measures for Key Areas
5. Conclusions
Author Contributions
Funding
Institutional Review Board Statement
Informed Consent Statement
Data Availability Statement
Conflicts of Interest
References
- Peng, J.; Dang, W.; Liu, Y.; Zong, M.; Hu, X. Research Progress and Prospect of Landscape Ecological Risk Assessment. Acta Geogr. Sin. 2015, 70, 664–677. [Google Scholar]
- Chen, Q.; Liu, J. Development process and perspective on ecological risk assessment. Acta Ecol. Sin. 2014, 34, 239–245. [Google Scholar] [CrossRef]
- Depietri, Y. The social–ecological dimension of vulnerability and risk to natural hazards. Sustain. Sci. 2020, 15, 587–604. [Google Scholar] [CrossRef]
- Wang, R.; Ouyang, Z. Social–economic–natural complex ecosystem and sustainability. Bull. Chin. Acad. Sci. 2012, 27, 337–345. [Google Scholar]
- Bryan, B.A.; Gao, L.; Ye, Y.; Sun, X.; Connor, J.D.; Crossman, N.D.; Stafford–Smith, M.; Wu, J.; He, C.; Yu, D.; et al. China’s response to a national land–system sustainability emergency. Nature 2018, 559, 193–204. [Google Scholar] [CrossRef] [PubMed]
- Frazier, A.E.; Bryan, B.A.; Buyantuev, A.; Chen, L.; Echeverria, C.; Jia, P.; Liu, L.; Li, Q.; Ouyang, Z.; Wu, J.; et al. Ecological civilization: Perspectives from landscape ecology and landscape sustainability science. Landsc. Ecol. 2019, 34, 1–8. [Google Scholar] [CrossRef]
- Kang, P.; Chen, W.; Hou, Y.; Li, Y. Spatial–temporal risk assessment of urbanization im–pacts on ecosystem services based on pressure–status–response framework. Sci. Rep. 2019, 9, 16806. [Google Scholar] [CrossRef]
- Hou, Y.; Ding, W.; Liu, C.; Li, K.; Cui, H.; Liu, B.; Chen, W. Influences of impervious surfaces on ecological risks and controlling strategies in rapidly urbanizing regions. Sci. Total Environ. 2022, 825, 153823. [Google Scholar] [CrossRef]
- Bailey, R.G.; Zoltai, S.C.; Wiken, E.B. Ecological regionalization in Canada and the United States. Geoforum 1985, 16, 265–275. [Google Scholar] [CrossRef]
- Liu, Y.X.; Fu, B.J.; Wang, S.; Zhao, W.W. Global ecological regionalization: From biogeography to ecosystem services. Curr. Opin. Environ. Sustain. 2018, 33, 1–8. [Google Scholar] [CrossRef]
- Ayre, K.K.; Landis, W.G. A Bayesian approach to landscape ecological risk assessment applied to the Upper Grande Ronde Watershed, Oregon. Hum. Ecol. Risk Assess. Int. J. 2012, 18, 946–970. [Google Scholar] [CrossRef]
- Liang, Y.; Song, W. Integrating potential ecosystem services losses into ecological risk assessment of land use changes: A case study on the Qinghai-Tibet Plateau. J. Environ. Manag. 2022, 318, 115607. [Google Scholar] [CrossRef]
- Cao, Q.; Zhang, X.; Ma, H.; Wu, J. Research progress of landscape ecological risk and evaluation framework based on ecosystem services: ESRISK. Acta Ecol. Sin. 2018, 73, 843–855. [Google Scholar]
- Liu, Y.; Wang, Y.; Peng, J.; Zhang, T.; Wei, H. Urban landscape ecological risk assessment based on the 3D framework of adaptive cycle. Acta Geogr. Sin. 2015, 70, 1052–1067. [Google Scholar]
- Gong, J.; Cao, E.; Xie, Y.; Xu, C.; Li, H.; Yan, L. Integrating ecosystem services and landscape ecological risk into adaptive management: Insights from a western mountain-basin area. China J. Environ. Manag. 2021, 281, 111817. [Google Scholar] [CrossRef]
- Polyakov, V.; Fares, A.; Kubo, D.; Jacobi, J.; Smith, C. Evaluation of a non-point source pollution model, AnnAGNPS, in a tropical watershed. Environ. Model. Softw. 2007, 22, 1617–1627. [Google Scholar] [CrossRef]
- Wang, J.; Xie, D.; Shao, J.; Lei, P. Identification of source–sink risk pattern of agricultural non–point source pollution in cultivated land in Three Gorge Reservoir Area based on accumulative minimum resistance mode. Trans. Chin. Soc. Agric. Eng. 2016, 32, 206–215. [Google Scholar]
- Li, W.; Cao, Q.; Lang, K.; Wu, J. Linking potential heat source and sink to urban heat island: Heterogeneous effects of landscape pattern on land surface temperature. Sci. Total Environ. 2017, 586, 457–465. [Google Scholar] [CrossRef]
- Cao, Q.; Zhang, X.; Lei, D.; Guo, L.; Sun, X.; Kong, F.; Wu, J. Multi–scenario simulation of landscape ecological risk probability to facilitate different decision–making preferences. J. Clean. Prod. 2019, 227, 325–335. [Google Scholar] [CrossRef]
- Zhang, X.; Shi, P.; Luo, J.; Liu, H.; Wei, W. Ecological risk analysis of arid inland river basin based on landscape pattern: Taking Shiyanghe River basin as an example. J. Nat. Resour. 2014, 29, 410–419. [Google Scholar]
- Kang, Z.; Zhang, Z.; Wei, H.; Liu, L.; Ning, S.; Zhao, G.; Wang, T.; Tian, H. Landscape ecological risk assessment of Manas River basin based on land use change. Acta Ecol. Sin. 2020, 40, 6472–6485. [Google Scholar]
- Zhang, X.; Yao, L.; Luo, J.; Liang, W. Exploring Changes in Land Use and Landscape Ecological Risk in Key Regions of the Belt and Road Initiative Countries. Land 2022, 11, 940. [Google Scholar] [CrossRef]
- Mo, W.; Wang, Y.; Zhang, Y.; Zhuang, D. Impacts of road network expansion on landscape ecological risk in a megacity, China: A case study of Beijing. Sci. Total Environ. 2017, 574, 1000–1011. [Google Scholar] [CrossRef]
- Li, W.; Wang, Y.; Xie, S.; Sun, R.; Cheng, X. Impacts of landscape multifunctionality change on landscape ecological risk in a megacity, China: A case study of Beijing. Ecol. Indic. 2020, 117, 106681. [Google Scholar] [CrossRef]
- Wang, B.; Ding, M.; Li, S.; Liu, L.; Ai, J. Assessment of landscape ecological risk for a cross-border basin: A case study of the Koshi River Basin, central Himalayas. Ecol. Indic. 2020, 117, 106621. [Google Scholar] [CrossRef]
- Galparsoro, I.; Korta, M.; Subirana, I.; Borja, Á.; Menchaca, I.; Solaun, O.; Muxika, I.; Iglesias, G.; Bald, J. A new framework and tool for ecological risk assessment of wave energy converters projects. Renew. Sustain. Energy Rev. 2021, 151, 111539. [Google Scholar] [CrossRef]
- Hobday, A.J.; Smith AD, M.; Stobutzki, I.C.; Bulman, C.; Daley, R.; Dambacher, J.M.; Deng, R.A.; Dowdney, J.; Fuller, M.; Furlani, D.; et al. Ecological risk assessment for the effects of fishing. Fish. Res. 2011, 108, 372–384. [Google Scholar] [CrossRef]
- Ran, P.; Hu, S.; Frazier, A.E.; Qu, S.; Yu, D.; Tong, L. Exploring changes in landscape ecological risk in the Yangtze River Economic Belt from a spatiotemporal perspective. Ecol. Indic. 2022, 137, 108744. [Google Scholar] [CrossRef]
- National Development and Reform Commission (NDRC); Ministry of Foreign Affairs (MFA); Ministry of Commerce of China (MOC). Vision and Actions on Jointly Building Silk Road Economic Belt and 21st–Century Maritime Silk Road; R. Foreign Languages Press: Beijing, China, 2015.
- Sun, X.; Fang, C. Ecological Risk Assessment Mode and Its Application in the Urbanization Process of Arid Areas: Taking the Urbanization Process of Hexi Region as an Example. Geogr. Arid. Areas 2006, 5, 668–674. [Google Scholar]
- Zhao, B.; Li, Y.; Zhang, X.; Li, W.; Li, L.; Fan, Z.; Yang, X. The influence of ecological control on desertification in Hexi Corridor. Environ. Dev. 2021, 33, 198–203. [Google Scholar]
- Gansu Provincial Bureau of Statistics. Gansu Development Yearbook 2020; China Statistics Press: Beijing, China, 2020.
- Wang, D. Significance of the Hexi Corridor to the “the Belt and Road”; Fudan University the Belt and Road and Global Governance Institute: Shanghai, China, 2018. [Google Scholar]
- Liu, J.; Ning, J.; Kuang, W.; Xu, X.; Zhang, S.; Yan, C.; Li, R.; Wu, S.; Hu, Y.; Du, G.; et al. Spatiotemporal patterns and characteristics of land-use change in China during 2010–2015. J. Geogr. Sci. 2018, 73, 789–802. [Google Scholar]
- Liu, J.; Ning, J.; Kuang, W.; Zhang, Z.; Xu, X.; Qin, Y.; Ning, J.; Zhou, W.; Zhang, S.; Li, R.; et al. Spatiotemporal characteristics, patterns and causes of land use changes in China since the late 1980s. J. Geogr. Sci. 2014, 24, 195–210. [Google Scholar] [CrossRef]
- Wu, L.N.; Yang, S.T.; Liu, X.Y.; Luo, Y.; Zhou, X.; Zhao, H.G. Response of land use change to human activities in the Beiluohe River Basin since 1976. Acta Geogr. Sin. 2014, 69, 54–63. [Google Scholar]
- Yao, L.; Zhang, X.; Zhou, L.; Luo, J.; Wang, Z.; Lei, Y.; Li, Y. Ecosystem service trade-offs/synergies effects of land use change in the Mountain-Oasis-Ddesert complex system: A case study of Zhangye City. Acta Ecol. Sin. 2022, 42, 8138–8151. [Google Scholar]
- Zhang, W.; Chang, W.J.; Zhu, Z.C.; Hui, Z. Landscape ecological risk assessment of Chinese coastal cities based on land use change. Appl. Geogr. 2020, 117, 102174. [Google Scholar] [CrossRef]
- Chen, J.; Dong, B.; Li, H.; Zhang, S.; Peng, L.; Fang, L.; Zhang, C.; Li, S. Study on landscape ecological risk assessment of hooded crane breeding and overwintering habitat. Environ. Res. 2020, 187, 109649. [Google Scholar] [CrossRef]
- Zhong, Y.; Lin, A.; He, L.; Zhou, Z.; Yuan, M. Spatiotemporal dynamics and driving forces of urban land-use expansion: A case study of the Yangtze River Economic Belt, China. Remote Sens. 2020, 12, 287. [Google Scholar] [CrossRef]
- Di Matteo, J.A.; Ferreyra, J.M.; Cerrudo, A.A.; Echarte, L.; Andrade, F.H. Yield potential and yield stability of Argentine maize hybrids over 45 years of breeding. Field Crop. Res. 2016, 197, 107–116. [Google Scholar] [CrossRef]
- Doring, T.F.; Reckling, M. Detecting global trends of cereal yield stability by adjusting the coefficient of variation. Eur. J. Agron. 2018, 99, 30–36. [Google Scholar] [CrossRef]
- Yang, Q.; Nan, Z.B.; Tang, Z. Influencing factors of the grassland ecological compensation policy to herdsmen’s behavioral response: An empirical study in Hexi corridor. Acta Ecol. Sin. 2022, 42, 74–79. [Google Scholar] [CrossRef]
- Wang, S.J.; Cui, Z.T.; Lin, J.J.; Xie, J.Y.; Su, K. The coupling relationship between urbanization and ecological resilience in the Pearl River Delta. J. Geogr. Sci. 2022, 32, 44–64. [Google Scholar] [CrossRef]


| Data | Details | Resolution | Sources |
|---|---|---|---|
| Land use remote sensing monitoring data | 1980, 2000, and 2020 | 30 m | Data Center for Resources and Environmental Sciences, Chinese Academy of Sciences (http://www.resdc.cn, accessed on 5 January 2022) |
| Basic geographic data | Vector data of administrative boundaries, cities, and rivers | Line/point data | |
| Digital elevation mode | For extracting the slope and elevation | 30 m | |
| Socioeconomic raster data | Population density raster data for 1980, 2000, and 2020 | 1 km | WorldPop data platform (https://www.worldpop.org, accessed on 10 January 2022) |
| GDP density raster data for 1980, 2000, and 2020 | 1 km | National Earth System Science Data Center (http://www.geodata.cn), accessed on 10 January 2022 | |
| Meteorological data | Precipitation and temperature for 1980, 2000, and 2020 | 1 km | Data Center for Resources and Environmental Sciences, Chinese Academy of Sciences (http://www.resdc.cn, accessed on 3 February 2022) |
| Net primary productivity | 1980, 2000, and 2020 | 1 km | US National Aeronautics and Space Administration (http://modis.gsfc.nasa.gov, accessed on 3 February 2022) |
| Normalized difference vegetation index | 1980, 2000, and 2020 | 1 km | US Geological Survey (USGS) (https://www.usgs.gov, accessed on 5 February 2022) |
| Dimensions | Indicators (Abbreviation) | Unit | Weight | Orientation |
|---|---|---|---|---|
| Exposure | GDP density (GDP) | 104 yuan/km2 | 0.1042 | Positive |
| Population density (Pop) | Population/km2 | 0.1074 | Positive | |
| Sensitivity | Elevation (Ele) | m | 0.1299 | Positive |
| Slope (Slp) | % | 0.1248 | Positive | |
| Temperature (Temp) | °C | 0.1291 | Negative | |
| Precipitation (Prep) | mm | 0.1341 | Negative | |
| Adaptive capacity | Net primary productivity (NPP) | g·C/m2 | 0.1356 | Negative |
| NDVI values (NDVI) | / | 0.1345 | Negative |
| Rate of Change (%) | Cultivated Land | Forest Land | Grassland | Water | Construction Land | Unused Land |
|---|---|---|---|---|---|---|
| 1980–2000 | 3.28 | 0.04 | –0.47 | –0.95 | 6.21 | 0.13 |
| 2000–2020 | 14.22 | –0.29 | –0.60 | 19.75 | 62.39 | –1.61 |
| 1980–2020 | 17.97 | –0.26 | –1.06 | 18.62 | 72.48 | –1.48 |
| Land Type | 1980 | 2000 | 2020 | 1980–2000 | 2000–2020 | 1980–2020 | ||||||
|---|---|---|---|---|---|---|---|---|---|---|---|---|
| Number of Units | Area (km2) | Area Proportion (%) | Number of Units | Area (km2) | Area Proportion (%) | Number of Units | Area (km2) | Area Proportion (%) | Rate of Change (%) | Rate of Change (%) | Rate of Change (%) | |
| High | 137 | 10,301.07 | 4.16 | 137 | 10,129.23 | 4.09 | 137 | 10,055.84 | 4.06% | –1.67% | –0.72% | –2.38% |
| Medium–high | 1695 | 13,9351.3 | 56.28 | 1701 | 14,0238.4 | 56.64 | 1701 | 140,645.6 | 56.80% | 0.64% | 0.29% | 0.93% |
| Medium | 1016 | 79,909.72 | 32.27 | 1022 | 80,883.24 | 32.66 | 988 | 78,218.12 | 31.59% | 1.22% | –3.30% | –2.12% |
| Medium–low | 237 | 14,867.53 | 6.00 | 229 | 13,476.24 | 5.44 | 251 | 15,623.2 | 6.31% | –9.36% | 15.93% | 5.08% |
| Low | 128 | 3184.94 | 1.29 | 124 | 2887.388 | 1.17 | 136 | 3071.789 | 1.24% | –9.34% | 6.39% | –3.55% |
| Dominant Structure | Dominant Land Type | District/County Name (Abbreviation) | Number | Proportion |
|---|---|---|---|---|
| Single land type | Unused land | AKS, DH, GT, GUZ, JT, LNZ, MQ, SB, YM | 9 | 45% |
| Composite land type | Unused land—Cultivated land | GAZ, LIZ, SZ, YC | 4 | 20% |
| Grassland—Cultivated land | GL, ML, SD | 3 | 15% | |
| Unused land—Grassland | JC, JYG, SN | 3 | 15% | |
| Grassland—Forest land | TZ | 1 | 5% |
| Dominant Structure | Dominant Risk Type | District/County Name (Abbreviation) | Number | Proportion |
|---|---|---|---|---|
| Single risk type | High | GAZ, GL | 2 | 10% |
| Medium | GUZ, MQ, SB, YM | 4 | 20% | |
| Composite risk type | High–Medium high | GT, JYG, LNZ | 3 | 15% |
| High–Medium | ML, SD, TZ, YC | 4 | 20% | |
| Medium high–Medium | AKS, DH, JC, JT, LIZ, SZ | 6 | 30% | |
| Medium–Medium low | SN | 1 | 5% |
Disclaimer/Publisher’s Note: The statements, opinions and data contained in all publications are solely those of the individual author(s) and contributor(s) and not of MDPI and/or the editor(s). MDPI and/or the editor(s) disclaim responsibility for any injury to people or property resulting from any ideas, methods, instructions or products referred to in the content. |
© 2023 by the authors. Licensee MDPI, Basel, Switzerland. This article is an open access article distributed under the terms and conditions of the Creative Commons Attribution (CC BY) license (https://creativecommons.org/licenses/by/4.0/).
Share and Cite
Yao, L.; Zhang, X.; Luo, J.; Li, X. Identification of Ecological Management Zoning on Arid Region from the Perspective of Risk Assessment. Sustainability 2023, 15, 9046. https://doi.org/10.3390/su15119046
Yao L, Zhang X, Luo J, Li X. Identification of Ecological Management Zoning on Arid Region from the Perspective of Risk Assessment. Sustainability. 2023; 15(11):9046. https://doi.org/10.3390/su15119046
Chicago/Turabian StyleYao, Litang, Xuebin Zhang, Jun Luo, and Xuehong Li. 2023. "Identification of Ecological Management Zoning on Arid Region from the Perspective of Risk Assessment" Sustainability 15, no. 11: 9046. https://doi.org/10.3390/su15119046
APA StyleYao, L., Zhang, X., Luo, J., & Li, X. (2023). Identification of Ecological Management Zoning on Arid Region from the Perspective of Risk Assessment. Sustainability, 15(11), 9046. https://doi.org/10.3390/su15119046