Article

Investigation on the Influence of the Bit Radius and Impact Velocity on Rock Fragmentation by Discrete Element Method

by
César Hernández-Vielma
1,*,
Danilo Estay
1 and
Marcela Cruchaga
2
1
Department of Mechanical Engineering, Universidad Técnica Federico Santa María, Avenida Vicuña Mackenna 3939, Santiago 8940572, Chile
2
Department of Mechanical Engineering, Universidad de Santiago de Chile, Av. Bdo. O’Higgins, Santiago 9170022, Chile
*
Author to whom correspondence should be addressed.
Sustainability 2023, 15(11), 9051; https://doi.org/10.3390/su15119051
Submission received: 23 March 2023 / Revised: 21 May 2023 / Accepted: 30 May 2023 / Published: 3 June 2023
(This article belongs to the Special Issue Sustainable Geotechnical Engineering and Rock Mechanics)

Abstract

:
The bit–rock interaction is a key point in the fracture process observed in excavation applications, which makes its analysis relevant. As the discrete element method (DEM) has been successfully applied to study rock breakage behavior, we apply it in the present study to analyze various aspects of the bit–rock interaction. This research focuses on numerically analyzing the bit–rock interaction, encompassing the force penetration relationship (FPR), mechanical energy transfer to the rock, and the efficiency of the mechanical energy transfer process. In order to perform this analysis, we simulate various bit radii and impact velocities. In this study, we establish a power–law function to describe the relationship between the energy transferred to the rock and the force, both as functions of bit penetration. The least-squares method is employed to accomplish this determination. Remarkably, it was observed that the latter aligns with the Hertzian contact law when lower impact velocities of the bit are employed. Moreover, a bit-radius-dependent optimal velocity for the mechanical energy transfer process was determined, signifying its significance in the design of excavation tools. The primary conclusion drawn from this research is the quantification of the influence of both the bit impact velocity and the bit radius on the force penetration relationship during the bit–rock interaction. This quantification was achieved by employing the coefficients derived from the regression model established for the FPR. These findings hold practical implications for the enhancement of excavation tools’ efficiency during the design phase, thus contributing to advancements in the field of excavation engineering.

1. Introduction

In excavation applications, rock indentation represents the fundamental process for rock excavation and fragmentation [1], and comprehension of the bit–rock interaction is of considerable importance for developing rock fragmentation tools [2]. In addition, it is crucial to understand the force–penetration relationship (FPR) of a bit during impact penetration [3]. Moreover, the behavior of the rock should be considered in order to predict drill performance; it is also necessary to understand the effects of the applied forces, the bit geometry, and the interaction with the drilled rock [4]. Additionally, the presence of water can substantially modify the properties and behavior of rocks, profoundly influencing their stability and response to external loads [5,6].
The force–penetration relationship has been extensively investigated. Several indenter shapes and different rocks have been considered. For example, the authors of [7] conducted an experimental study of the FPR using different indenter shapes (conical, spherical, and pyramidal) and two distinct materials (limestone and granite). In [8], it was shown that the energy transfer in the bit–rock interaction is dependent on the FPR. In addition, the FPR for each bit–rock combination is dependent on both the type of indenter and the rock material [9]. In [10], the two-point-strain-measure (TPSM) method was developed to measure the force–penetration relationship; this method is still in use [11]. The contact force in the bit–rock interaction has been investigated to optimize the excavation process [12], and an empirical power function for the FPR was obtained.
According to [2], numerical techniques seem to be the foremost approach to study the bit–rock interaction problem. The authors of [13], numerically simulated the impact in the rock fragmentation process based on the impulse–momentum theorem to study the bit–rock interaction. In [14], an approach based on the finite element method (FEM) was presented to model the impact on the bit–rock interaction and to describe the energy transfer process to the rock, the interactions between the indenter and the rock, and the rock fragmentation. In [15], the penetration rate of the bit into the rock was determined using the FEM, and this method was used to analyze the FPR and the damage during the bit–rock interaction [16,17,18].
The fracture of rock materials has been studied using the discrete element method (DEM) [19,20]. In [21], an approach to model the behavior of concrete during fracture using the DEM was reported. The numerical results were compared to experimental data, demonstrating the ability of the DEM to simulate the fracture process in uniaxial compression and indirect tensile strength tests.
In [22], the authors found that the DEM can be used to simulate excavation processes with a cut-off wheel. The DEM-FEM technique was used to explore rock failure, the evolution of the cutting forces, and the wear on the tool. A study of rock cutting using the DEM [23] verified that the DEM could model rock cutting and obtained results consistent with experimental data. They found the DEM can accurately quantify the forces between the rock and the tool. The discrete element method was used to study the influence mechanism of rock brittleness on rock fragmentation and the cutting performance in [24].
In another study, the authors predicted the fracture and energy behavior in a jaw crusher [25]. Comparison of the DEM results with experimental results showed that the DEM adequately modeled the fractures in the geomaterials studied. In [26,27], the authors numerically investigated the factors governing crack initiation and the FPR during the indentation process. They used the DEM and obtained results quantitatively consistent with analytical predictions.
In this work, we present a numerical study of the bit–rock interaction using the discrete element method, with the aim of validating the proposed model and assessing the influence of the bit velocity and radius on the rock breakage behavior. For this purpose, several bit radii and impact velocities of the bit are selected to perform DEM simulations of the indentation process. The least-squares method is used to find a power–law relation for the force–penetration relationship and the energy transfer to the rock. The efficiency of the mechanical energy transfer is also studied. A linear contact model is used; nevertheless, it is proven that the force–penetration relationship converges to the Hertzian contact law at low impact velocities of the bit. Results are also qualitatively compared to previous reports in order to validate the numerical model used.
From the bibliographic review carried out, no quantitative study (experimental, analytical, or numerical) has been conducted to examine the influence of bit radius and bit impact velocity on the force–penetration relationship (FPR). Although it has been observed that these factors affect the FPR, the magnitude of their influence has not been quantified. Due to this, in the present work, we propose to investigate the impact of these factors on the efficiency of the rock fracturing process.
The novelty of this work lies in its focus on studying the bit–rock interaction and quantitatively analyzing the influence of bit radius and impact velocity on rock fragmentation. This analysis is conducted through numerical simulation using the discrete element method. Additionally, investigating the impact of these factors on process efficiency will contribute to the development of more efficient and effective rock fragmentation tools.
Notice that in the present work, the interaction between the bit and the rock is specifically analyzed without including the modeling of the complete tool. The pneumatic or hydraulic pressure that generates the kinetic energy of the bit is indirectly considered through the impact velocity of the bit.
This work is organized as follows: In Section 2, the discrete element formulation is described. In Section 3, the problem is posed. The results and discussion are detailed in Section 4. Finally, the conclusions are summarized.

2. Discrete Element Method

The discrete element method used in this work, developed by Cundall and Strack [28] and implemented in ESyS-Particle opensource code [29], is based on Newton’s second law. Therefore, the translation and rotation of discrete particles (spheres in this approach) are governed by the equations of dynamics for rigid bodies. For the ith particle, these equations can be stated as
F i = m i d 2 r i d t 2
M i = I i d ω i d t
where  F i  is the resultant force acting on particle i m i  is the particle mass,  r i  is the particle centroid position,  M i  is the total moment acting on the particle,  I i  is the inertia tensor, and  ω i  is the angular velocity of the particle.
The interaction between two particles in contact comprises the linear elastic force and the Coulomb’s law of friction in the normal and tangent directions, respectively. The normal contact force  F n  is computed as
F n = π 2 Y p R ¯ ξ n
where  Y p  is Young’s modulus of the particles in contact,  R ¯  is the mean radius,  ξ  is the overlapping distance, and  n  is the unit vector in the normal direction.
The tangential force is computed as
F t = π 4 ( 1 + ν p ) Y p R ¯ ζ
where  ν p  is the Poisson’s ratio and  ζ  is the elongation of a spring in the tangent direction initialized at the  t K  time of the first contact
ζ = t K t v r t dt
where  v r t  is the relative velocity between the particles at the contact point in the tangential direction.
If the computed tangent force is greater than the static friction force, slipping is present, and the tangent force is corrected:
If | | F t | | > μ s | | F n | | F t = μ d | | F n | | ζ | | ζ | |
where  μ s  and  μ d  are the static and dynamic friction coefficients. In this work, the friction coefficients are taken to be equal to  μ .
In the bonded particle model (BPM), two spherical particles are bonded as shown in Figure 1. The bond supports six interactions between the particles: the normal force, two shear forces, two bending moments, and one twisting moment.
The interactions are described by
F n = K n Δ u n , F s y = K s Δ u s y , F s z = K s Δ u s z M t = K t Δ θ t , M b y = K b Δ θ b y , M b z = K b Δ θ b z
where  Δ u n , Δ u s y ,  and  Δ u s z  are the relative movements in the normal and tangential directions, respectively;  θ t , θ b y ,  and  θ b z  are the relative angular displacements due to torsion and bending, respectively;  F n , F s y , F s z , M t , M b y ,  and  M b z  are the forces and moments shown in Figure 1; and  K n K s K t , and  K b  are the normal, shear, torsional, and bending stiffness, respectively, which are given by
K n = Y b A L , K b = Y b I b L , K s = Y b A 2 ( 1 + ν b ) L , K t = Y b J 2 ( 1 + ν b ) L ,
where  Y b  and  ν b  are the Young’s modulus of the bonds and Poisson modulus of the bonds, respectively.  A , I b ,  and J are geometrical parameters comprising the area, moment of inertia, and polar moment of inertia of the bond cross-section, respectively, and L is the length of the bond. These quantities are, in turn, given by
A = π R 1 + R 2 2 4 , I b = π R 1 + R 2 4 4 , J = π R 1 + R 2 4 2 , L = R 1 + R 2 ,
where  R 1  and  R 2  are the radii of the joined particles.
The Mohr–Coulomb failure criterion for brittle materials is used to determine the occurrence of bond breakage:
σ S C b + σ N tan ϕ b
where  σ S  and  σ N , respectively, are the shear and normal stresses in the beam as computed from linear elastic beam theory. The cohesion  C b  and the angle of internal friction  ϕ b  are microparameters that govern the bond breakage. More information about the bonded particle model can be found in [30,31,32].

3. Problem Description

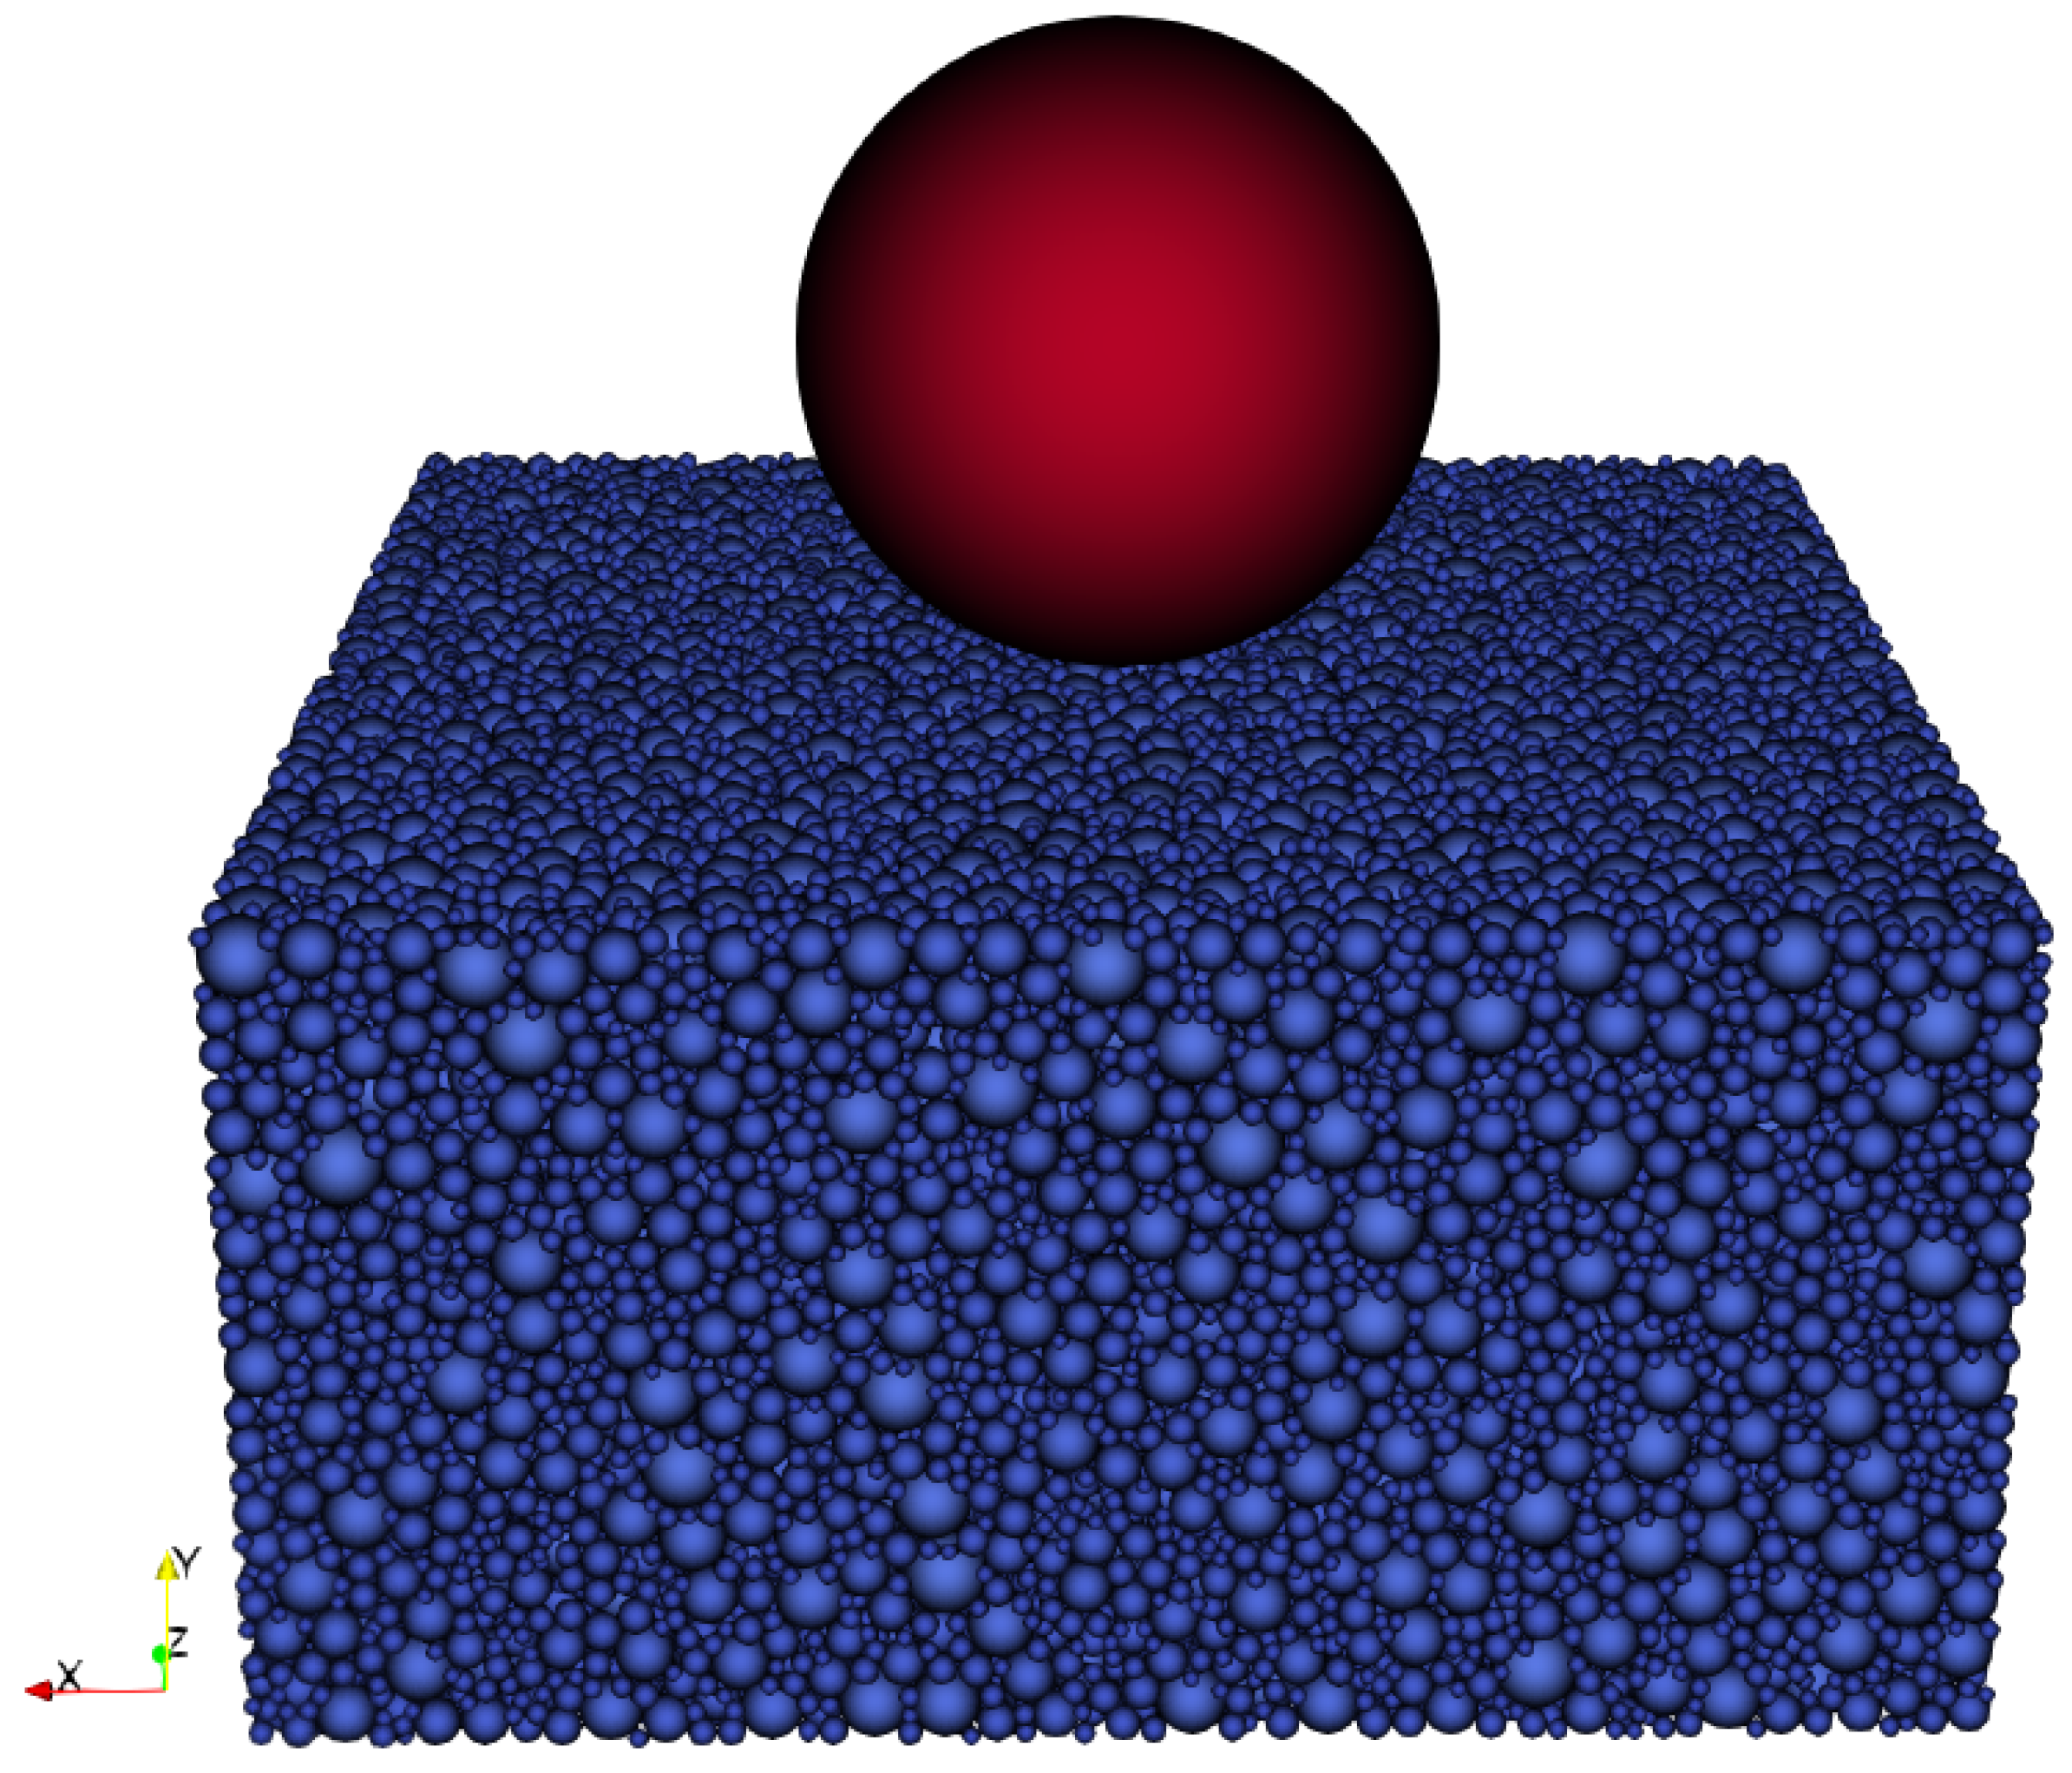
The numerical study investigates the interaction between a button bit and rock when the bit impacts the rock with an initial velocity  v 0 . The schematic representation of the numerical simulation is presented in Figure 2. The study considers several spherical button bits with radii  r b  ranging from  1 mm  to  15 mm . Additionally, to account for the indentation process occurring at speeds up to  10 m / s  [33], various initial velocities of the bit, denoted as  v 0 , are considered, ranging from  1 m / s  to  15 m / s .
The rock numerical sample has a square base of  50 × 50 mm 2  and a height of  25 mm . Rigid walls are implemented as boundary conditions to restrict the movement of the rock, which is a common approach in modeling rock behavior. Similar sample sizes have been used in previous studies to simulate rocks [34]. The numerical specimen consists of 85,350 spheres with radii ranging from  0.25 mm  to  1.25 mm  randomly arranged within the volume. The particles are bonded together using the bonded particle model (BPM) with a threshold distance of  1 × 10 5 mm , and the packing has a porosity of  0.3078 .
The rock is granodiorite with macroscopic properties of density  ρ = 2600 kg / m 3 Y = 60 GPa , and  ν = 0.22 . The calibration procedure has been previously reported in [35]. The microparameters of the rock were calibrated using the response surface methodology and are presented in Table 1. The calibration methodology considers the stress wave propagation and the stress wave velocity corresponding to granodiorite. During the calibration process, the influence of the rock sample size was investigated; we specifically examined the impact of stress wave reflection at the boundaries on the bit–rock interaction. Remarkably, it was determined that the presence of stress wave reflection did not interfere with the observed bit–rock interaction. Moreover, the calibration procedure was validated by comparing it to a finite element analysis. These findings, along with the detailed analysis, can be consulted in [35]. Furthermore, it is worth noting that the total mass and momentum of the drill bit are primarily concentrated in the spherical bit, which possesses a mass of  2.62 kg . This particular mass value accurately represents the overall mass of the drill bit employed throughout the calibration process. In drill bit analyses, the maximum penetration of the bit is, by standard, less than its radius, i.e., the present geometry of the drill represents drill bit conditions; meanwhile such conditions are verified.

4. Results and Discussion

4.1. Mechanical Energy Transferred to the Rock

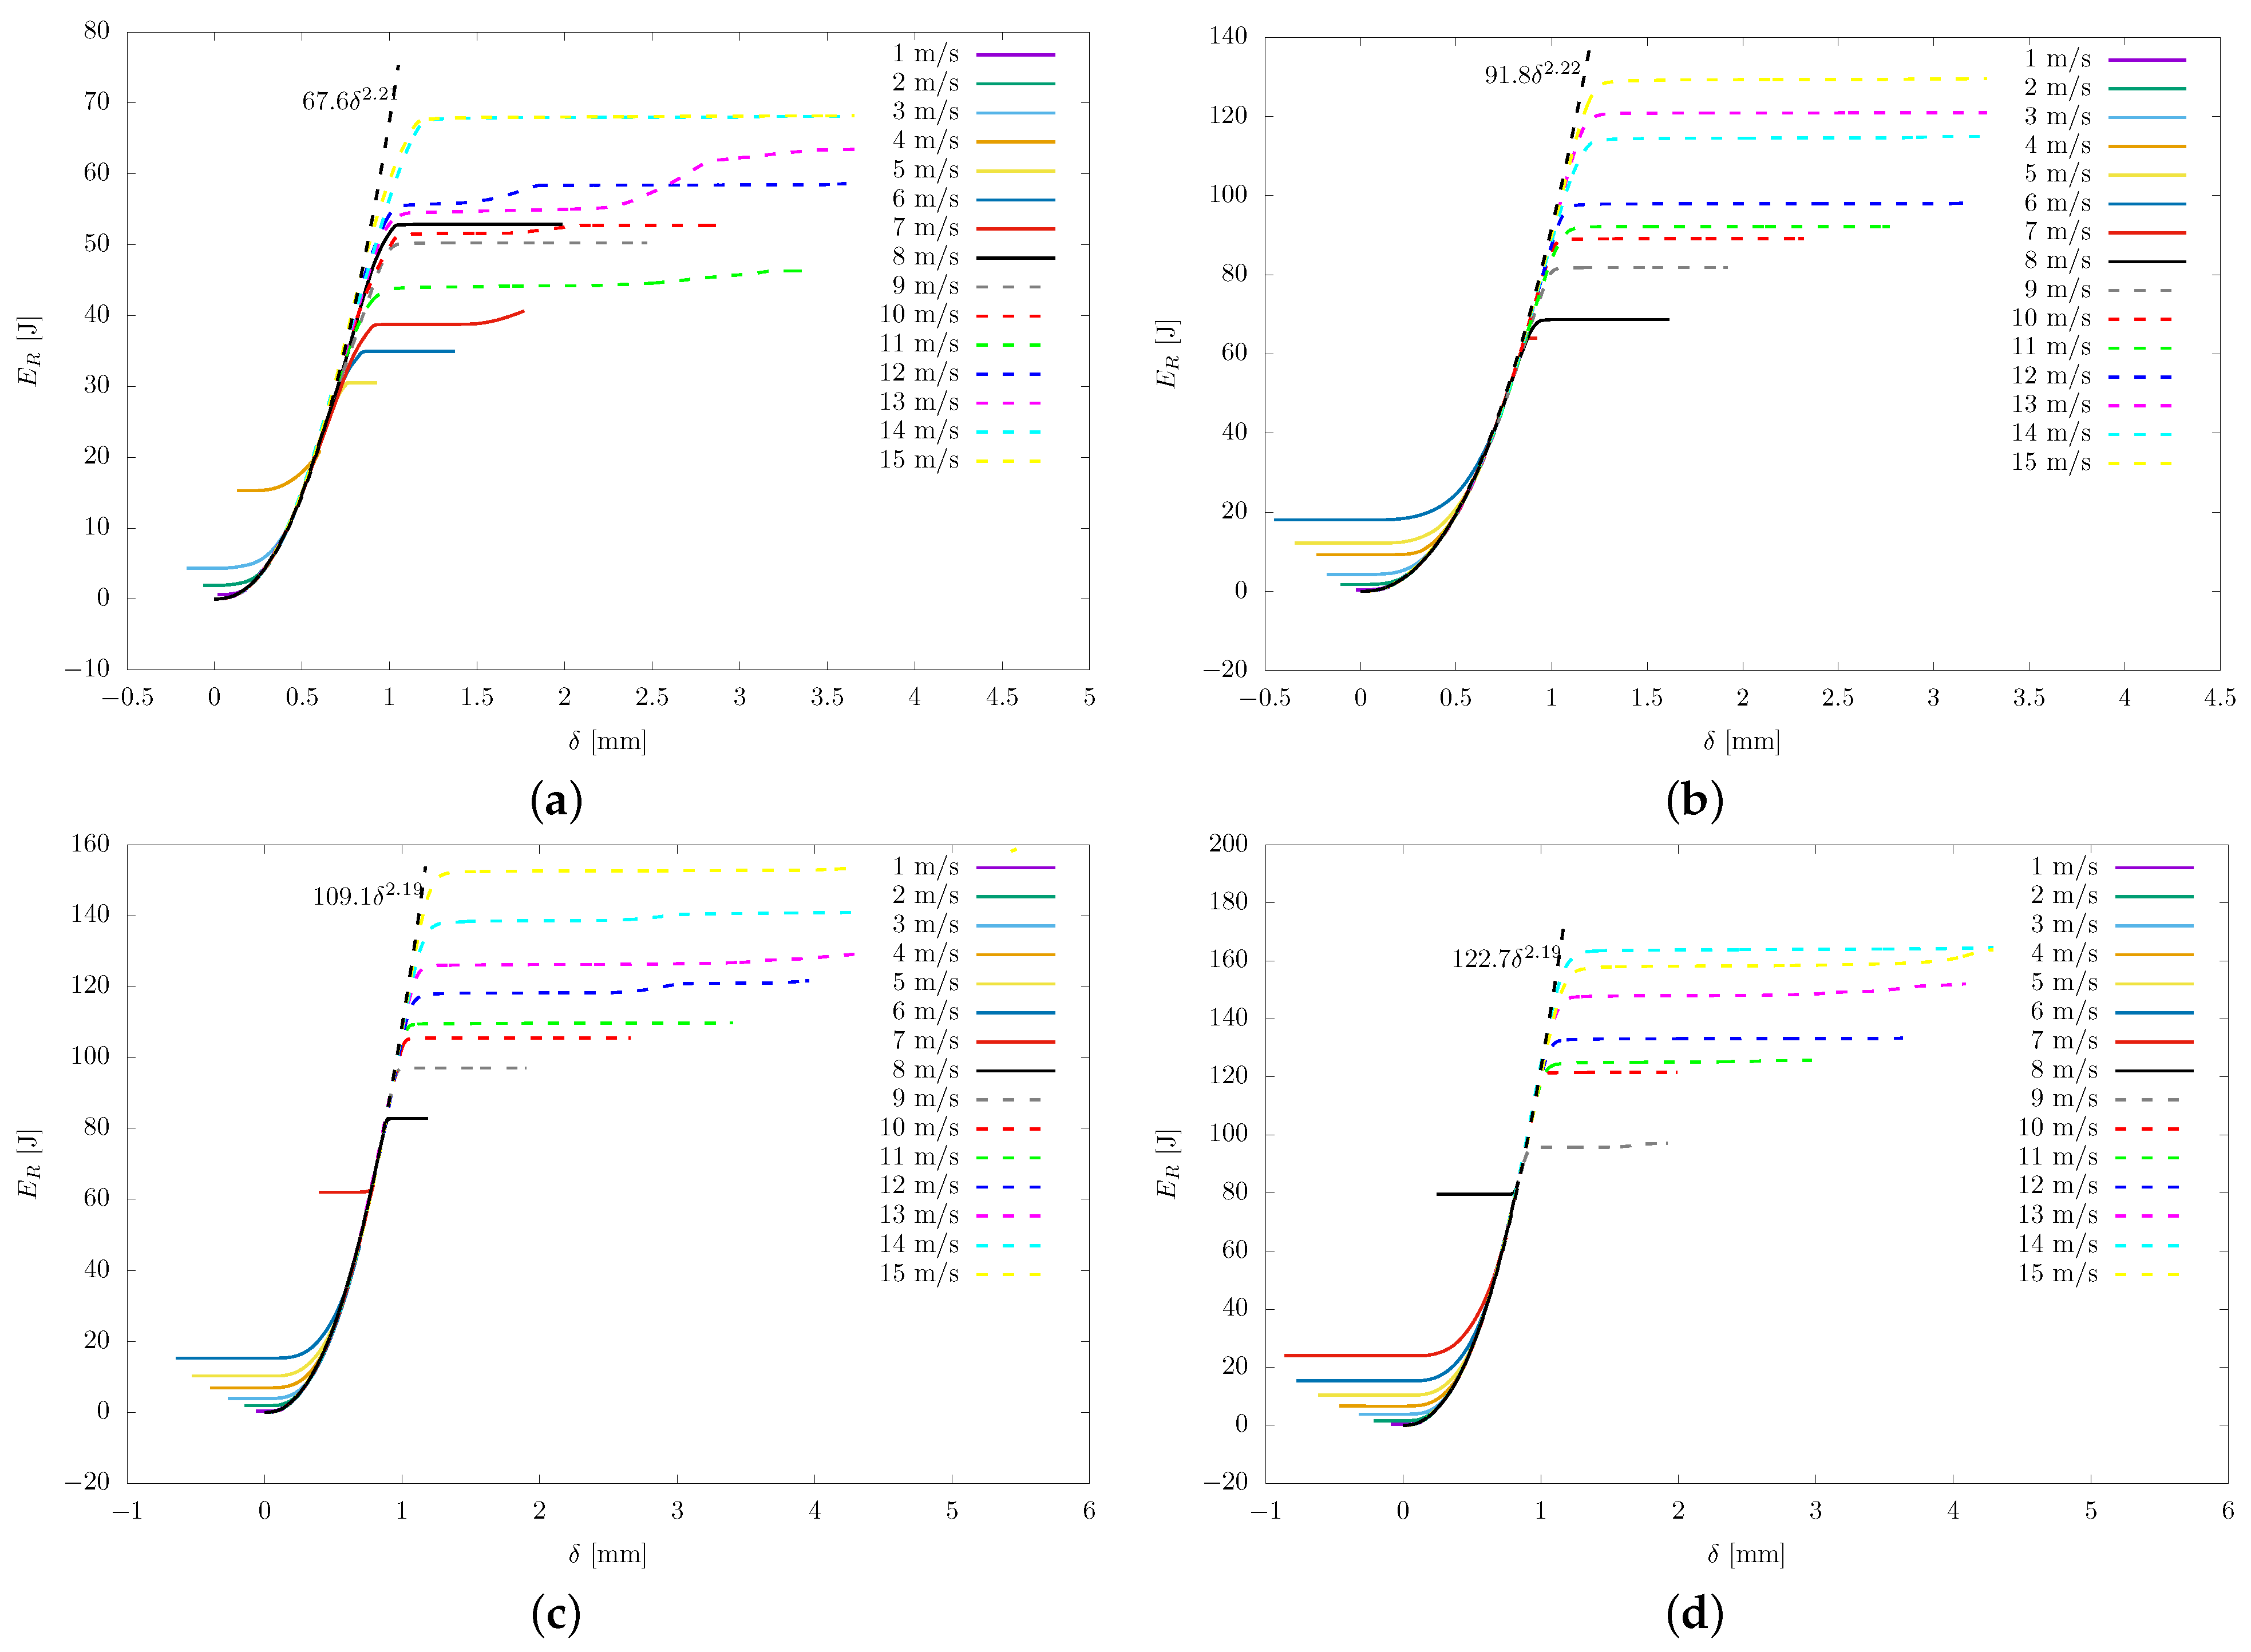
The energy transferred to the rock versus the penetration of the bit is studied and depicted in Figure 3. To compute the mechanical energy transferred to the rock, it is assumed to be equal to the difference between the initial energy of the bit and the instantaneous energy of the bit. Four distinct bit radii are used: 4 mm (shown in Figure 3a), 6 mm (shown in Figure 3b), 8 mm (shown in Figure 3c), and 10 mm (shown in Figure 3d). For each bit radius, 15 DEM simulations using different initial bit velocities are performed. For the four bits studied, a change in the curve behavior is observed within a certain range of initial bit velocities. Below these ranges, it is observed that the rock absorbs a certain amount of mechanical energy, but most of it is transferred back to the bit, resulting in the bit rebounding. Above these ranges, nonlinear behavior is observed until the energy transferred to the rock reaches its peak value and then remains constant. The specific velocity ranges for each bit size are as follows: between 4 m/s and 5 m/s for the 4 mm bit, between 6 m/s and 7 m/s for the 6 mm bit, between 7 m/s and 8 m/s for the 8 mm bit, and between 8 m/s and 9 m/s for the 10 mm bit. The nonlinear behavior can be modeled as follows:
E R = k E δ n E
The regression parameters  k E  and  n E  are computed using the least-squares method. The regression results for 15 different bit radii ranging from 1 mm to 15 mm are depicted in Figure 4. Figure 4a shows the relationship between the parameter  k E  and the bit radius. It is evident that  k E  varies for each bit radius, indicating its dependence on the bit radius. Additionally,  k E  exhibits a monotonically increasing behavior that is quasi-linear as the bit radius increases. In Figure 4b, the relationship between the parameter  n E  and the bit radius is presented. It can be observed that  n E  stabilizes near 2.2 for bit radii larger than 4 mm, suggesting a quasi-quadratic behavior. Finally, Figure 4c displays the coefficient of determination as a function of the bit radius. The coefficient of determination exhibits monotonically increasing behavior with an asymptote equal to one. This indicates that the regression model explains 99.62% of the data in the worst-case scenario and improves as the bit radius increases. In summary, the analysis of various impact velocities and bit radii reveals consistent quasi-quadratic behavior of the energy transferred to the rock ( E R ) during the bit penetration process. This observation indicates a nonlinear relationship between  E R  and bit penetration. Specifically, the energy transfer can be described by a power function, where the coefficient is found to be dependent on the bit radius while the exponent remains constant at approximately  2.2 . These findings indicate a discernible pattern in the energy transfer efficiency between the bit and the rock, which aligns with the principles of Hertzian contact theory. According to this theory, the potential energy stored in the elastic deformation of the rock, acting as an elastic halfspace, follows a power–law relationship with penetration. Specifically, the exponent governing this relationship is  2.5 .
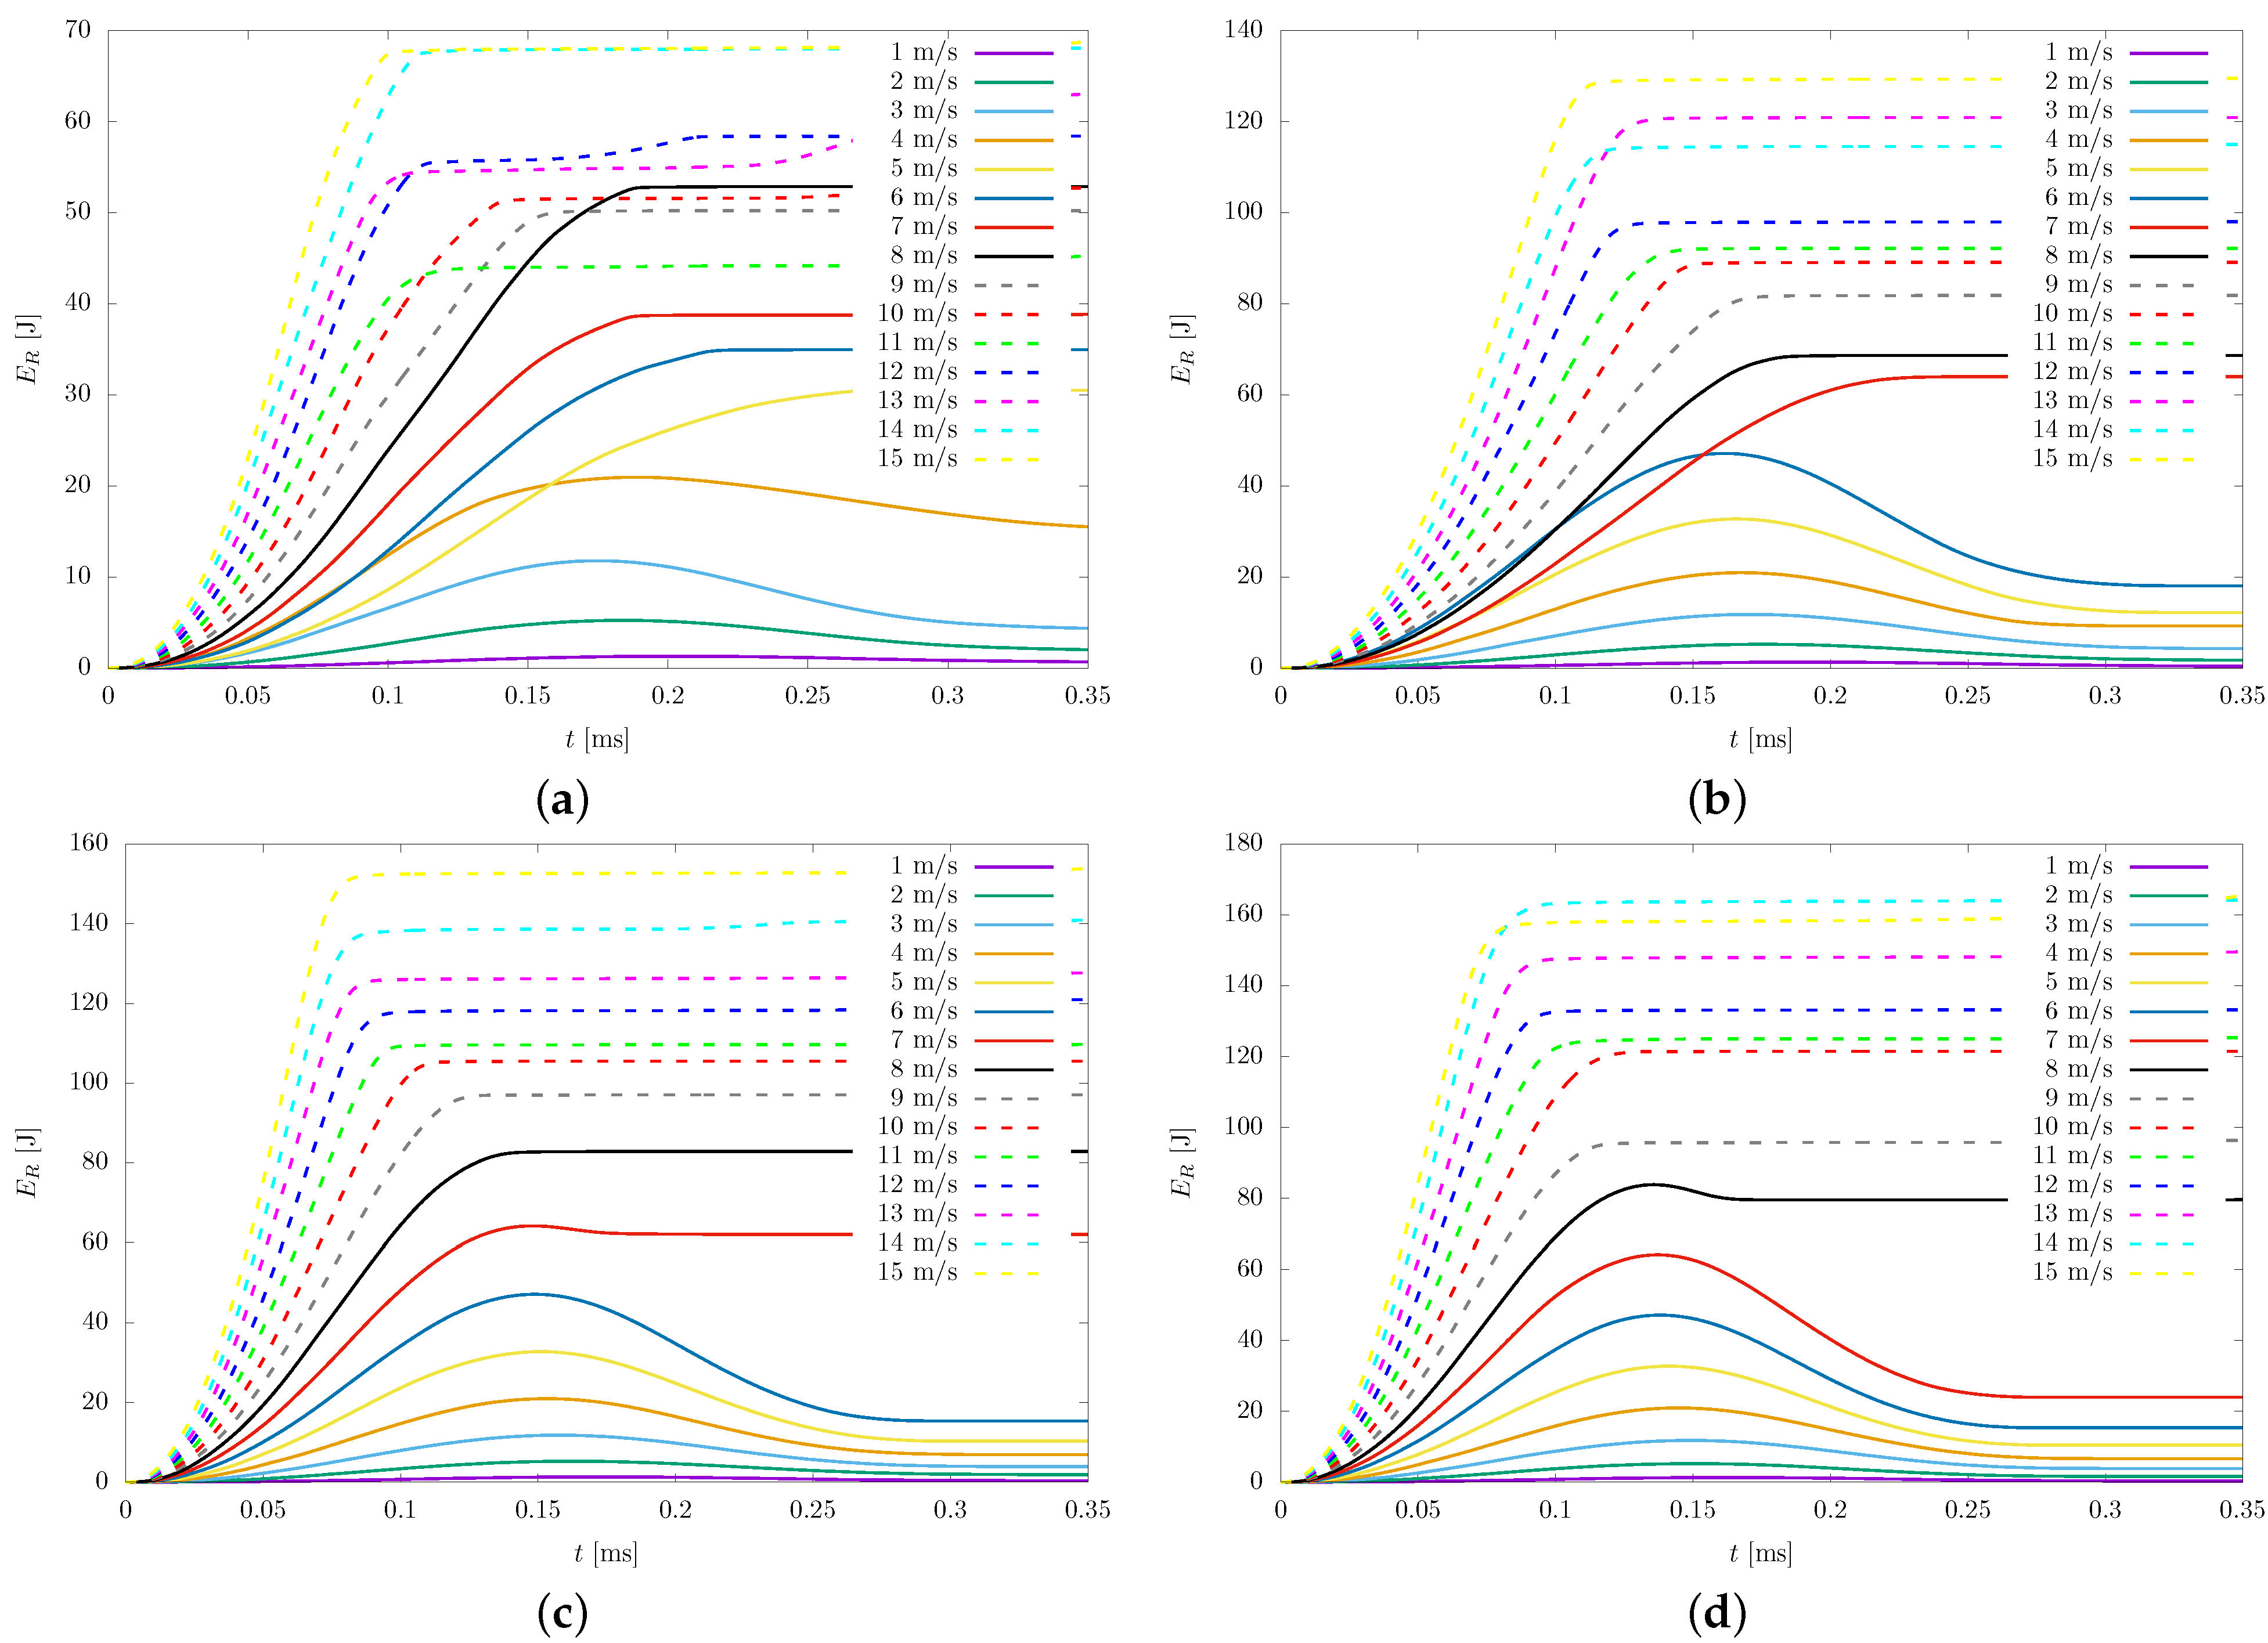
The time history of the mechanical energy transferred to the rock is depicted in Figure 5. Four different bit radii are employed, and several velocities ranging from 1 m/s to 15 m/s are considered. It can be observed that for impact velocities below 5 m/s, 7 m/s, 8 m/s, and 9 m/s, for the 4 mm, 6 mm, 8 mm, and 10 mm bit radii, respectively, the mechanical energy transferred from the bit to the rock increases until it reaches a maximum value and then decreases to a lower stabilization value, indicating elastic recovery. On the other hand, for impact velocities equal to or higher than 5 m/s, 7 m/s, 8 m/s, and 9 m/s, for the 4 mm, 6 mm, 8 mm, and 10 mm bit radii, respectively, the mechanical energy transferred to the rock increases until it reaches its peak value and remains fairly constant for the remainder of the simulation.
The efficiency as a function of the impact velocity of the bit in the rock is studied. Efficiency is defined as the ratio of the desired output to the required input. In this case, the desired output is the mechanical energy transferred to the rock, denoted as  E R , and the required input is the initial mechanical energy of the bit, denoted as  E b . Thus, the efficiency can be expressed as follows:
η = desired output required input = E R E b
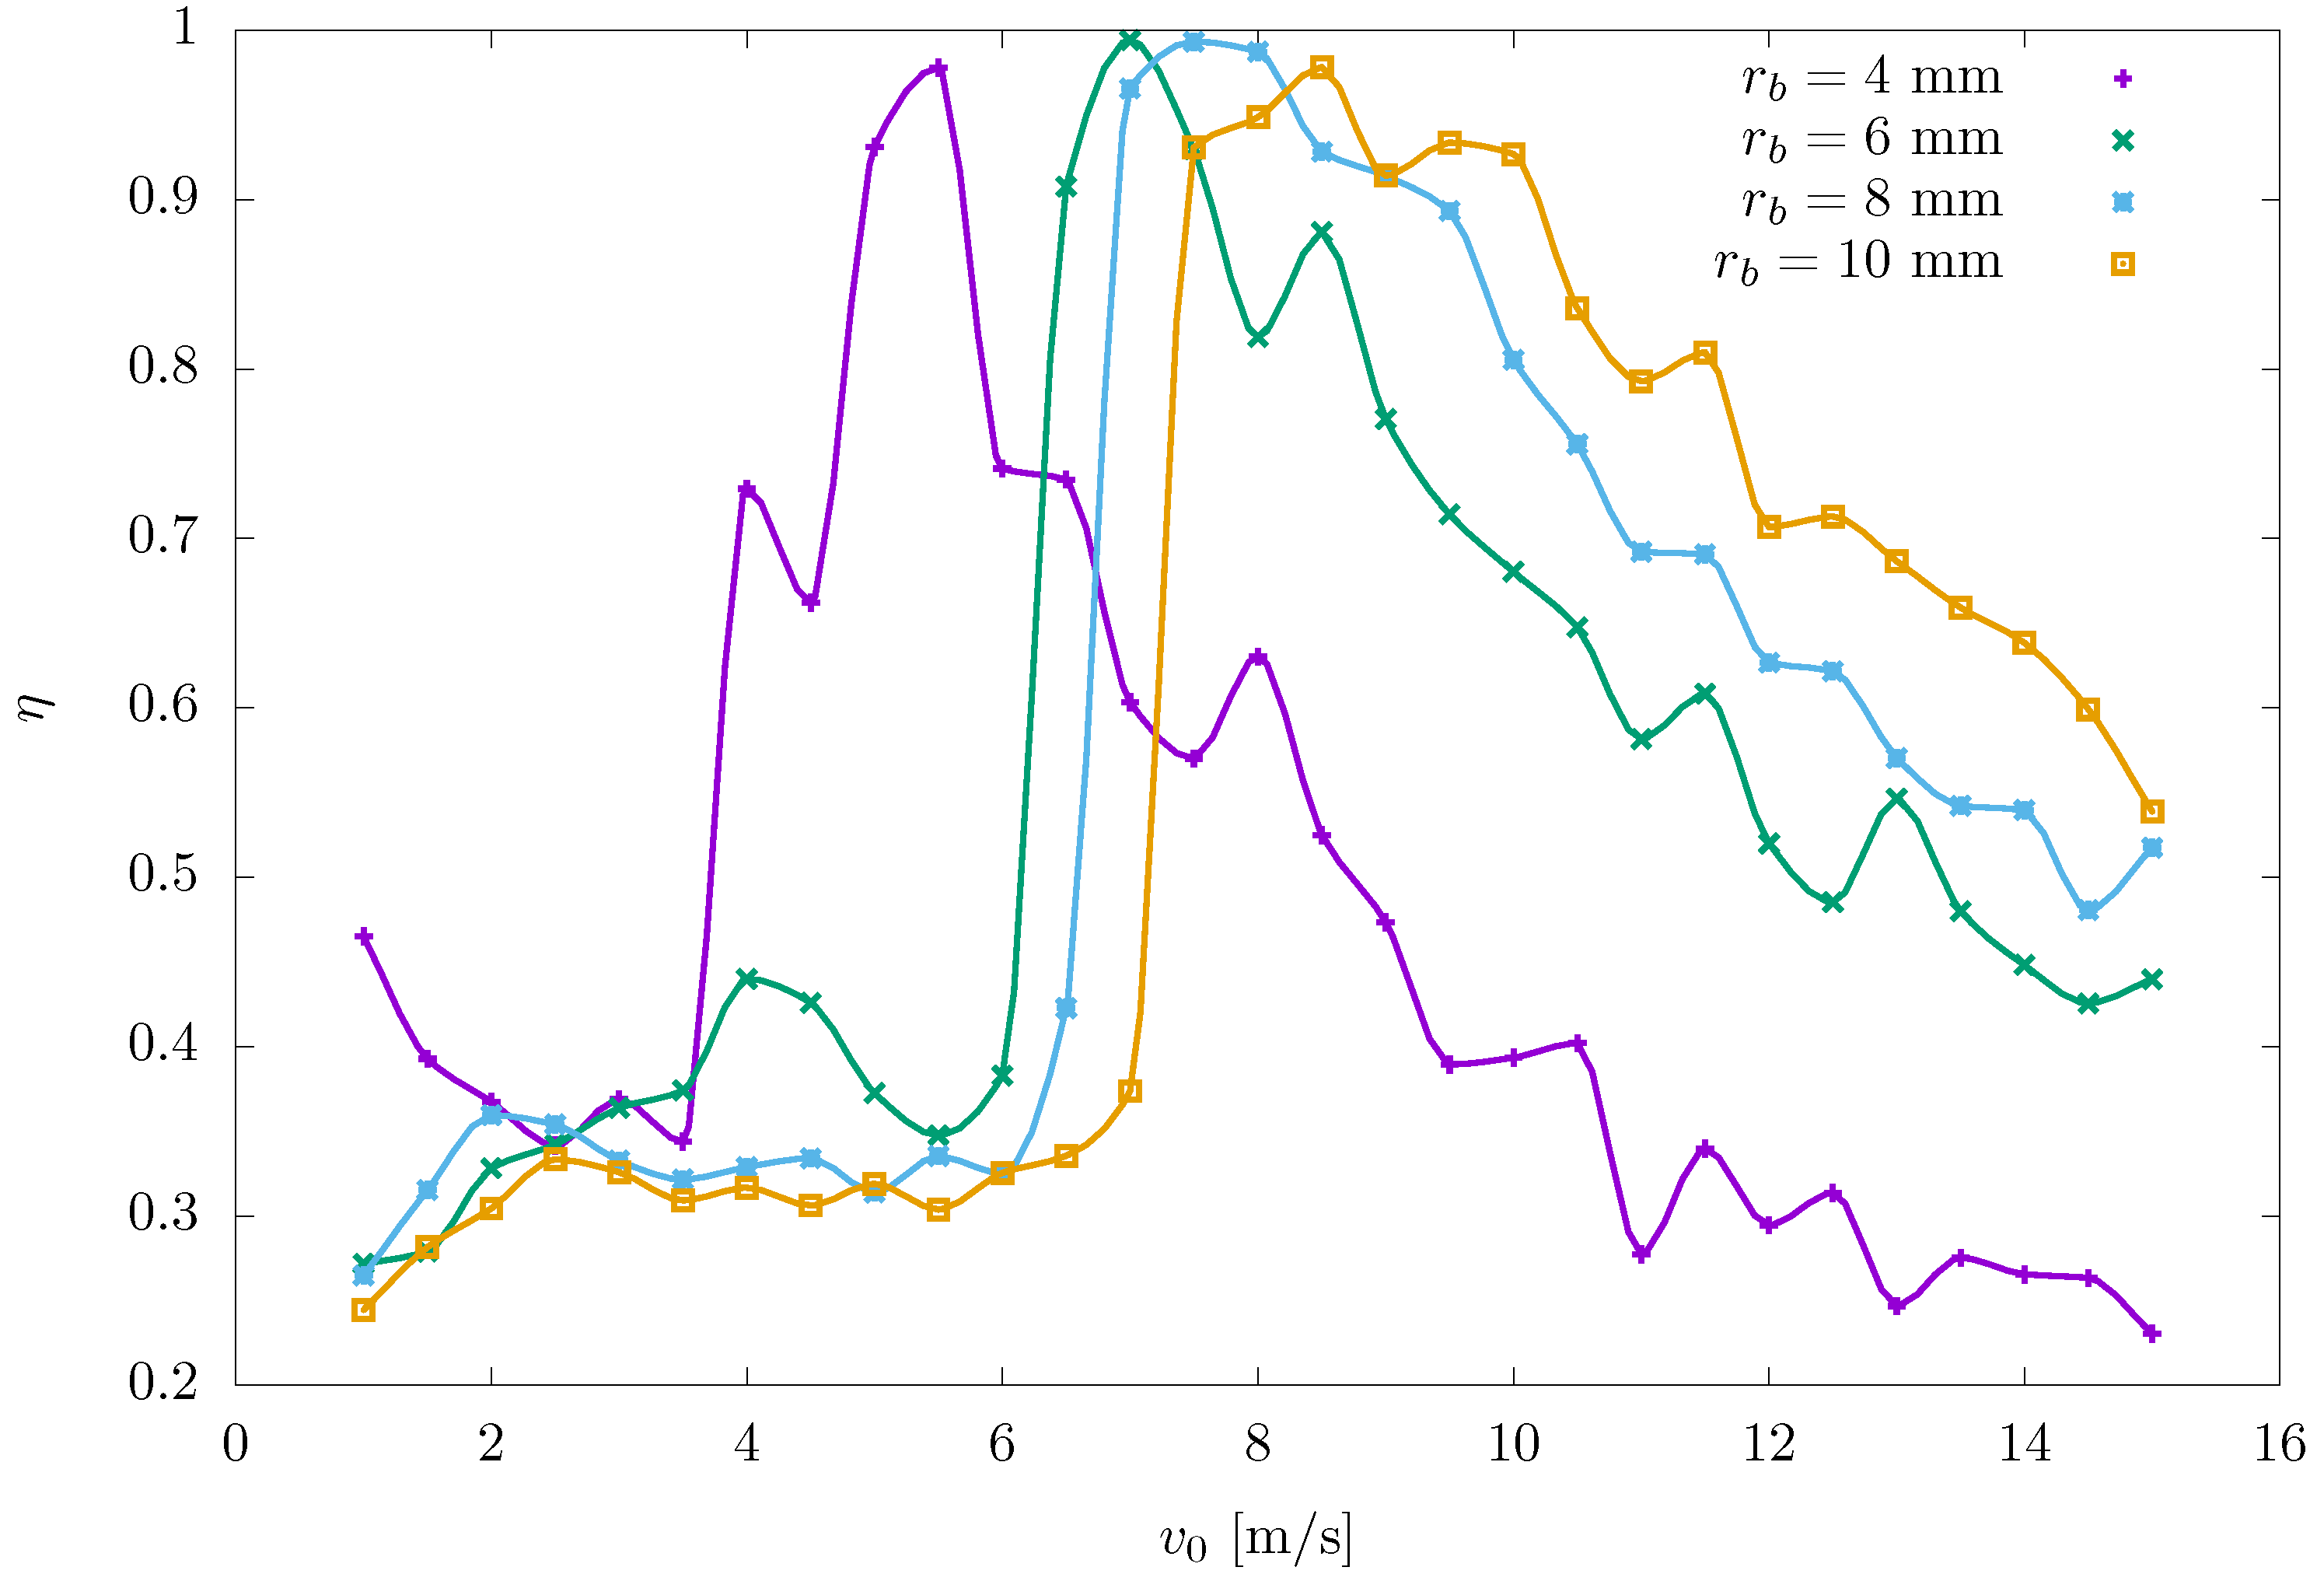
In Figure 6, the efficiency of the mechanical energy transfer as a function of the impact speed of the bit is depicted. It is observed that for lower speeds, the efficiency is below a certain threshold that is dependent on the radius of the bit. The reason could be the predominance of the elastic behavior of the rock at low impact speeds, because as elastic rock behavior prevails, most of the energy transferred from the bit to the rock returns to the bit, leaving the rock without significant damage. As the impact velocity of the bit increases and reaches a certain value, it is observed that the efficiency increases suddenly to its peak value. This peak value occurs when the initial velocity of the bit is 5 m/s, 7 m/s, 7.5 m/s, and 8.5 m/s, for the 4 mm, 6 mm, 8 mm, and 10 mm bit radii, respectively. Above this velocity, a decreasing trend in efficiency is observed, indicating that a greater amount of energy is transferred from the bit to the rock while a larger portion remains within the bit, ultimately leading to decreased efficiency. This observation underscores the importance of determining the optimal impact velocity of the bit to minimize energy consumption. Furthermore, it appears that this optimal velocity is influenced by the radius of the bit, suggesting that the geometric characteristics of the bit play a significant role in determining the most effective impact velocity for energy efficiency. According to [33], Class I rocks such as granodiorite require a certain threshold force to be passed to increase the efficiency of the fragmentation process; using smaller forces leads to grinding and lesser efficiencies. Since the impact force is determined by the impact velocity of the bit, to increase the efficiency, a certain threshold impact velocity of the bit must be passed. Furthermore, rock indentation is a dynamic process, and the loading rate, i.e., the impact velocity, therefore contributes to the rock breaking process [36]. On the other hand, the efficiency of the mechanical energy transfer has been reported in previous works as a function not of the impact velocity of the bit but of the dimensionless duration of the wave [37,38,39,40].

4.2. Thrust Force

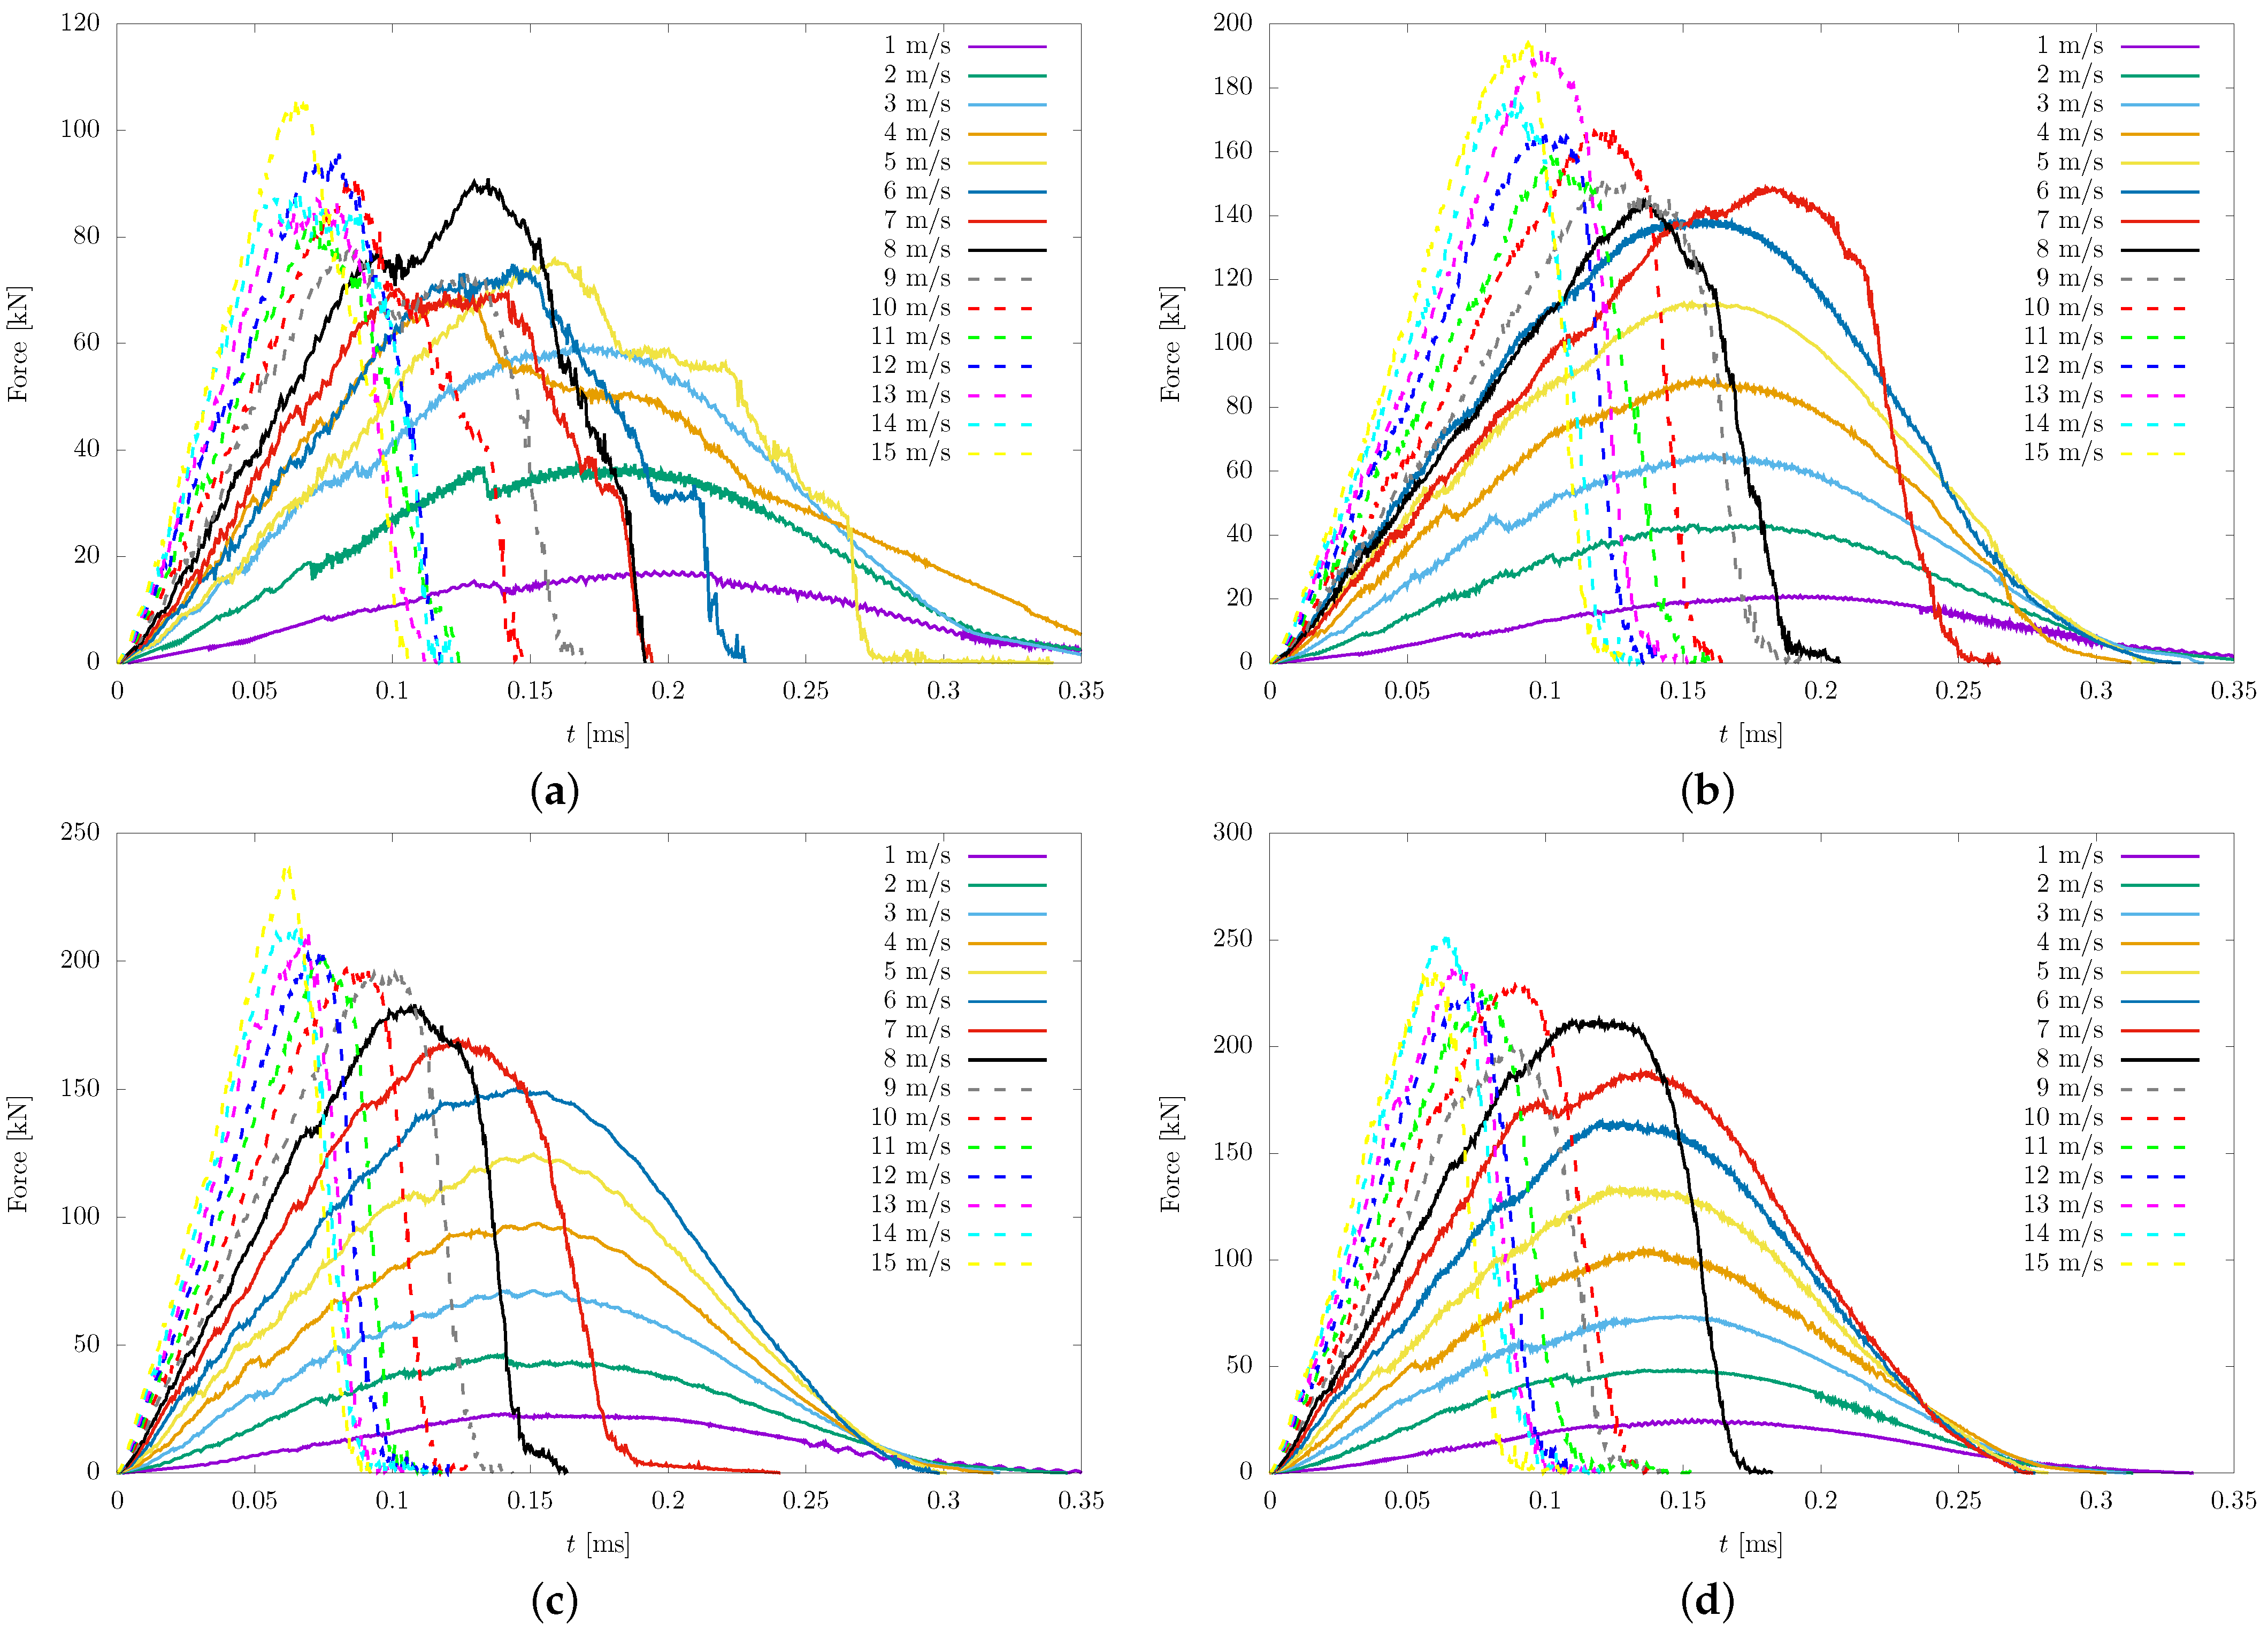
The plot of the thrust force versus time for several impact velocities and four different bit radii is shown in Figure 7. For all the impact velocities studied, monotonically increasing behavior is observed until reaching the peak force, after which the force decreases to its minimum. Similar behavior for the bit-force-versus-time curve has been reported in an experimental study using two-point strain measurement [11] and numerically using the impulse–momentum principle [41]. Additionally, for lower impact velocities, the peak force occurs at nearly the same time for all simulations within the same bit radius. As the impact velocity of the bit increases, the peak force occurs earlier, its maximum value increases, and the unloading slope becomes steeper. This observation is consistent with a previous report [16] where forces were found to be larger at higher impact velocities. It is also evident that for higher impact velocities, the curve exhibits smoother behavior when the bit radius is larger. The coarseness in the curve is due to the maximum radius of the particles within the numerical sample being fixed at 1.25 mm. As the radius of the bit decreases, the ratios of radii decrease, resulting in increased numerical noise. Moreover, for each curve, multiple peak points are observed, and the normal force shows small drops after these peak points, which is consistent with an experimental study [42].
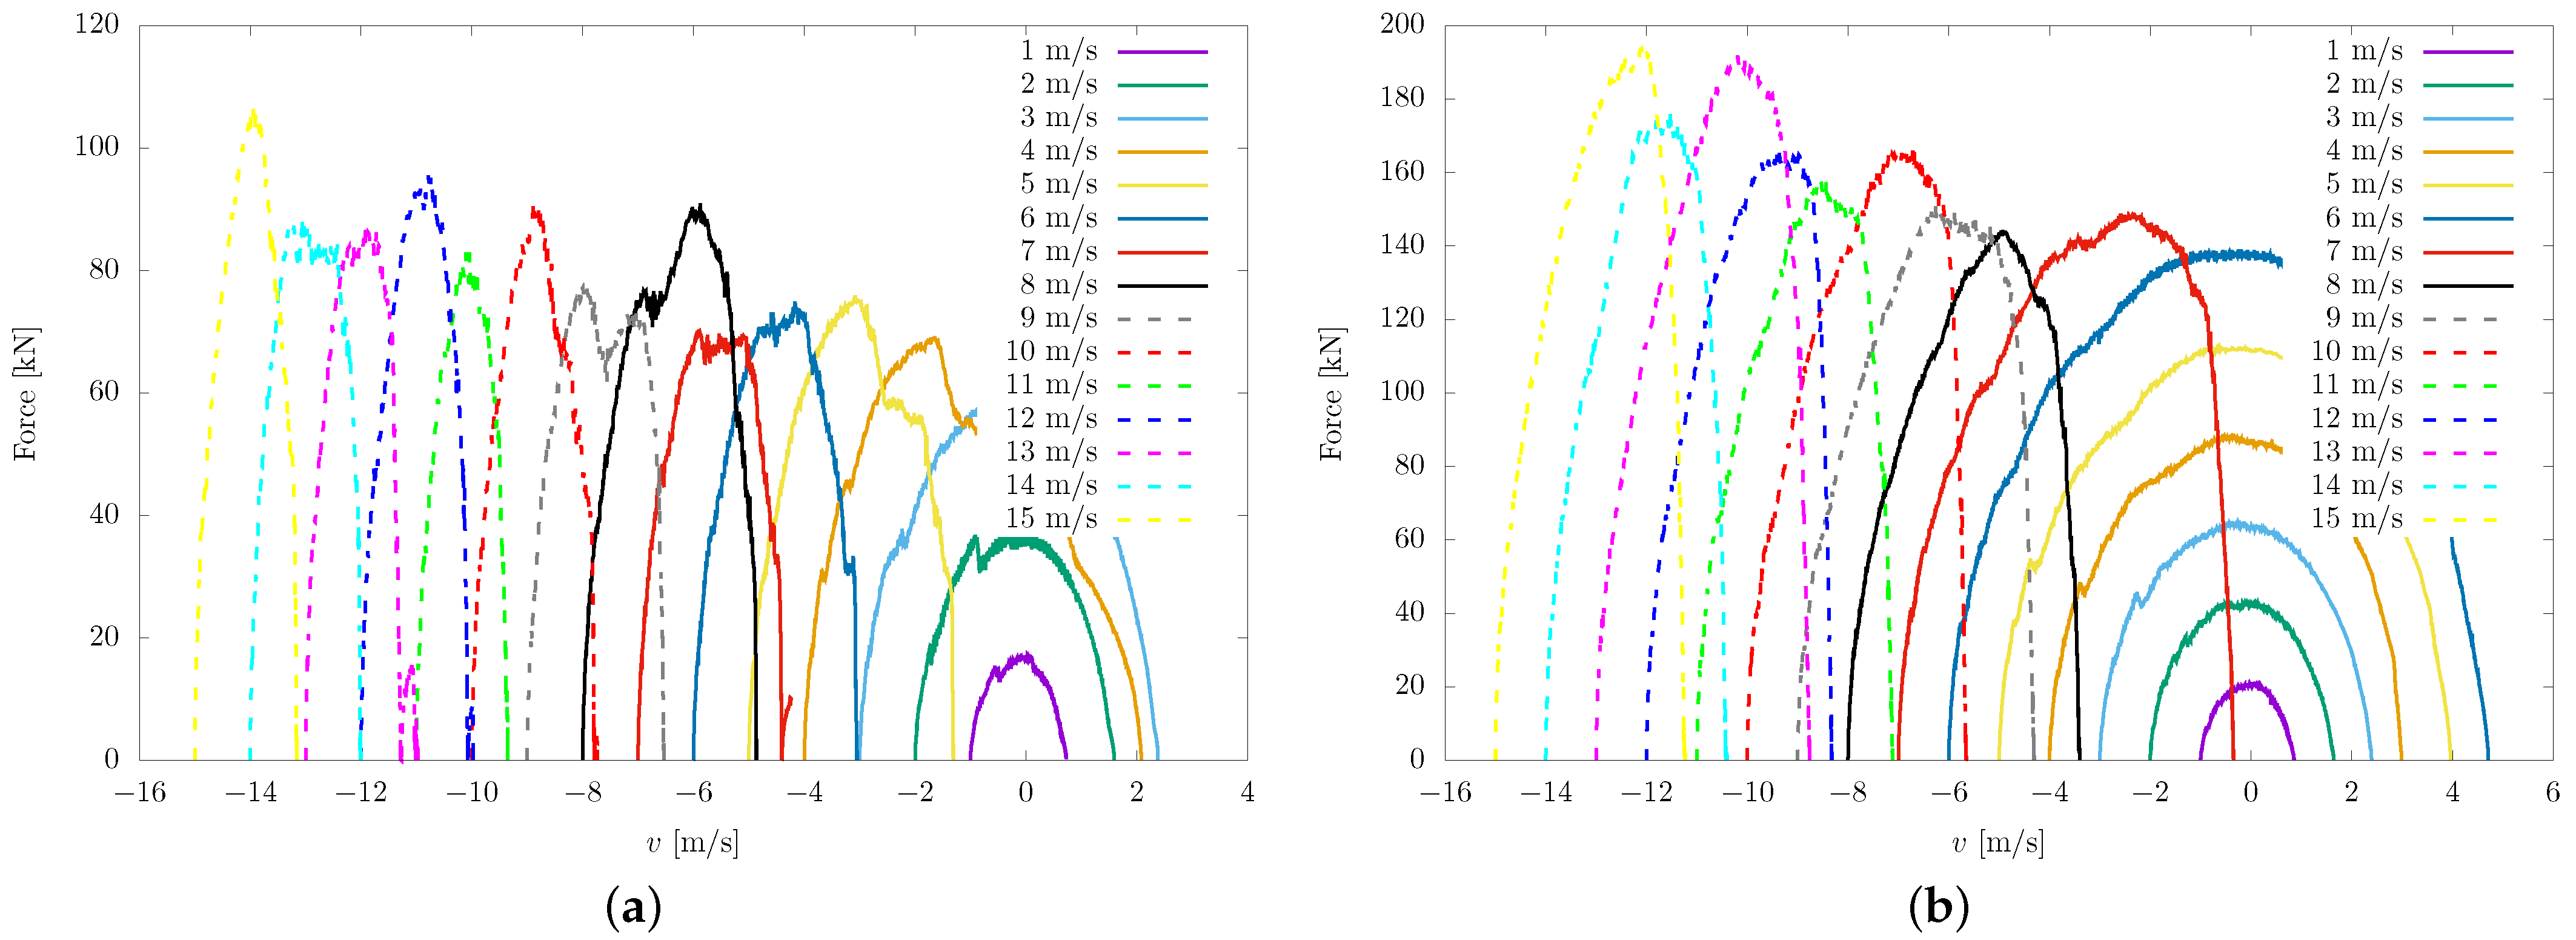
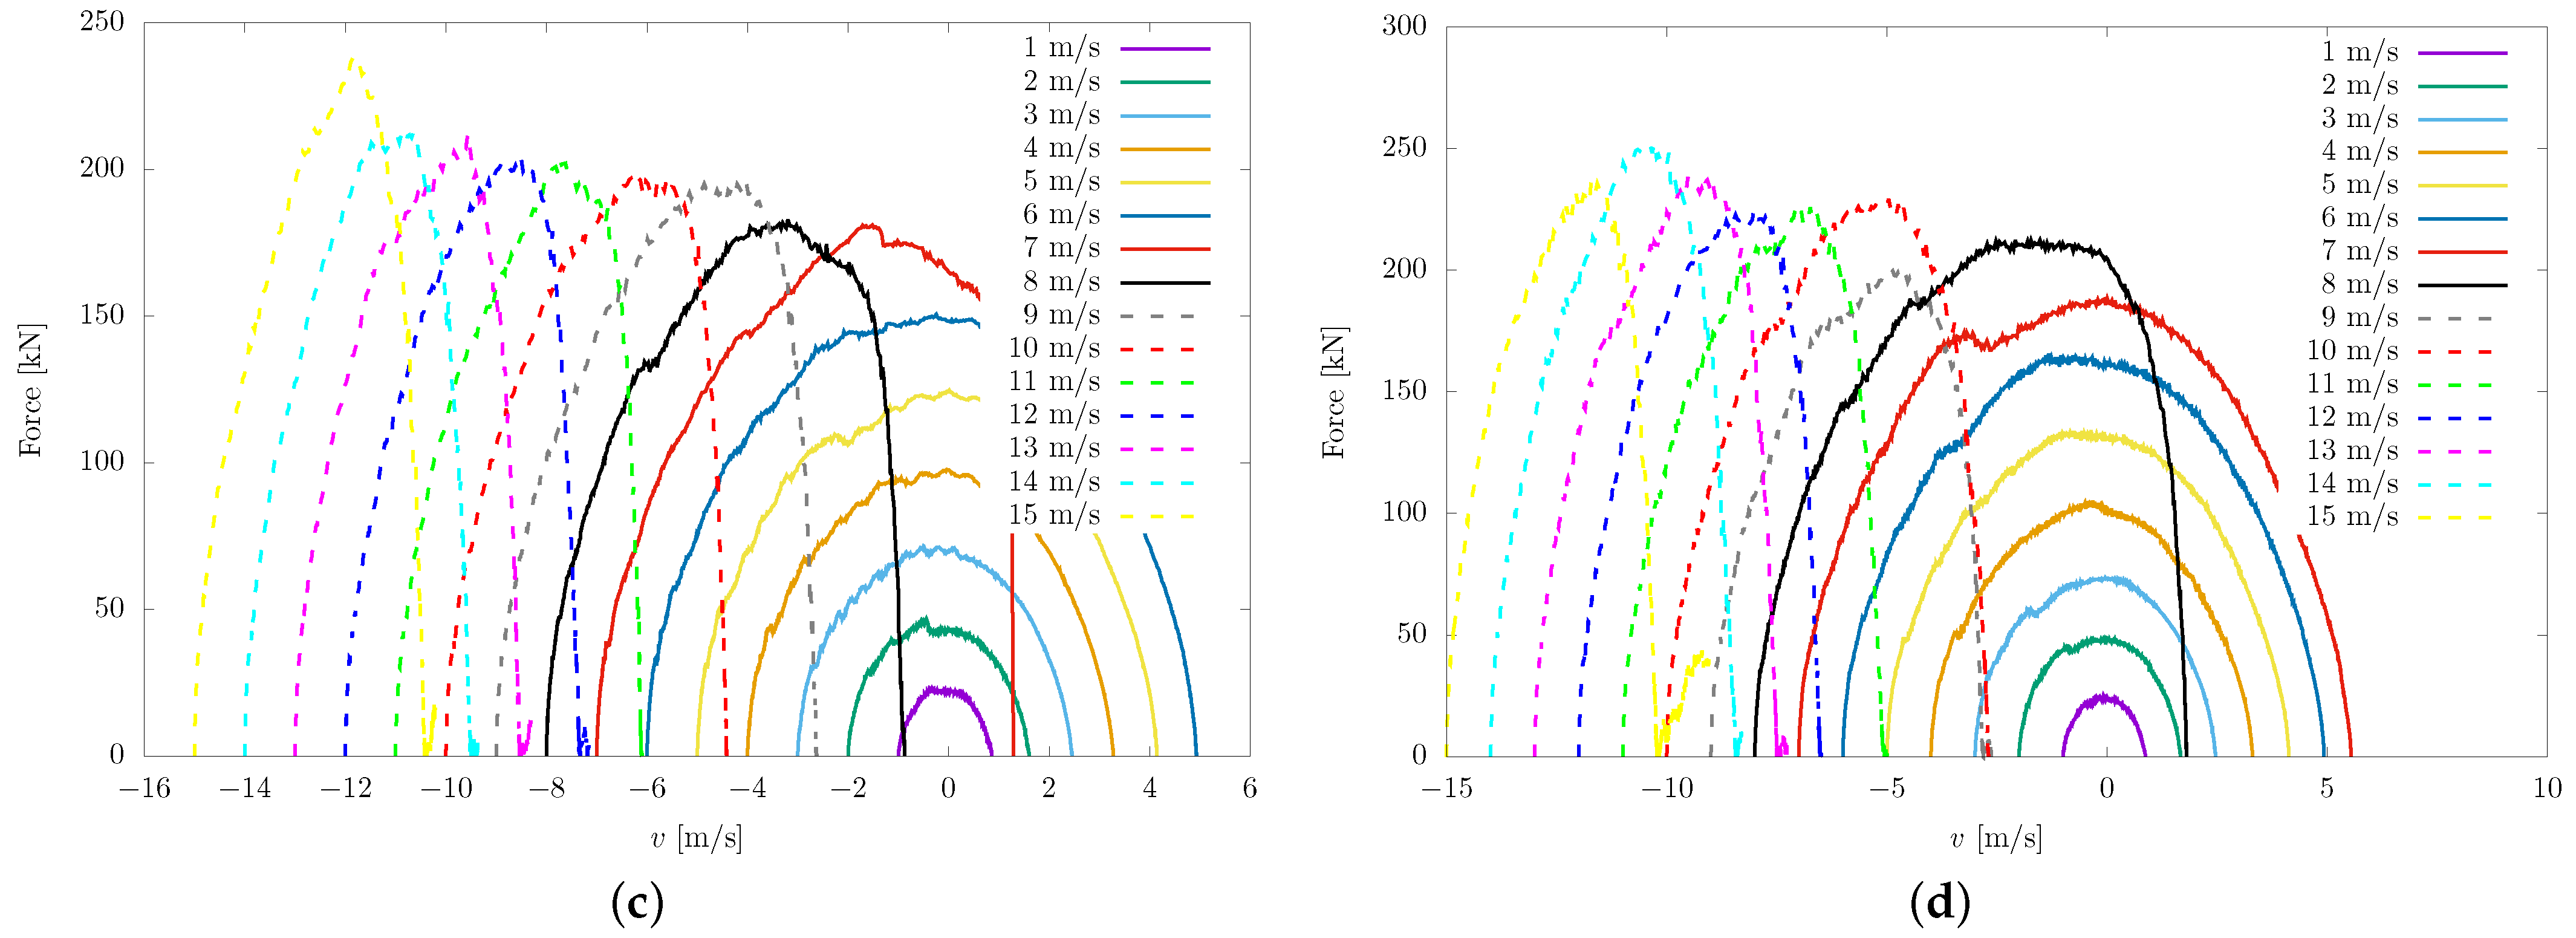
In Figure 8, the plot shows the relationship between thrust force and the instantaneous bit speed. Four different bits and several initial velocities of the bit are used. For lower impact velocities, the peak force occurs when the instantaneous speed of the bit is zero, indicating predominantly elastic behavior. However, even at low impact speeds, the final velocity of the bit is lower than its initial velocity, suggesting the dissipation of energy due to broken bonds and indicating that the phenomenon is not purely elastic. As the initial impact velocity of the bit increases, the graph shifts to the left and the peak force increases. On the other hand, for higher impact velocities, the final velocity of the bit is negative. In this case, the bit continues to penetrate throughout the simulation (0.35 ms) without rebounding, indicating that the rock’s elastic behavior is not predominant.

4.3. Force–Penetration Relationship

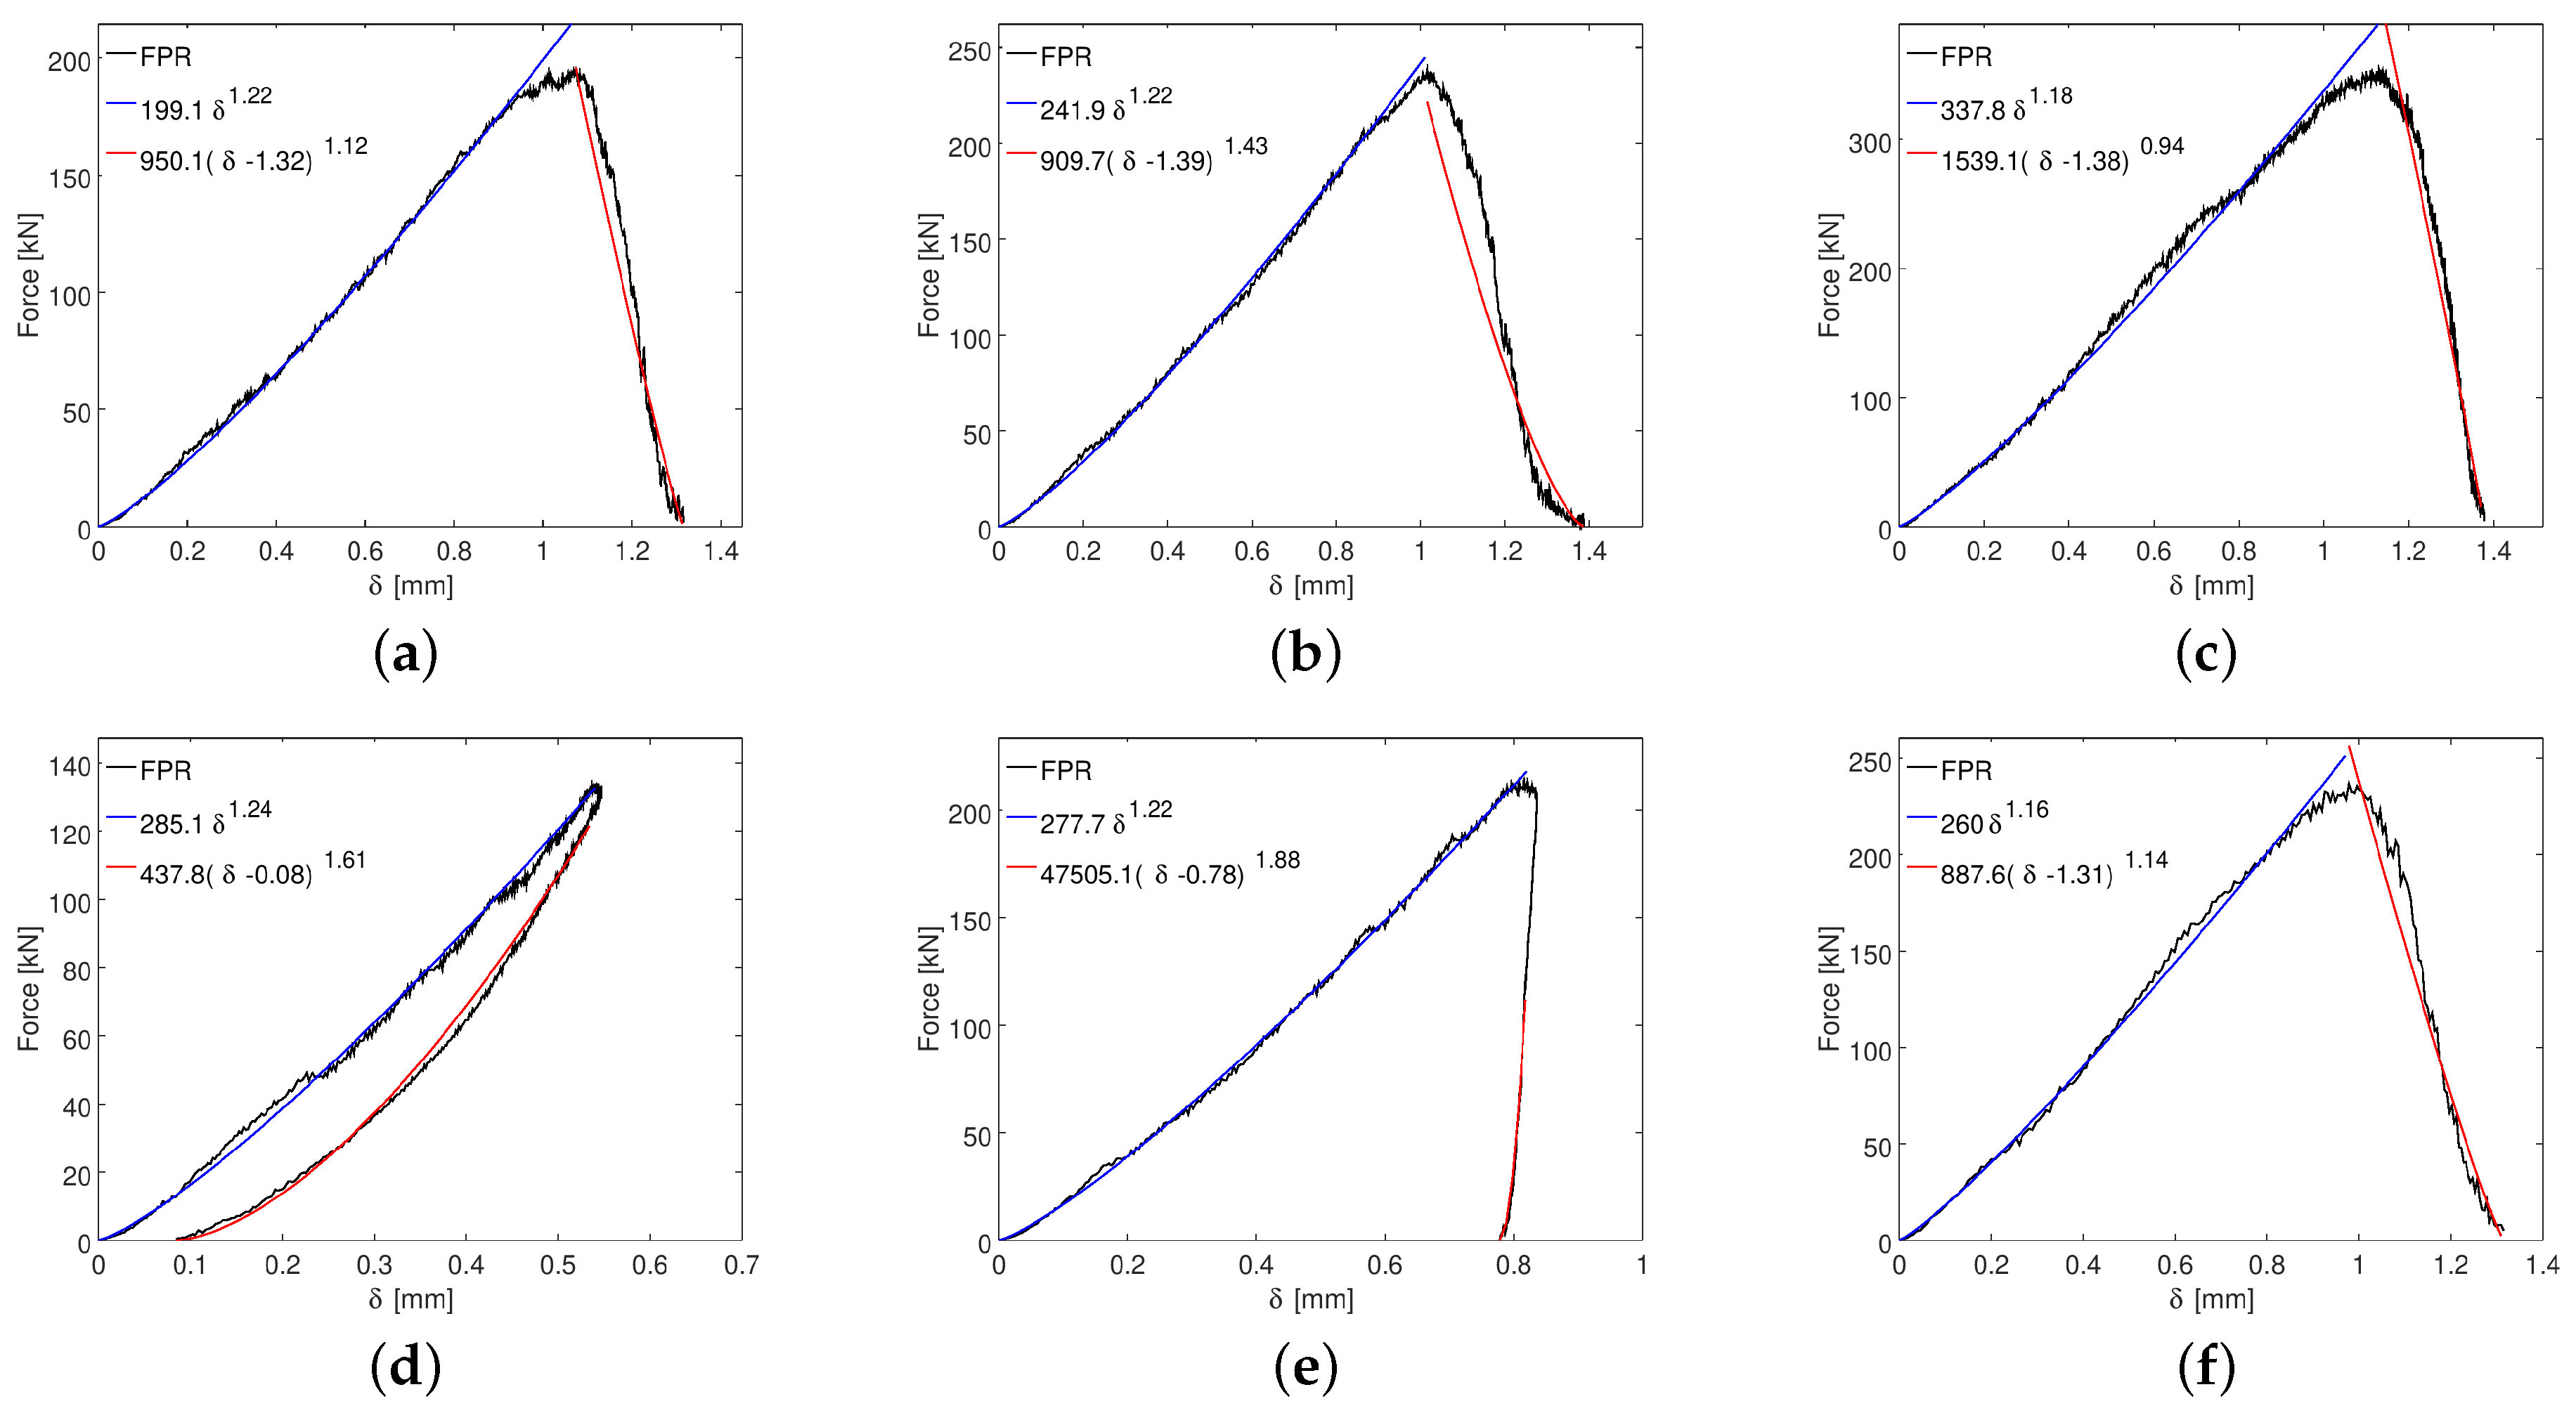
For the study of the force penetration relationship, two numerical experiments were carried out: one in which the bit impact velocity is kept fixed and the bit radius is allowed to vary from 1 mm to 15 mm (the velocity-fixed experiment), and the other in which the bit radius is kept fixed and the bit impact velocity is varied from 1 m/s to 15 m/s (the bit-radius-fixed experiment). In Figure 9, the force penetration relationship is presented for several impact velocities and bit radii. From this figure, it is observed that the force–penetration relationship consists of two phases: the loading phase and the unloading phase. In the loading phase, a nonlinearly increasing behavior in the force is observed as the penetration increases, regardless of the bit impact velocity or the bit radius. On the other hand, the unloading phase exhibits a decreasing nonlinear behavior that depends on the presence of elastic recovery. Thus, if there is elastic recovery, the penetration decreases as the force decreases, and if there is no elastic recovery, the penetration increases as the force decreases.
For each simulation performed, the force during the loading process  F l  and the force during the unloading process  F u  are obtained as a power function of the bit penetration:
F l = k l δ n l
F u = k u δ P f n u
where  P f  is the penetration of the bit when the force decreases to zero. The regression coefficients  k l n l k u , and  n u , as well as the coefficients of determination  R l 2  and  R u 2 , are obtained using the least-squares method.
For the velocity-fixed experiment, the impact velocity is kept fixed at three values while varying the bit radius. The regression coefficients and coefficients of determination are plotted as a function of the bit radius in Figure 10 and Figure 11 for the loading and unloading phases, respectively.
For the bit-radius-fixed experiment, the regression coefficients and coefficients of determination are plotted as a function of the impact velocity in Figure 12 and Figure 13 for the loading and unloading phases, respectively.
In Figure 10a, the numerical coefficient  k l  is plotted against the bit radius for three different initial velocities of the bit. It is observed that this coefficient monotonically increases as the bit radius increases, exhibits quasi-linear behavior for  r b 4 mm , and appears to be independent of the impact velocity within the range depicted in this figure. Furthermore, in Figure 12a, the numerical coefficient  k l  versus  v 0  is shown for four different bit radii. It is demonstrated that for impact velocities of the bit greater than 4 m/s,  k l  remains constant and depends solely on the bit radius.
In Figure 10b, the exponent  n l  versus the bit radius is depicted. It falls within the threshold ranging between 1.2 and 1.3, and it appears to be smaller for higher impact velocities. Additionally, it remains constant for bit radii larger than 4 mm. Furthermore, Figure 12b shows  n l  plotted against the impact velocity for four different bit radii. It is observed that for bit radii of 6 mm, 8 mm, and 10 mm, the curves are very similar and monotonically decrease as the impact velocity of the bit increases. Moreover, as the impact velocity of the bit decreases, the exponent  n l  tends to 1.5. This finding aligns with Hertz’s elastic theory, regardless of whether a linear Hooke contact model is implemented in the discrete element method, as presented in Equation (3). However, the curve for the 4 mm bit radius deviates from this behavior. Further analysis of the coefficient of determination  R l 2  will provide insight into possible reasons for this deviation.
On the other hand, the numerical results can be validated by comparing them to similar results found in previous reports where experimental and other numerical techniques were used. For instance, a power function force–penetration relation for horizontal cutters was found empirically and the exponent value was approximately 1.35 in [43]. The authors of [44] found quadratic polynomial functions with  R 2  values exceeding 0.95 throughout the entire penetration process using the finite element method. Moreover, in [3], the FPR was modeled using a power function, and the authors obtained  k l = 130  and  n l = 1.7  with  r b = 5.5  mm. For a conic bit, a quadratic FPR was reported in [9]. Furthermore, [45] found a power–law relationship for the FPR, with the exponent depending on the bit geometry, and it is reported and simplified as linear based on theoretical studies.
In Figure 10c, the coefficient of determination  R l 2  is plotted against the bit radius. It is evident that for bit radii smaller than 4 mm, the coefficient of determination decreases rapidly, which may account for the observed deviation in behavior with the 4 mm bit radius. Since the bit radius should be larger than the largest particle radius in the numerical sample, which is 1.25 mm, this suggests that the radius of the largest particle representing the rock should be at most one-quarter of the bit radius. Furthermore, Figure 12c illustrates the coefficient of determination as a function of the impact velocity of the bit. It can be observed that it explains 98% of the data in the worst condition, namely, when using a 4 mm bit radius with an impact velocity of 1 m/s.
In Figure 11a, the numerical coefficient  k u  for the unloading phase is depicted as a function of the bit radius. While its behavior is less monotonic than the numerical coefficient for the loading phase, it can be observed that  k u  increases as the bit radius increases. On the other hand, Figure 13a shows the numerical coefficient  k u  as a function of  v 0  for different bit radii. It is observed that  k u  generally decreases as  v 0  increases. However, a significant change is observed at impact velocities of 7 m/s, 7 m/s, and 8 m/s for bit radii of 6 mm, 8 mm, and 10 mm, respectively. Additionally, random oscillations are observed, which can be attributed to the complex nature of the unloading phase. This phase involves multiple broken bonds between particles and interactions between debris and the bit, which may explain the observed oscillations. Furthermore, the behavior of the unloading phase varies depending on the presence of elastic recovery.
In Figure 11b, the exponent of the power function for the unloading phase, denoted as  n u , is shown as a function of the bit radius. Unlike  n l , which exhibits monotonic behavior with respect to the bit radius,  n u  does not follow a clear trend and appears to be influenced by the impact velocity of the bit. Figure 13b illustrates the relationship between  n u  and the impact velocity of the bit. It can be observed that the curves have a similar shape, and as the impact velocity ( v 0 ) increases, the value of  n u  decreases.
In Figure 11c and Figure 13c, the coefficient of determination  R u 2  is shown as a function of the bit radius and the impact velocity of the bit, respectively. It can be observed that  R u 2  falls within the range of 0.8 to 0.95. Notably, at lower impact velocities, there is a noticeable improvement in the coefficient of determination, with values ranging from 98% to 99% for explaining the data. This indicates that the regression model presented in Equation (14) provides a better fit for representing the unloading phase of the force–penetration relationship when elastic recovery is present, as demonstrated in Figure 9d.

5. Conclusions

The bit–rock interaction underwent extensive investigation via numerical simulations employing the discrete element method (DEM). Herein, the principal findings are succinctly outlined as follows:
  • The force–penetration relationship (FPR) was systematically investigated for multiple bit radii and impact velocities. Despite the implemented linear contact model, the obtained response in the FPR satisfactorily exhibits a consistent nonlinearity that coincides with the elastic Hertzian law, particularly at low velocities where elastic behavior is expected in the FPR.
  • Through analysis of the regression model obtained for the force–penetration relationship (FPR), we observed that during the loading phase, the coefficient  k l  shows a dependence on the bit radius while maintaining independence from the impact velocity. In contrast, the exponent  n l  demonstrates no dependency on the bit radius but exhibits dependence on the impact velocity. During the unloading phase, the coefficient  k u  was determined to be influenced by both the bit radius and the impact velocity, whereas the exponent  n u  is solely dependent on the impact velocity of the bit.
  • The behavior of the thrust force over time exhibited qualitative similarities to previously reported experimental and numerical studies, thus validating the current model. Furthermore, an investigation into the energy transferred to the rock revealed an elastic component that follows a power–law function with respect to penetration. The numerical coefficient  k E  of this relationship was observed to depend on the bit radius, while the exponent was found to be constant for different bit radii, with a value of  2.2 . This value deviates slightly from the expected value of  2.5  in the Hertzian contact model.
  • Exploring the efficiency of mechanical energy transfer as a function of the bit’s impact velocity was also conducted. A threshold velocity was identified, beyond which the efficiency exhibited a substantial increase. This finding underscores the importance of considering optimal impact velocities when designing tools for rock fragmentation, as this can significantly enhance the excavation process.
  • Additionally, we determined that in order to obtain accurate results when employing the discrete element method, the radius of the largest particle in the numerical sample should not exceed one-quarter of the bit’s radius. This finding serves as a valuable contribution for future researchers utilizing the discrete element method.

Author Contributions

Conceptualization, C.H.-V. and D.E.; methodology, C.H.-V. and D.E.; validation, C.H.-V. and D.E.; formal analysis, C.H.-V., D.E. and M.C.; investigation, C.H.-V.; resources, C.H.-V. and D.E.; writing—original draft preparation, C.H.-V.; writing—review and editing, D.E. and M.C.; supervision, D.E. All authors have read and agreed to the published version of the manuscript.

Funding

This research was funded by ANID Becas/Doctorado Nacional grant number 21190690.

Institutional Review Board Statement

Not applicable.

Informed Consent Statement

Not applicable.

Data Availability Statement

The original contributions presented in the study are included in the article; further inquiries can be directed to the corresponding author.

Conflicts of Interest

The authors declare no conflict of interest.

Nomenclature

r i particle position
r b radius of the bit
E R energy transferred to the rock
k E regression parameter of the energy of the rock as a function of the bit penetration,
the coefficient
n E regression parameter of the energy of the rock as a function of the bit penetration,
the exponent
R E 2 coefficient of determination for the regression of the energy of the rock as a function
of the bit penetration
E b energy of the bit
k l regression parameter of the loading force as a function of the bit penetration, the
coefficient
n l regression parameter of the loading force as a function of the bit penetration, the
exponent
F l loading force
R l 2 coefficient of determination for the regression of the loading force as a function of
the bit penetration
k u regression parameter of the unloading force as a function of the bit penetration, the
coefficient
n u regression parameter of the unloading force as a function of the bit penetration, the
exponent
F u unloading force
R u 2 coefficient of determination for the regression of the unloading force as a function
of the bit penetration
F i resultant force acting on particle i
m i mass of ith particle
I i inertia tensor of particle i
ω i angular velocity of the particle i
F n normal force
F t tangential force
Y p Young’s modulus of the particles
R ¯ mean radius of contact particles
ν p Poisson’s ratio
ζ elongation of tangential spring
t K time of the first contact
μ s coefficient of static friction
μ d coefficient of dynamic friction
μ coefficient of friction
δ bit penetration
v 0 initial velocity of the bit
η efficiency
v r t tangential relative velocity between particles
n normal unit vector
P f penetration of the bit when the force decreased to zero
YYoung’s modulus of the rock
ρ density of the rock
ν Poisson’s ratio of the rock

References

  1. Zhang, H.; Huang, G.; Song, H.; Kang, Y. Experimental investigation of deformation and failure mechanisms in rock under indentation by digital image correlation. Eng. Fract. Mech. 2012, 96, 667–675. [Google Scholar] [CrossRef]
  2. Saksala, T. Numerical modelling of bit-rock fracture mechanisms in percussive drilling with a continuum approach. Int. J. Numer. Anal. Methods Geomech. 2011, 35, 1483–1505. [Google Scholar] [CrossRef]
  3. Hashiba, K.; Fukui, K.; Liang, Y.; Koizumi, M.; Matsuda, T. Modeling of force-penetration curves for a button bit during impact penetration into rock. Int. J. Rock Mech. Min. Sci. 2017, 93, 210–214. [Google Scholar] [CrossRef]
  4. Poletto, F.; Miranda, F. Chapter 2 Principles of drilling. In Seismic While Drilling Fundamentals of Drill-Bit Seismic for Exploration—Handbook of Geophysical Exploration: Seismic Exploration; Pergamon: Oxford, UK, 2004; Volume 35, pp. 27–92. [Google Scholar] [CrossRef]
  5. Tang, S.; Li, J.; Ding, S.; Zhang, L. The influence of water-stress loading sequences on the creep behavior of granite. Bull. Eng. Geol. Environ. 2022, 81, 482. [Google Scholar] [CrossRef]
  6. Liang, X.; Tang, S.; Tang, C.; Hu, L.; Chen, F. Influence of Water on the Mechanical Properties and Failure Behaviors of Sandstone Under Triaxial Compression. Rock Mech. Rock Eng. 2023, 56, 1131–1162. [Google Scholar] [CrossRef]
  7. Miller, M.; Sikarskie, D. On the penetration of rock by three-dimensional indentors. Int. J. Rock Mech. Min. Sci. Geomech. Abstr. 1968, 5, 3–398. [Google Scholar] [CrossRef] [Green Version]
  8. Hustrulid, W.; Fairhurst, C. A theoretical and experimental study of the percussive drilling of rock Part II-force-penetration and specific energy determinations. Int. J. Rock Mech. Min. Sci. Geomech. Abstr. 1971, 8, 335–356. [Google Scholar] [CrossRef]
  9. Dutta, P. A theory of percussive drill bit penetration. Int. J. Rock Mech. Min. Sci. Geomech. Abstr. 1972, 9, 543–544. [Google Scholar] [CrossRef]
  10. Karlsson, L.; Lundberg, B.; Sundin, K. Experimental study of a percussive process for rock fragmentation. Int. J. Rock Mech. Min. Sci. Geomech. Abstr. 1989, 26, 45–50. [Google Scholar] [CrossRef]
  11. Hashiba, K.; Fukui, K.; Liang, Y.; Koizumi, M.; Matsuda, T. Force-penetration curves of a button bit generated during impact penetration into rock. Int. J. Impact Eng. 2015, 85, 45–56. [Google Scholar] [CrossRef]
  12. Ajibose, O.; Wiercigroch, M.; Akisanya, A. Experimental studies of the resultant contact forces in drillbit-rock interaction. Int. J. Mech. Sci. 2015, 91, 3–11. [Google Scholar] [CrossRef] [Green Version]
  13. Chiang, L.; Elías, D. Modeling impact in down-the-hole rock drilling. Int. J. Rock Mech. Min. Sci. Geomech. Abstr. 2000, 37, 599–613. [Google Scholar] [CrossRef]
  14. Chiang, L.; Elías, D. A 3D FEM methodology for simulating the impact in rock-drilling hammers. Int. J. Rock Mech. Min. Sci. Geomech. Abstr. 2008, 45, 701–711. [Google Scholar] [CrossRef]
  15. Zhu, H.; Liu, Q.; Xiao, X.; Jing, J. A 3D FEM methodology for the full-scale air hammer bit, teeth and rock contact analysis. Adv. Mater. Res. 2011, 156–157, 1425–1429. [Google Scholar] [CrossRef]
  16. Bu, C.; Qu, Y.; Cheng, Z.; Liu, B. Numerical simulation of impact on pneumatic DTH hammer percussive drilling. J. Earth Sci. 2009, 20, 868–878. [Google Scholar] [CrossRef]
  17. Saadati, M.; Forquin, P.; Weddfelt, K.; Larsson, P.; Hild, F. Granite rock fragmentation at percussive drilling - experimental and numerical investigation. Int. J. Numer. Anal. Methods Geomech. 2014, 38, 828–843. [Google Scholar] [CrossRef] [Green Version]
  18. Fourmeau, M.; Kane, A.; Hokka, M. Experimental and numerical study of drill bit drop tests on Kuru granite. Philos. Trans. R. Soc. Math. Phys. Eng. Sci. 2017, 375, 20160176. [Google Scholar] [CrossRef] [Green Version]
  19. Saadat, M.; Taheri, A. A cohesive discrete element based approach to characterizing the shear behavior of cohesive soil and clay-infilled rock joints. Comput. Geotech. 2019, 114, 103109. [Google Scholar] [CrossRef]
  20. Zhang, S.; Wu, S.; Duan, K. Study on the deformation and strength characteristics of hard rock under true triaxial stress state using bonded-particle model. Comput. Geotech. 2019, 112, 1–16. [Google Scholar] [CrossRef]
  21. Zhu, R.; Alam, S.; Loukili, A. A comprehensive approach for mesoscale discrete element modelling of mechanical and fracture behavior of concrete. Granul. Matter 2019, 21, 5. [Google Scholar] [CrossRef]
  22. Labra, C.; Rojek, J.; Oñate, E.; Zarate, F. Advances in discrete element modelling of underground excavations. Acta Geotech. 2008, 3, 317–322. [Google Scholar] [CrossRef]
  23. Mendoza, J.; Gamwo, I.; Zhang, W.; Lin, J. Discrete element modeling of rock cutting using crushable particles. In Proceedings of the 44th US Rock Mechanics Symposium and 5th US–Canada Rock Mechanics Symposium, Salt Lake City, UT, USA, 27 June 2010. [Google Scholar]
  24. Li, X.; Wang, S.; Ge, S.; Reza, M.; Li, Z. Investigation on the influence mechanism of rock brittleness on rock fragmentation and cutting performance by discrete element method. Measurement 2018, 113, 120–130. [Google Scholar] [CrossRef]
  25. Refahi, A.; Aghazadeh Mohandesi, J.; Rezai, B. Discrete element modeling for predicting breakage behavior and fracture energy of a single particle in a jaw crusher. Int. J. Miner. Process. 2010, 94, 83–91. [Google Scholar] [CrossRef]
  26. Huang, H.; Detournay, E. Discrete element modeling of tool-rock interaction II: Rock indentation. Int. J. Numer. Anal. Methods Geomech. 2013, 37, 1930–1947. [Google Scholar] [CrossRef]
  27. Huang, H.; Lecampion, B.; Detournay, E. Discrete element modeling of tool-rock interaction I: Rock cutting. Int. J. Numer. Anal. Methods Geomech. 2013, 37, 1913–1929. [Google Scholar] [CrossRef]
  28. Cundall, P.; Strack, O. A discrete numerical model for granular assemblies. Geotechnique 1979, 29, 47–65. [Google Scholar] [CrossRef]
  29. Weatherley, D.; Boros, V.; Hancock, W. ESyS-Particle Tutorial and User’s Guide Version 2.3.1; Institute for Geothermal Resource Management, The University of Queensland: Brisbane, Australia, 2014. [Google Scholar]
  30. Wang, Y. A new algorithm to model the dynamics of 3-D bonded rigid bodies with rotations. Acta Geotech. 2009, 4, 117–127. [Google Scholar] [CrossRef]
  31. Estay, D.; Chacana, F.; Ibarra, J.; Pérez, L.; Lascano, S. Bond calibration method for Young’s modulus determination in the discrete element method framework. Granul. Matter 2017, 19, 60. [Google Scholar] [CrossRef]
  32. Gong, S.; Zhao, T.; Zhao, J.; Dai, F.; Zhou, G.G. Discrete element analysis of dry granular flow impact on slit dams. Landslides 2021, 18, 1143–1152. [Google Scholar] [CrossRef]
  33. Saadati, M.; Weddfelt, K.; Larsson, P.L. A Spherical Indentation Study on the Mechanical Response of Selected Rocks in the Range from Very Hard to Soft with Particular Interest to Drilling Application. Rock Mech. Rock Eng. 2020, 53, 5809–5821. [Google Scholar] [CrossRef]
  34. Saksala, T.; Gomon, D.; Hokka, M.; Kuokkala, V.T. Numerical and experimental study of percussive drilling with a triple-button bit on Kuru granite. Int. J. Impact Eng. 2014, 72, 56–66. [Google Scholar] [CrossRef]
  35. Hernández-Vielma, C.; Estay, D.; Cruchaga, M. Response surface methodology calibration for DEM study of the impact of a spherical bit on a rock. Simul. Model. Pract. Theory 2022, 116, 102466. [Google Scholar] [CrossRef]
  36. Tkalich, D.; Fourmeau, M.; Kane, A.; Li, C.; Cailletaud, G. Experimental and numerical study of Kuru granite under confined compression and indentation. Int. J. Rock Mech. Min. Sci. Geomech. Abstr. 2016, 87, 55–68. [Google Scholar] [CrossRef]
  37. Lundberg, B. Microcomputer simulation of stress wave energy transfer to rock in percussive drilling. Int. J. Rock Mech. Min. Sci. Geomech. Abstr. 1982, 19, 229–239. [Google Scholar] [CrossRef]
  38. Lundberg, B.; Collet, P. Optimal wave with respect to efficiency in percussive drilling with integral drill steel. Int. J. Impact Eng. 2010, 37, 901–906. [Google Scholar] [CrossRef]
  39. Lundberg, B.; Collet, P. Optimal wave shape with respect to efficiency in percussive drilling with detachable drill bit. Int. J. Impact Eng. 2015, 86, 179–187. [Google Scholar] [CrossRef]
  40. Lundberg, B.; Huo, J. Biconvex versus bilinear force-penetration relationship in percussive drilling of rock. Int. J. Impact Eng. 2017, 100, 7–12. [Google Scholar] [CrossRef]
  41. Elías, D.; Chiang, L. Dynamic analysis of impact tools by using a method based on stress wave propagation and impulse-momentum principle. J. Mech. Des. Trans. ASME 2003, 125, 131–142. [Google Scholar] [CrossRef]
  42. Jeong, H.Y.; Cho, J.W.; Jeon, S.; Rostami, J. Performance assessment of hard rock TBM and rock boreability using punch penetration test. Rock Mech. Rock Eng. 2016, 49, 1517–1532. [Google Scholar] [CrossRef]
  43. Gill, W.R.; Vanden Berg, G.E. Soil Dynamics in Tillage and Traction (Agricultural Handbook no. 316). Soil Sci. Soc. Am. J. 1968, 32, 4. [Google Scholar] [CrossRef]
  44. He, C.; You, Y.; Wang, D.; Wang, G.; Lu, D.; Morris Togo Kaji, J. The effect of tine geometry during vertical movement on soil penetration resistance using finite element analysis. Comput. Electron. Agric. 2016, 130, 97–108. [Google Scholar] [CrossRef]
  45. Ajibose, O.; Wiercigroch, M.; Pavlovskaia, E.; Akisanya, A.; Károlyi, G. Drifting impact oscillator with a new model of the progression phase. J. Appl. Mech. Trans. ASME 2012, 79, 061007. [Google Scholar] [CrossRef]
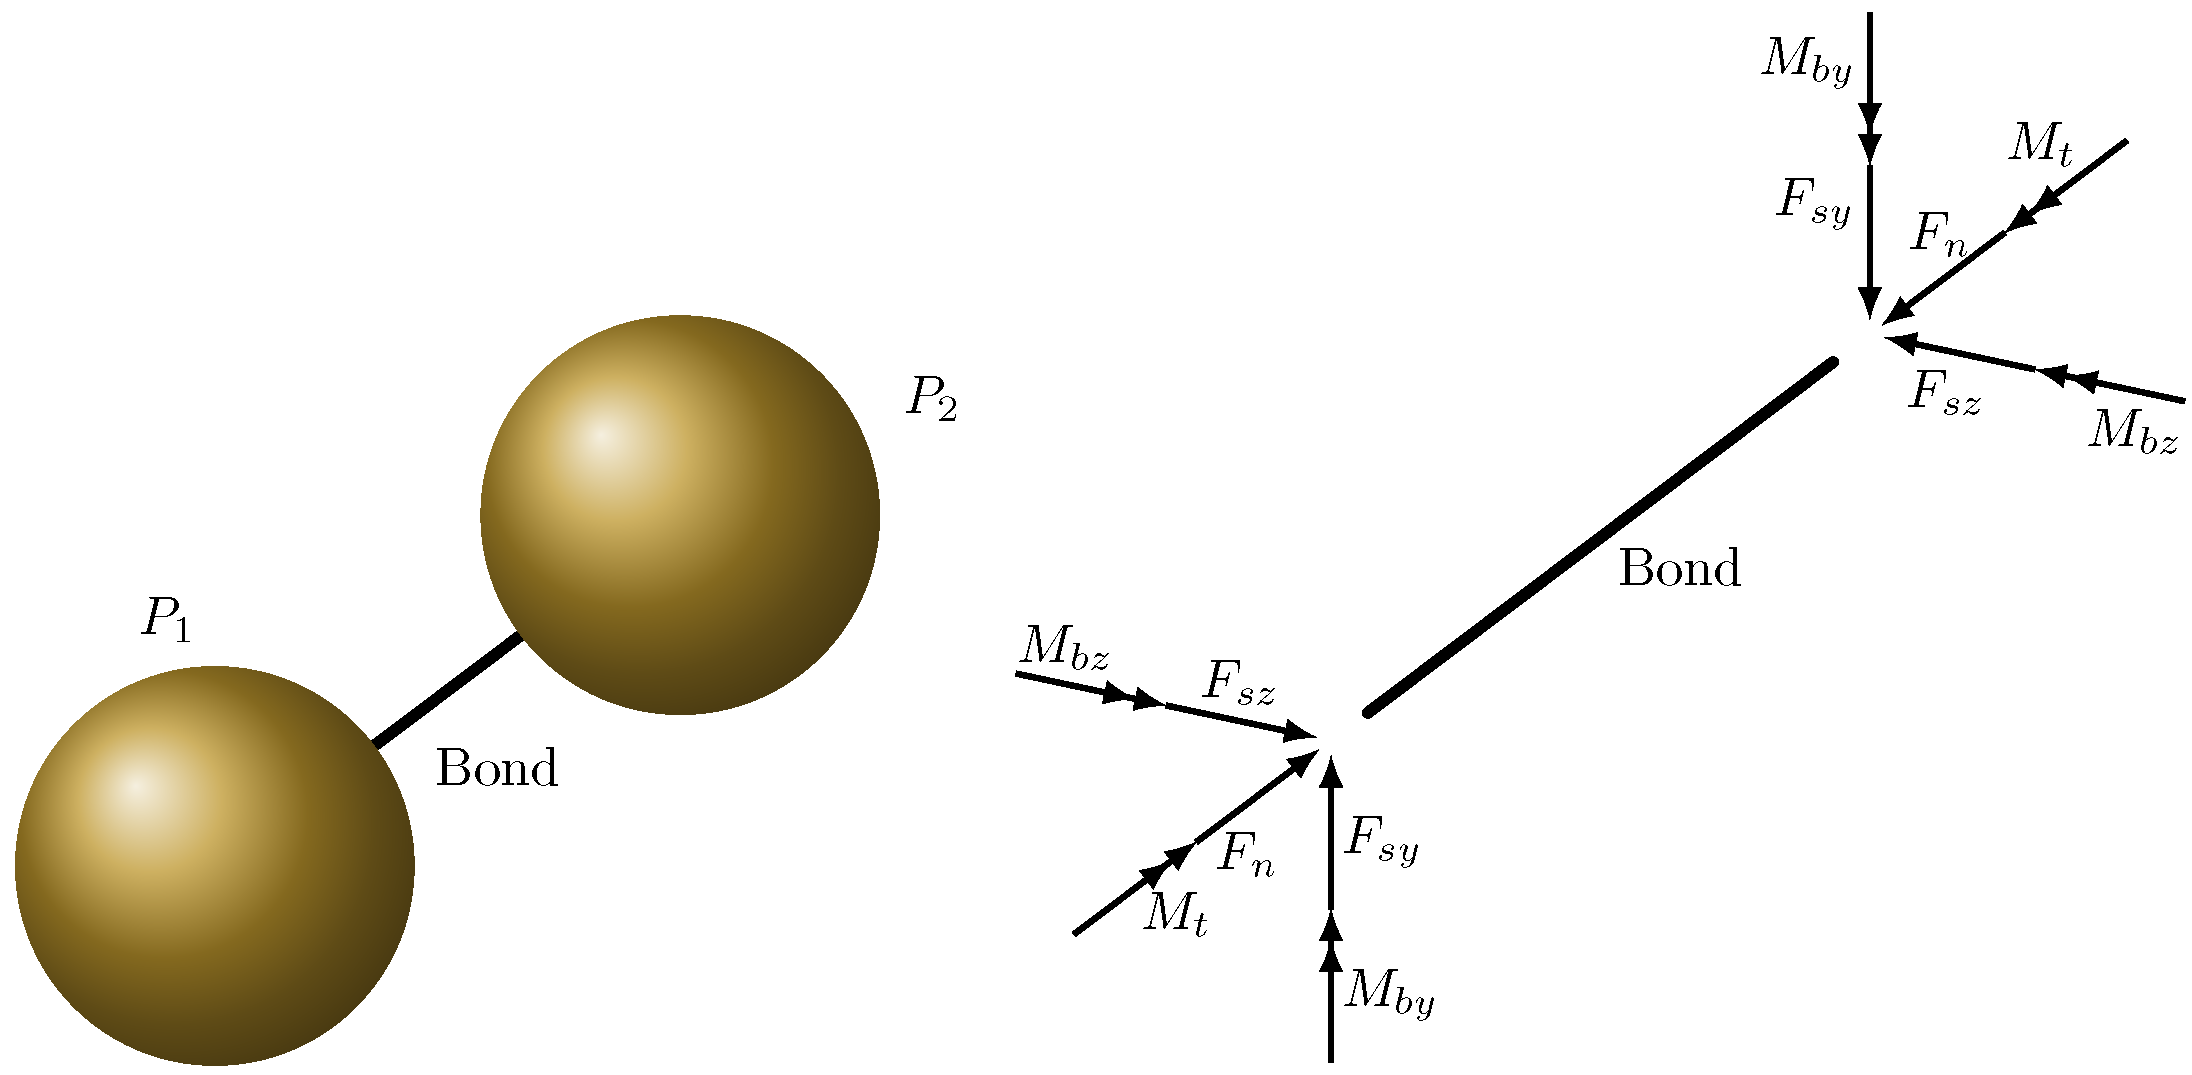
Figure 1. Bonded particle model. The bond supports normal forces, shear forces, bending moments, and torsional moments.
Sustainability 15 09051 g001
Figure 2. Schematic representation of numerical simulation.
Sustainability 15 09051 g002
Figure 3. Mechanical energy transferred to the rock versus bit penetration. (a) Bit radius 4 mm; (b) Bit radius 6 mm; (c) Bit radius 8 mm; (d) Bit radius 10 mm.
Sustainability 15 09051 g003
Figure 4. Coefficients of regression and determination for the energy of the rock as a function of the bit radius, computed at  v 0 = 15  m/s: (a k E  vs.  r b ; (b n E  vs.  r b ; (c R E 2  vs.  r b .
Sustainability 15 09051 g004
Figure 5. Mechanical energy transferred to the rock versus time. (a) Bit radius 4 mm; (b) Bit radius 6 mm; (c) Bit radius 8 mm; (d) Bit radius 10 mm.
Sustainability 15 09051 g005
Figure 6. The efficiency of the mechanical energy transfer process as a function of the initial bit velocity.
Sustainability 15 09051 g006
Figure 7. Thrust force versus time. (a) Bit radius 4 mm; (b) Bit radius 6 mm; (c) Bit radius 8 mm; (d) Bit radius 10 mm.
Sustainability 15 09051 g007
Figure 8. Force–penetration relationship. (a) Bit radius 4 mm; (b) Bit radius 6 mm; (c) Bit radius 8 mm; (d) Bit radius 10 mm.
Sustainability 15 09051 g008aSustainability 15 09051 g008b
Figure 9. The force–penetration relationship for the different impact velocities and the different bit radii: (a v 0 = 15  m/s,  r b = 6  mm; (b v 0 = 15  m/s,  r b = 8  mm; (c v 0 = 15  m/s,  r b = 15  mm; (d r b = 10  mm,  v 0 = 5  m/s; (e r b = 10  mm,  v 0 = 8  m/s; (f r b = 10  mm,  v 0 = 15  m/s.
Sustainability 15 09051 g009
Figure 10. Coefficients of regression and determination for the loading force as a function of the bit radius: (a k l  vs.  r b ; (b n l  vs.  r b ; (c R l 2  vs.  r b .
Sustainability 15 09051 g010
Figure 11. Coefficients of regression and determination for the unloading force as a function of the bit radius: (a k u  vs.  r b ; (b n u  vs.  r b ; (c R u 2  vs.  r b .
Sustainability 15 09051 g011
Figure 12. Coefficients of regression and determination for the loading force as a function of the impact velocity: (a k l  vs.  v 0 ; (b n l  vs.  v 0 ; (c R l 2  vs.  v 0 .
Sustainability 15 09051 g012
Figure 13. Coefficients of regression and determination for the unloading force as a function of the impact velocity: (a k u  vs.  v 0 ; (b n u  vs.  v 0 ; (c R u 2  vs.  v 0 .
Sustainability 15 09051 g013
Table 1. Rock microparameters.
Y b  (MPa) C b  (MPa) ϕ b  ( ) μ
100,000410.5357.930.852
Disclaimer/Publisher’s Note: The statements, opinions and data contained in all publications are solely those of the individual author(s) and contributor(s) and not of MDPI and/or the editor(s). MDPI and/or the editor(s) disclaim responsibility for any injury to people or property resulting from any ideas, methods, instructions or products referred to in the content.