Article

Assessing Climate-Driven Salinity Intrusion through Water Accounting: A Case Study in Ben Tre Province for More Sustainable Water Management Plans

1
Southern Institute for Water Resources Planning, Ministry of Agriculture and Rural Development, Ho Chi Minh 700000, Vietnam
2
Institute of Applied Mechanics and Informatics, Vietnam Academy of Science and Technology, Ho Chi Minh 700000, Vietnam
3
Institute for Resources and Environment, Vietnam National University Ho Chi Minh City, Ho Chi Minh 700000, Vietnam
*
Author to whom correspondence should be addressed.
Sustainability 2023, 15(11), 9110; https://doi.org/10.3390/su15119110
Submission received: 14 May 2023 / Revised: 28 May 2023 / Accepted: 1 June 2023 / Published: 5 June 2023
(This article belongs to the Special Issue Urban Resilience and Critical Infrastructure)

Abstract

:
This scientific paper delves into sustainable water management strategies for Ben Tre Province of the Vietnamese Mekong Delta (VMD) in light of water-infrastructure plans that have been impacted by climate change-induced salinity intrusion. Specifically, we aim to mitigate the effects of salinity intrusion for the province while promoting long-term environmental sustainability. In doing so, a water accounting framework was applied, mostly based on the MIKE11 hydrodynamic modeling and water balance calculations, to determine current and future water stress issues based on two main scenarios of extreme drought year 2016 (baseline) and the future year 2030 under climate change for a medium-low emission scenario (RCP4.5). The study found that salinity intrusion significantly causes severe water stress in the future year 2030 compared to the baseline year 2016, while the existing water management methods are relatively inadequate to control salinity intrusion, leading to over 57% of the area affected by medium to critical water stress levels, although it will go along with planned water infrastructures. Additionally, a system of triple rice cropping converted two rice cropping and upland cropping with 40% water demand cutoff was found to be the most suitable measure for 2030. Particularly, water-saving and water demand reduction should be incorporated into infrastructural planning for sustainable water management. Our study provides valuable insights for policymakers and stakeholders, not only for the province and the VMD, but also other regions facing similar challenges.

1. Introduction

Climate resilience refers to the ability of a community or region to withstand and recover from the impacts of climate change [1,2]. This includes adapting to changes in temperature, precipitation, and sea level rise, as well as mitigating the causes of climate change. Sustainability, on the other hand, refers to the ability of a community or region to meet its present needs without compromising the ability of future generations to meet their own needs [3,4]. This includes balancing economic, social, and environmental factors in decision-making [5].
Salinity intrusion (SI) driven by climate change-induced sea-level rise is a global issue that affects many regions around the world, including coastal areas and river deltas [6,7,8,9,10]. The intrusion of saltwater into freshwater systems is caused by a range of factors, including sea-level rise, reduced freshwater flows, and human activities such as the development of water infrastructure [11,12,13]. SI can have significant impacts on freshwater resources, including reduced water quality, damage to crops and ecosystems, and threats to human health [13,14,15]. Therefore, there is a pressing need for sustainable water management strategies that can mitigate the impacts of SI while promoting sustainable development in affected areas [16,17]. This requires a collaborative effort between policymakers, researchers, and practitioners to identify effective approaches for managing freshwater resources, reducing water demand, and promoting sustainable agricultural practices. By adopting a comprehensive and integrated approach to water management, it is possible to ensure the long-term sustainability of freshwater resources in affected areas and promote the well-being of local communities [9,18].
The Vietnamese Mekong Delta (VMD) is currently experiencing SI, which is the infiltration of saltwater into freshwater sources due to rising sea levels and reduced freshwater flow from upstream [19]. This has significant impacts on the region’s agriculture, economy, and social well-being. Located in the coastal VMD, Ben Tre Province has growing concerns about SI’s impacts [20,21,22]. In the province, SI has resulted in decreased rice yields and damage to fruit trees, affecting the income and food security of local farmers [23,24,25]. Moreover, SI is also having significant impacts on the environment, including the loss of freshwater biodiversity and damage to agricultural ecosystems. For instance, SI was the worst in 2016 and 2020, and approximately 40,000 households lacked freshwater, and 57,000 ha of paddy, fruit trees, and vegetables were damaged in Ca Mau and Ben Tre Provinces [19]. Addressing the SI in Ben Tre Province within the VMD context is a critical issue that requires urgent attention from policymakers, researchers, and practitioners to develop effective strategies for managing freshwater resources and promoting sustainable development in affected areas to cope with environmental changes [2]. Sustainable water management is thus essential due to the increasing salinity intrusion and water infrastructure development in the region [24,26].
Several studies have identified the need for sustainable water management strategies that can mitigate the impacts of SI while promoting sustainable development in affected areas [22,27,28]. These studies highlight the importance of adopting an integrated and collaborative approach to water management that involves policymakers, researchers, and practitioners working together to develop effective strategies for managing freshwater resources, reducing water demand, and promoting sustainable agricultural practices. Additionally, the literature review highlights the need for further research to better understand the impacts of SI and water infrastructure development on freshwater resources and to identify effective strategies for mitigating these impacts [10,29,30]. Overall, the literature review underscores the importance of sustainable water management in Ben Tre Province and beyond the delta and the need for continued research and policy interventions to promote the long-term sustainability of freshwater resources in affected areas [24,25,31].
Our study aims to investigate appropriate measures for sustainable water management of the freshwater area of Ben Tre Province under the conditions of climate change and anthropogenic influences, including water infrastructures in 2020 and until 2030, based on the application of water accounting. In doing so, we applied a water accounting framework coupled with the water demand methods of the Food and Agriculture Organization of the United Nations (FAO) and a numerical modeling approach (MIKE11 model). This study sheds light on the need of seeking sustainable water management strategies for coastal provinces of the VMD in coping with the changes of climate and anthropogenic pressures to provide a lesson learnt for similar coastal regions worldwide.

2. Study Area

Ben Tre Province is located in coastal regions of the Vietnamese Mekong Delta (VMD) (see Figure 1), which is one of the five deltas most affected by climate change worldwide [32]. It covers an area of 2394 km2 and comprises nine administrative units, including Ben Tre city and eight districts, with a population of more than 1.2 million in 2020 [33]. The province is characterized by flat and low-lying ground, with a typical range from 0.5 m to 1.5 m, which accounts for about 70% of the natural area, combined with a dense river network [34]. The surface water source is served by four main tributaries of the Tien River, including Co Chien, Dai, Ba Lai, and Ham Luong Rivers. The fresh surface water flowing in these rivers and the dense canal network maintain the stability of three dominant crop patterns in Ben Tre Province, including paddy, orchard, and aquaculture.
Ben Tre Province was severely affected by the most severe droughts and saline intrusions over the last three decades in the VMD in 2016 and 2020 [26,35]. In these years, farmers faced damages caused by salinity intrusion impacts since intrusions were further inland and remained longer than usual. It was reported that about 40,000 households lacked freshwater, and 57,000 ha of paddy, fruit trees, and vegetables were damaged across the province. The increase in salinity intrusion in the VMD is mainly from anthropogenic activities, such as upstream hydropower dams, sand mining, land subsidence, water demand increases, and climate change impacts which have caused significant changes in the hydrologic regime [36,37,38]. Salinity intrusion has threatened the sustainable water management of Ben Tre Province [8].
Existing water management in Ben Tre is dominated by numerous water infrastructure systems that maintain and develop agricultural production. However, several systems have not been completely enclosed, causing severe drought and saline damage in agriculture. To deal with these issues, farmers have implemented measures such as water storage in ponds, floating reservoirs in the field, or using plastic bags to store water for the orchard. For example, Kenh Lap water reservoir was built from an existing canal to store more than 800,000 m3 and supply water for 20,000 people in Ba Tri district [39].

3. Data Availability and Methodology

3.1. Data Availability

To address the study’s objective and research questions, three types of data were collected. The first type is ground-measured data that focuses on hydro-meteorology and agricultural water demand. The second type is open-source data of population distribution, which was used to calculate spatial household water demand. The third type includes other data types such as land use, cropping calendars, data from statistical books, and climate change that were used to set up a hydrodynamic model.
(i)
Ground-measure data
We collected the data of nineteen stations, including four meteorological stations that measured rainfall, humidity, air temperature, and sunshine, twelve hydrological stations that measured water level and/or salinity concentration, and three stations that measured rainfall only. The location of each station is presented in Figure 1, and detailed characteristics of the stations are presented in Table A1 in the Appendix A. All stations are managed by the Southern Regional Hydro-meteorological Center of Vietnam.
(ii)
Open-source data
To calculate household water demand spatially, the population distribution map was retrieved from WorldPop Hub (www.worldpop.org, accessed on 10 October 2022). The map was created based on the UN population data in 2015 and has a grid format with a resolution of 100 m. To adjust the population distribution map extracted from the WorldPop Hub, statistical population data in 2020 were retrieved from the Vietnam national census, which is called the Ben Tre Provincial Statistical Book 2020 [40].
(iii)
Other data types
The Department of Agriculture and Rural Development (DARD) and Department of Natural Resources and Environment of Ben Tre Province have provided the land use map and attributes, while the cropping patterns were updated from annual reports of the DARD.
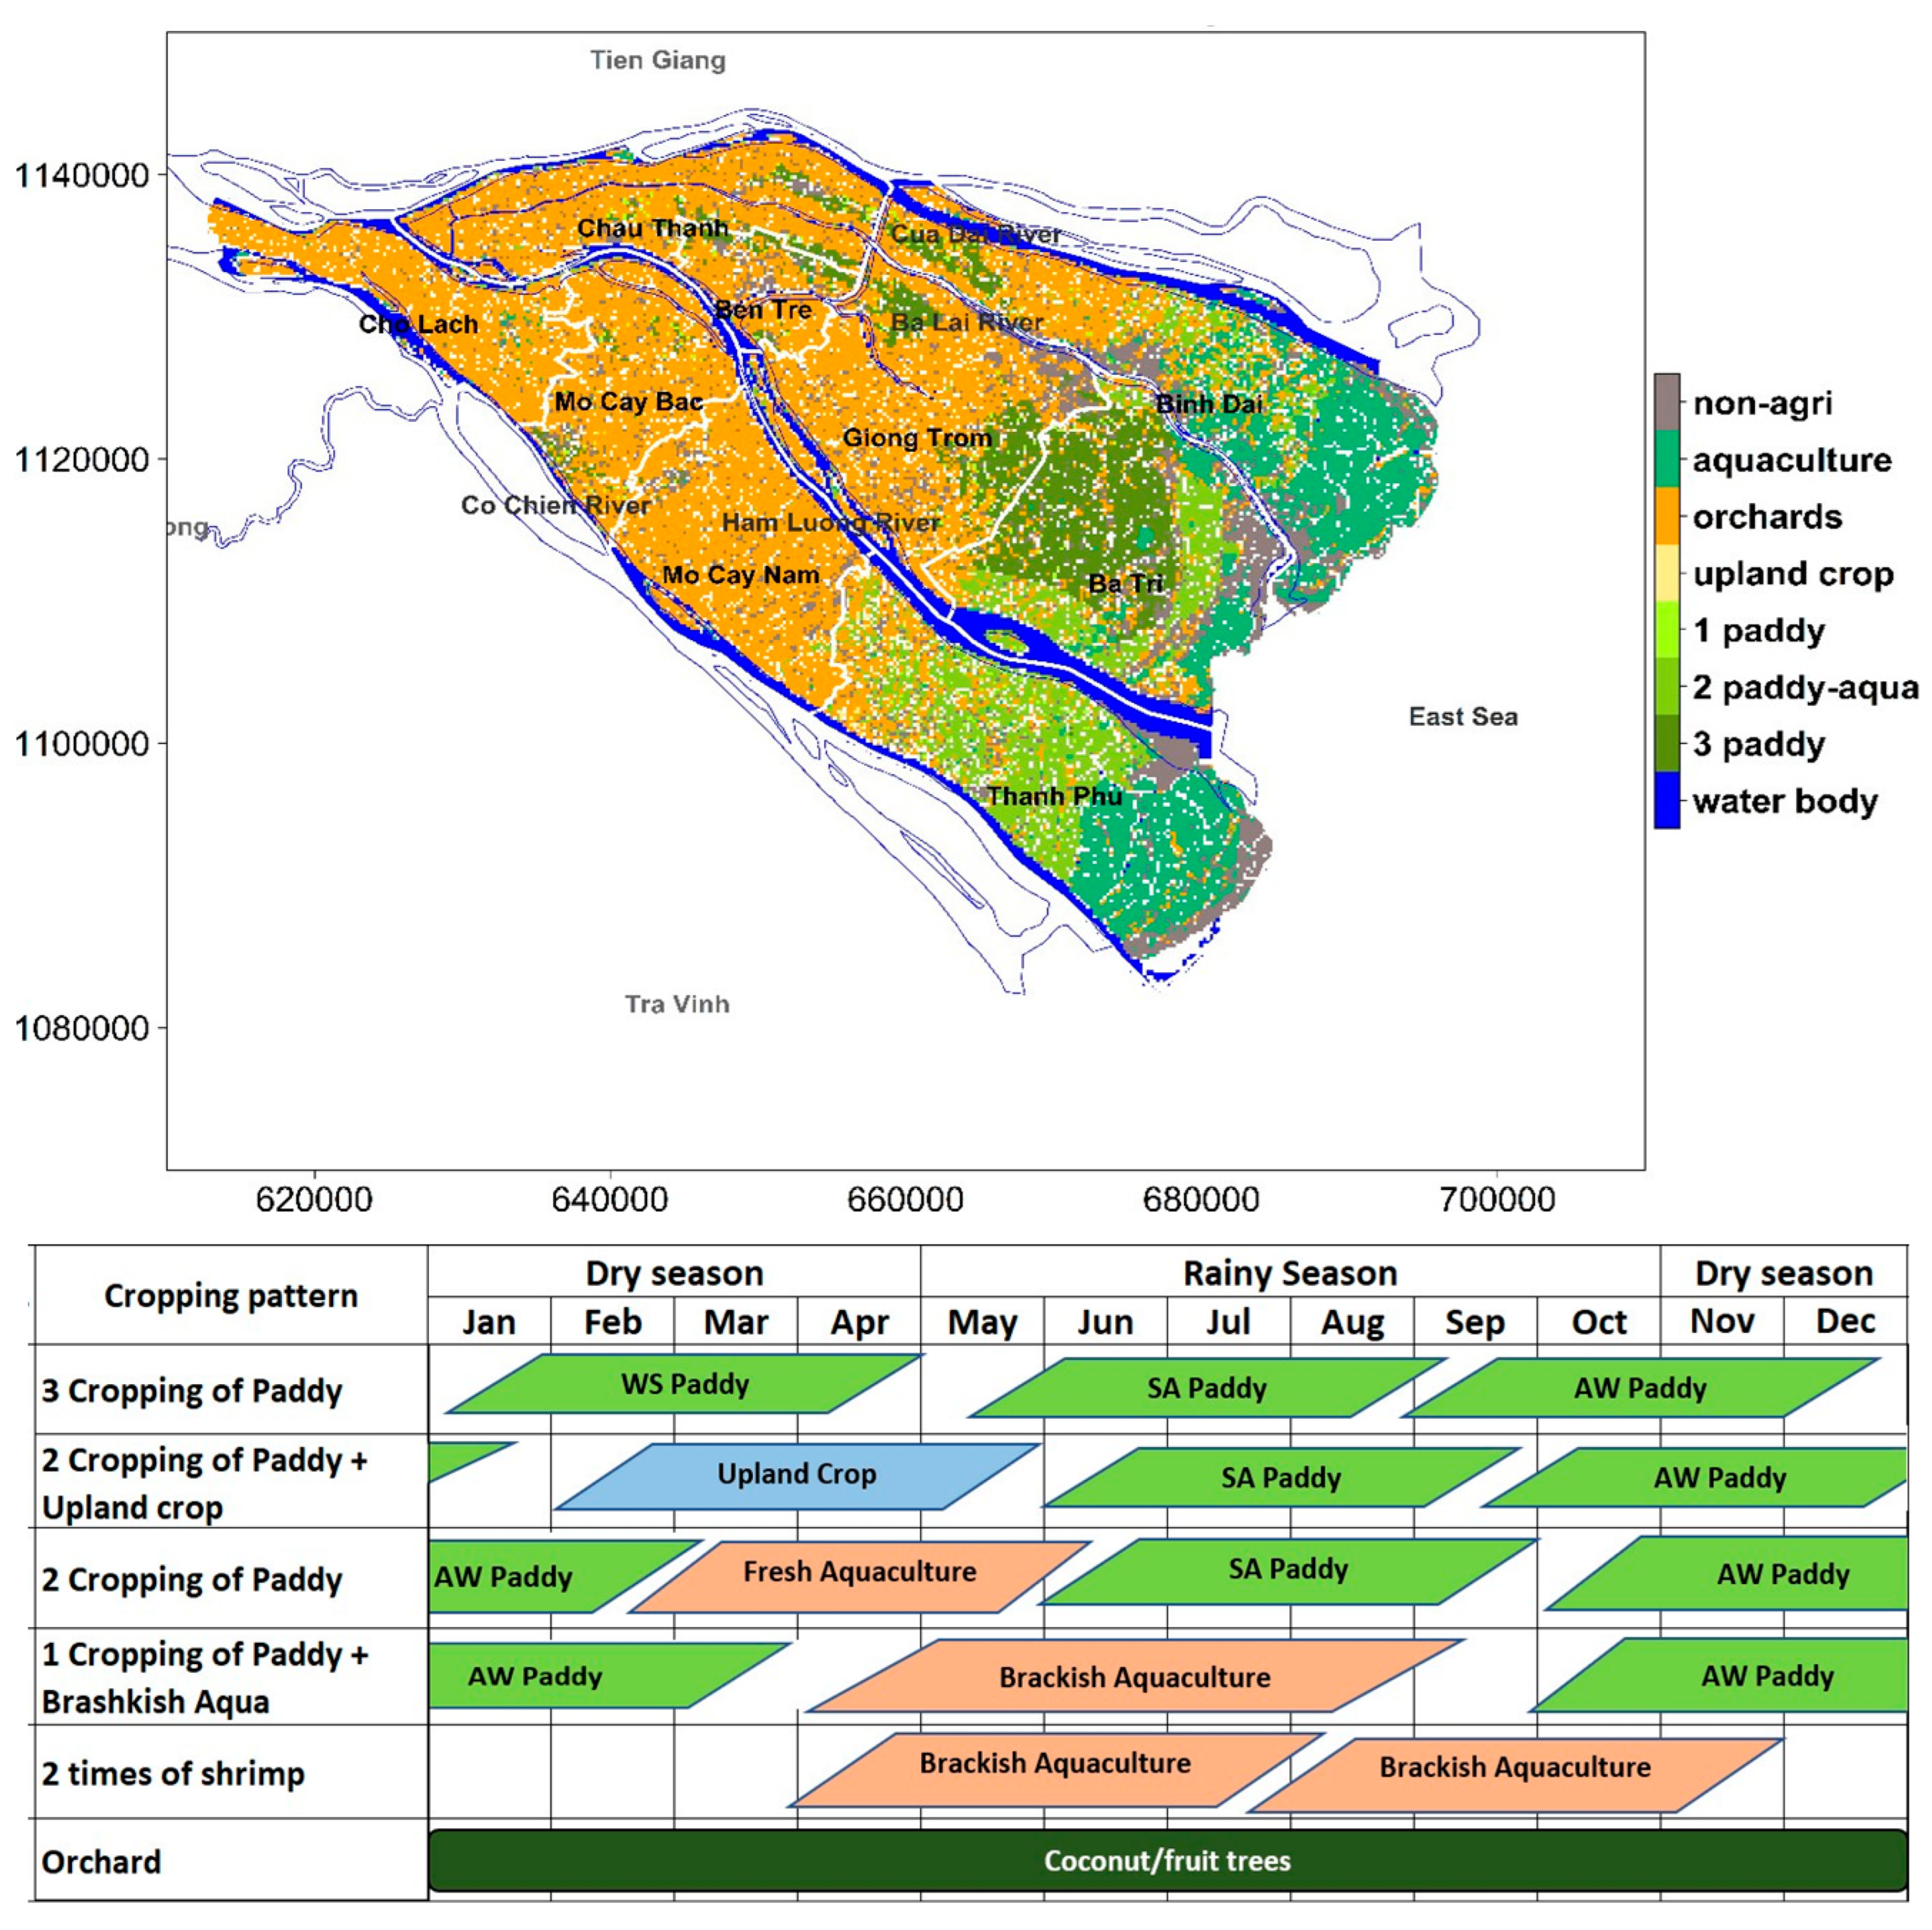
Overall, four types of land uses dominate in Ben Tre, namely orchards, rice cultivation, brackish aquaculture, and upland crops covering five key cropping patterns (see Figure A1 in the Appendix A). First, triple paddy rice crops (20,350 ha) are cultivated in the middle and low parts of the province, except for the coast. Each crop requires about four growing months, starting with the Winter–Spring season (WS), the Summer–Autumn season (SA), and ending with the Autumn–Winter season (AW). Second, double paddy rice crops are combined with fresh aquaculture (35,077 ha) in the dry season using water storage in the wet season [34]. The third is one paddy crop and one brackish aquaculture, in which the rice crop takes place at the end of the wet season, and the brackish crop starts at the end of the rainy season, as found in the lower Thanh Phu and Binh Dai districts. The fourth cropping pattern is brackish aquaculture that is cultured only outside the dike and in the coastal regions of Binh Dai, Ba Tri, and Thanh Phu districts [41]. Finally, orchards, as the largest area (101,344 ha), including coconut and fruit trees, are popularly grown throughout the year in upstream areas of Ben Tre Province.

3.2. Methodology

3.2.1. Overall Methods

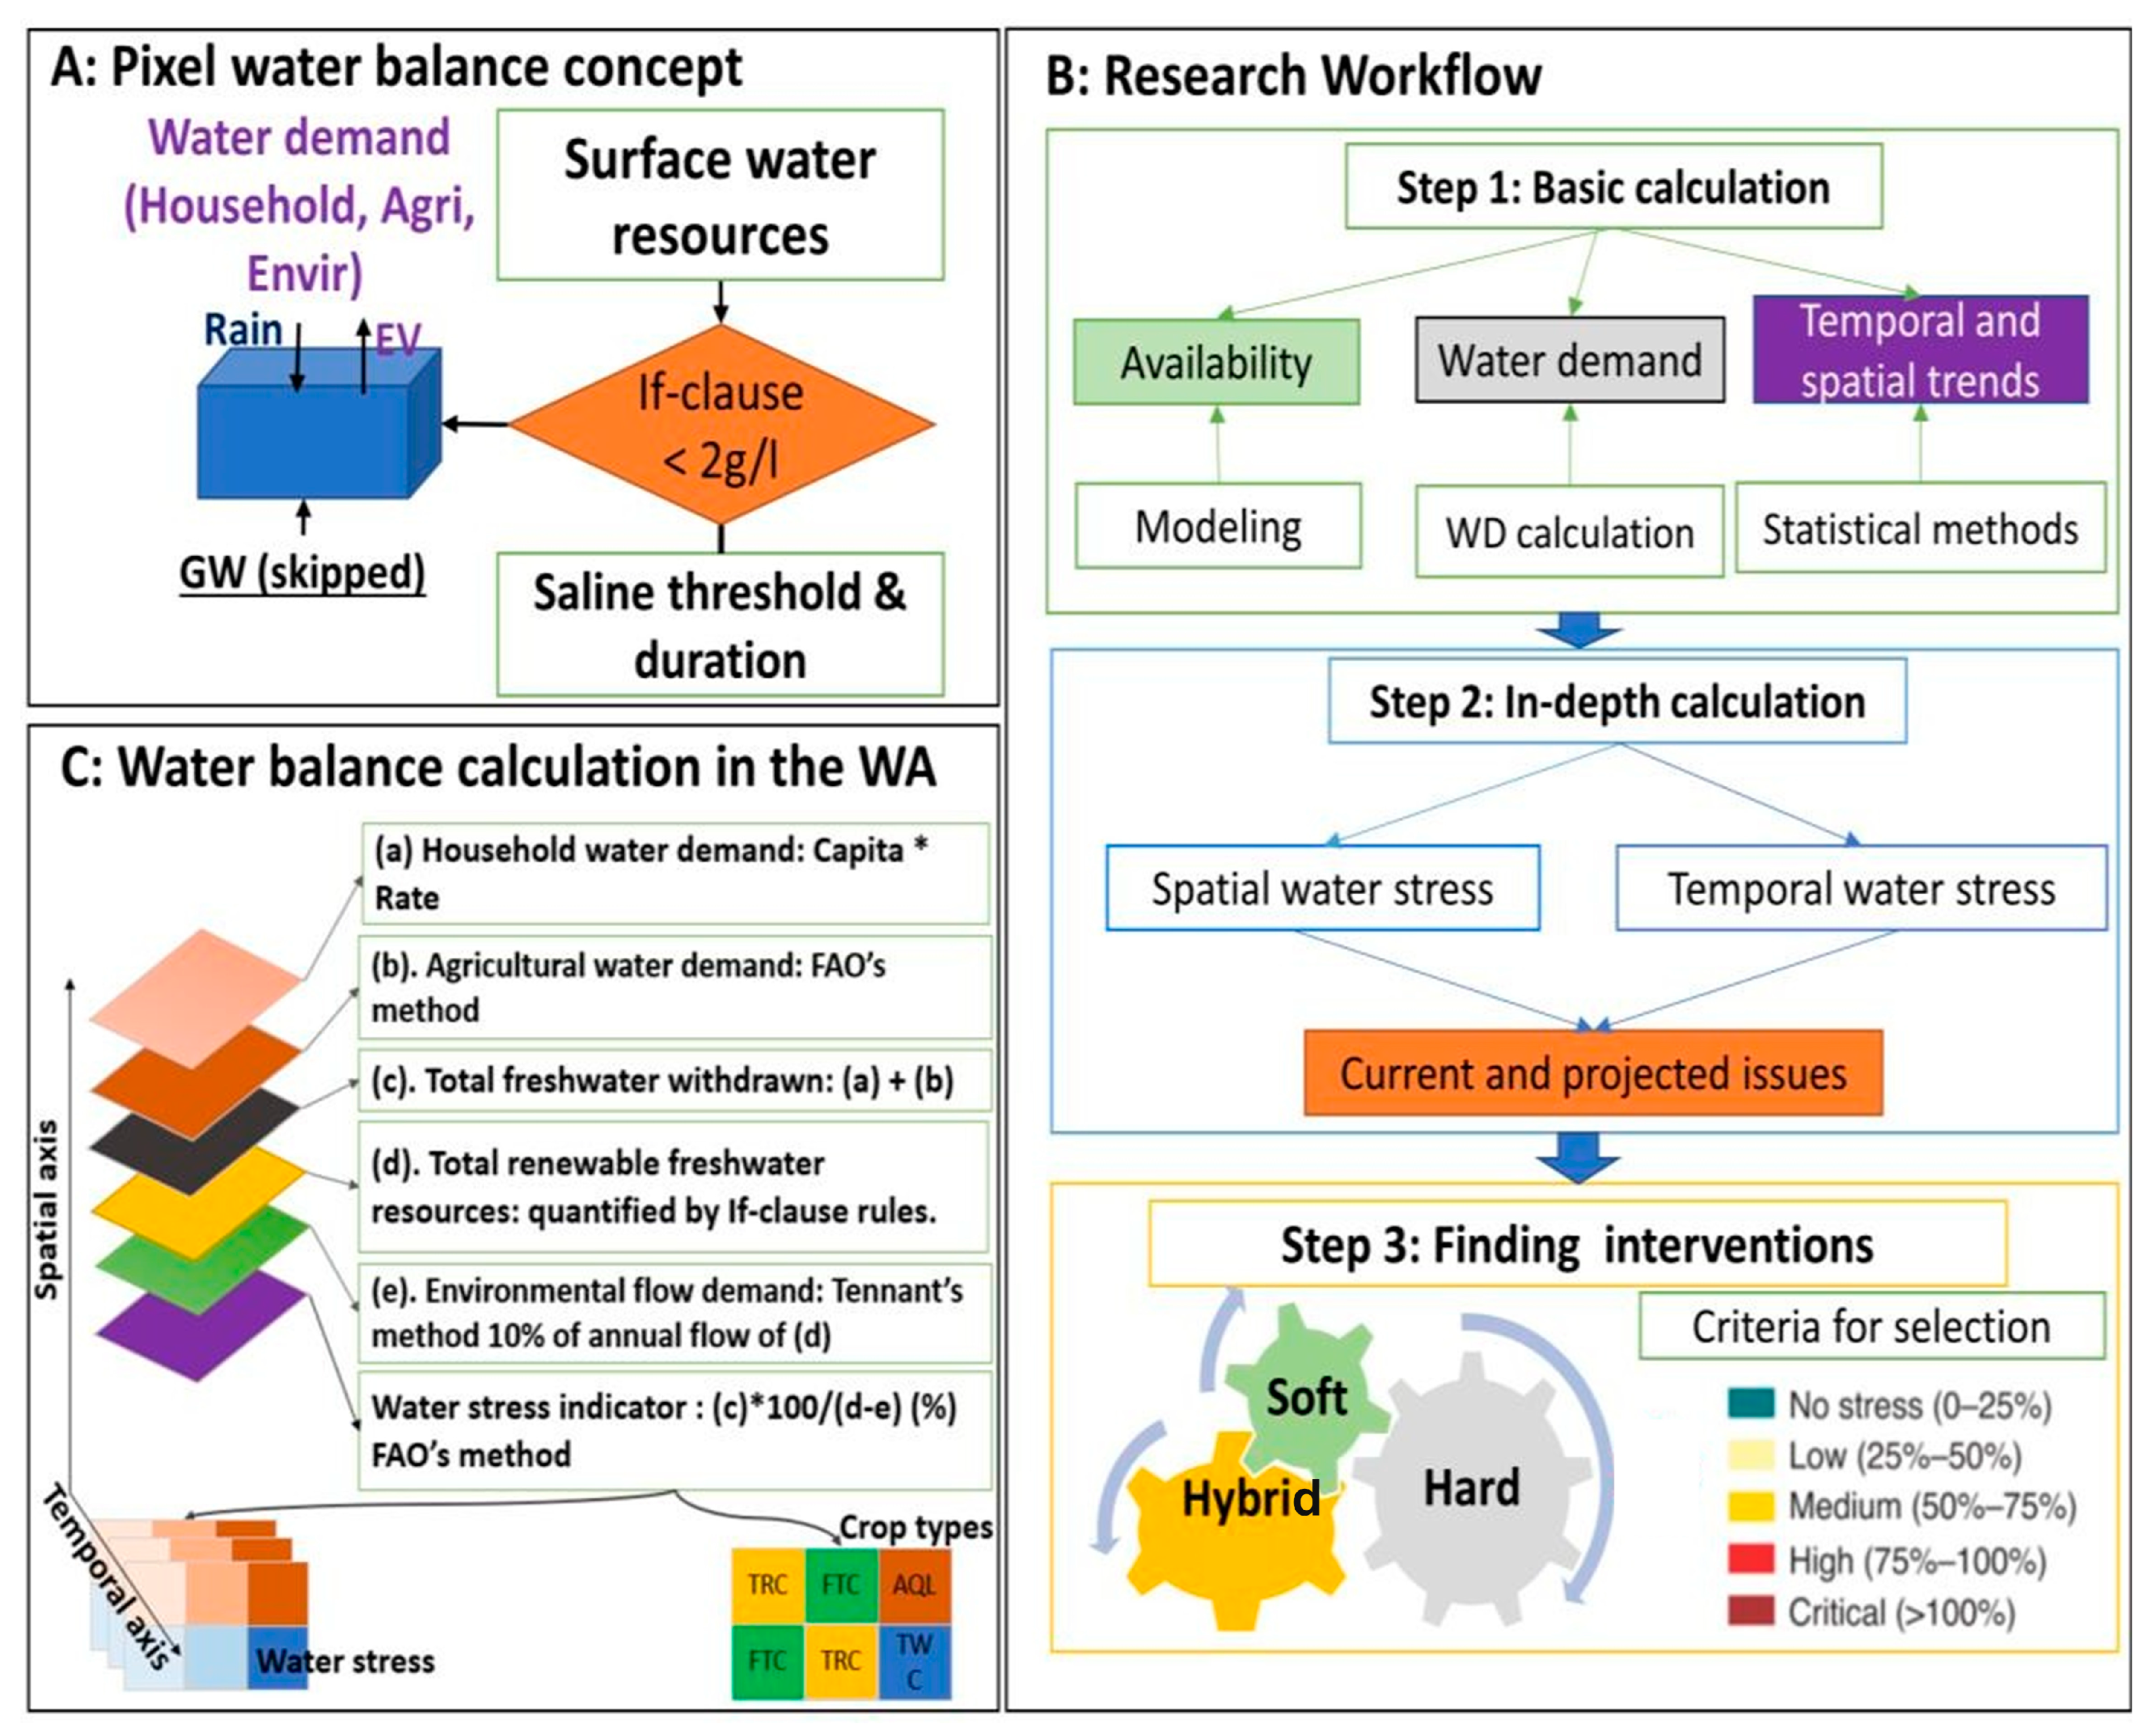
This study applied a flexible water accounting framework that considers both water quantity and water quality (saltwater concentration) to assess the availability of water resources compared to the water demands of various users (agriculture, domestic, and environment) under current and future climatic conditions. The concept of pixel water balances was used (with a resolution or pixel size of 1 ha) to make more sense of water sources, needs, and consumption over time and space (Figure 2A). Water inflow in a pixel element includes surface water sources and precipitation, while water losses comprise water demand for agriculture, households, and ecosystems. Surface freshwater resources for each pixel element were determined by eliminating water containing salinity concentrations exceeding 2 g/L to define the total renewable freshwater resources.
The three-step research workflow is shown in Figure 2B. In the first step, water availability in time and space was determined based on upstream surface and precipitation water sources. Since groundwater resources is not exploited due to poor quality for water use in the study area, it was disregarded in our calculations [42]. Meanwhile, the spatial and temporal variation of water demands of users was determined using numerical modeling methods based on MIKE11 model’s simulations [43] and FAO’s water demand procedures [44,45,46]. In the second step, the efficiency of the existing irrigation system and the planned irrigation system by 2030 was assessed based on planning of local authorities. To evaluate the current and planned solutions regarding water management status, the water stress indicator was employed to indicate how much freshwater is being fitted to demands for all water users in the study area in temporal and spatial aspects [47]. The current and projected issues of water management were shown through the water stress degree in the existing irrigation and planning irrigation systems. If the planned solution does not secure the water needs of all water users, interventions are investigated by combining soft and structural measures in water management in step three. Similarly, the water stress indicator was also used to assess the effectiveness of the proposed measures in the third step based on criteria of the water stress status of crops and areas affected by the water stress.
We used five layers for spatial water balance computations, with outputs represented by the water stress indicator (Figure 2C). For affected areas, including different cropping areas, water stress levels were determined for each scenario. Domestic water demand was calculated as the product of population per area and criteria on water use, while agricultural water needs were quantified using FAO’s methods [48]. The total freshwater withdrawn was the sum of the household and agricultural water needs. Moreover, the total renewable freshwater was determined by the amount of water with saline concentration not exceeding 2 g/L. The environmental flow was estimated to be 10% of the annual freshwater flow obtained by the MIKE11 simulation. As a result, the water stress was spatially quantified as the total freshwater withdrawn by households and agriculture divided by the difference between the total renewable freshwater resources and the environmental flow demand multiplied by 100 [49].

3.2.2. Water Accounting Framework

Water accounting is an essential tool for effective water resource management and governance [44,46,50]. It involves a systematic quantitative evaluation of the current status and trends in water supply, demand, accessibility, and use in specific domains, taking into account temporal and spatial variations [51]. Water accounting provides reliable and accurate information that serves as the foundation for good water governance. It is also a useful tool for monitoring and achieving the 17 Sustainable Development Goals (SDGs) related to economic development, poverty eradication, and environmental protection [44,52]. It is noted that our study has applied the water accounting framework but not in detail involving socio-economic achievements from SDGs such as previous studies [53,54].
To achieve sustainable water management, water accounting employs quantitative methods to produce basic information on the supply and demand for water [55]. This information is used to develop suitable ways of water allocation that meet social, economic, and natural needs without compromising future needs. Moreover, governmental planners and corporations can use water accounting to determine the “hydrological costs” of their plans to avoid risks of water scarcity, such as using water from current local users or causing water shortages in other areas.
The water accounting framework consists of several water fact sheets that communicate crucial information on the water resources status, water consumption patterns, water use productivity, and water flows between various water users in specific domains such as river basins, sub-basins, irrigation systems, or agricultural fields. These fact sheets include the Resource base sheet, Evapotranspiration sheet, Productivity sheet, and Withdrawal sheet. Each fact sheet serves a different purpose. For example, the Resource base sheet provides information on water volume regarding over-exploitation, manageable and unmanageable flows, reserved flows, utilized flows, and utilizable flows at the study domains. It also presents landscape evapotranspiration (ET) by precipitation and incremental ET sourced from natural and man-made withdrawals.

3.2.3. Numerical Modeling Approach and Simulation Scenarios

Numerical Modeling Approach

The MIKE11 model was developed by the Danish Hydraulic Institute (DHI) and is a modeling package used for hydraulic phenomena in rivers, lakes, canals, and other inland water systems [56]. It includes various functions to model hydraulic work operations such as sluices, dams, pumps, and embankments in irrigation schemes. The model is widely used for simulating water flow and quality in river basins and other water systems.
The MIKE11 package includes several modules, such as the hydrodynamic, rainfall-runoff, advection–dispersion (AD), sediment transport, and Ecolab modules. In our present study, the hydrodynamic, advection–dispersion, and rainfall–runoff modules were used to simulate water flow and quality in the study area. The hydrodynamic module solves the Saint–Venant equations using fully dynamic descriptions that integrate equations of conservation of volume and momentum. The AD module simulates dissolved or suspended material movements, such as saline intrusion and sediment transport, while salinity concentration is defined as the mass of inorganic salts per volume of water in the model. This module requires outputs from the hydrodynamic modules, including flow and water level, cross-sectional area, and hydraulic radius in temporal and spatial variations. In the package, a lumped, conceptual rainfall–runoff model, the so-called MIKE11 NAM, was used to model several components of runoff generation, including overland-flow, inter-flow, and base-flow as a function of the moisture contents in four vertical storages [56].
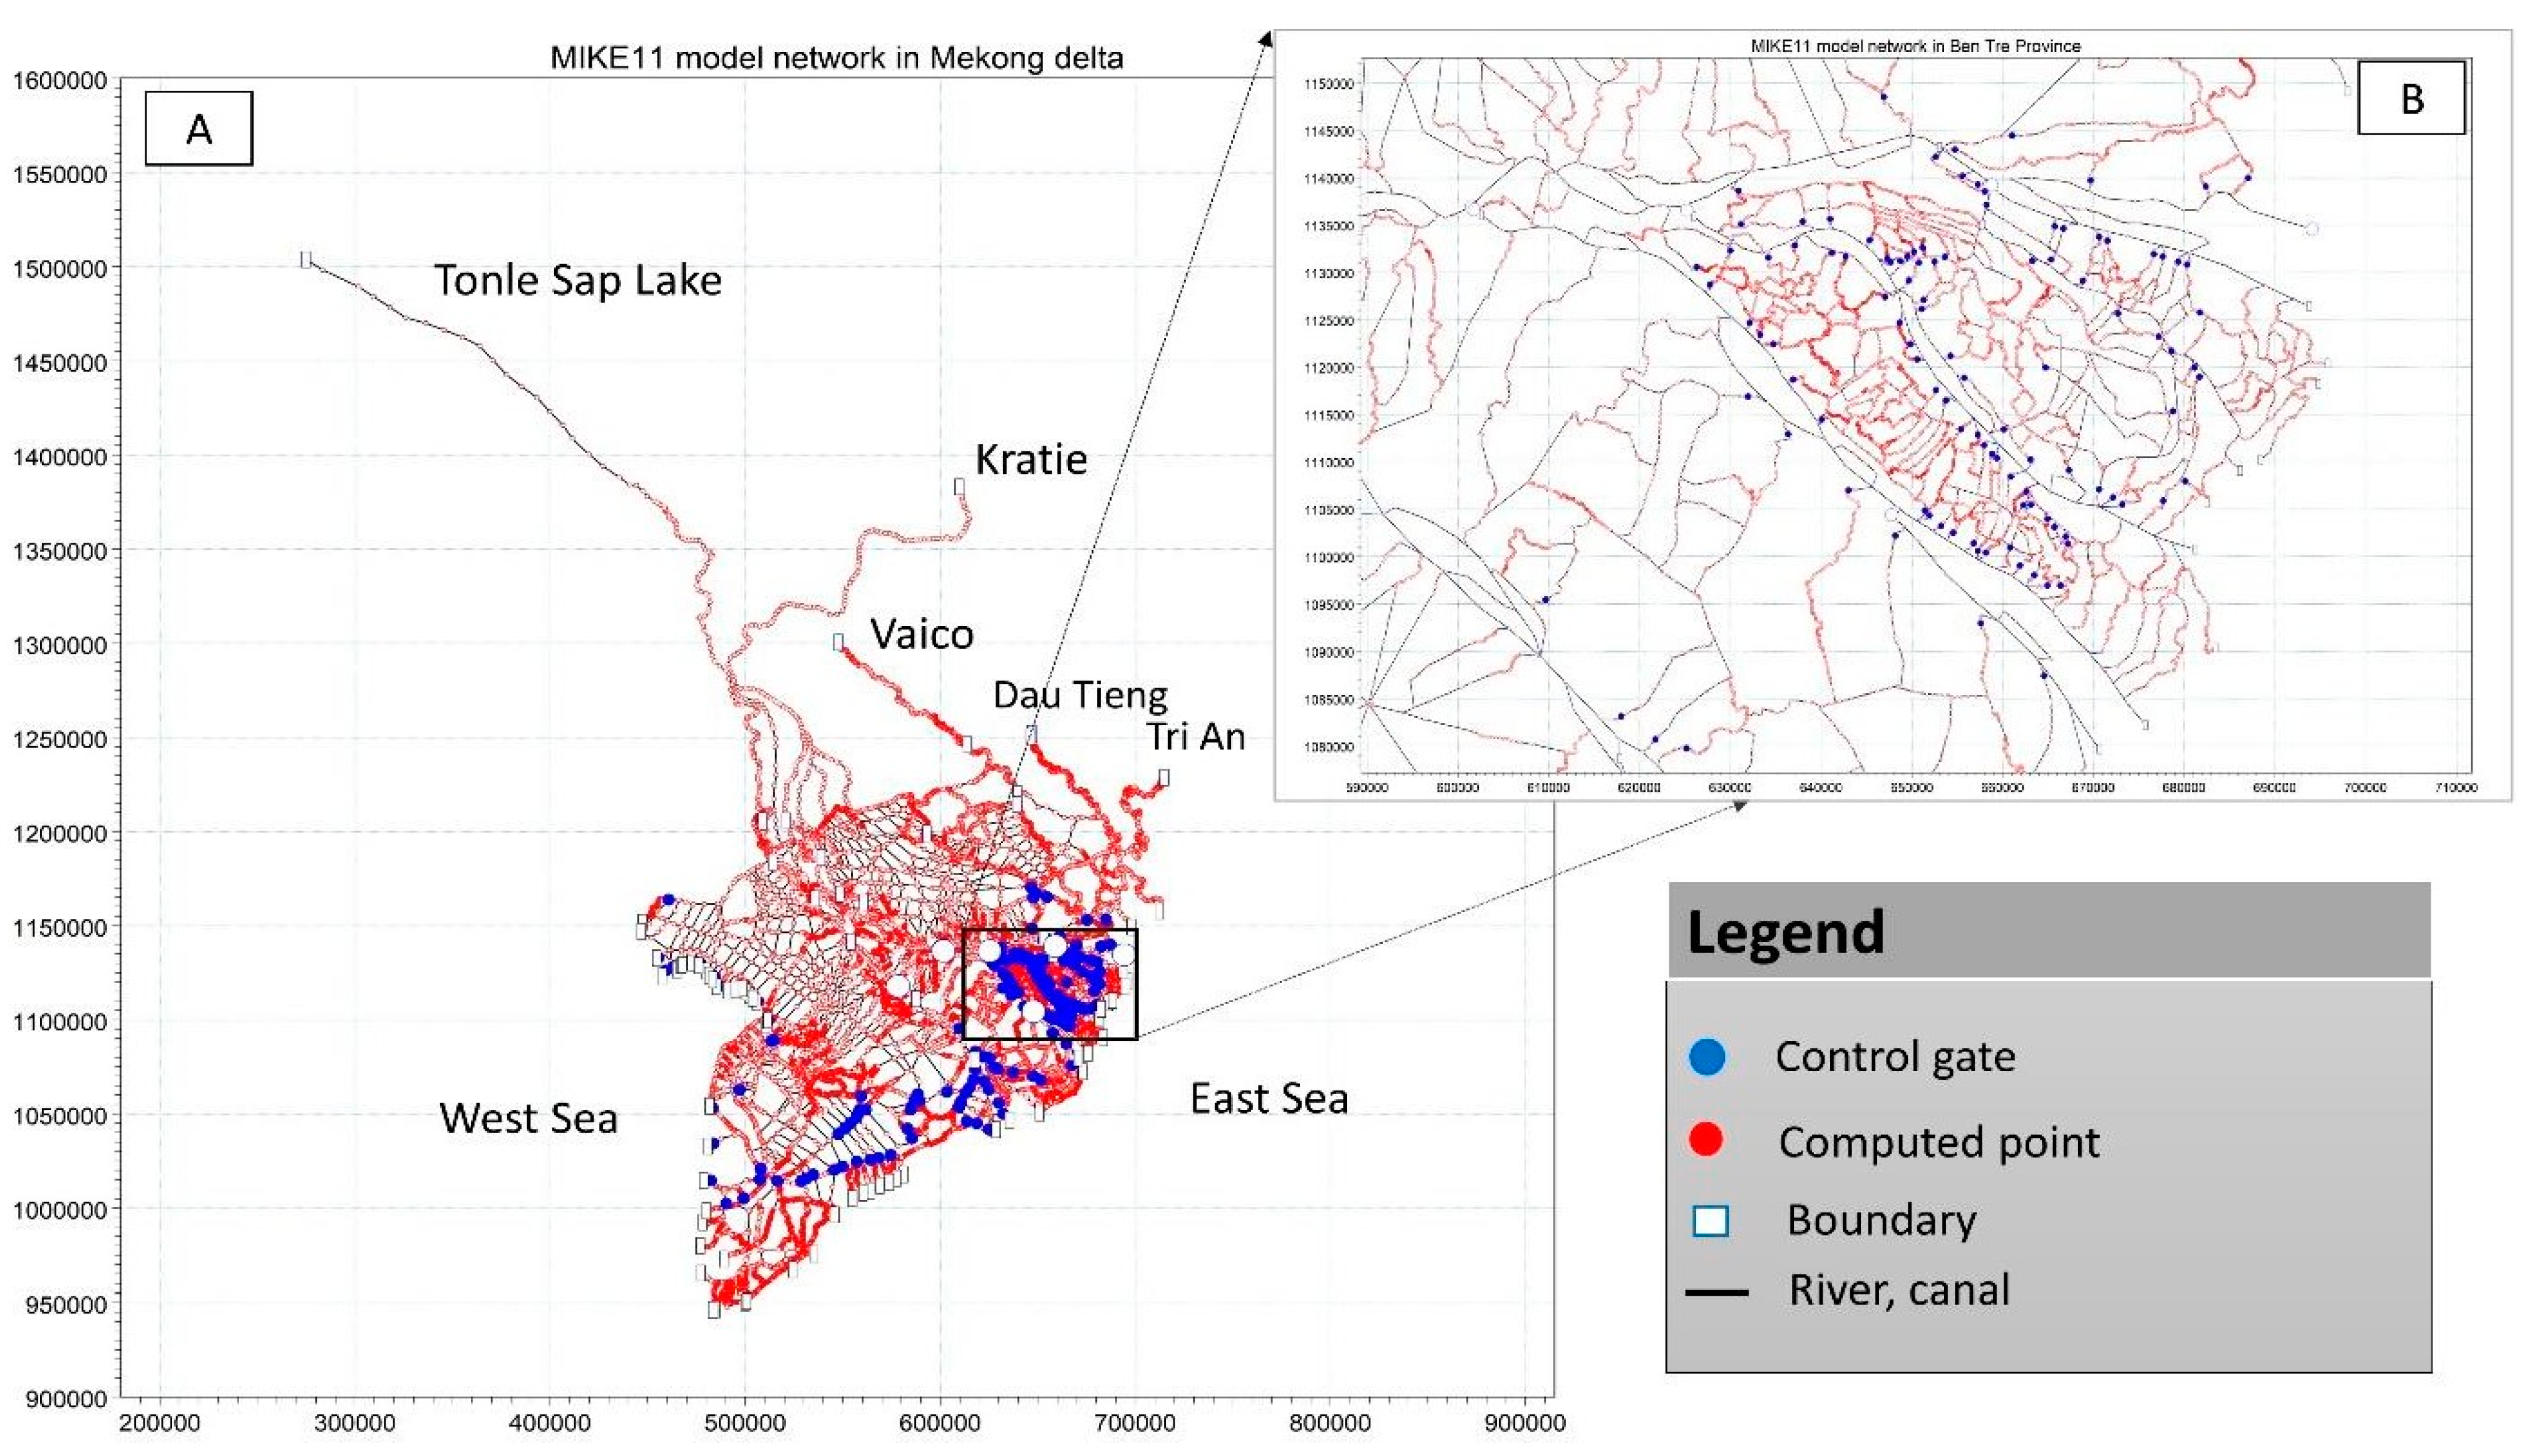
We used the SIWRP’s MIKE11 network for the whole VMD to update on details of primary and secondary canals and sluice gates within Ben Tre Province (Figure 3A,B). This model has been developed by Southern Institute for Water Resources Planning (SIWRP) since the 2000s, as its model network at the delta-wide level is applied to numerous projects, including water resources planning, flood forecast, and water quality projection [57,58,59].
To ensure the accuracy of the MIKE11 model, calibration and validation simulations were conducted for the two extreme dry seasons of 2016 and 2020, respectively. The goodness-of-fit checks between simulated data and observed data were performed using the Nash–Sutcliffe efficiency (NSE) and correlation coefficient (R2), which are common criteria used to evaluate model performance [37,60,61]. The NSE values ranged from 0.9 to 1, with values close to 1 indicating optimal performance, while negative values indicate inadequate performance. The correlation coefficient indicates a linear relationship between two variables, ranging from −1.0 to 1.0, with a value of 0 indicating no significant relationship.
The results of the model performance assessments showed good agreement with value and time variations of calibrated and validated simulation. The NSE values were higher than 0.9, and R2 values ranged from 0.98 to 0.99 at selected stations in the calibration simulation, as shown in Table 1. The highest values of NSE and R2 were found at My Hoa station in Ham Luong River and My Tho station in Tien River compared to other stations in the calibration, with NSE values of 0.97 and R2 values of 0.99.

Simulation Scenarios

Our study includes three scenarios to evaluate the effectiveness of different water management measures (Table 2). The first scenario is the baseline scenario, the so-called Year 2016, which aims to assess the adequacy of the current irrigation system. The year 2016 was selected as it is the historical extreme drought and saline intrusion event over the previous three decades [35,62], making it suitable for the current assessment of water management in Ben Tre Province. The second scenario evaluates the planned measures by 2030, which enclose a part of the province to protect the freshwater environment and mitigate high tide and sea level rises. Finally, hydraulic simulation was carried out for the entire year to determine the incoming flow that is input on the environmental flow calculation.
In scenario 2016, historical datasets were used for the upstream and downstream boundaries in the simulation. The agricultural water demand was calculated as the average value between 2005 and 2020, while the household water demand was calculated based on data from 2020. To assess the impact of climate change on agricultural water demand, the past long-term period of 16 years from 2005 to 2020 was selected for comparison with the agricultural water demand under the scenario in 2030 RCP4.5. For domestic water demand calculation in the current condition, the last available population data in 2020 were chosen.
In the scenario of Year 2030, the projected sea level rise RCP4.5 was added to the water level boundaries, while climate change scenario RCP4.5 (air temperature, precipitation) was used to calculate the agricultural water demand. For the RCP4.5 scenario, a moderate greenhouse emission was selected for our study according to recommendations on selection for climate change scenarios for planning and management [63]. The upstream flow boundary used a 95th percentile flow of the projected flow sequence between 2025 and 2030, which was sourced in a study conducted by Whitehead et al. [64]. The climate change scenarios were referred from Ministry of Natural Resources and Environment of Vietnam (MONRE) in 2020 for the calculations [65]. Under MONRE, six climate models, including CLWRF, PRESIC, CCAM, RegCM, AGCM/RMI, and RCA3, were used to calculate 26 climate scenarios for Vietnam; hence, the climate parameters of RCP4.5 were used for our study. Specifically, the air temperature was projected to increase by 0.7 °C on average, while the rainfall was projected to increase by 17%, and the sea level was projected to rise by 12 cm in the period 2016–2035.
Table 3 shows three possible measures based on the literature. Of those, the Alternate Wetting and Drying (AWD) IRRIGATION measure focuses on reductions of about 40% in water demands by changing the traditional continuous flooded irrigation method to the AWD method [66]. TRC TO FTC measure transforms the triple rice cropping areas into fruit trees. In contrast, TRC TO TWC&AWD IRRIGATION measure combines the agricultural transformation and changes in the irrigation methods. In these measures, interventions are needed to integrate the planned irrigation system to reduce water stress while agricultural sector with triple paddy crop has the largest water consumption among the agricultural water users (e.g., fruit tree, vegetables). Thus, reductions in the water demands for agriculture could minimize the water stress.

4. Results and Discussion

4.1. Water Demand in Comparison with Total Surface Water Availability in 2016 and 2030

Table 4 presents the comparisons of total water demands and water resources for the two scenarios of the years 2016 and 2030, including agriculture, household, and environment, with total freshwater availability in the current and future conditions. In the dry season (December to May), total freshwater availability in the year 2016 was recorded at about 25.5 km3, while it was found to be 23.37 km3 for the year 2030. It means the total water demand of all water users in the dry season was approximately 20% and 22% in the year 2016 and the year 2030, respectively. These results indicate that there is an abundance of freshwater sources for water demand, as found by previous publications such as [10,69].

4.2. Water Management Effeciency of Water Infrastructures

To evaluate the water management efficiency of the irrigation system and the planned irrigation system by 2030, salinity concentrations, duration, and water stress indicators were mapped and compared to evaluate the efficiency of the irrigation system in 2016 and 2030 using five levels of water stress degree (Figure 4 and Figure 5). These indicators based on maps, which are simulated by the MIKE11 model, provide valuable insights into the effectiveness of different management measures for water resources in Ben Tre Province, as recommended by previous studies [9,19].
Maximum saline intrusion in the Year 2016 and Year 2030 scenarios in Figure 4A shows that over 85% of Ben Tre Province is affected by saline intrusion due to the incomplete installation of sluice gates. These results are consistent with a study conducted by the UN in 2020 [70] that salinity intruded extensively in that year in the coastal province in the VMD. In contrast, the planned irrigation system in 2030 effectively protects freshwater areas from saline intrusion, although it is costly in operation and maintenance. However, due to the impacts of climate change, saline intrusion in the mainstream extends further upstream than the baseline scenario, limiting the time for water intake from sluice gates [8,14].
Duration of saline intrusion computed for Year 2016 and Year 2030 scenarios indicates that available days for taking freshwater are reduced in the upper part of the study area in 2030 (Figure 4B). These results could be explained due to increased saline intrusion duration caused by climate change impacts concluded by Tran et al. [9]. These results highlight the importance of effective water management measures to increase the days of freshwater exploitation for agriculture and aquaculture [5,13].
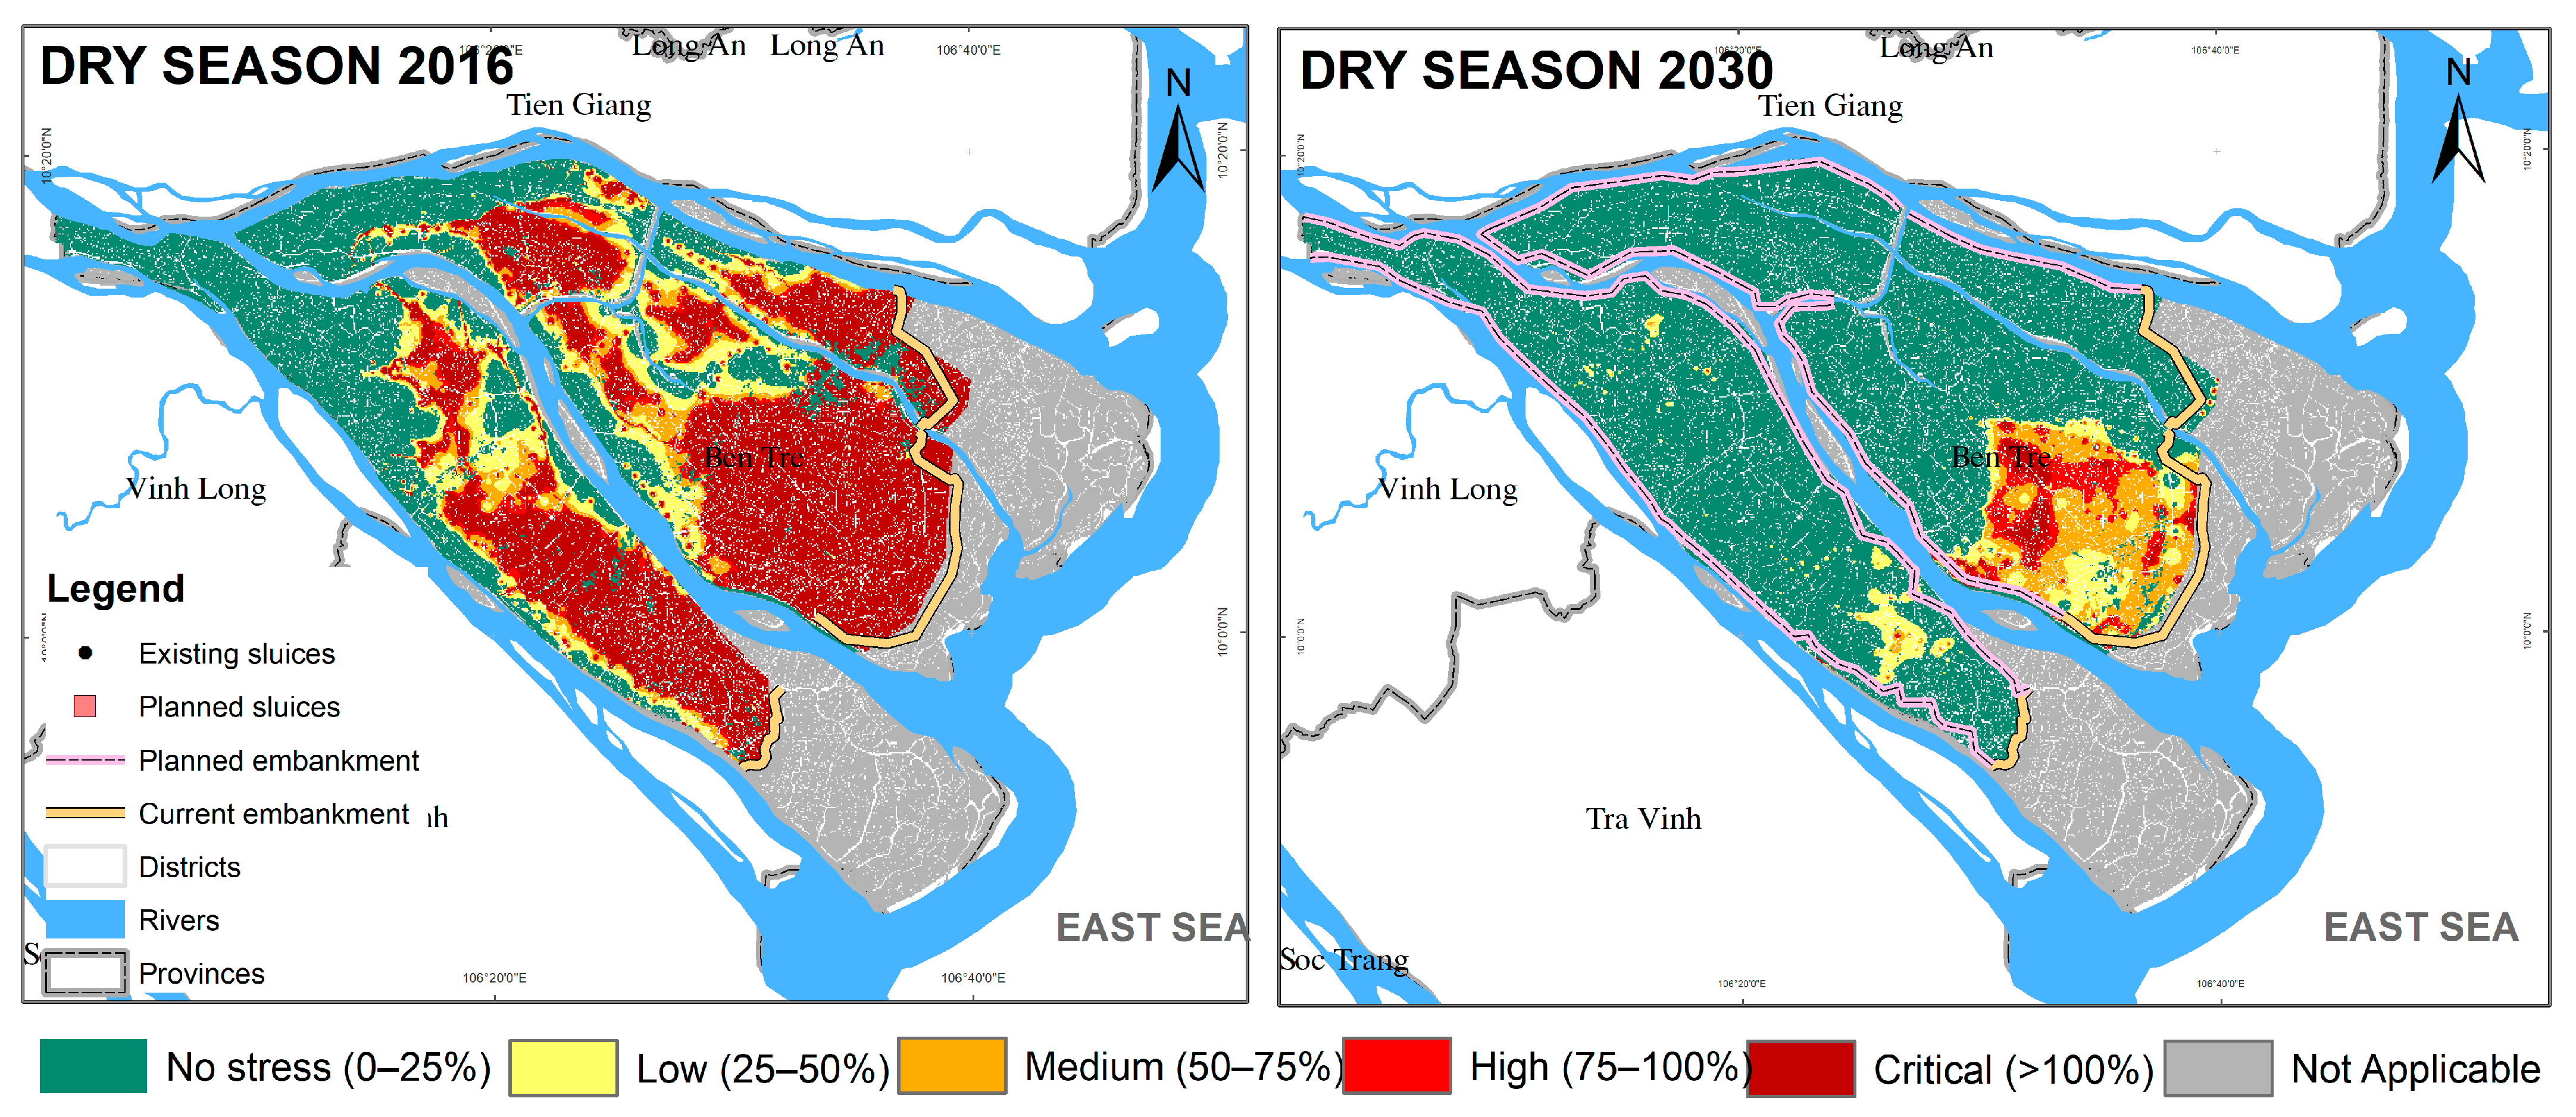
Figure 5 and Table 5 present the water stress status of the Year 2016 and Year 2030 scenarios during the dry season. Most of the freshwater areas are affected by medium water stress, while the water stress of medium to critical accounts for approximately 81,760 ha in 2016 (57.7% of the study area) and 16,220 ha (11.4%) in 2030. It means the planned irrigation system is unable to protect about 11.4% of the study area in 2030 under changing climate. Notably, the “No stress” area increased in the Year 2030 compared to the Year 2016 from the conversion of critical and high water stress, thanks to the effectiveness of the completed water infrastructures to reduce impacts of salinity intrusion driven by climate change (Figure 5). Therefore, additional measures are required to be incorporated into the planned solution to reduce water stress areas [2,11].

4.3. Measure Assessment for Sustainable Water Management

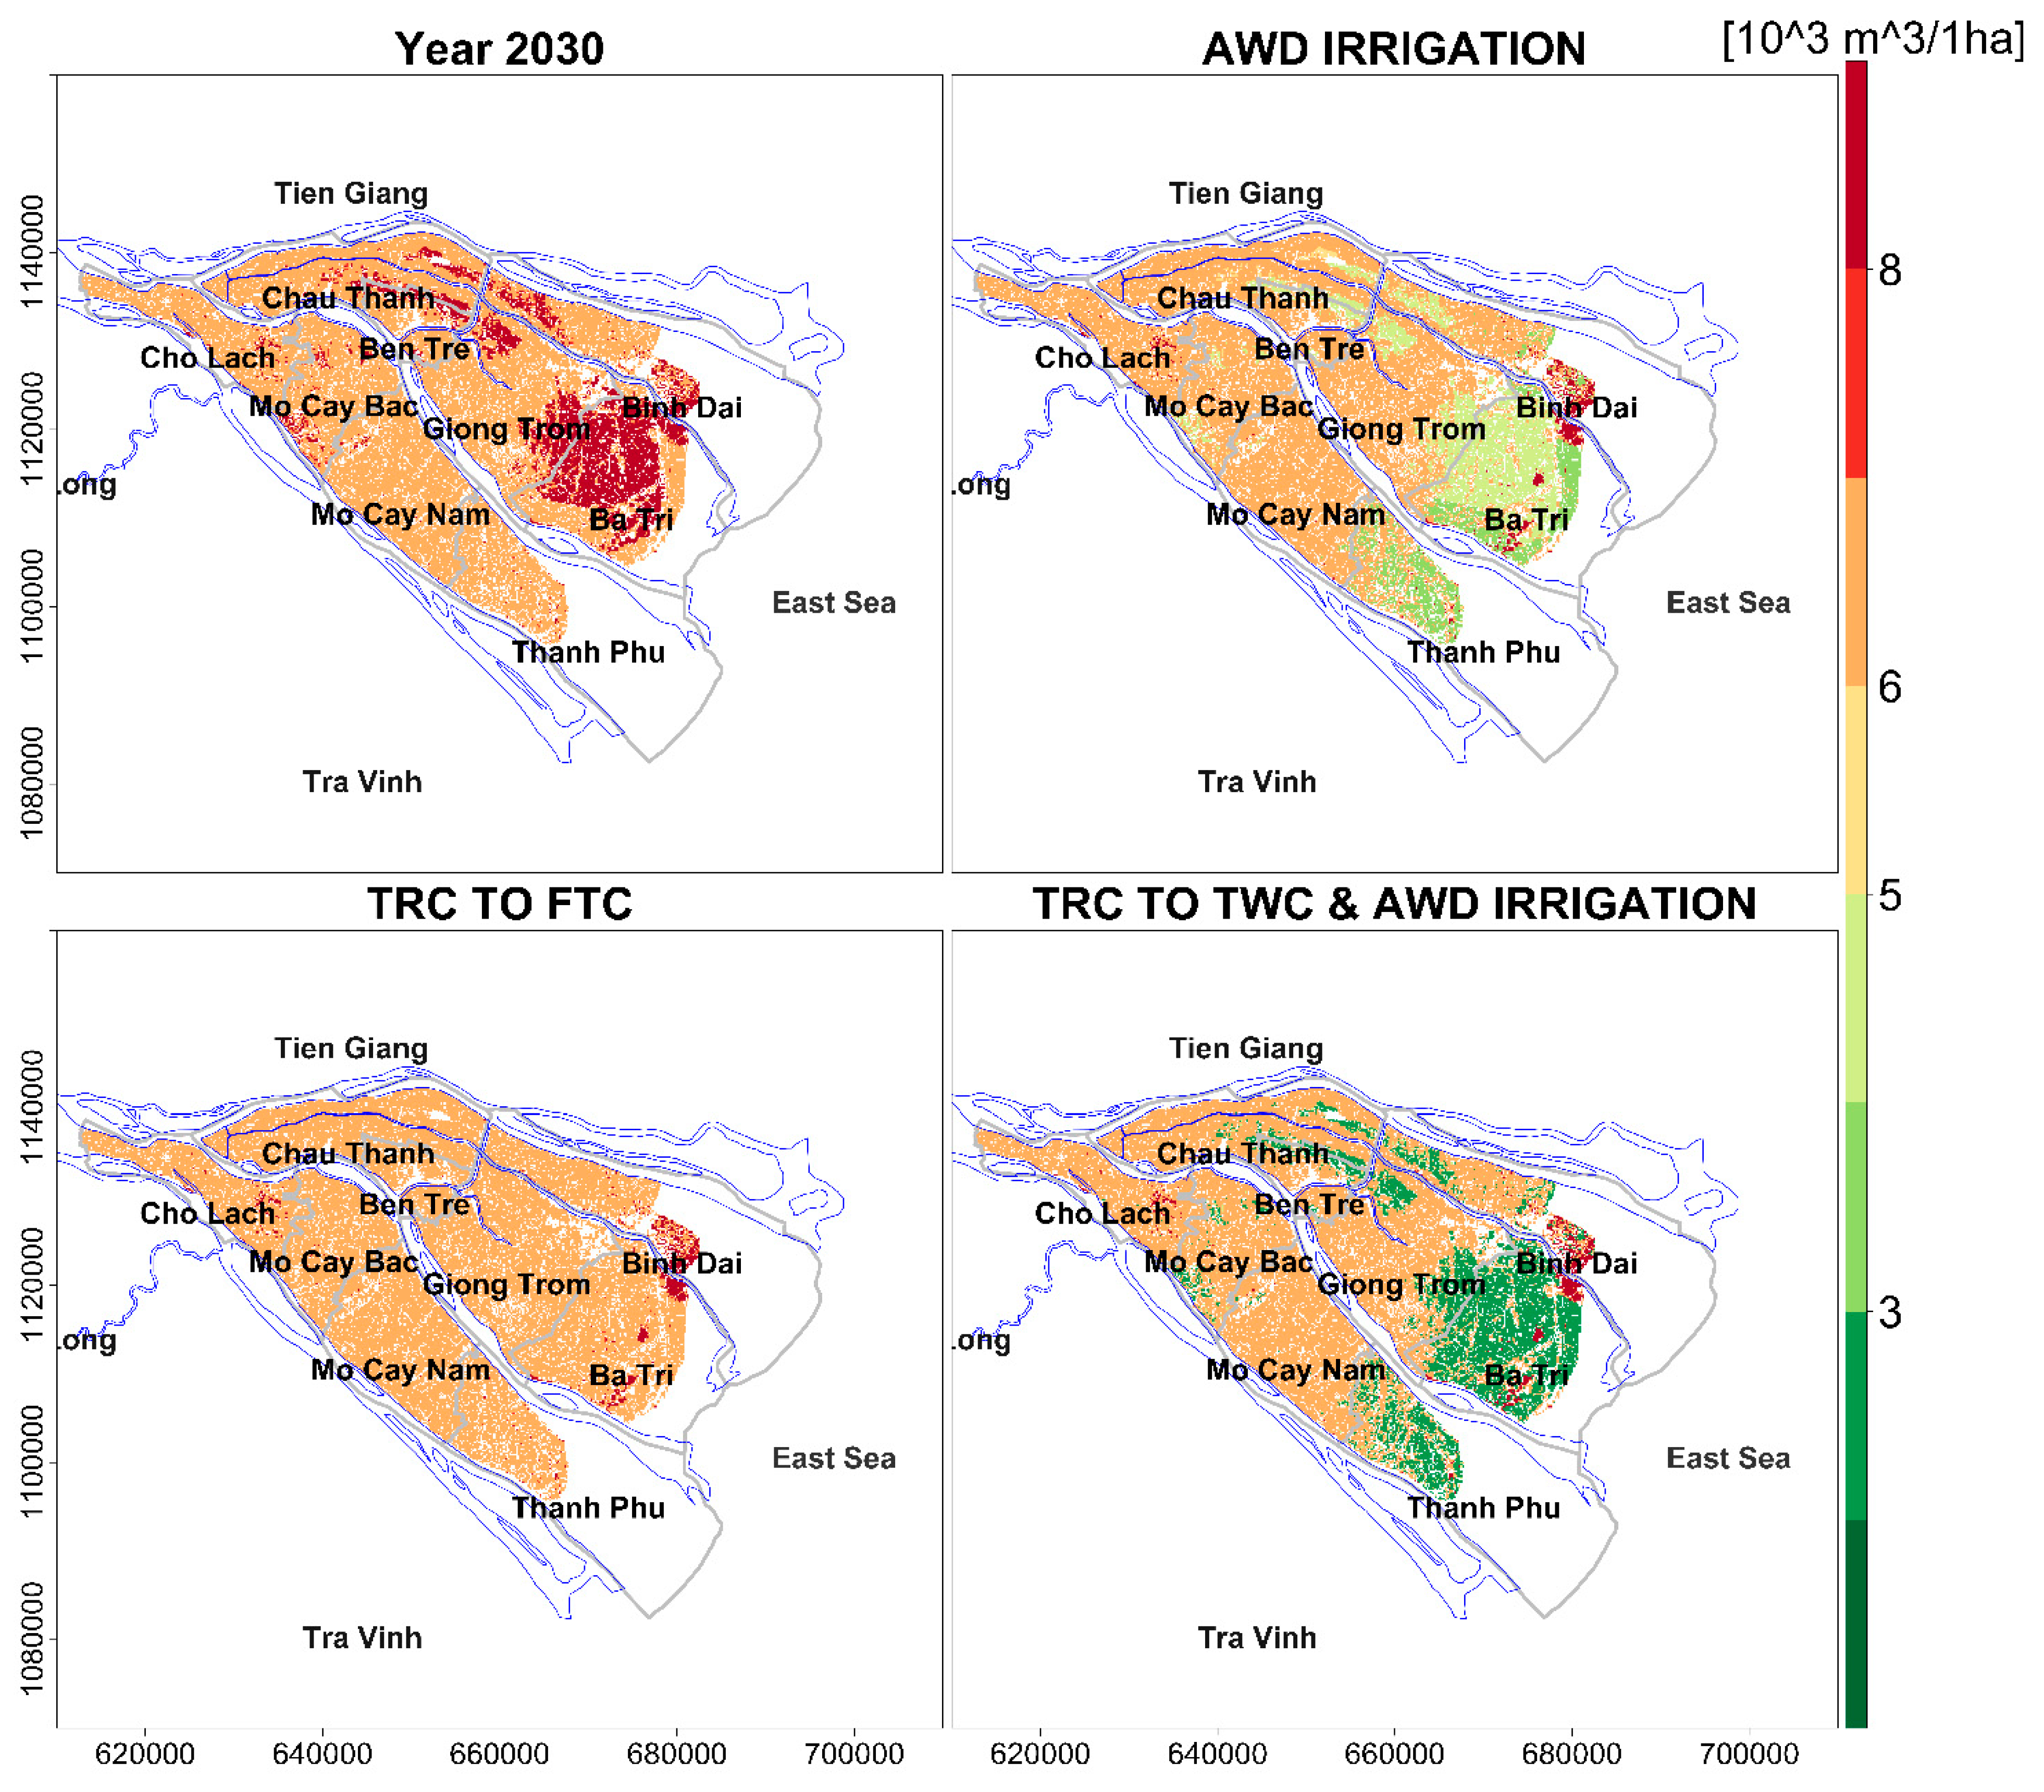
Table 6 compares the agricultural water demand between the Year 2030 scenario and recommended measures. The TRC TO TWC&AWD IRRIGATION measure achieves the most significant water demand reduction, with a reduction of approximately 168.62 million m3 (about 24% of total water demand) compared to the Year 2030 scenario. The AWD IRRIGATION measure reduces water demand by about 102.52 million m3, which is about 13% of the total water demand, while the TRC TO FTC measure cuts off demand by about 29.42 million m3, which is around 3% of the total water demand.
Water demand mapping for the three proposed measures was compared to the Year 2030 scenario (Figure 6). The triple rice paddy area in Ba Tri district is significantly reduced, which demands less than 3 thousand m3 in the TRC TO TWC&AWD IRRIGATION measure. These results demonstrate the effectiveness of management measures for the conversion from triple rice crop to wetting and drying irrigation methods for reducing agricultural water demand and ensuring sustainable water resources [8,9].
In Figure 7, the results show a significant reduction in water stress-affected areas in the TRC TO TWC&AWD IRRIGATION measure and IRRIGATION measure. In contrast, there are small changes in comparison between the TRC TO FTC measure and the Year 2030 scenario. Hence, TRC TO TWC&AWD IRRIGATION and IRRIGATION measures are promising in mitigating water stress and ensuring sustainable water resources.
Table 7 compares in detail the affected areas by water stress shown in Figure 7. The TRC TO TWC&AWD IRRIGATION measure significantly reduces the water stress areas to 4568 ha, which is approximately 3.2% of the total study area, while the AWD IRRIGATION measure decreases the water stress areas to 6558 ha, which is about 4.6% of the entire study area. In contrast, the TRC TO FTC measure decreases the water stress areas to 15,848 ha, which is approximately 11.2% of the total study area. Overall, TRC TO TWC&AWD IRRIGATION is the most effective measure.

5. Conclusions

The aim of our study is to identify suitable solutions to improve water management in Ben Tre Province of the Vietnamese Mekong Delta (VMD) during the dry season, considering the impacts of climate change and anthropogenic (water infrastructure development) factors for the scenarios of 2016 and 2030. To achieve this, we applied a water accounting framework based on the MIKE11 hydrodynamic model and water balance calculations to determine current and future water stress issues and improve water management sustainability. Our study provides valuable insights into effective water management measures to ensure sustainable water resources in Ben Tre Province. Three primary water users were identified in the study, involving agriculture, household, and ecosystems, which are implied by three pillars of sustainable development: economic development, social well-being, and environmental protection in the study area dominated by agricultural productions. Our findings help draw three conclusions.
  • The province has abundant amounts of surface water resources of about 25.5 km3 and 23.3 km3 of water available in the dry season for the scenarios of the extreme drought year 2016 and the future year 2030, which is much higher than the total water demand of 5.215 km3 and 5.234 km3. However, these water resources are unevenly distributed temporally and spatially in the study area. Moreover, saline water intrusion significantly causes severe water stress in the study area, highlighting the importance of effective water management measures to mitigate the impacts of saline intrusion and ensure sustainable water resources, especially in the future under increasing climate change impacts.
  • The existing water management methods are inadequate for controlling saline intrusion, leading to over 57% of areas being affected by the medium to critical water stress level. The planned solution by 2030 significantly improves water management but still leaves around 11.4% of areas affected by the medium water stress level, despite that structural measures fully enclose the study area. Our study concludes that the governments at multiple levels should invest in long-term, more sustainable measures (structural and non-structural measures) for not only Ben Tre but also other coastal provinces in a master plan in the VMD. These measures should be completed in different systems to maximize the effectiveness.
  • Three measures are proposed to be incorporated into the planned irrigation system, focusing on water-saving and water demand reduction in the study area. The results showed that regions affected by water stress from medium to critical levels were reduced to 11.2%, 4.6%, and 3.2% of the total study area in the TRC TO FTC, AWD IRRIGATION, and TRC TO TWC & AWD IRRIGATION measures, respectively. Among these measures, the TRC TO TWC & AWD IRRIGATION measure is the most suitable measure to be added to the planned irrigation system towards more sustainable water management by 2030.

Author Contributions

Conceptualization, Writing, Edit, N.T.N. and P.T.B.T.; Structure, Writing, Maps and Graph, and Edit, N.T.N.; Writing, Comments, and Correspondence, P.T.B.T., D.A.D., D.D.T. and N.D.T.; Review, N.H.A. All authors have read and agreed to the published version of the manuscript.

Funding

This research received no external funding.

Institutional Review Board Statement

Not applicable.

Informed Consent Statement

Not applicable.

Data Availability Statement

Data are available from the authors upon reasonable request.

Acknowledgments

The authors thank the Vietnam Academy of Science and Technology for funding the research at the ĐLTE00.08/21-22. The paper is part of a master’s thesis on the application of a water accounting framework for sustainable water management in the Ben Tre province in the Vietnamese Mekong Delta under the pressures of climate change and anthropogenic stresses, which was supervised by Britta Schmalz, from Engineering Hydrology and Water Management, and Paula Grosser at Tu-Darmstadt University. The authors would greatly appreciate supervisors’ valuable comments, advice, and recommendations for the thesis study.

Conflicts of Interest

The authors declare no conflict of interest.

Appendix A

Table A1. Hydro-meteorological stations and parameters in the study. The hourly data in 2016 and 2020 were used for the model performance assessments, while daily and monthly data were collected from 2005 to 2020 and from 2000 to 2020, respectively.
Station NameParametersData Frequency
HourlyDailyMonthly
Ben TraiWater level; Salt2016, 2020
An Thuan2016, 2020
Binh Dai2016, 2020
My Hoa2016, 2020
Cho LachWater level2016, 2020
My ThuanWater level; Flow2016, 2020
Huong MySalt2016, 2020 2000–2020
Dong TamSalt2016, 2020 2000–2020
Son DocSalt2016, 2020 2000–2020
An DinhSalt2016, 2020 2000–2020
Giao HoaSalt2016, 2020 2000–2020
Loc ThuanSalt2016, 2020 2000–2020
Ba TriRainfall; Air Temperature; Wind; Humidity; Sunshine 2005–20202005–2020
Ben Tre 2005–20202005–2020
My Tho 2005–20202005–2020
Cang Long 2005–20202005–2020
Tra VinhRainfall 2005–2020
Cai Lay 2005–2020
Go Cong Dong 2005–2020
Figure A1. Existing land use of the Ben Tre Province (2020) and main cropping patterns and the calendars in the study area (source: [34] modified by the authors).
Sustainability 15 09110 g0a1

References

  1. Dhakal, C.; Khadka, S.; Park, C.; Escalante, C.L. Climate change adaptation and its impacts on farm income and downside risk exposure. Resour. Environ. Sustain. 2022, 10, 100082. [Google Scholar] [CrossRef]
  2. Nguyen, H.Q.; Tran, D.D.; Luan, P.D.M.H.; Ho, L.H.; Loan, V.T.K.; Anh Ngoc, P.T.; Quang, N.D.; Wyatt, A.; Sea, W. Socio-ecological resilience of mangrove-shrimp models under various threats exacerbated from salinity intrusion in coastal area of the Vietnamese Mekong Delta. Int. J. Sustain. Dev. World Ecol. 2020, 27, 638–651. [Google Scholar] [CrossRef]
  3. Tran, D.D.; Huu, L.H.; Hoang, L.P.; Pham, T.D.; Nguyen, A.H. Sustainability of rice-based livelihoods in the upper floodplains of Vietnamese Mekong Delta: Prospects and challenges. Agric. Water Manag. 2021, 243, 106495. [Google Scholar] [CrossRef]
  4. Tran, D.D.; van Halsema, G.; Hellegers, P.J.G.J.; Hoang, L.P.; Ludwig, F. Long-term sustainability of the Vietnamese Mekong Delta in question: An economic assessment of water management alternatives. Agric. Water Manag. 2019, 223, 105703. [Google Scholar] [CrossRef]
  5. Tran, D.D.; van Halsema, G.; Hellegers, P.J.; Ludwig, F.; Wyatt, A. Questioning triple rice intensification on the Vietnamese Mekong Delta floodplains: An environmental and economic analysis of current land-use trends and alternatives. J. Environ. Manag. 2018, 217, 429–441. [Google Scholar] [CrossRef]
  6. Giang, N.N.; Quang, C.N.; Long, D.T.; Ky, P.D.; Vu, N.D.; Tran, D.D. Statistical and Hydrological Evaluations of Water Dynamics in the Lower Sai Gon-Dong Nai River, Vietnam. Water 2022, 14, 130. [Google Scholar] [CrossRef]
  7. Loc, H.H.; Low Lixian, M.; Park, E.; Dung, T.D.; Shrestha, S.; Yoon, Y.-J. How the saline water intrusion has reshaped the agricultural landscape of the Vietnamese Mekong Delta, a review. Sci. Total Environ. 2021, 794, 148651. [Google Scholar] [CrossRef]
  8. Loc, H.H.; Van Binh, D.; Park, E.; Shrestha, S.; Dung, T.D.; Son, V.H.; Truc, N.H.T.; Mai, N.P.; Seijger, C. Intensifying saline water intrusion and drought in the Mekong Delta: From physical evidence to policy outlooks. Sci. Total Environ. 2021, 757, 143919. [Google Scholar] [CrossRef]
  9. Tran, D.D.; Dang, M.M.; Du Duong, B.; Sea, W.; Thang, V.T. Livelihood vulnerability and adaptability of coastal communities to extreme drought and salinity intrusion in the Vietnamese Mekong Delta. Int. J. Disaster Risk Reduct. 2021, 57, 102183. [Google Scholar] [CrossRef]
  10. Nguyen, Q.H.; Tran, D.D.; Dang, K.K.; Korbee, D.; Pham, L.D.M.H.; Vu, L.T.; Luu, T.T.; Ho, L.H.; Nguyen, P.T.; Ngo, T.T.T.; et al. Land-use dynamics in the Mekong delta: From national policy to livelihood sustainability. Sustain. Dev. 2020, 28, 448–467. [Google Scholar] [CrossRef]
  11. Ijaz, M.W.; Mahar, R.B.; Ansari, K.; Siyal, A.A. Optimization of salinity intrusion control through freshwater and tidal inlet modifications for the Indus River Estuary. Estuar. Coast. Shelf Sci. 2019, 224, 51–61. [Google Scholar] [CrossRef]
  12. Montagna, P.A.; Kalke, R.D.; Ritter, C. Effect of restored freshwater inflow on macrofauna and meiofauna in upper Rincon Bayou, Texas, USA. Estuaries 2002, 25, 1436–1447. [Google Scholar] [CrossRef]
  13. Kaushal, S.S.; Likens, G.E.; Pace, M.L.; Utz, R.M.; Haq, S.; Gorman, J.; Grese, M. Freshwater salinization syndrome on a continental scale. Proc. Natl. Acad. Sci. USA 2018, 115, E574–E583. [Google Scholar] [CrossRef] [PubMed] [Green Version]
  14. Rahman, M.M.; Penny, G.; Mondal, M.S.; Zaman, M.H.; Kryston, A.; Salehin, M.; Nahar, Q.; Islam, M.S.; Bolster, D.; Tank, J.L.; et al. Salinization in large river deltas: Drivers, impacts and socio-hydrological feedbacks. Water Secur. 2019, 6, 100024. [Google Scholar] [CrossRef]
  15. Noe, G.B.; Krauss, K.W.; Lockaby, B.G.; Conner, W.H.; Hupp, C.R. The effect of increasing salinity and forest mortality on soil nitrogen and phosphorus mineralization in tidal freshwater forested wetlands. Biogeochemistry 2013, 114, 225–244. [Google Scholar] [CrossRef] [Green Version]
  16. Yang, S.; Liu, J.; Lin, P.; Jiang, C. Coastal Reservoir Strategy and Its Applications. In Water Resources Planning, Development and Management; InTech: Horwich, UK, 2013. [Google Scholar]
  17. Sun, Y.; Tong, S.T.Y.; Fang, M.; Yang, Y.J. Exploring the effects of population growth on future land use change in the Las Vegas Wash watershed: An integrated approach of geospatial modeling and analytics. Environ. Dev. Sustain. 2013, 15, 1495–1515. [Google Scholar] [CrossRef]
  18. Trung, N.H.; Tri, V.P.D. 10—Possible Impacts of Seawater Intrusion and Strategies for Water Management in Coastal Areas in the Vietnamese Mekong Delta in the Context of Climate Change. In Coastal Disasters and Climate Change in Vietnam; Thao, N.D., Takagi, H., Esteban, M., Eds.; Elsevier: Oxford, UK, 2014; pp. 219–232. ISBN 978-0-12-800007-6. [Google Scholar]
  19. Park, E.; Loc, H.H.; Van Binh, D.; Kantoush, S. The worst 2020 saline water intrusion disaster of the past century in the Mekong Delta: Impacts, causes, and management implications. Ambio 2022, 51, 691–699. [Google Scholar] [CrossRef]
  20. Korbee, D.; Quan, N.H.; Hermans, L.; Long, P.H. Navigating the bureaucracy: An analysis of implementation feasibility for the Mekong Delta Plan, Vietnam. J. Environ. Plan. Manag. 2019, 62, 1545–1561. [Google Scholar] [CrossRef] [Green Version]
  21. Nguyen, L.A.; Pham, V.T.B.; Bosma, R.; Verreth, J.; Leemans, R.; De Silva, S.; Lansink, A.O. Impact of Climate Change on the Technical Efficiency of Striped Catfish, Pangasianodon hypophthalmus, Farming in the Mekong Delta, Vietnam. J. World Aquac. Soc. 2018, 49, 570–581. [Google Scholar] [CrossRef] [Green Version]
  22. Nguyen, T.P.; Luom, T.T.; Parnell, K.E. Mangrove allocation for coastal protection and livelihood improvement in Kien Giang province, Vietnam: Constraints and recommendations. Land Use Policy 2017, 63, 401–407. [Google Scholar] [CrossRef]
  23. Tran, T.A. Land use change driven out-migration: Evidence from three flood-prone communities in the Vietnamese Mekong Delta. Land Use Policy 2019, 88, 104157. [Google Scholar] [CrossRef]
  24. Nguyen, K.A.T.; Jolly, C.M.; Bui, C.N.P.T.; Le, T.T.H. Aquaculture and poverty alleviation in Ben Tre Province, Vietnam. Aquac. Econ. Manag. 2016, 20, 82–108. [Google Scholar] [CrossRef]
  25. Renaud, F.G.; Le, T.T.H.; Lindener, C.; Guong, V.T.; Sebesvari, Z. Resilience and shifts in agro-ecosystems facing increasing sea-level rise and salinity intrusion in Ben Tre Province, Mekong Delta. Clim. Chang. 2015, 133, 69–84. [Google Scholar] [CrossRef]
  26. Nguyen, M.N.; Nguyen, P.T.B.; Van, T.P.D.; Phan, V.H.; Nguyen, B.T.; Pham, V.T.; Nguyen, T.H. An understanding of water governance systems in responding to extreme droughts in the Vietnamese Mekong Delta. Int. J. Water Resour. Dev. 2021, 37, 256–277. [Google Scholar] [CrossRef]
  27. Berg, H.; Tam, N.T. Decreased use of pesticides for increased yields of rice and fish-options for sustainable food production in the Mekong Delta. Sci. Total Environ. 2018, 619–620, 319–327. [Google Scholar] [CrossRef]
  28. Kondolf, G.M.; Schmitt, R.J.P.; Carling, P.; Darby, S.; Arias, M.; Bizzi, S.; Castelletti, A.; Cochrane, T.A.; Gibson, S.; Kummu, M.; et al. Changing sediment budget of the Mekong: Cumulative threats and management strategies for a large river basin. Sci. Total Environ. 2018, 625, 114–134. [Google Scholar] [CrossRef] [Green Version]
  29. Anh, D.T.; Hoang, L.P.; Bui, M.D.; Rutschmann, P. Simulating future flows and salinity intrusion using combined one- and two-dimensional hydrodynamic modelling-the case of Hau River, Vietnamese Mekong Delta. Water 2018, 10, 897. [Google Scholar]
  30. Pham, L.D.M.H.; Guerra, J.D.P.; Nguyen, H.Q.; Korbee, D.; Tran, D.D.; Ho, L.H.; Do, Q.H.; Luu, T.; Gorman, T.; Hermans, L. Socio-hydrological approach for farmer adaptability to hydrological changes: A case study in salinity-controlled areas of the Vietnamese Mekong Delta. Hydrol. Sci. J. 2022, 67, 495–507. [Google Scholar] [CrossRef]
  31. Karila, K.; Nevalainen, O.; Krooks, A.; Karjalainen, M.; Kaasalainen, S. Monitoring Changes in Rice Cultivated Area from SAR and Optical Satellite Images in Ben Tre and Tra Vinh Provinces in Mekong Delta, Vietnam. Remote Sens. 2014, 6, 4090–4108. [Google Scholar] [CrossRef] [Green Version]
  32. Haskoning, D.H.V.R.; Wageningen, U.R.; Deltares, R. Mekong Delta Plan: Long-Term Vision and Strategy for a Safe, Prosperous and Sustainable Delta. 2013. Available online: https://data.opendevelopmentmekong.net/library_record/mekong-delta-plan-long-term-vision-and-strategy-for-a-safe-prosperous-and-sustainable-delta (accessed on 13 May 2023).
  33. Overview of Ben Tre|BENTREPortal. Available online: https://en.bentre.gov.vn/information/2019/02/overview-of-ben-tre (accessed on 13 May 2023).
  34. JICA. The Preparatory Survey for Ben Tre Water Management Project; JICA: Tokyo, Japan, 2016.
  35. Viet Nam Disaster Management Authority. Saltwater Intrusion and Drought Damage in the Mekong Delta in 2016. Office of the Central Steering Committee for Natural Disaster Prevention and Control; Viet Nam Disaster Management Authority: Ho Chi Minh, VietNam, 2016. [Google Scholar]
  36. Van Binh, D.; Kantoush, S.A.; Saber, M.; Mai, N.P.; Maskey, S.; Phong, D.T.; Sumi, T. Long-term alterations of flow regimes of the Mekong River and adaptation strategies for the Vietnamese Mekong Delta. J. Hydrol. Reg. Stud. 2020, 32, 100742. [Google Scholar] [CrossRef]
  37. Eslami, S.; Hoekstra, P.; Nguyen Trung, N.; Ahmed Kantoush, S.; Van Binh, D.; Duc Dung, D.; Tran Quang, T.; van der Vegt, M. Tidal amplification and salt intrusion in the Mekong Delta driven by anthropogenic sediment starvation. Sci. Rep. 2019, 9, 18746. [Google Scholar] [CrossRef] [PubMed] [Green Version]
  38. MRC. Situation Report on Dry Season Hydrological Conditions in the Lower Mekong River Basin: November 2020–May 2021; MRC Secretariat: Vientiane, Laos, 2021. [Google Scholar]
  39. VNS. Drought, Saltwater Dry up Mekong Delta’s Largest Reservoir. Available online: https://vietnamnews.vn/society/716046/drought-saltwater-dry-up-mekong-delta-s-largest-reservoir.html (accessed on 13 May 2023).
  40. General Statistics Office. Viet Nam Population Projection for the Period 2019–2069; General Statistics Office: Hanoi, Vietnam, 2020.
  41. Kam, S.P.; Hoanh, C.T.; Tuong, T.P.; Khiem, N.T.; Dung, L.C.; Phong, N.D.; Barr, J.; Ben, D.C. Managing Water and Land Resources under Conflicting Demands of Shrimp and Rice Production for Sustainable Livelihoods in the Mekong River Delta, Vietnam. CIAT. 2001, pp. 28–31. Available online: https://www.researchgate.net/publication/228918810_Managing_water_and_land_resources_under_conflicting_demands_of_shrimp_and_rice_production_for_sustainable_livelihoods_in_the_Mekong_River_Delta_Vietnam (accessed on 13 May 2023).
  42. MONRE. Groundwater in Long An, Tien Giang and Ben Tre, Viet Nam; MONRE: Cầu Giấy, Vietnam, 2016.
  43. Granados, O.H. Numerical Modelling as a Key Tool in the Decision-Making Process for Water Resources Management. 2010. Available online: https://www.researchgate.net/publication/278679107_Numerical_modelling_as_a_key_tool_in_the_decision-making_process_for_water_resources_management (accessed on 13 May 2023).
  44. FAO; WWC. Water Accounting for Water Governance and Sustainable Development: White Paper. 2018. Available online: https://www.fao.org/3/I8868EN/i8868en.pdf (accessed on 13 May 2023).
  45. FAO. Water Quality for Agriculture: Water Quality Evaluation; FAO: Rome, Italy, 1979. [Google Scholar]
  46. Droogers, P.; Simons, G.; Bastiaanssen, W.; Hoogeveen, J. Water Accounting Plus (WA+) in the Okavango River Basin. 2010. Available online: https://www.researchgate.net/publication/282002922_Water_Accounting_Plus_WA_in_the_Okavango_River_Basin (accessed on 13 May 2023).
  47. Dickens, C.; Smakhtin, V.; Biancalani, R.; Villholth, K.G.; Eriyagama, N.; Marinelli, M. Incorporating Environmental Flows into “Water Stress” Indicator 6.4.2; FAO (Food and Agriculture Organization of the United Nations): Rome, Italy, 2019. [Google Scholar]
  48. FAO. Irrigation Water Management: Irrigation Water Needs; FAO: Rome, Italy, 1986; Volume 3. [Google Scholar]
  49. Chapter 4—Determination of ETo|FAO. Available online: https://www.fao.org/3/x0490e/x0490e08.htm (accessed on 13 May 2023).
  50. Salvadore, E.; Michailovsky, C.; Coerver, B.; Bastiaanssen, W.; IHE-Delft, W.A.E. Water Accounting in Selected Asian River Basins: Pilot Study in Cambodia; FAO: Rome, Italy, 2017. [Google Scholar]
  51. Batchelor, C.; Hoogeveen, J.; Faurès, J.-M.; Peiser, L. Water Accounting and Auditing. A Sourcebook; FAO: Rome, Italy, 2016. [Google Scholar]
  52. Hunink, J.; Simons, G.; Suárez-Almiñana, S.; Solera, A.; Andreu, J.; Giuliani, M.; Zamberletti, P.; Grillakis, M.; Koutroulis, A.; Tsanis, I. A simplified water accounting procedure to assess climate change impact on water resources for agriculture across different European river basins. Water 2019, 11, 1976. [Google Scholar] [CrossRef] [Green Version]
  53. Mansour, M.M.; Ibrahim, M.G.; Fujii, M.; Nasr, M. Sustainable development goals (SDGs) associated with flash flood hazard mapping and management measures through morphometric evaluation. Geocarto Int. 2022, 37, 11116–11133. [Google Scholar] [CrossRef]
  54. Saqr, A.M.; Ibrahim, M.G.; Fujii, M.; Nasr, M. Sustainable Development Goals (SDGs) Associated with Groundwater Over-Exploitation Vulnerability: Geographic Information System-Based Multi-criteria Decision Analysis. Nat. Resour. Res. 2021, 30, 4255–4276. [Google Scholar] [CrossRef]
  55. Molden, D.; Sakthivadivel, R. Water Accounting to Assess Use and Productivity of Water. Int. J. Water Resour. Dev. 1999, 15, 55–71. [Google Scholar] [CrossRef]
  56. DHI. Reference Manual: A Modelling System for Rivers and Channels; DHI: Aarhus, Denmark, 2014. [Google Scholar]
  57. SIWRP. (2014–2021) Project on Flood Forecasting to Support the Cultivation Management in the Vietnamese Mekong Delta. Available online: https://siwrp.org.vn/news/khu-vuc-dbscl_435.html (accessed on 13 May 2023).
  58. SIWRP. (2016–2021) Project on Monitoring and Forecasting in the Water Quality to Support the Sluice Operation of Nam Mang Thit Irrigation System. Available online: https://siwrp.org.vn/admin/upload/BT_NMT_tuan_08_2023.pdf (accessed on 13 May 2023).
  59. SIWRP. (2016–2021) Project on Monitoring and Forecasting in the Water Quality to Support the Sluice Operation of O MON XA NO Irrigation System. Available online: https://siwrp.org.vn/admin/upload/BT_OMXN_tuan_08_2023.pdf (accessed on 13 May 2023).
  60. Duc Tran, D.; van Halsema, G.; Hellegers, P.J.G.J.; Phi Hoang, L.; Quang Tran, T.; Kummu, M.; Ludwig, F. Assessing impacts of dike construction on the flood dynamics of the Mekong Delta. Hydrol. Earth Syst. Sci. 2018, 22, 1875–1896. [Google Scholar] [CrossRef] [Green Version]
  61. Triet, N.V.K.; Dung, N.V.; Fujii, H.; Kummu, M.; Merz, B.; Apel, H. Has dyke development in the Vietnamese Mekong Delta shifted flood hazard downstream? Hydrol. Earth Syst. Sci. 2017, 21, 3991–4010. [Google Scholar] [CrossRef] [Green Version]
  62. Sebastian, L.S.; Sander, B.O.; Simelton, E.; Hoanh, C.T. The Drought and Salinity Intrusion in the Mekong River Delta of Vietnam—Assessment Report; CGIAR Research Centers: Hanoi, Vietnam, 2016. [Google Scholar]
  63. MONRE. Climate Change and Sea Level Rise Scenarios for Viet Nam; MONRE: Cầu Giấy, Vietnam, 2020.
  64. Whitehead, P.G.; Jin, L.; Bussi, G.; Voepel, H.E.; Darby, S.E.; Vasilopoulos, G.; Manley, R.; Rodda, H.; Hutton, C.; Hackney, C. Water quality modelling of the Mekong River basin: Climate change and socioeconomics drive flow and nutrient flux changes to the Mekong Delta. Sci. Total Environ. 2019, 673, 218–229. [Google Scholar] [CrossRef] [Green Version]
  65. MONRE. Climate Change and Sea Level Rise Scenarios 2020; MONRE: Hanoi, Vietnam, 2020.
  66. Yamaguchi, T.; Tuan, L.; Minamikawa, K.; Yokoyama, S. Alternate Wetting and Drying (AWD) Irrigation Technology Uptake in Rice Paddies of the Mekong Delta, Vietnam: Relationship between Local Conditions and the Practiced Technology. Asian Afr. Area Stud. 2016, 15, 234–256. [Google Scholar]
  67. Arai, H.; Hosen, Y.; Chiem, N.H.; Inubushi, K. Alternate wetting and drying enhanced the yield of a triple-cropping rice paddy of the Mekong Delta. Soil Sci. Plant Nutr. 2021, 67, 493–506. [Google Scholar] [CrossRef]
  68. VCCI; UNDP. Agricultural Transformation Model Adapting to Climate Change in the Mekong Delta; VCCI; UNDP: Can Tho, Vietnam, 2022; ISBN 9788527729833. [Google Scholar]
  69. Nguyen, P.; Rodela, R.; Bosma, R.; Bregt, A.; Ligtenberg, A. An Investigation of the Role of Social Dynamics in Conversion to Sustainable Integrated Mangrove-Shrimp Farming in Ben Tre Province, Vietnam. Singap. J. Trop. Geogr. 2018, 39, 421–437. [Google Scholar] [CrossRef]
  70. UN VIETNAM. Viet Nam: Drought and Saltwater Intrusion in the Mekong Delta; UN VIETNAM: Hanoi, Vietnam, 2020. [Google Scholar]
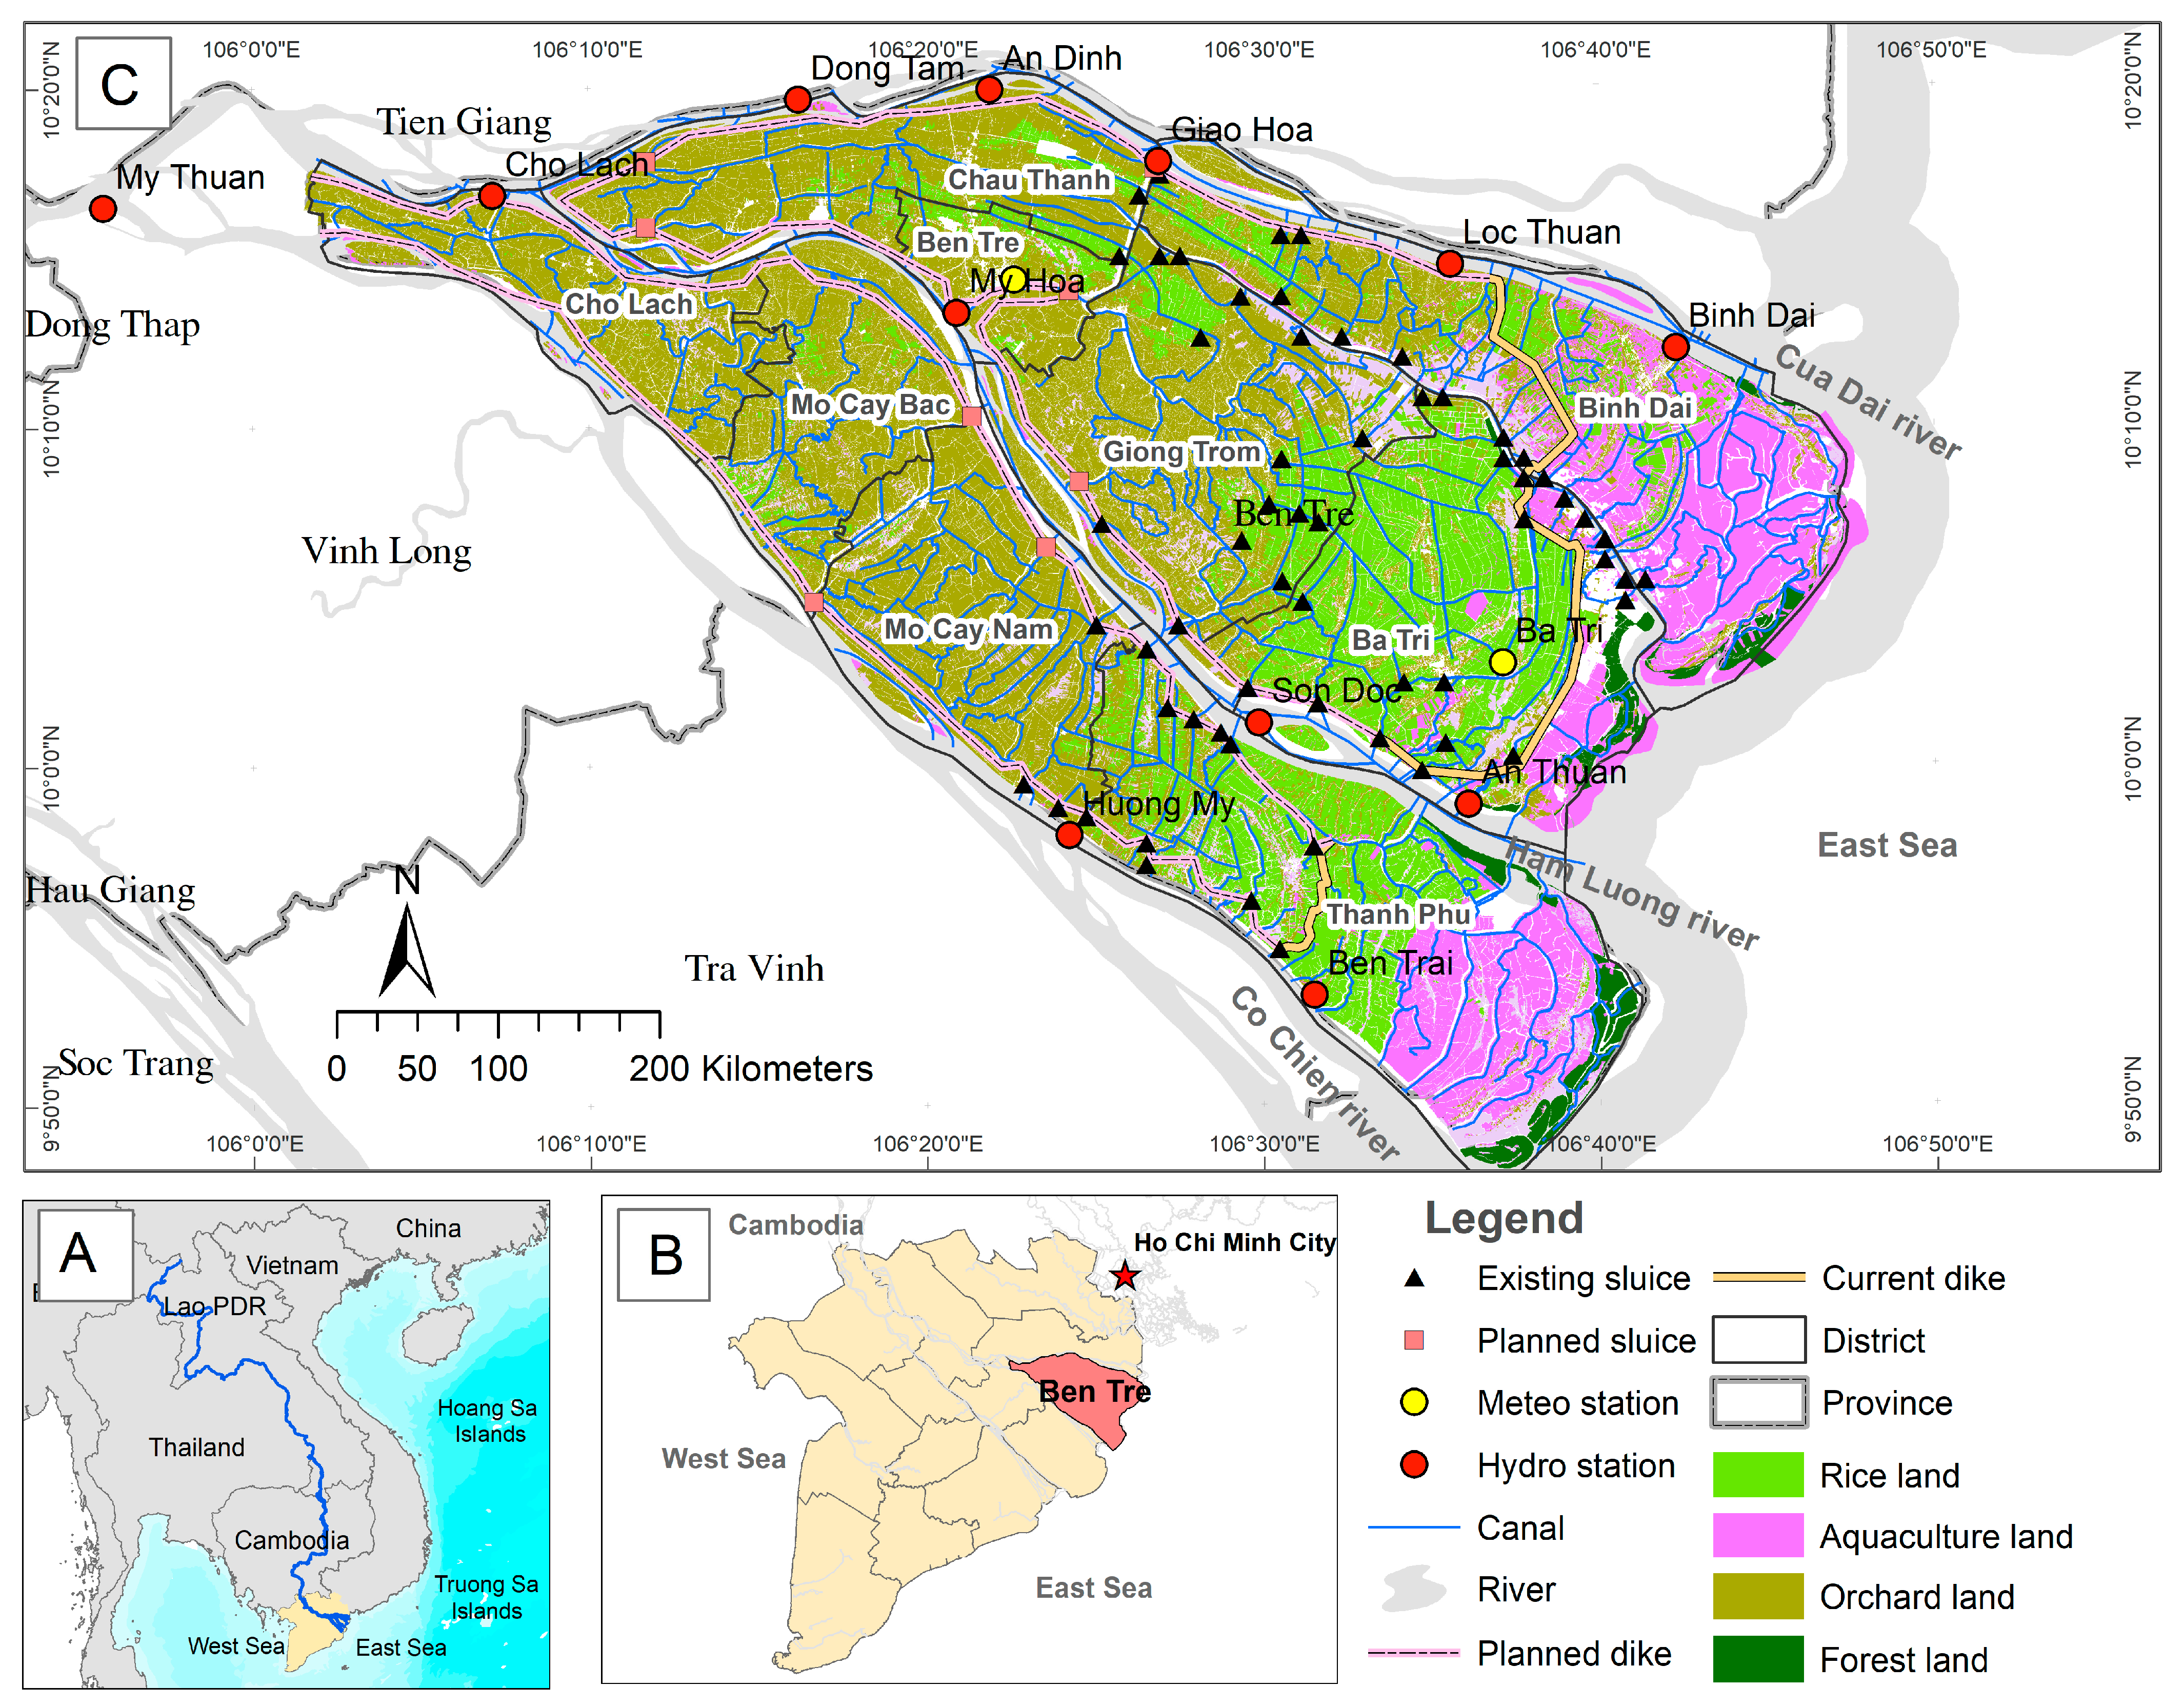
Figure 1. Vietnamese Mekong Delta (VMD) in Mekong River Basin (A), Ben Tre Province in the VMD (B), and hydro-meteorological stations, land use, and water infrastructure as sluice gates within the river network of Ben Tre Province (C).
Sustainability 15 09110 g001
Figure 2. Research workflow of the study including the pixel water concept for the water balance calculation (A); research steps in the analysis, which comprise three main steps (i) basic calculation, (ii) in-depth calculation, and (iii) investigations of the interventions (B); and detailed water balance calculation method, with * means multiplication sign (C).
Sustainability 15 09110 g002
Figure 3. MIKE11 model network of the VMD (A) and zooming in Ben Tre Province (B).
Sustainability 15 09110 g003
Figure 4. Maximum salinity intrusion (Smax) with the planned irrigation system in scenarios of Year 2016 and Year 2030 (A) and duration of salinity concentration (Sdur) exceeding 2 g/L in the existing irrigation system (B).
Sustainability 15 09110 g004
Figure 5. Water stress status in the dry season of the scenarios of 2016 and 2030.
Sustainability 15 09110 g005
Figure 6. Agricultural water demands in the Year 2030 scenario and the proposed measures.
Sustainability 15 09110 g006
Figure 7. Water stress status in the proposed measures compared with the planned solution.
Sustainability 15 09110 g007
Table 1. Calculated NSE and R2 of the calibrated simulation in 2016 and the validated simulation in 2020.
StationParameterDry Season 2016Dry Season 2020
NSER2NSER2
My ThuanQ0.950.980.930.97
My ThuanH0.940.980.920.97
My HoaH0.970.990.960.99
My ThoH0.970.990.960.99
Tra VinhH0.960.980.940.98
Cho LachH0.960.980.940.97
Note: Q is discharge while H is water level.
Table 2. Scenarios applied for the study.
ScenariosBoundary ConditionsWater Infrastructure Measure
Year 2016Upstream flow in 2016
Downstream water level in 2016
Averaged agricultural water demand 2005–2020
Household water demand in 2020
Existing irrigation system in 2016
Year 2030Projected upstream flow by 2030
Projected downstream water level by 2030
Averaged agricultural water demand by 2030
Household water demand by 2030
Planned irrigation system by 2030
Table 3. Proposed three measures incorporated into the planned solution by 2030.
MeasuresRecommendations
AWD IRRIGATIONThe traditional continuous flooded irrigation method was replaced by the Alternate Wetting and Drying (AWD) irrigation method (40% water demand cutoff) [66,67]
TRC TO FTCAgricultural transformation: triple rice cropping (TRC) was replaced by fruit trees (FTC) [68]
TRC TO TWC&AWD
IRRIGATION
Triple rice cropping (TRC) was replaced by two rice cropping and upland cropping (TWC), with AWD uses (40% water demand cutoff)
Table 4. Total water demand and total surface water resources in the scenarios of Y2016 and Y2030 (unit: km3).
MonthSurface Water Resources in Y2016Total Water Demand in Y2016Surface Water Resources in Y2030Total Water Demand in Y2030
Jan4.030.8613.500.864
Feb2.860.8953.150.898
Mar3.640.9213.480.925
Apr5.070.8914.630.894
May4.910.8024.520.805
Jun6.780.7776.100.781
Jul15.860.77913.930.782
Aug21.370.77118.700.774
Sep28.640.75224.990.754
Oct27.810.76624.170.769
Nov18.590.83315.780.836
Dec4.990.8454.100.848
Dry season25.505.215
(20%) *
23.375.234
(22%) *
Year144.559.893127.049.929
* Compared with the surface water resources availability in the same year.
Table 5. Areas affected by water stress under existing and planned irrigation systems (unit: ha).
Water Stress CategoryYear 2016Year 2030
Critical65,5472532
High61894259
Medium10,0249429
Low14,3297233
No stress45,572118,208
Total area141,661141,661
Percent of the sum of areas from Medium to Critical levels/Total area57.7%11.4%
Table 6. Agricultural water demand of proposed measures compared to Year 2030 (unit: million m3).
MonthYear 2030AWD IRRIGATIONTRC TO FTCTRC TO TWC&AWD IRRIGATION
Jan136.88122.28126.28103.46
Feb171.50149.05157.23130.63
Mar197.51169.62183.61152.88
Apr167.17155.29181.53154.27
May78.0767.9769.0858.07
Jun53.7543.8742.9736.67
Jul54.8044.7350.1642.27
Aug46.4641.5950.7742.66
Sep26.8922.8122.0118.13
Oct41.9333.8634.0928.69
Nov109.0291.64103.6985.54
Dec120.40104.78124.37103.59
Dry season
(Dec–May)
871.52769.00
102.52 *
(13%) *
842.10
29.42 *
(3%) *
702.89
168.62 *
(24%) *
Year1204.371047.501145.78956.85
* Water demand in the dry season of three proposed measures compared to those in Year 2030.
Table 7. Comparison of areas affected by water stress between the proposed measures (unit: ha).
Water Stress CategoryYear 2030AWD IRRIGATIONTRC TO FTCTRC TO TWC&AWD IRRIGATION
Critical25329782460869
High425911713586835
Medium9429440998022864
Low723314,626748113,790
No stress118,208120,477118,332123,303
Total area141,661141,661141,661141,661
Area of medium
to critical levels/Total area
(In percentage)
16,220
(11.4%)
6558
(4.6%)
15,858
(11.2%)
4568
(3.2%)
Disclaimer/Publisher’s Note: The statements, opinions and data contained in all publications are solely those of the individual author(s) and contributor(s) and not of MDPI and/or the editor(s). MDPI and/or the editor(s) disclaim responsibility for any injury to people or property resulting from any ideas, methods, instructions or products referred to in the content.