Article

Feasibility of Wave Energy Harvesting in the Ligurian Sea, Italy

by
Manuel Corrales-Gonzalez
1,
George Lavidas
2 and
Giovanni Besio
1,*
1
Department of Civil, Chemical and Environmental Engineering (DICCA), University of Genoa, Via Montallegro 1, 16145 Genoa, Italy
2
Faculty of Civil Engineering and Geosciences, Delft University of Technology, Stevinweg 1, 2628 CN Delft, The Netherlands
*
Author to whom correspondence should be addressed.
Sustainability 2023, 15(11), 9113; https://doi.org/10.3390/su15119113
Submission received: 2 May 2023 / Revised: 22 May 2023 / Accepted: 29 May 2023 / Published: 5 June 2023
(This article belongs to the Special Issue Sustainability of Wave Energy Resources in the Sea)

Abstract

:
Clean energies are being incorporated into the energy mix in numerous countries. Through a spatial survey of maritime trade, restricted military maritime areas, marine planning, and the presence of fauna and flora along the Ligurian Sea, locations for possible investments in wave energy harvesting were identified in the Northern Thyrrenian Sea, along the Ligurian coast. Previous studies in this region have demonstrated, at a lower spatial resolution, the wave energy potential that can be captured and its variation over time. However, the optimization of wave energy exploitation under the criteria of the functionality and safety of converter devices has not yet been evaluated in the Ligurian Sea. The purpose of this study is to identify the optimal wave energy converter from an economic and technical perspective at several selected locations in the Ligurian Sea. This study involves the scaling of the employed power matrices to obtain the optimized capacity factors of wave energy converters.

1. Introduction

Recently, there has been a growing awareness of the need to increase the contribution of renewable energy sources to the electricity mix. For this reason, several governing bodies have initiated this transformation process worldwide. It also will provide greater human welfare and security for future generations [1]. Oceans are rich providers of resources, including renewable energy, which can be harnessed in various ways. The extraction of energy from the sea has undergone changes that have led to its optimization after developing efficient equipment and adopting new devices for electricity generation that operate alongside the most advanced technologies [2]. These technologies have the potential to play a significant role in meeting the world’s energy needs, particularly in coastal areas, where the majority of the population lives [3,4].
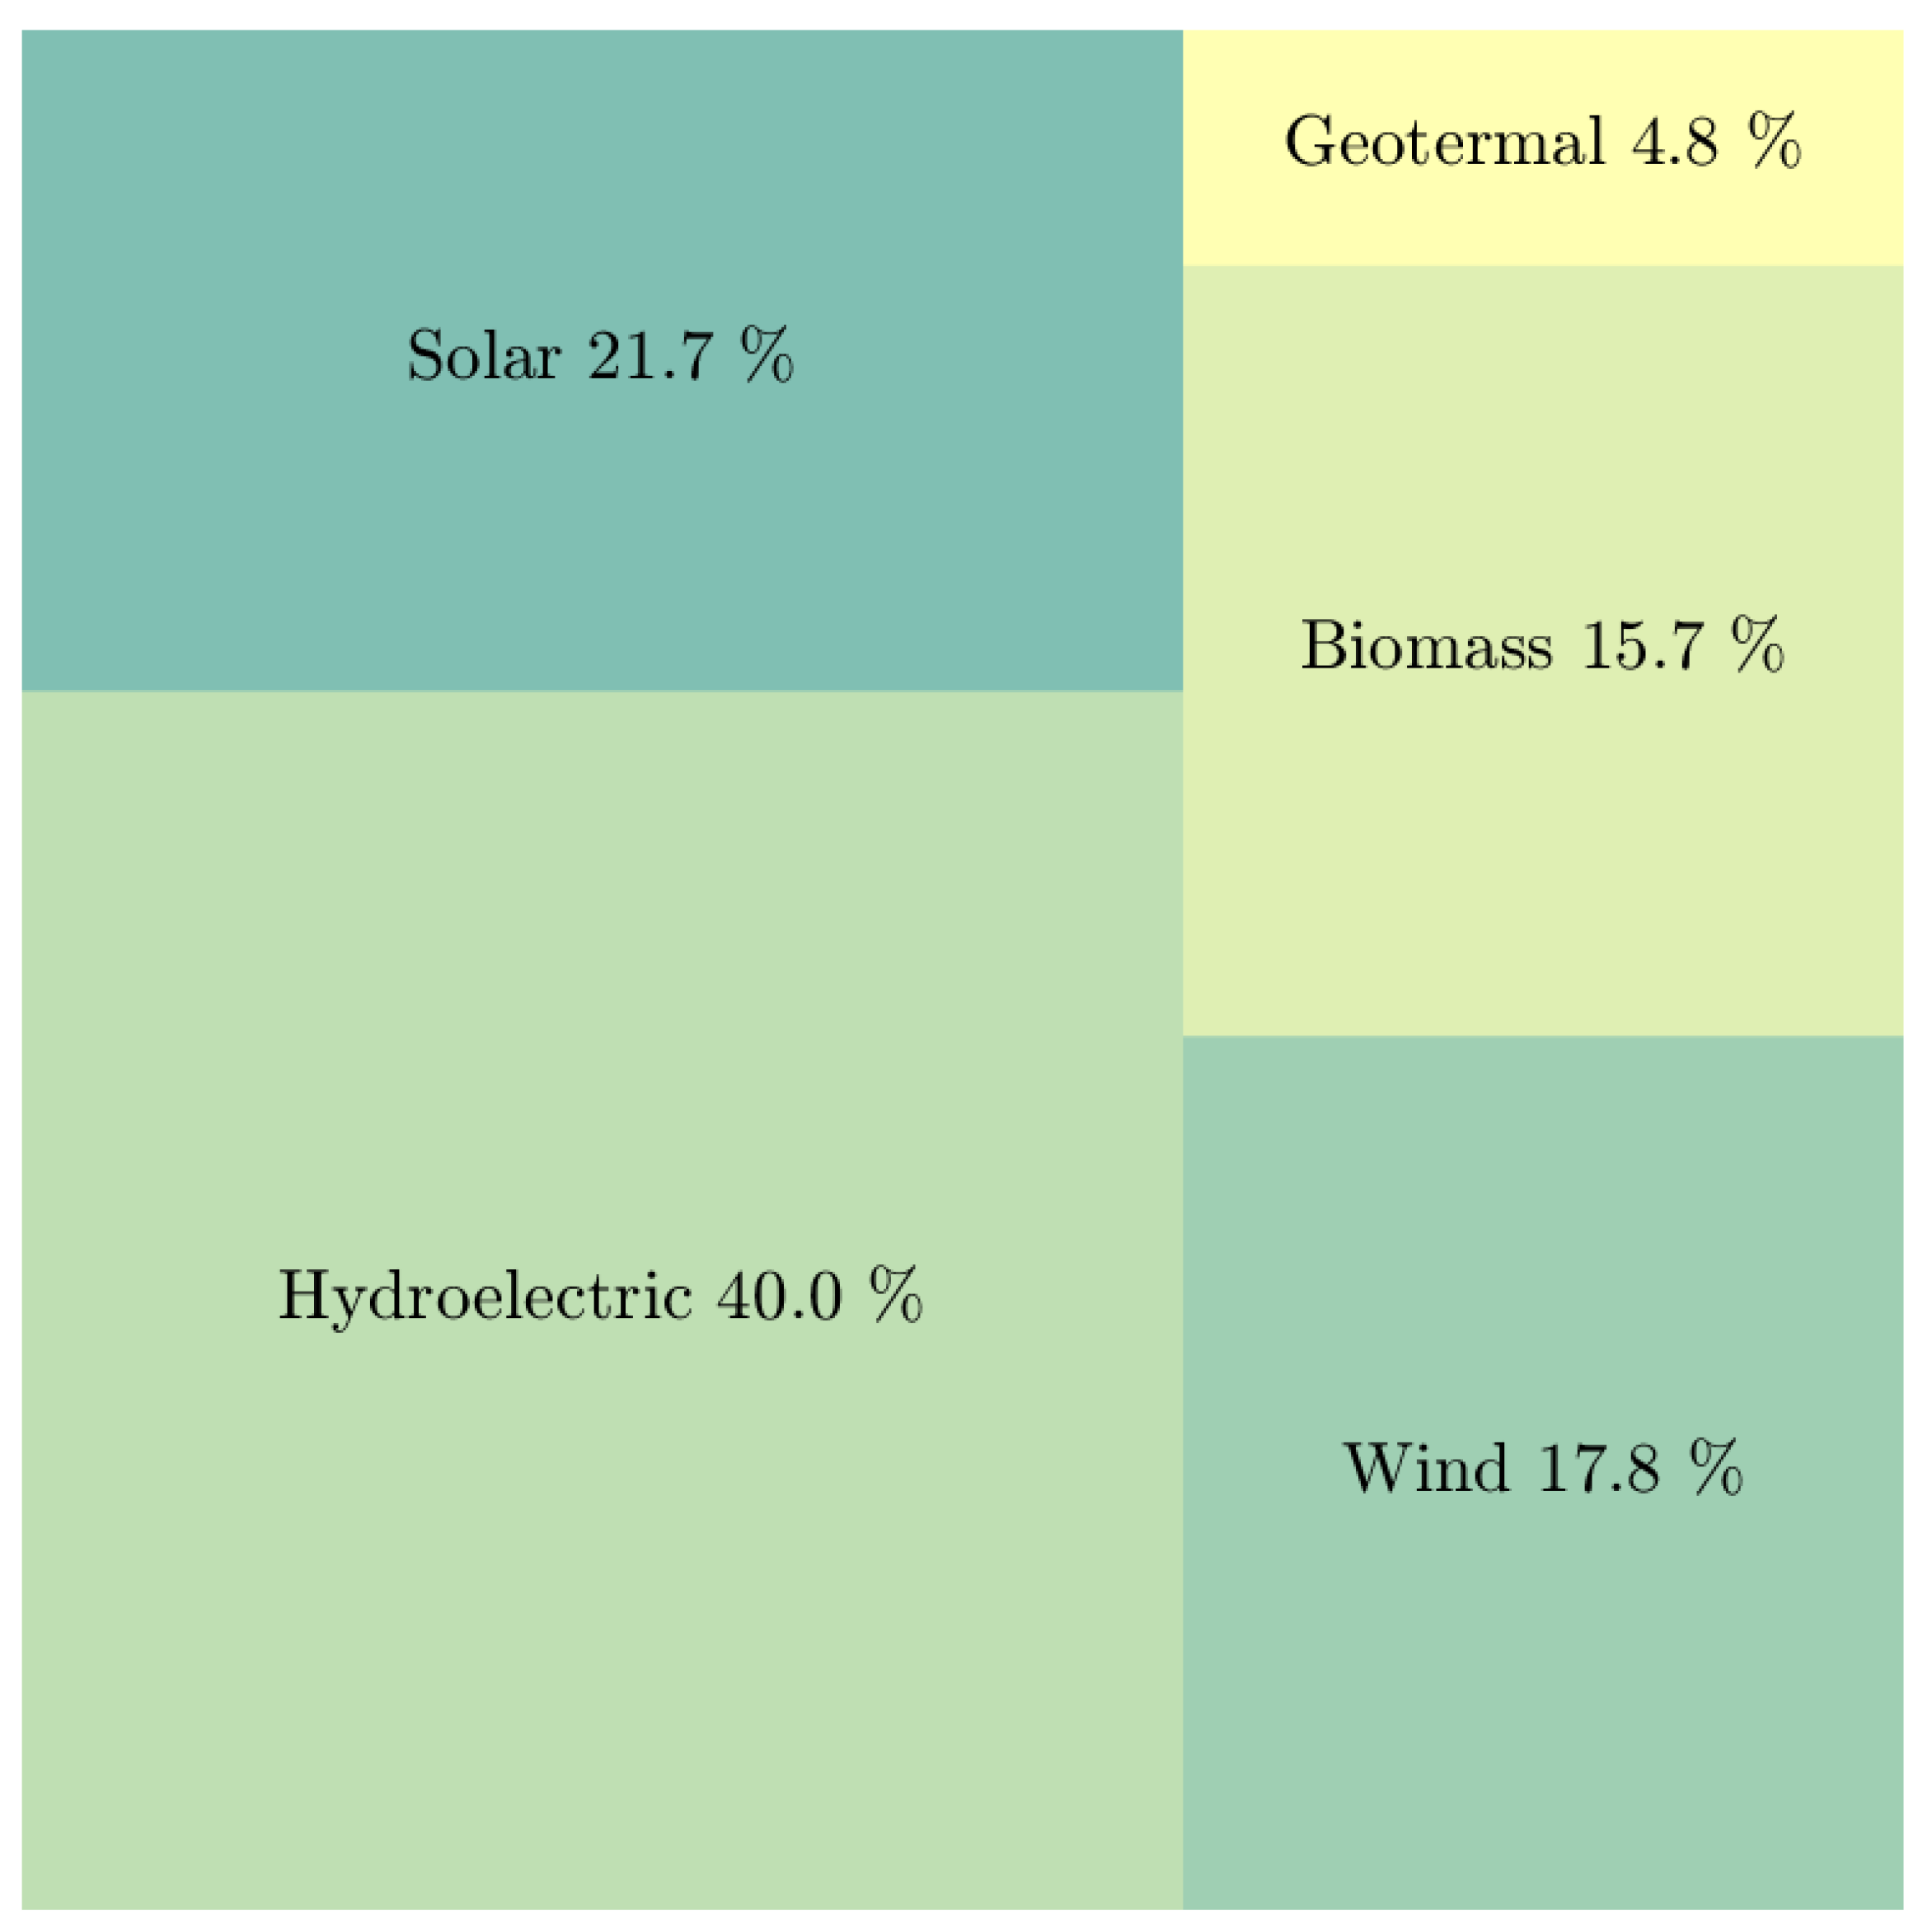
Renewable energies from the sea would also reduce fossil fuel use and greenhouse gas (GHG) emissions into the atmosphere, making them optimal sustainable energy sources [5]. Another benefit that emerges from marine energy deployment is the generation of local and centralized jobs, mainly related to the design, installation, construction and electromechanical maintenance of wave energy converters [6]. An overview of energy exploitation from renewable sources in Italy is shown in Figure 1.
Wave energy is among the most important marine renewable energy (MRE) resources, as it is present throughout the ocean, and it varies depending on the geographical location and annual seasonality [7]. Likewise, this resource is a continuous force that is predictable and dense [8]. Moreover, the technologies of wave energy exploitation have experienced a clear upsurge in the last few decades [9,10]. In 2021, the Recovery and Resilience Plan to mitigate the economic impacts of the pandemic and invest in the ecological and digital transition of Italy, as a member of the European Union, declared the investment of USD 33 million in the innovative development of renewable energy technologies [11,12].
Figure 1. Total supply of renewable energies in Italy, in 2021. Source: [13].
Sustainability 15 09113 g001
The Mediterranean Sea, as a large enclosed sea, offers an intermediate level of wave energy power between the open oceans and the enclosed small-fetch basins such as the Black Sea or the Baltic Sea [14,15]. Detailed assessments have been developed for the Mediterranean Sea regarding wave energy [16,17,18,19,20,21], and, more specifically, studies on energy harvesting through converters along the Italian coasts [2,22,23,24,25,26,27,28,29,30], in which the evaluated converter devices are applied to the wave climate and its features in each evaluated region.
In addition, wave energy converter (hereinafter WEC) resizing can increase the efficiency of the devices [31], and the related costs are subsequently reduced proportionally to the scale [2,32]. However, the cost of energy conversion from renewable sources must be feasible, realistic, and justified, and supported even by government incentives and subsidies to encourage the adoption of wave energy converter technology.
This study proposes a feasibility analysis based on technical and economic aspects regarding eight wave energy converters: F-2HB, Pelamis, SeaPower, Pontoon, AWS, OEBouy, AquaBUOY, and Langlee [24,33,34], at 36 locations along the Ligurian Sea. The location selection for wave energy converters is conducted based on marine spatial planning areas, engineering criteria, and different socioeconomic activities along the Ligurian Sea. Then, the information related to the use and management of maritime space in the Ligurian Sea is collected in a Geographic Information System (GIS), aiming to identify the best areas for the installation of wave converters. Subsequently, the wave energy amounts and performance parameters for each WEC at each location are estimated considering a high-resolution wave hindcast database. The performance enhancement of each device is also considered through the scaling of the converters, and, finally, an economic analysis is carried out based on well-known economic metrics such as the cost of energy and levelized cost of energy.

2. Materials and Methods

2.1. Maritime Areas for Wave Energy Exploitation

In the first instance, the study started with the definition of the location in which wave energy exploitation is feasible from a maritime management perspective. The spatial coverage of this study is between latitudes 43.821 E and 44.428 E and longitudes 7.494 N and 10.071 N. Mapping in the assessed region presents a challenge due to the coexistence of various socioeconomic activities, marine protected areas, and restricted sectors, among others. The mapping was performed by using a GIS that allowed us to collect and visualize the detailed information for each layer in the GIS. Thirteen layers were considered in this study, which comprise marine protected areas, marine vegetation cover, shore outfalls, restricted areas for military use provided by the Istituto Idrografico della Marina Italiana (IMM), GEBCO bathymetric information [35], the 12-nautical-miles limitation, fishing facilities, ports and harbors, beaches, the most recent coastline (year 2016) available, the marine fauna atlas, concessions for coastal works, navigation routes, and the locations of meteorological survey stations of the Department of Civil, Chemical, and Environmental Engineering (DICCA) of the University of Genoa. Layer information for the built GIS is listed in Table A1.
Likewise, criteria such as wave hindcast information availability, the distance from the coastline, the distance between each converter (seeking ∼5 km), and the water depth were considered. It was also decided to place the converters in nearshore positions that were minimally influenced by waves’ shallow water effects, since shallow water wave dynamics are less suitable for converters such as attenuators, absorber points, and heavy buoys [36]. Thus, 36 locations were established for the evaluation of wave energy extraction. These locations are mapped and listed in Figure 2 and Table A2, respectively.

2.2. Wave Energy Assessment and WEC Performance

The modeled wave information employed corresponded to a 44-year (1979–2022) wave hindcast, developed by the MeteOcean group of the University of Genoa (http://www3.dicca.unige.it/meteocean/hindcast.html (accessed on 22 January 2023)).The modeled wave data were produced under an unstructured mesh that covered the entire Mediterranean Sea [37]. Specifically, the wave hindcast outputs used to conduct this study were the wave peak period T p and zeroth-order moment wave height H m 0 . The mesh resolution ranged from the lower resolution of approximately 30 km at deep waters to 0.4 km along the coasts [37]. An hourly wave dataset from 1 January 1979 to 31 December 2022 was employed in this study.
The wave power assessment and the temporal characterization were performed for all the chosen locations, where the wave power, as defined in [38], was given by Equation (1):
P w a v e = ρ w · g 2 · H m 0 2 · T m 1 , 0 64 π ,
where ρ w corresponds to the sea water density of 1025 kg·m−3, g corresponds to the gravitational acceleration of 9.81 m·s−2, and T m 1 , 0 represents the wave energy period, which is estimated as ninety percent of T p . Equation (1) is usually expressed in kW/m. Eight WECs with different energy conversion mechanisms and classifications [33,34,39] were considered herein: F-2HB, Pelamis, SeaPower, Pontoon, AWS, OEBouy, AquaBUOY, and Langlee. Each of them had different performance depending on the characteristics of the waves in a given region, according to the categories established by the European Marine Energy Center (EMEC) [40]. Converters such as F-2HB, Pontoon, and AquaBUOY are classified as point absorber conversion devices; on other hand, Pelamis, SeaPower, and OEBuoy are classified as oscillating water columns, whereas Langlee corresponds to a terminator. Further characteristics of the assessed WECs are shown in Table 1.
The power matrices are representations of the extracted wave power by a converter as a function of the combination of H m 0 and T p , as shown in Figure A1. The total energy produced ( E 0 ) by a specific WEC corresponds to the energy extracted by a specific WEC under wave conditions, and its occurrence along a determined period. Then, the E 0 is summed over the entire wave data period, as follows:
E 0 = 1 100 · i = 1 n T p · j = 1 n H m 0 p i , j · P M i , j ,
where p i , j corresponds to the adjoint probability of T p and H m 0 obtained from the wave modeled data, and P M i , j represents the power matrix for the evaluated energy converter. The energy captured by WECs can be determined by the capacity factor (CF), which represents the theoretical maximum value that a converter can capture during a specific period and is calculated through Equation (3):
C F = E 0 P 0 · Δ T ,
where P 0 , or the nominal rated power, corresponds to the maximum wave energy that can be extracted using any WEC. According to this indicator for the analyzed conditions, the closer the CF is to 1, the more efficient the converter is. The Wave Energy Development Index (WEDI) [48] and the Selection Index for Wave Energy Deployments (SIWED) [49] were employed to consider the presence of extreme events that influenced the WECs’ survivability and the control over the capital expenditures (CapEx), which is of interest from an economic point of view for energy harvesting development. The WEDI and SIWED indices, both dimensionless, can be estimated by applying Equations (4) and (5), respectively:
W E D I = P w a v e ¯ J w a v e ,
with P w a v e ¯ the annual average wave power, and J w a v e the maximum wave power, and
S I W E D = e C o V H m 0 · C F H E V A H M a x ,
where H E V A corresponds to the wave height threshold defined from the Extreme Value Analysis (EVA) methodology, and H M a x is the maximum wave height. For the SIWED index, the return period considered in this study corresponds to 30 years. The threshold for determining the extreme values of H m 0 in the EVA analysis corresponds to the 95th percentile of all the data. Then, the H m 0 values above this limit are fitted to a generalized Pareto distribution (GPD), which is expressed in Equation (6):
G P D = 1 1 + ξ z μ σ 1 ξ ,
where μ is the location parameter, σ the scale parameter, and ξ the shape parameter of the GPD distribution.

2.3. WEC Scaling

The energy extraction capacities in WECs are modified by the variation in the WEC dimensions due to the factor λ . In the case of ocean waves, we employed the Froude similarity, equating the F r of the prototype to the F r of the scaled device. Hence, the physical dimensions of the converter are scaled by multiplying them by λ , the time is scaled by a factor of λ , and the power varies by a factor of λ 3.5 [2].
Thus, the captured power by each WEC is scaled based on the aforementioned factor, i.e., all entries of the P M are multiplied by λ 3.5 . Subsequently, the scaled terms E 0 and P 0 produce the scaled CF. The CF-dependent parameters also generate new scaled values. It is worth pointing out that the adjoint occurrence of the wave dataset matrix, in the E 0 through Equation (2), is not scaled because the wave conditions remain the same.
Certainly, when a given WEC is scaled, the wave conditions with which it interacts most efficiently vary, so the aim is precisely to adjust the device at its highest efficiency point to the wave conditions at each location studied. The scaling λ values employed in the present analysis vary from 0.2 up to 1.6 with a step of 0.1. Additionally, when scaling a WEC, it can affect its economic costs, which similarly can be scaled based on a factor λ [32]. Table 2 illustrates how these costs are affected in relation to the converter installation and how they are associated with the cost of energy mentioned later in the next subsection (Equation (8)).

2.4. Cost of Energy of the WEC Implementation

The focus here is on the feasibility of the conversion devices and the eventual operational lifetimes of the converters once the scaling and technical evaluation of the converters has been completed. Wave conditions vary according to seasonality: for the highest wave energetic conditions, the survivability of WECs during extreme wave events negatively impacts the electricity production of the devices. A commonly used parameter in the economic assessment of converters is the cost of energy (COE), which is calculated through Equation (8):
C O E = C a p E x + i = 1 n O p E x i i = 1 n A E P i ,
where the capital expenditure (CapEx) corresponds to the initial investment for a WEC implementation. The considered CapEx in this study is based on the fact that the converters are floating devices whose electrical transmission is achieved through submarine cables whose lengths equal approximately the shortest distance to the shoreline, as indicated in Table A2. One device per location is considered. Then, the CapEx is composed of the following:
  • Design and planning of the WEC deployment;
  • Cost of the device and power take-off (PTO);
  • Transportation, assembly, and installation;
  • Electrical controlling system;
  • Mooring system;
  • Cables.
Likewise, the operational expenditure (OpEx) represents the maintenance and operation costs, which are amortized over the n years of the WEC lifetime. We assume an OpEx of 10% of the CapEx cost, based on approximations indicated by [50]. The adopted lifetime for WECs corresponds to 30 years. Costs related to CapEx that have been considered in this evaluation are presented in the Table 3. A conversion to EUR was necessary, taking into account these changes: EUR 1 is equal to GBP 0.88, and EUR 1 is equal to USD 1.08. Moreover, all amounts listed in Table 3 have been projected to 2023 (the present).
Regarding the AEP, i.e., annual electricity production, it corresponds to the net electricity production, discounting the inherent energy costs of the converter during its period of operation during the year [32]. The AEP assumes that the WEC is operative for its whole lifetime, without disruption.
Another metric commonly used with the cost of energy is the levelized cost of energy (LCOE). This indicator provides the cost of energy considering the annual operation and maintenance costs (OM) every year (i) of the lifetime and is brought to the present value by means of the discount rate (r) [55]:
L C O E = C a p E x + i = 1 n O p E x i 1 + r i i = 1 n A E P i 1 + r i
The discount rate employed in this study corresponds to 4%, which considers that large civil-beneficial projects can be co-financed by public–private partnerships (PPP) [64]. COE and LCOE are given in currency units per unit of energy, usually in EUR per MWh. These costs vary significantly among WECs depending on the assumptions and considerations made. One of them, for instance, is a wide range of r values, usually reported in the literature [50,65]. In addition, the feasibility of such projects is based on whether the payback period does does not exceed the viability limit, which is usually set at 20 years [25]. Equation (9) indicates how the payback period (PBP) is estimated [25]:
P B P = C a p E x + R e P o w e r R n O M
The R n in the previous equation represents the guaranteed selling price of electricity, established as EUR 300 per MWh by the Italian National Electricity Authority [66], while the average O M value corresponds to USD 222 per MWh [53] or EUR 328.4 per MWh at present. The R e P o w e r cost must be included in the event that parts of the converter are affected a few years after the start of its operation, i.e., the cost of repair or replacement of parts of the device—for instance, the oscillating water column (OWC) device.

3. Results

3.1. Wave Energy Assessment

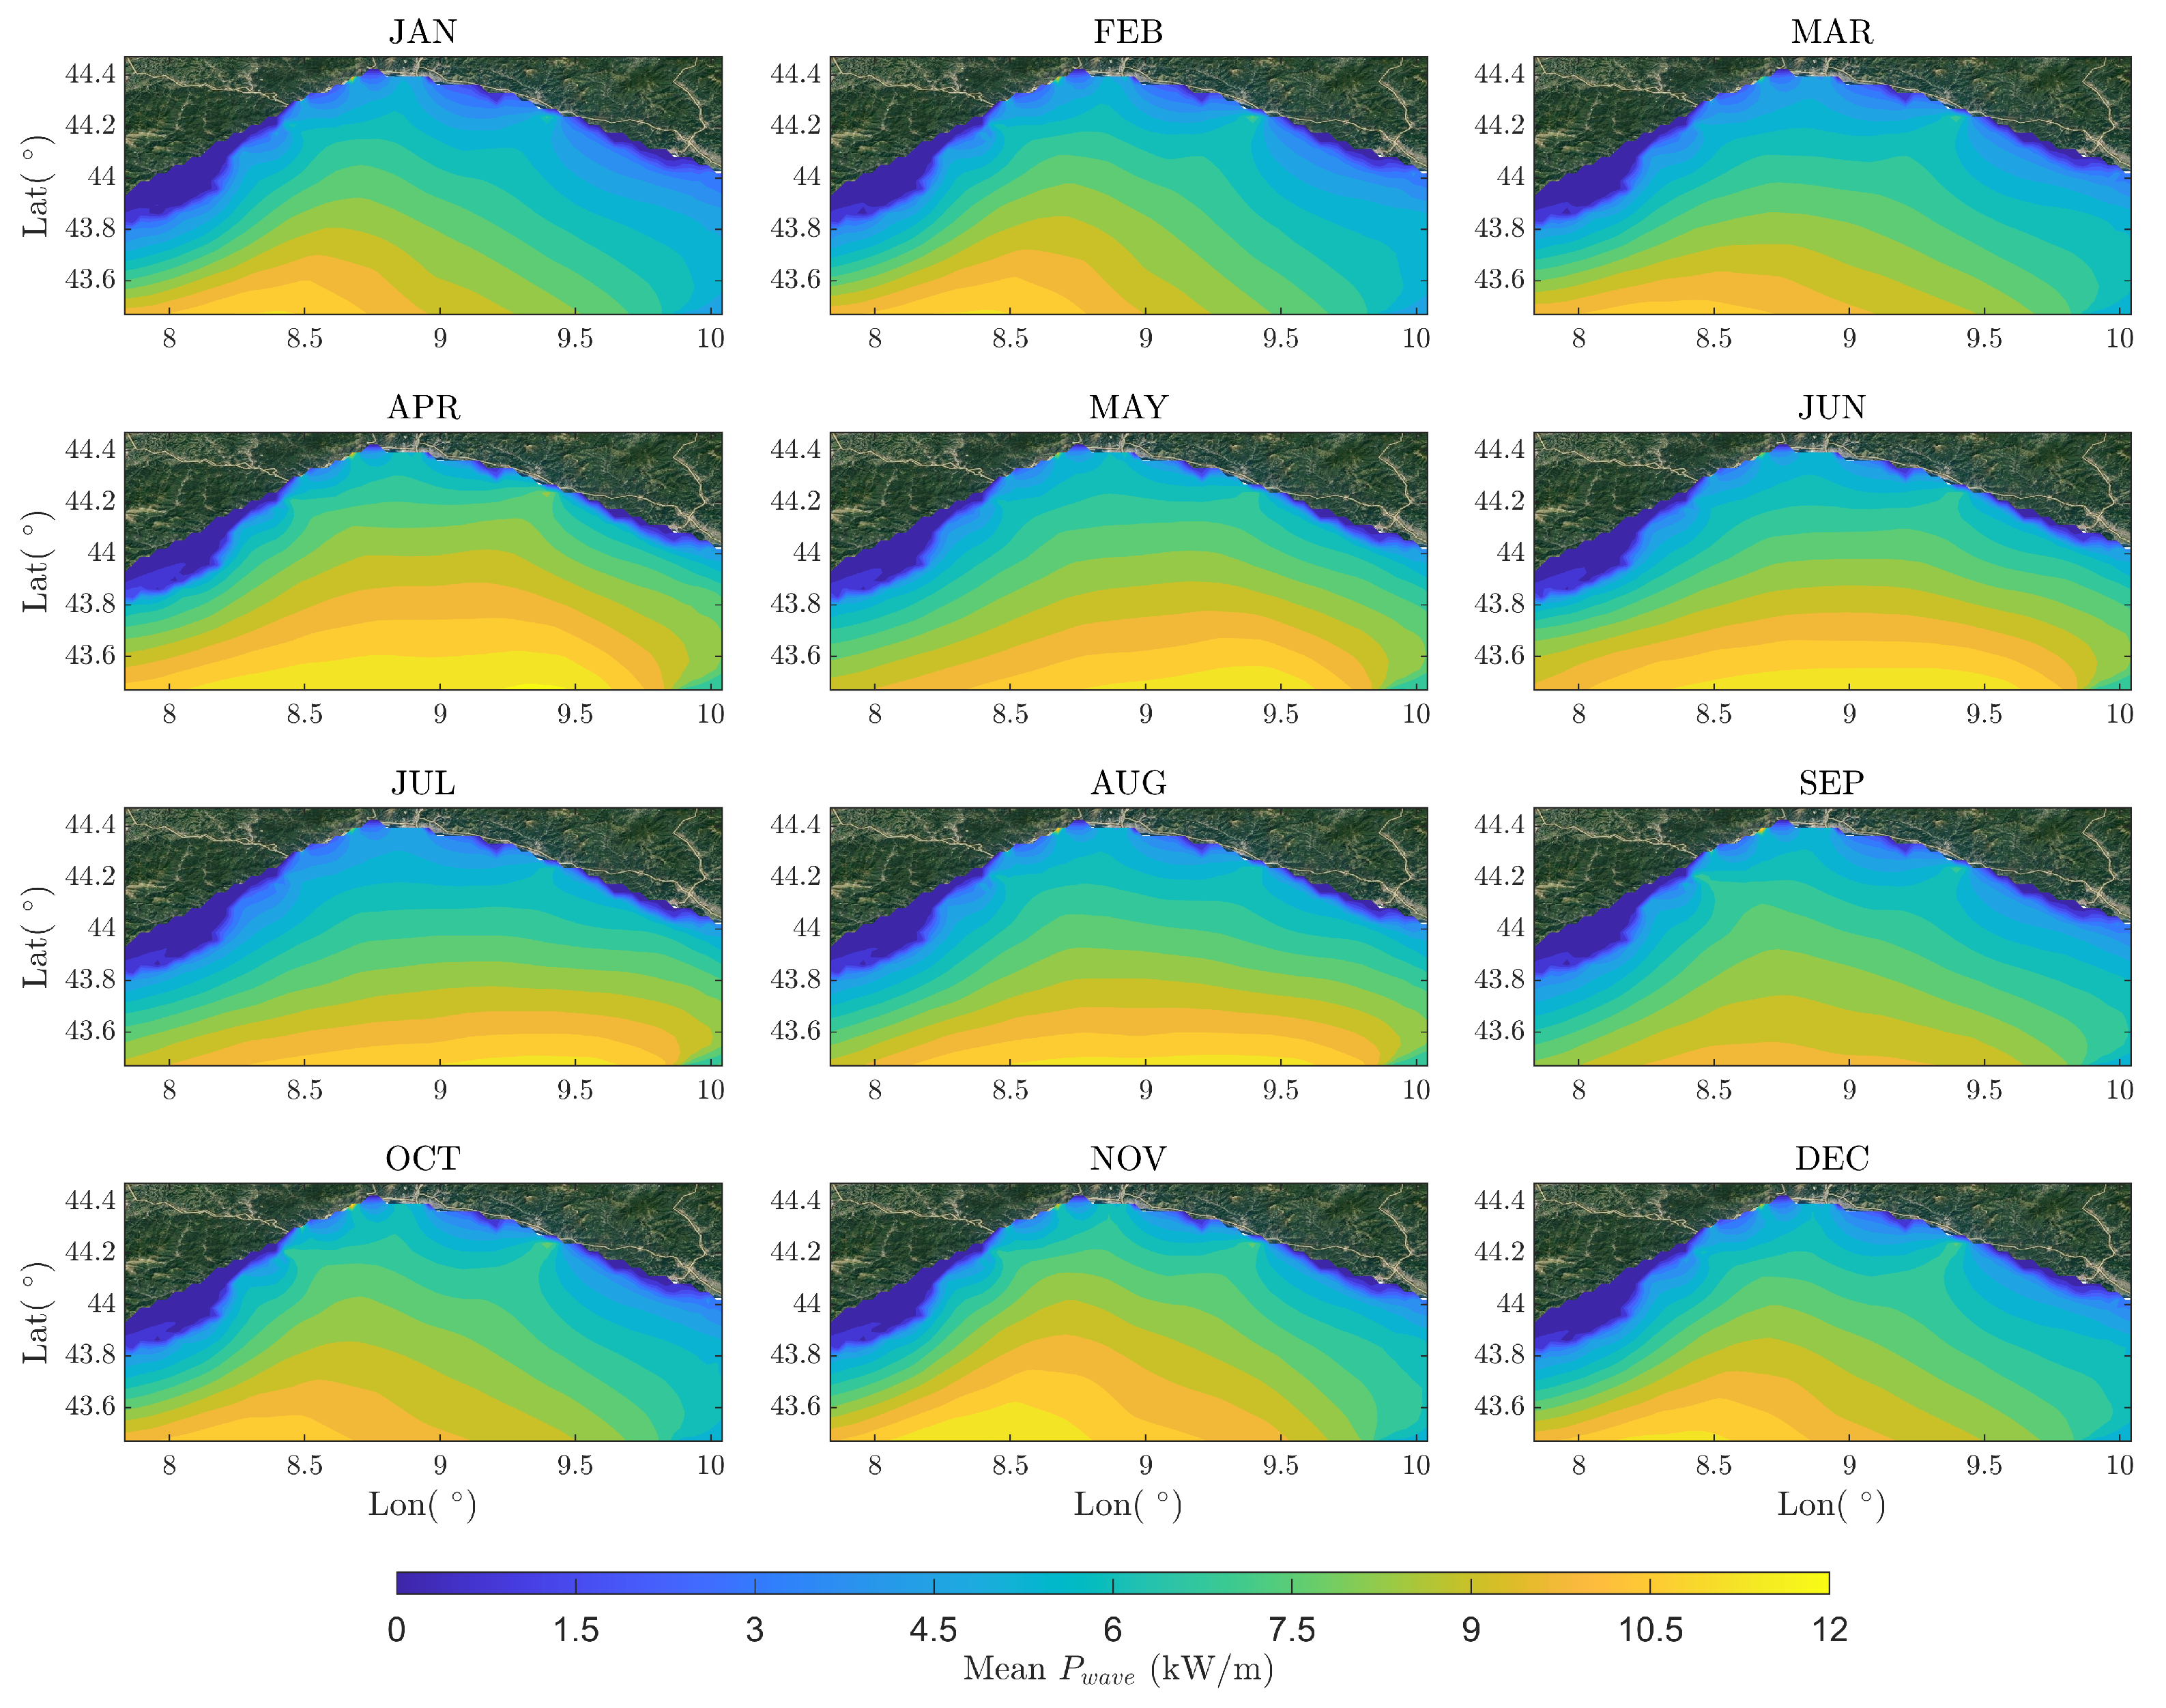
The mean wave power behavior along the Ligurian Sea is shown in Figure 3. As the wave travels toward the coast, the wave transformation processes produce a net reduction in its energy content. In the Ligurian Sea, wave energy comes predominantly from the southwest direction and its intensities vary according to the characteristics of storms coming from the Atlantic Ocean [67]. In particular, the months of October to February present the highest wave power values in the region.
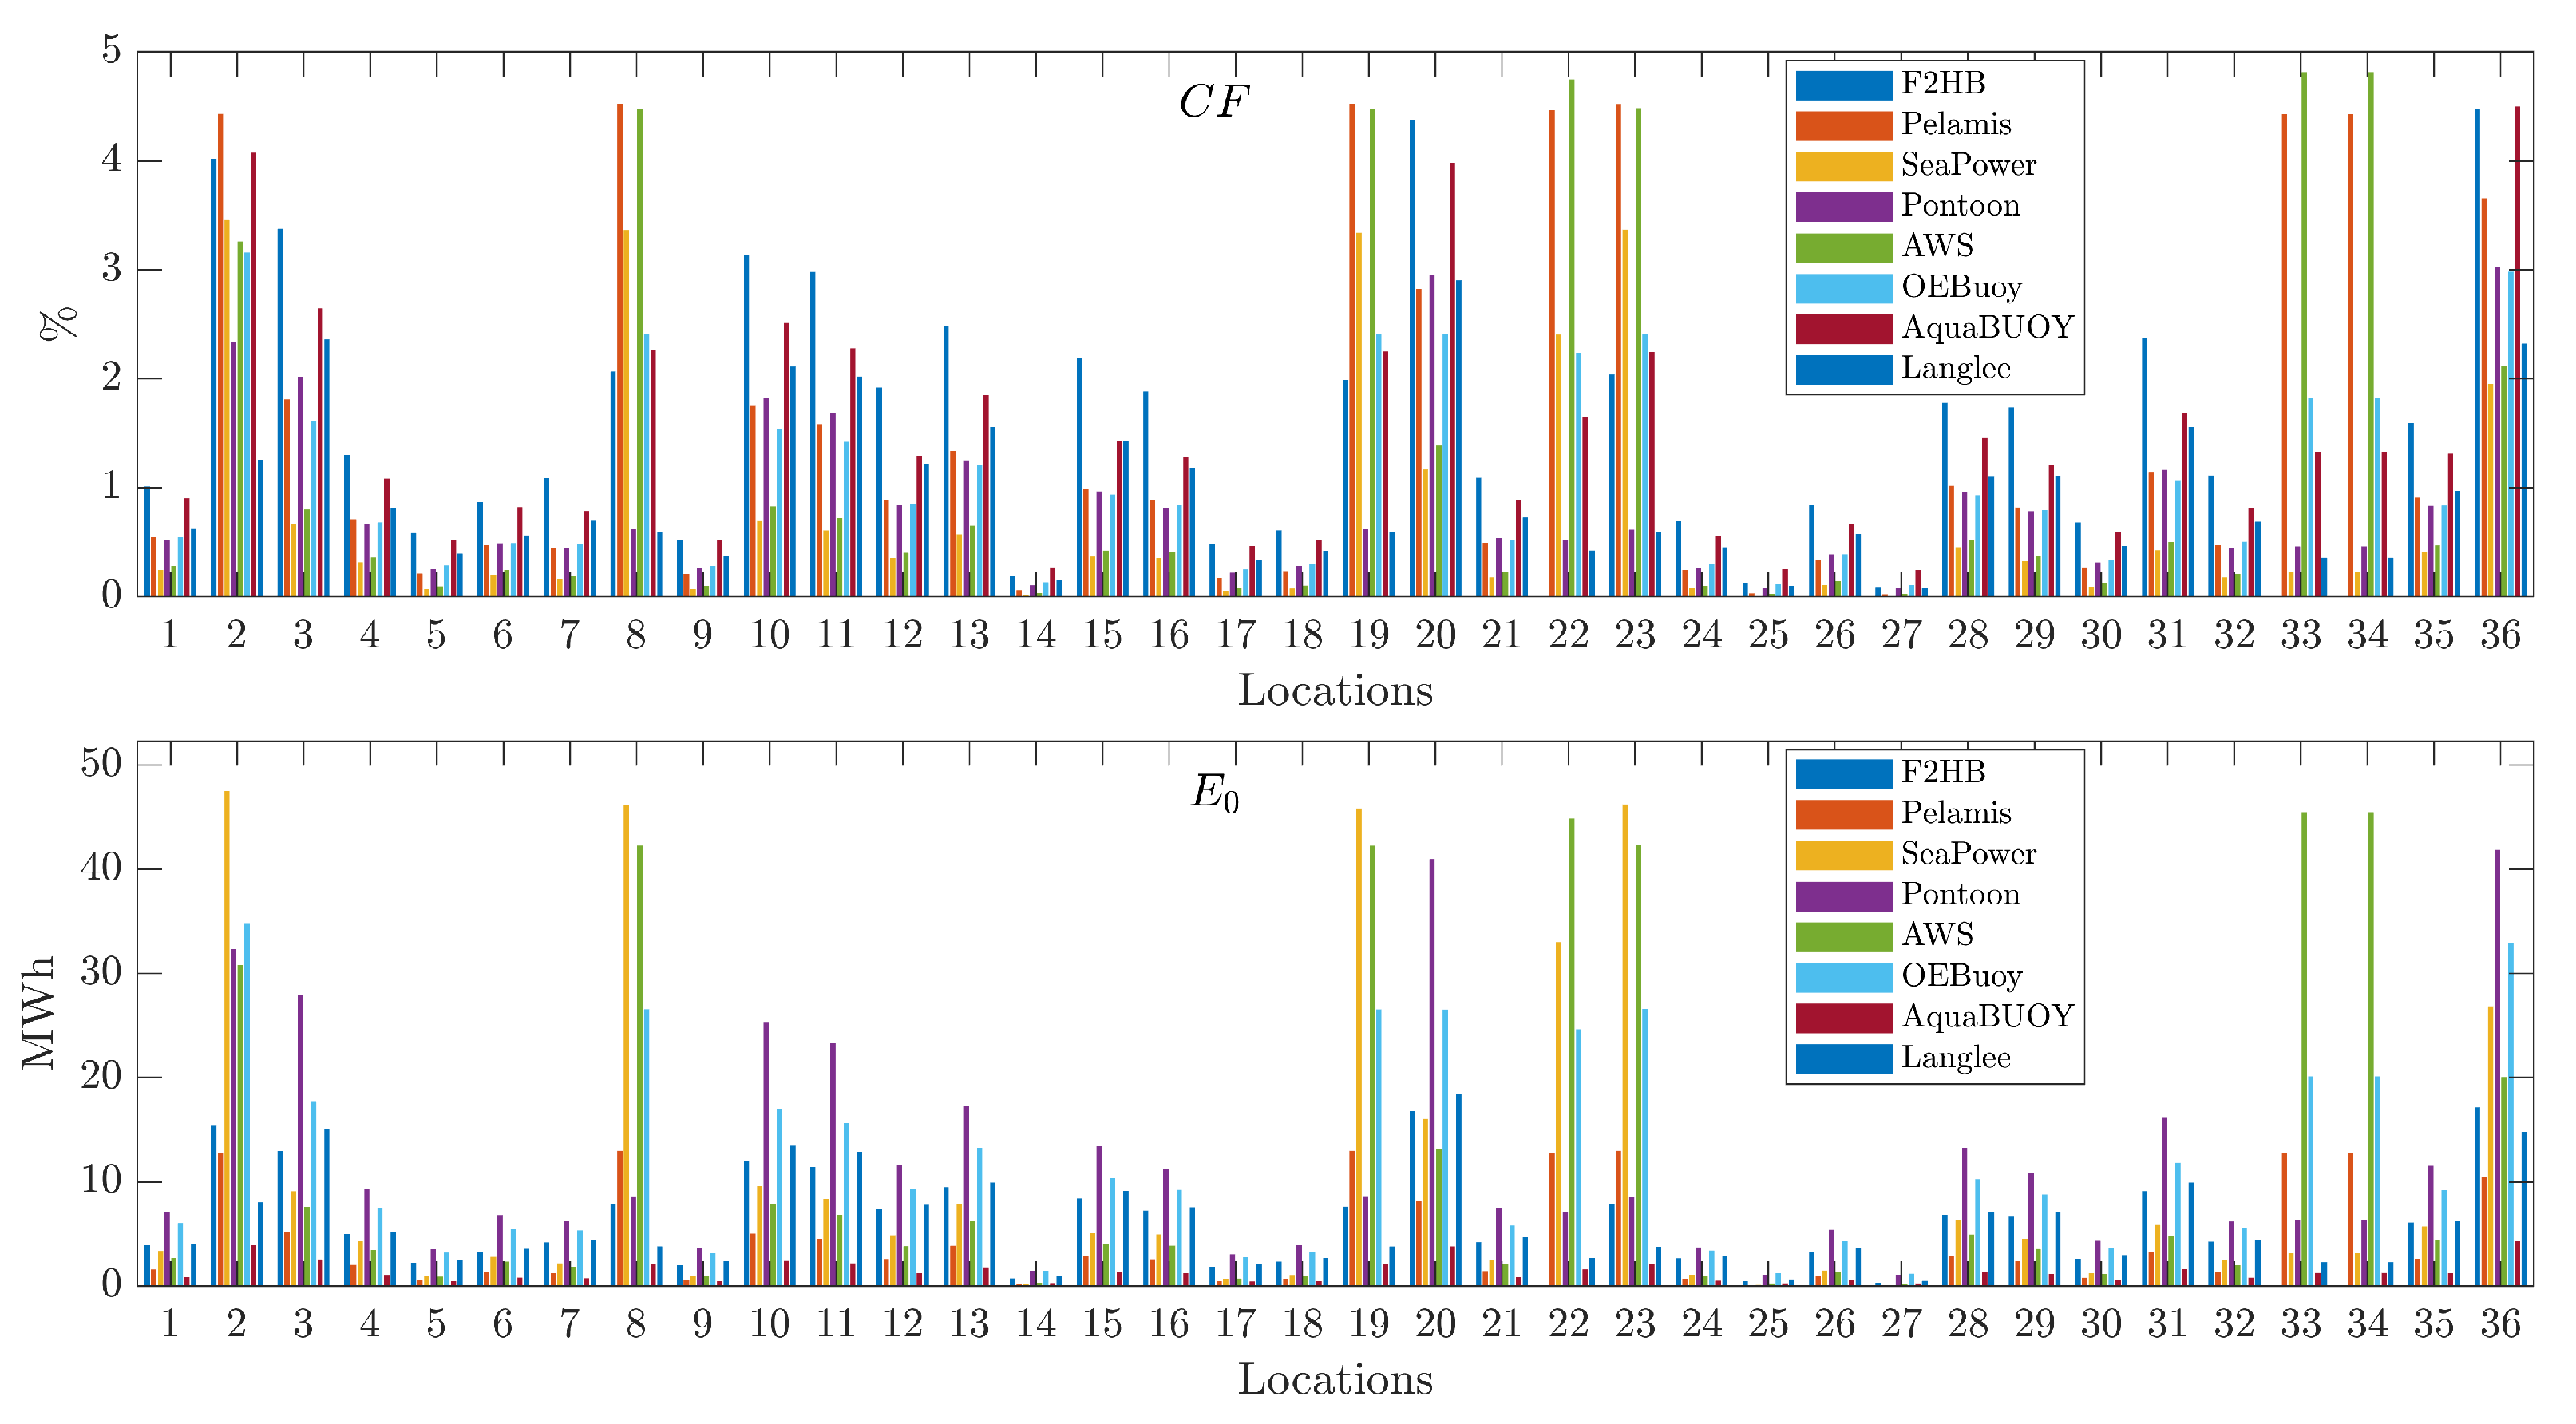
The wave energy potential does not provide information on energy harvesting. Instead, the capacity factors and total energy produced E 0 yield a proper representation for wave energy exploitation, making a distinction between the evaluated WECs. The top panel of Figure 4 shows the capacity factors at the evaluated locations. There is clear evidence that CF varies according to the assessed WEC even at the same location. It is also noticeable that locations 2, 8, 19, 20, 22, 23, and 36 have a higher CF than the other locations. Thus, the E 0 values exhibit similar behavior at these locations, as shown in the bottom panel of Figure 4. In particular, locations 33 and 34 present high E 0 values for the SeaPower and AWS converters. The CF of all converters indicate low energy extraction capacity in the region for the devices of their standard sizes—for instance, if they are compared to those of the North Sea or Atlantic Ocean, where the estimated CFs are between 30% and 40% [2,50].
In addition, Figure 5 illustrates the average annual energy produced for four sample locations, where the energy content differs owing to the spatial variability of the wave conditions.
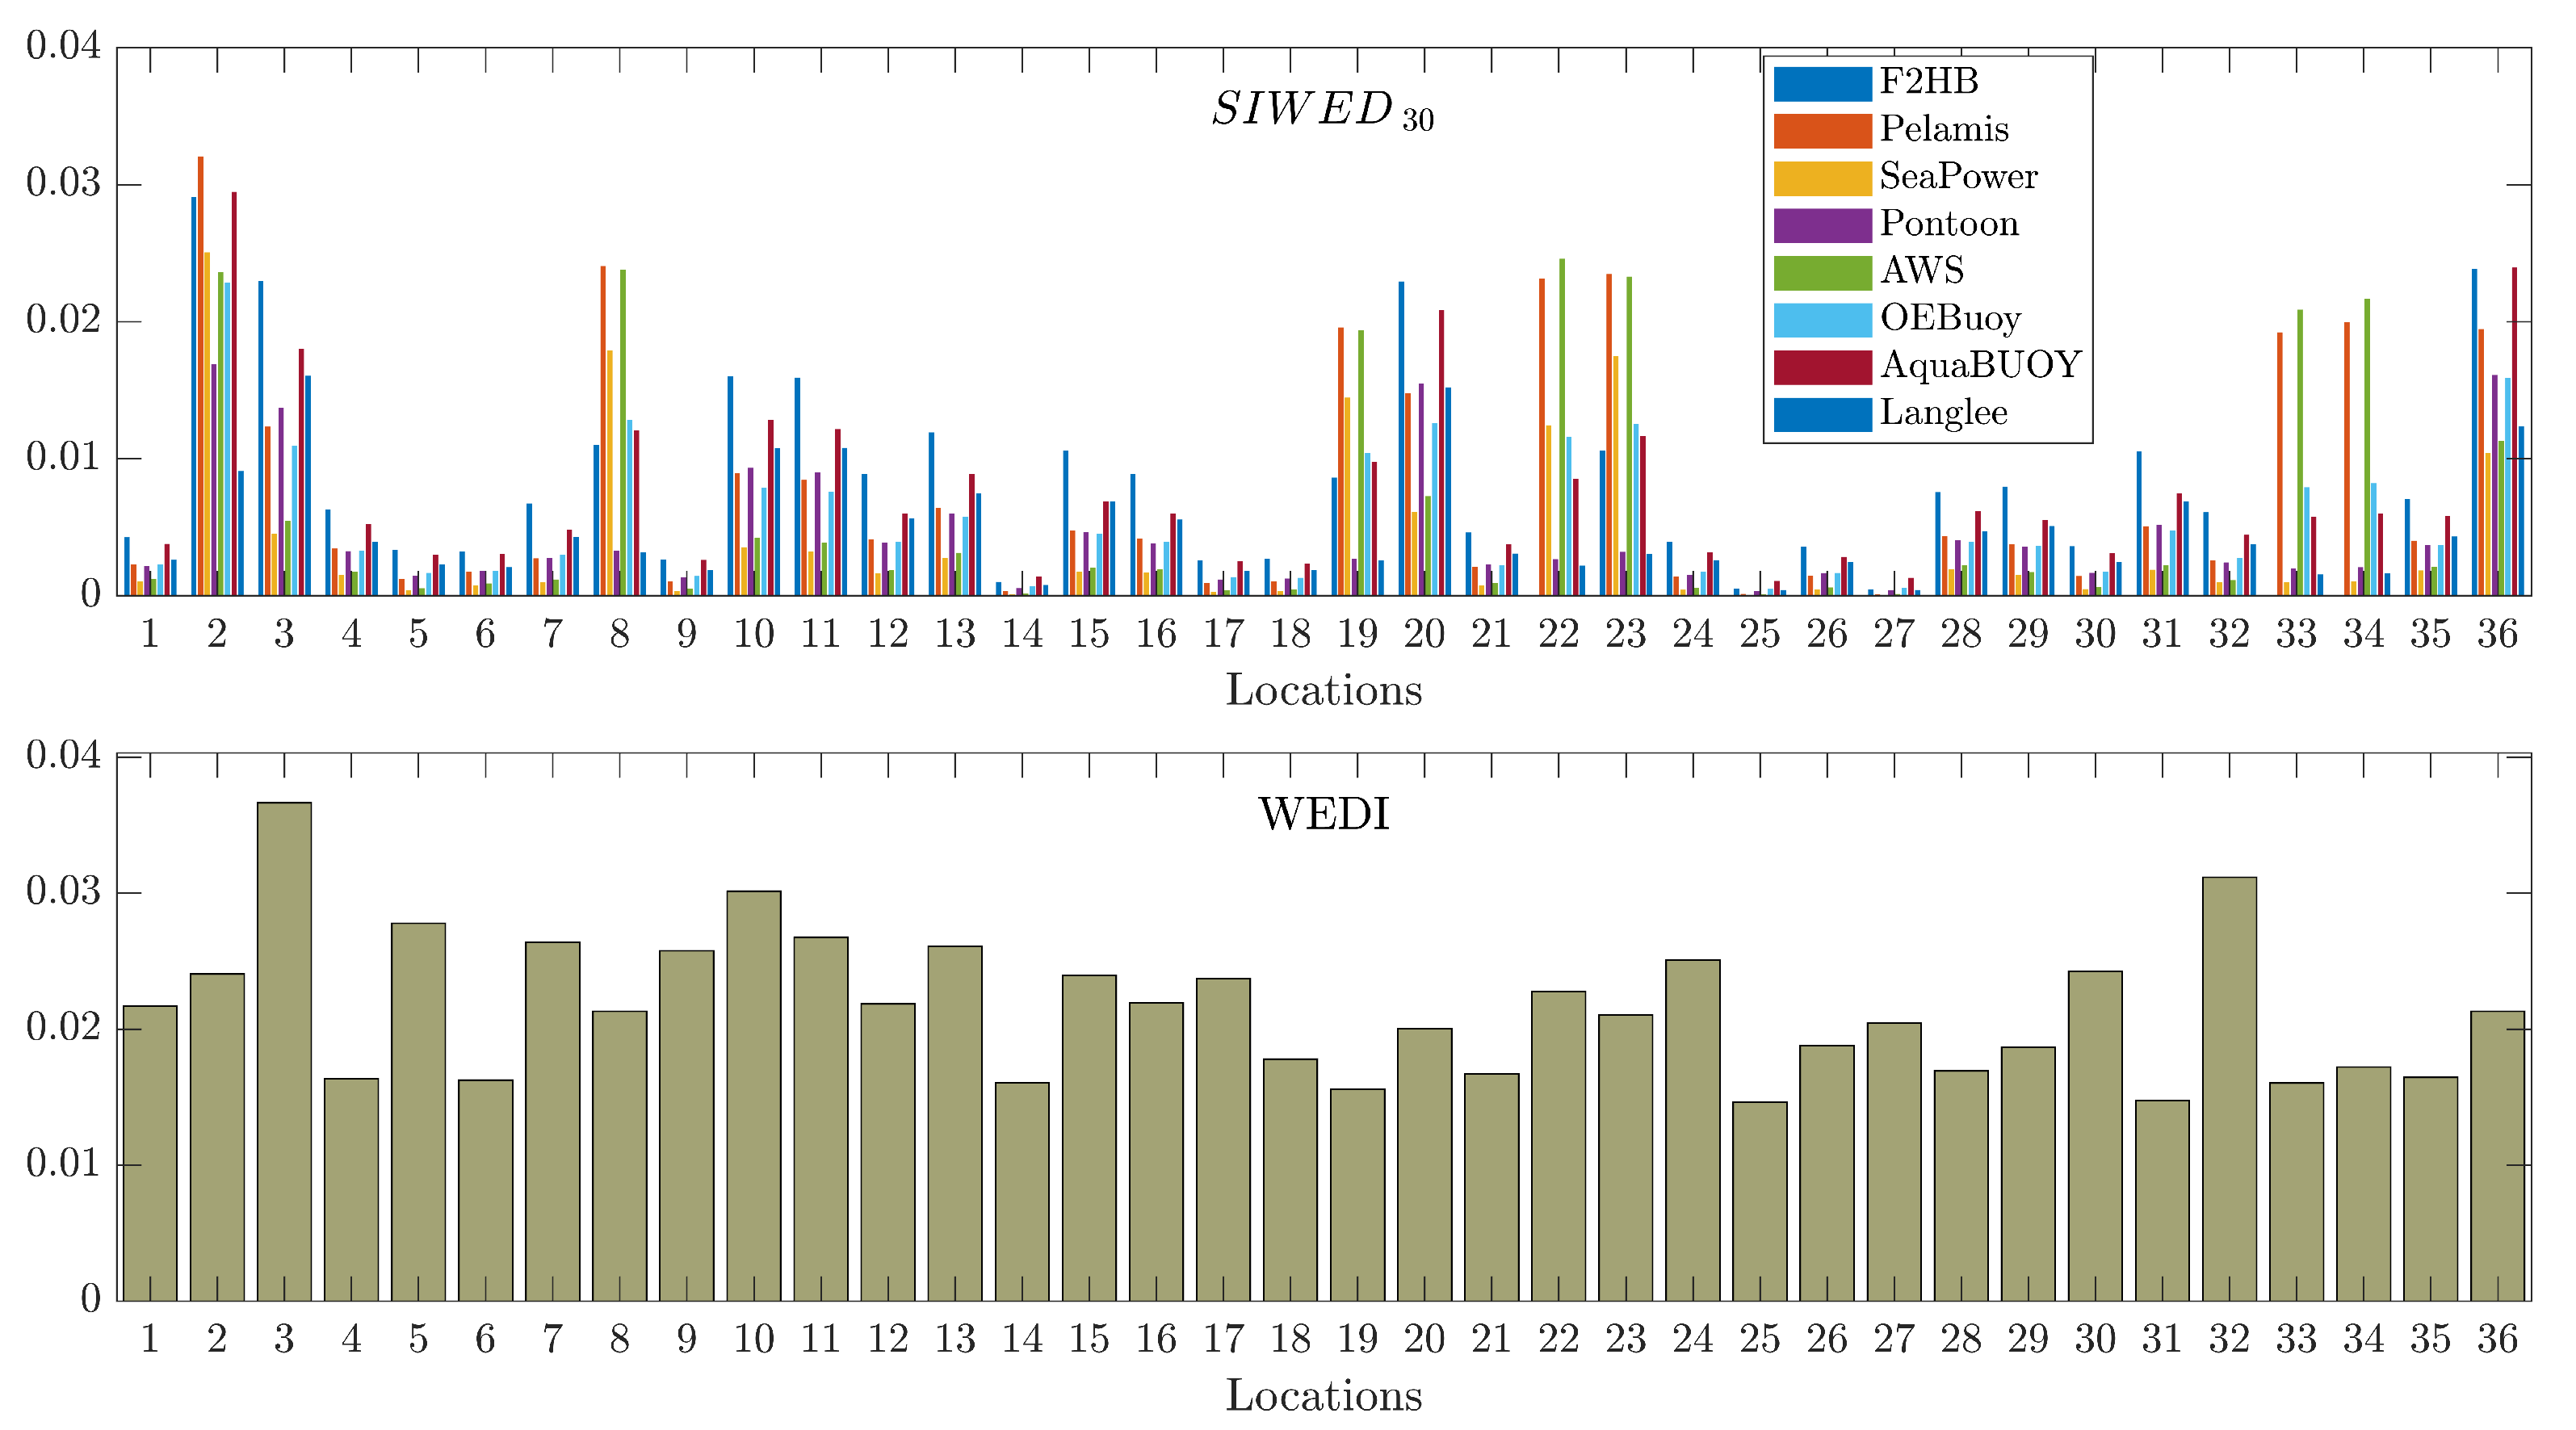
Concerning the WEC performance, the SIWED results indicate that there are significant differences in this parameter among the evaluated WECs for each location, as shown in Figure 6. SIWED is one of the indices that allows us to determine, from a technical point of view, the most suitable locations for wave energy exploitation. The wave energy resource at these suitable locations is less affected by extreme storm conditions. It was found that the SIWED indices presented high variability among the evaluated WECs at all locations, indicating that the wave conditions in the region are not the most desirable to obtain constant and suitable energy. Locations with higher SIWED values are 2, 3, 8, 19, 20, 22, 23, 33, 34, and 36, although only for some WECs. On the other hand, the WEDI index does not show a distinction among WECs. This index indicates that all locations present WEDI values around the mean value, except for the higher values at locations 3 and 32, as shown in the lower panel in Figure 6.
The remaining insight from the previous results leads to an evaluation of the WEC scaling to increase the efficiency of energy exploitation, which provides financial justification for its development.

3.2. WEC Scaling and Its Feasibility

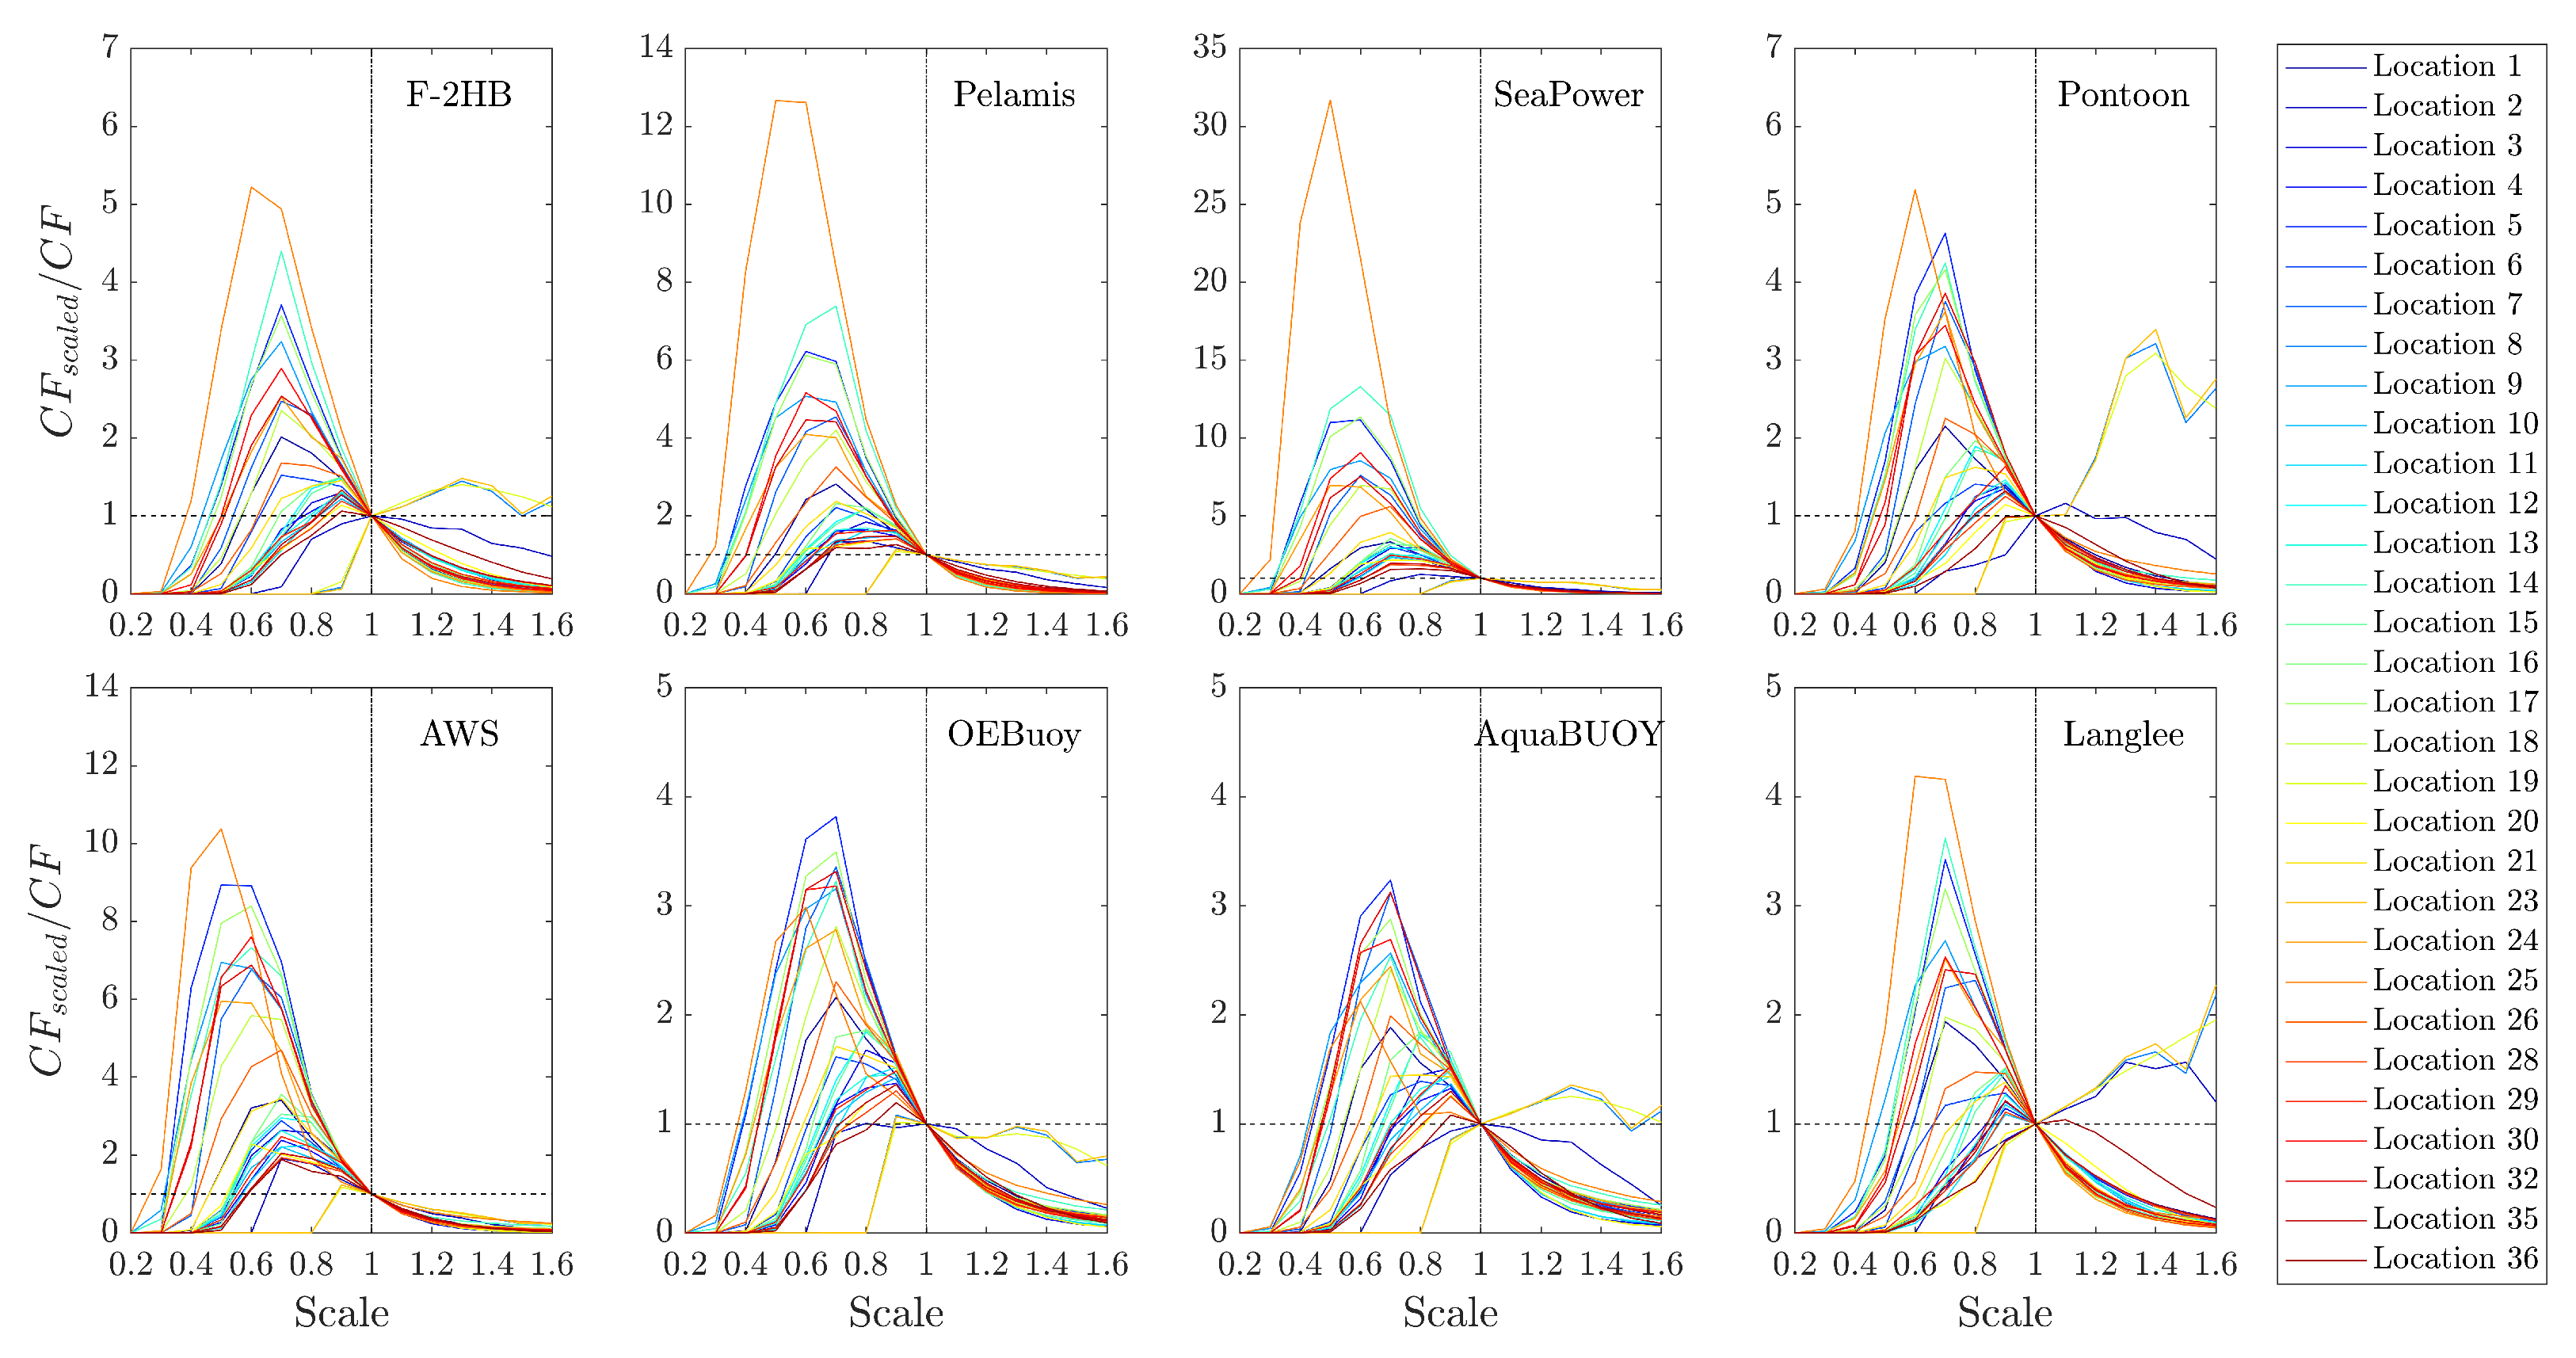
Figure 7 shows that the downsizing of the devices produces the highest CF for most locations. Locations 10, 18, and 20 present higher CF for the upscaling of the Pontoon device. In the case of the scaled F-2HB converter, it is observed that CF is increased at a scale of around 0.6 for most locations, with the exception of locations 8, 19, and 23, where the highest CF ratio occurs at the λ between 1.2 and 1.4. A similar pattern of the highest performance after WEC scaling has been found for all locations. It is remarkable how the SeaPower converter achieves up to approximately 30 times the CF of the prototype converter.
Likewise, the CFs of the scaled WECs for all considered λ values are shown in Figure 8. The λ values that produce the highest efficiency according to the CF ratio are summarized in Table 4.
Once the device scaling has been performed, the SIWED index is re-estimated for the scaled devices at all locations under its best performance scales, as indicated in Table 4. This parameter is called S I W E D 30 , or S I W E D 30 , s c a l e d , and its results are shown in Figure 9.
It is possible to detect some of the locations that offer greater potential for energy extraction according to the S I W E D 30 , s c a l e d . This is the case for locations 2, 3, 8, 19, 20, 22, 23, and 36, whose CF are considerably increased after the converter scaling, as in the case of F-2HB, Pelamis, SeaPower, and AWS.
Thus far, the exploitation capacities have been shown to be increased by the scaling of the converters; however, they still present lower CF values than those of other oceanic regions that offer higher wave energy potential, as aforementioned. The S I W E D 30 , s c a l e d values are even higher in magnitude than those of the North Sea [49]. Thus, the possibility of the higher survivability of the converters emerges, wherein the WECs will be less compromised than at the current studied locations.
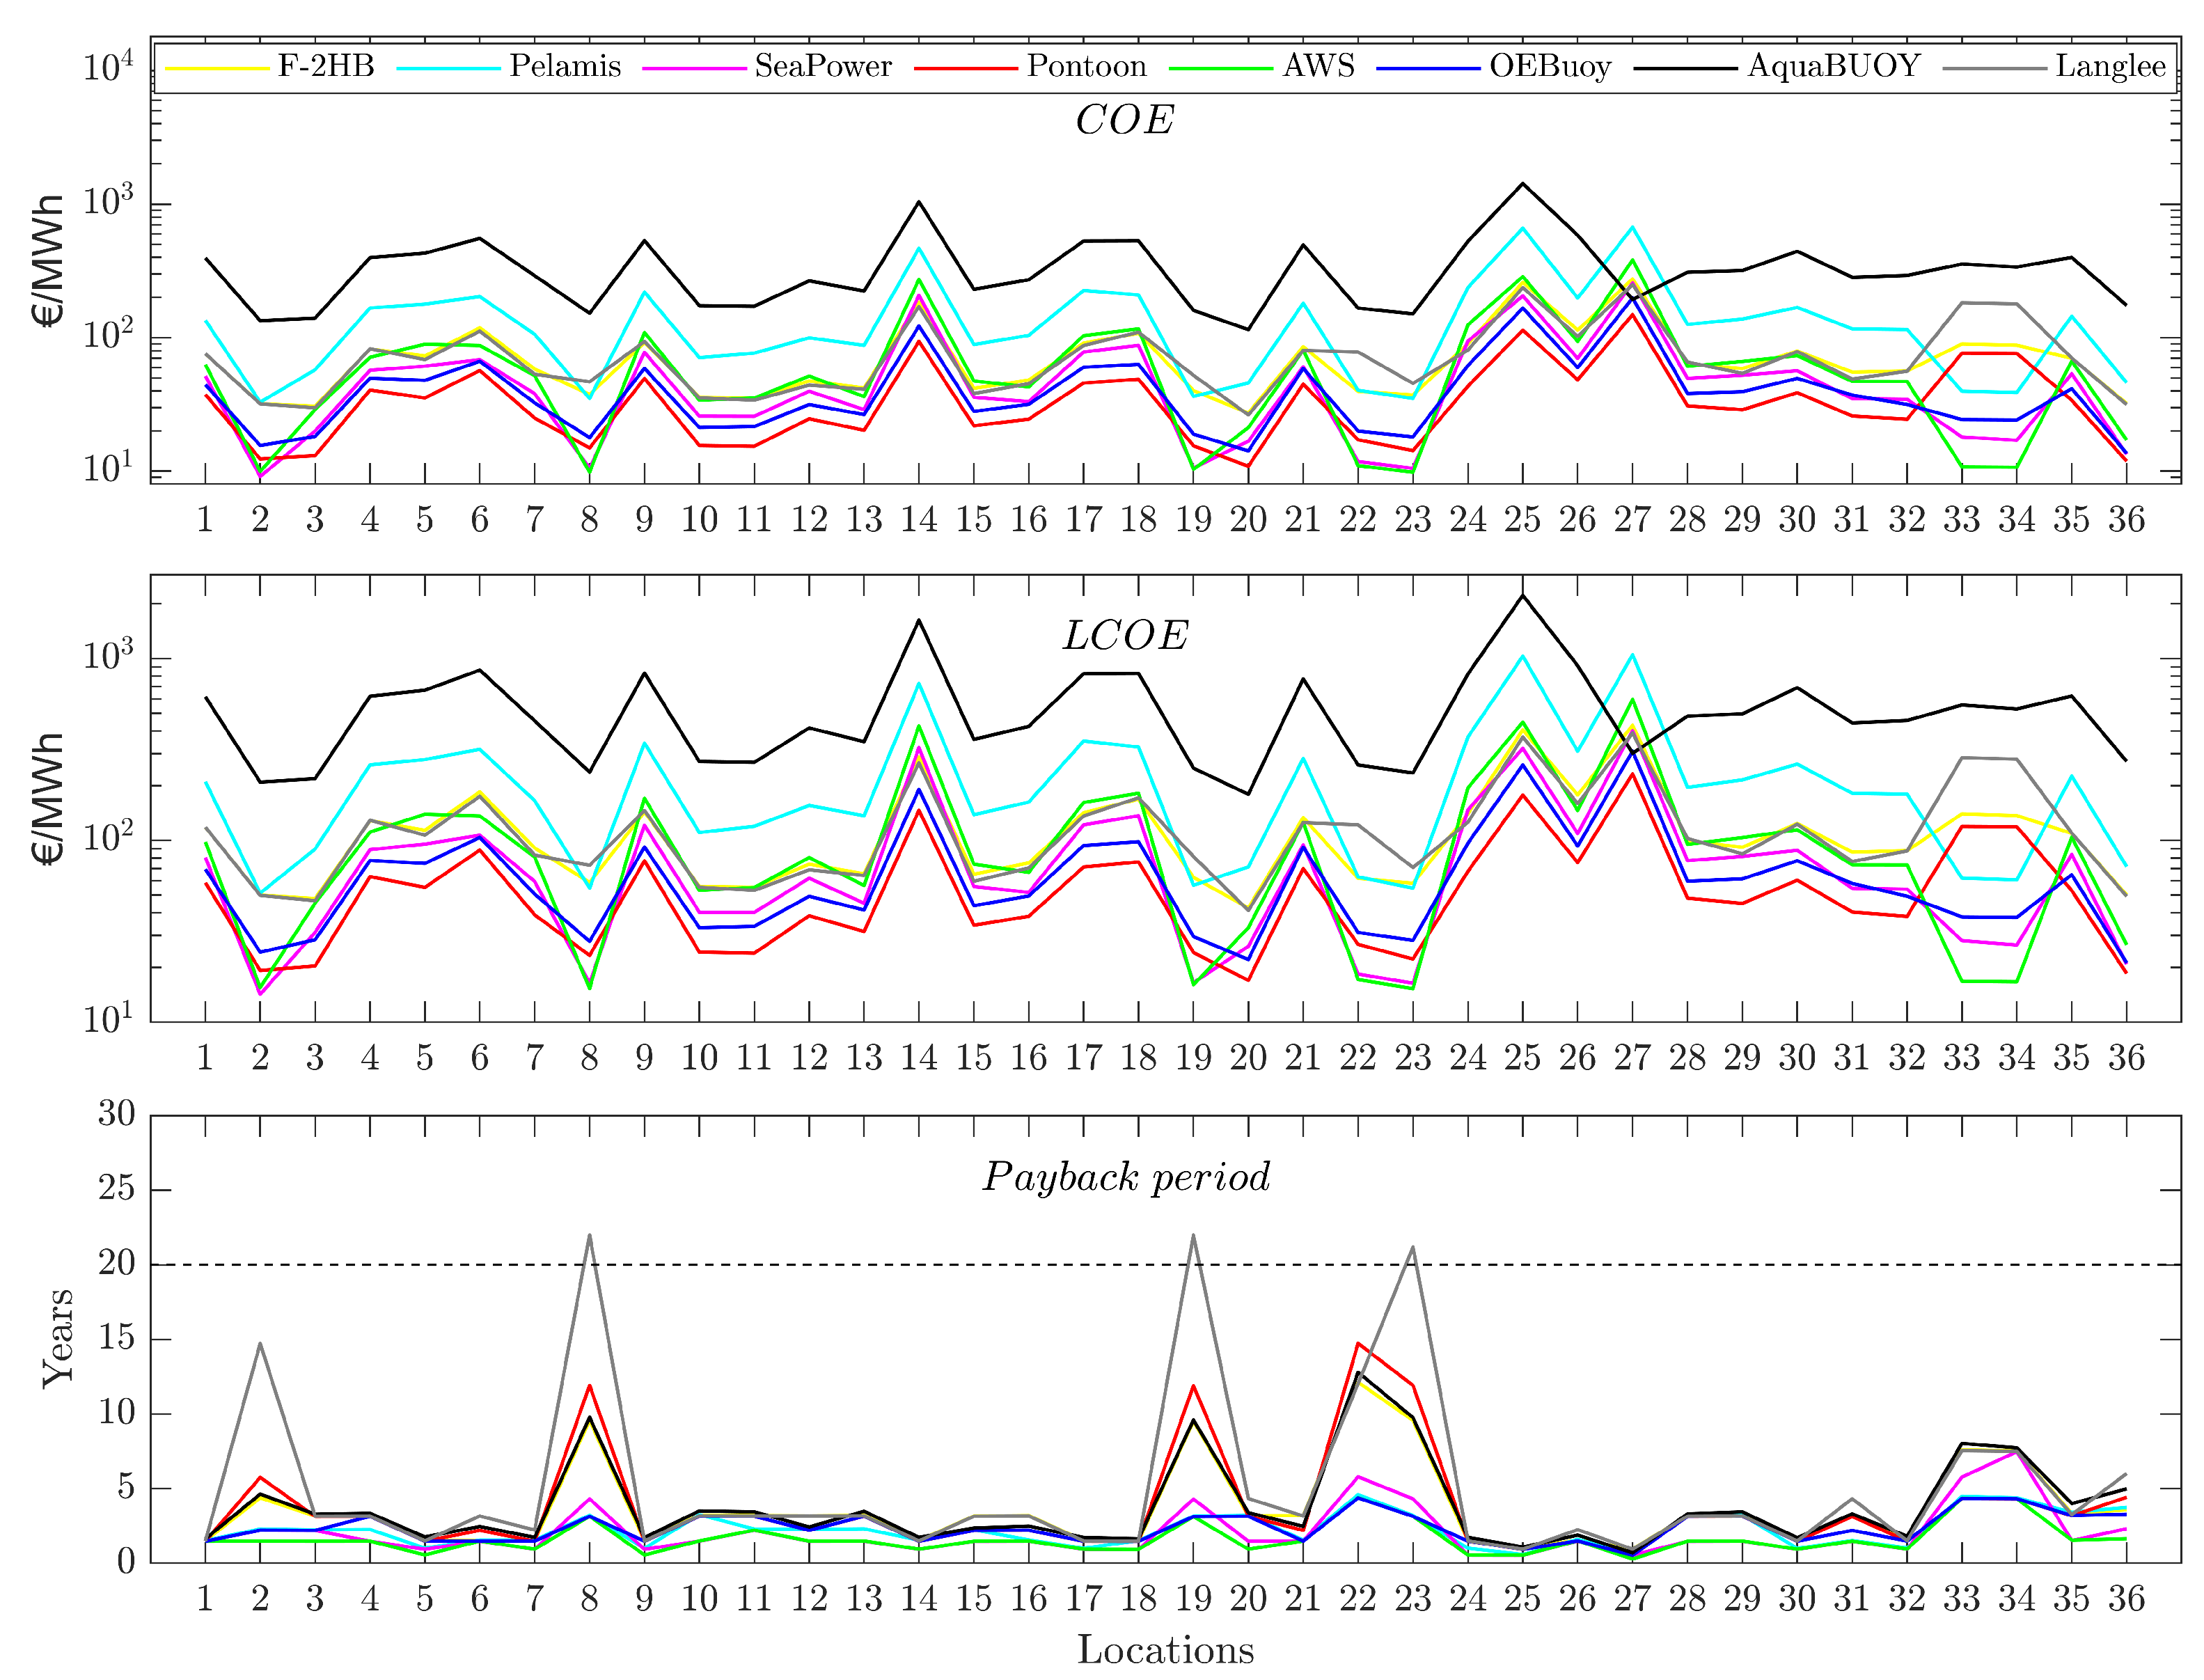
Moreover, since the CFs grow after downsizing most of the WECs, the associated costs in the CapEx and OpEx are reduced. The LCOE indicator show similar behavior for all locations, with low variation among the WECs. Nonetheless, SeaPower is the device with higher related costs for almost all locations. The LCOE costs vary from EUR 17.23 to EUR 2631.68 per MWh, the COE costs vary from EUR 11.04 to EUR 1686.06 per MWh, and the CapEx values range from EUR 0.09 million to EUR 5.24 million. A joint depiction of the LCOE and CapEx costs is shown in Figure 10. The F-2HB, Pontoon, and Langlee converters present high CapEx values at some locations; however, their associated LCOE values remain in an acceptable range.
The maximum LCOE and CapEx for the SeaPower and AquaBUOY converters are considered higher values in economic terms, although their payback periods are under the maximum threshold of 20 years. The LCOE, COE, and PBP trends are presented in Figure 11. The Langlee converter produces a PBP of 21 years at locations 8, 19, and 23, thus exceeding the non-feasibility threshold.
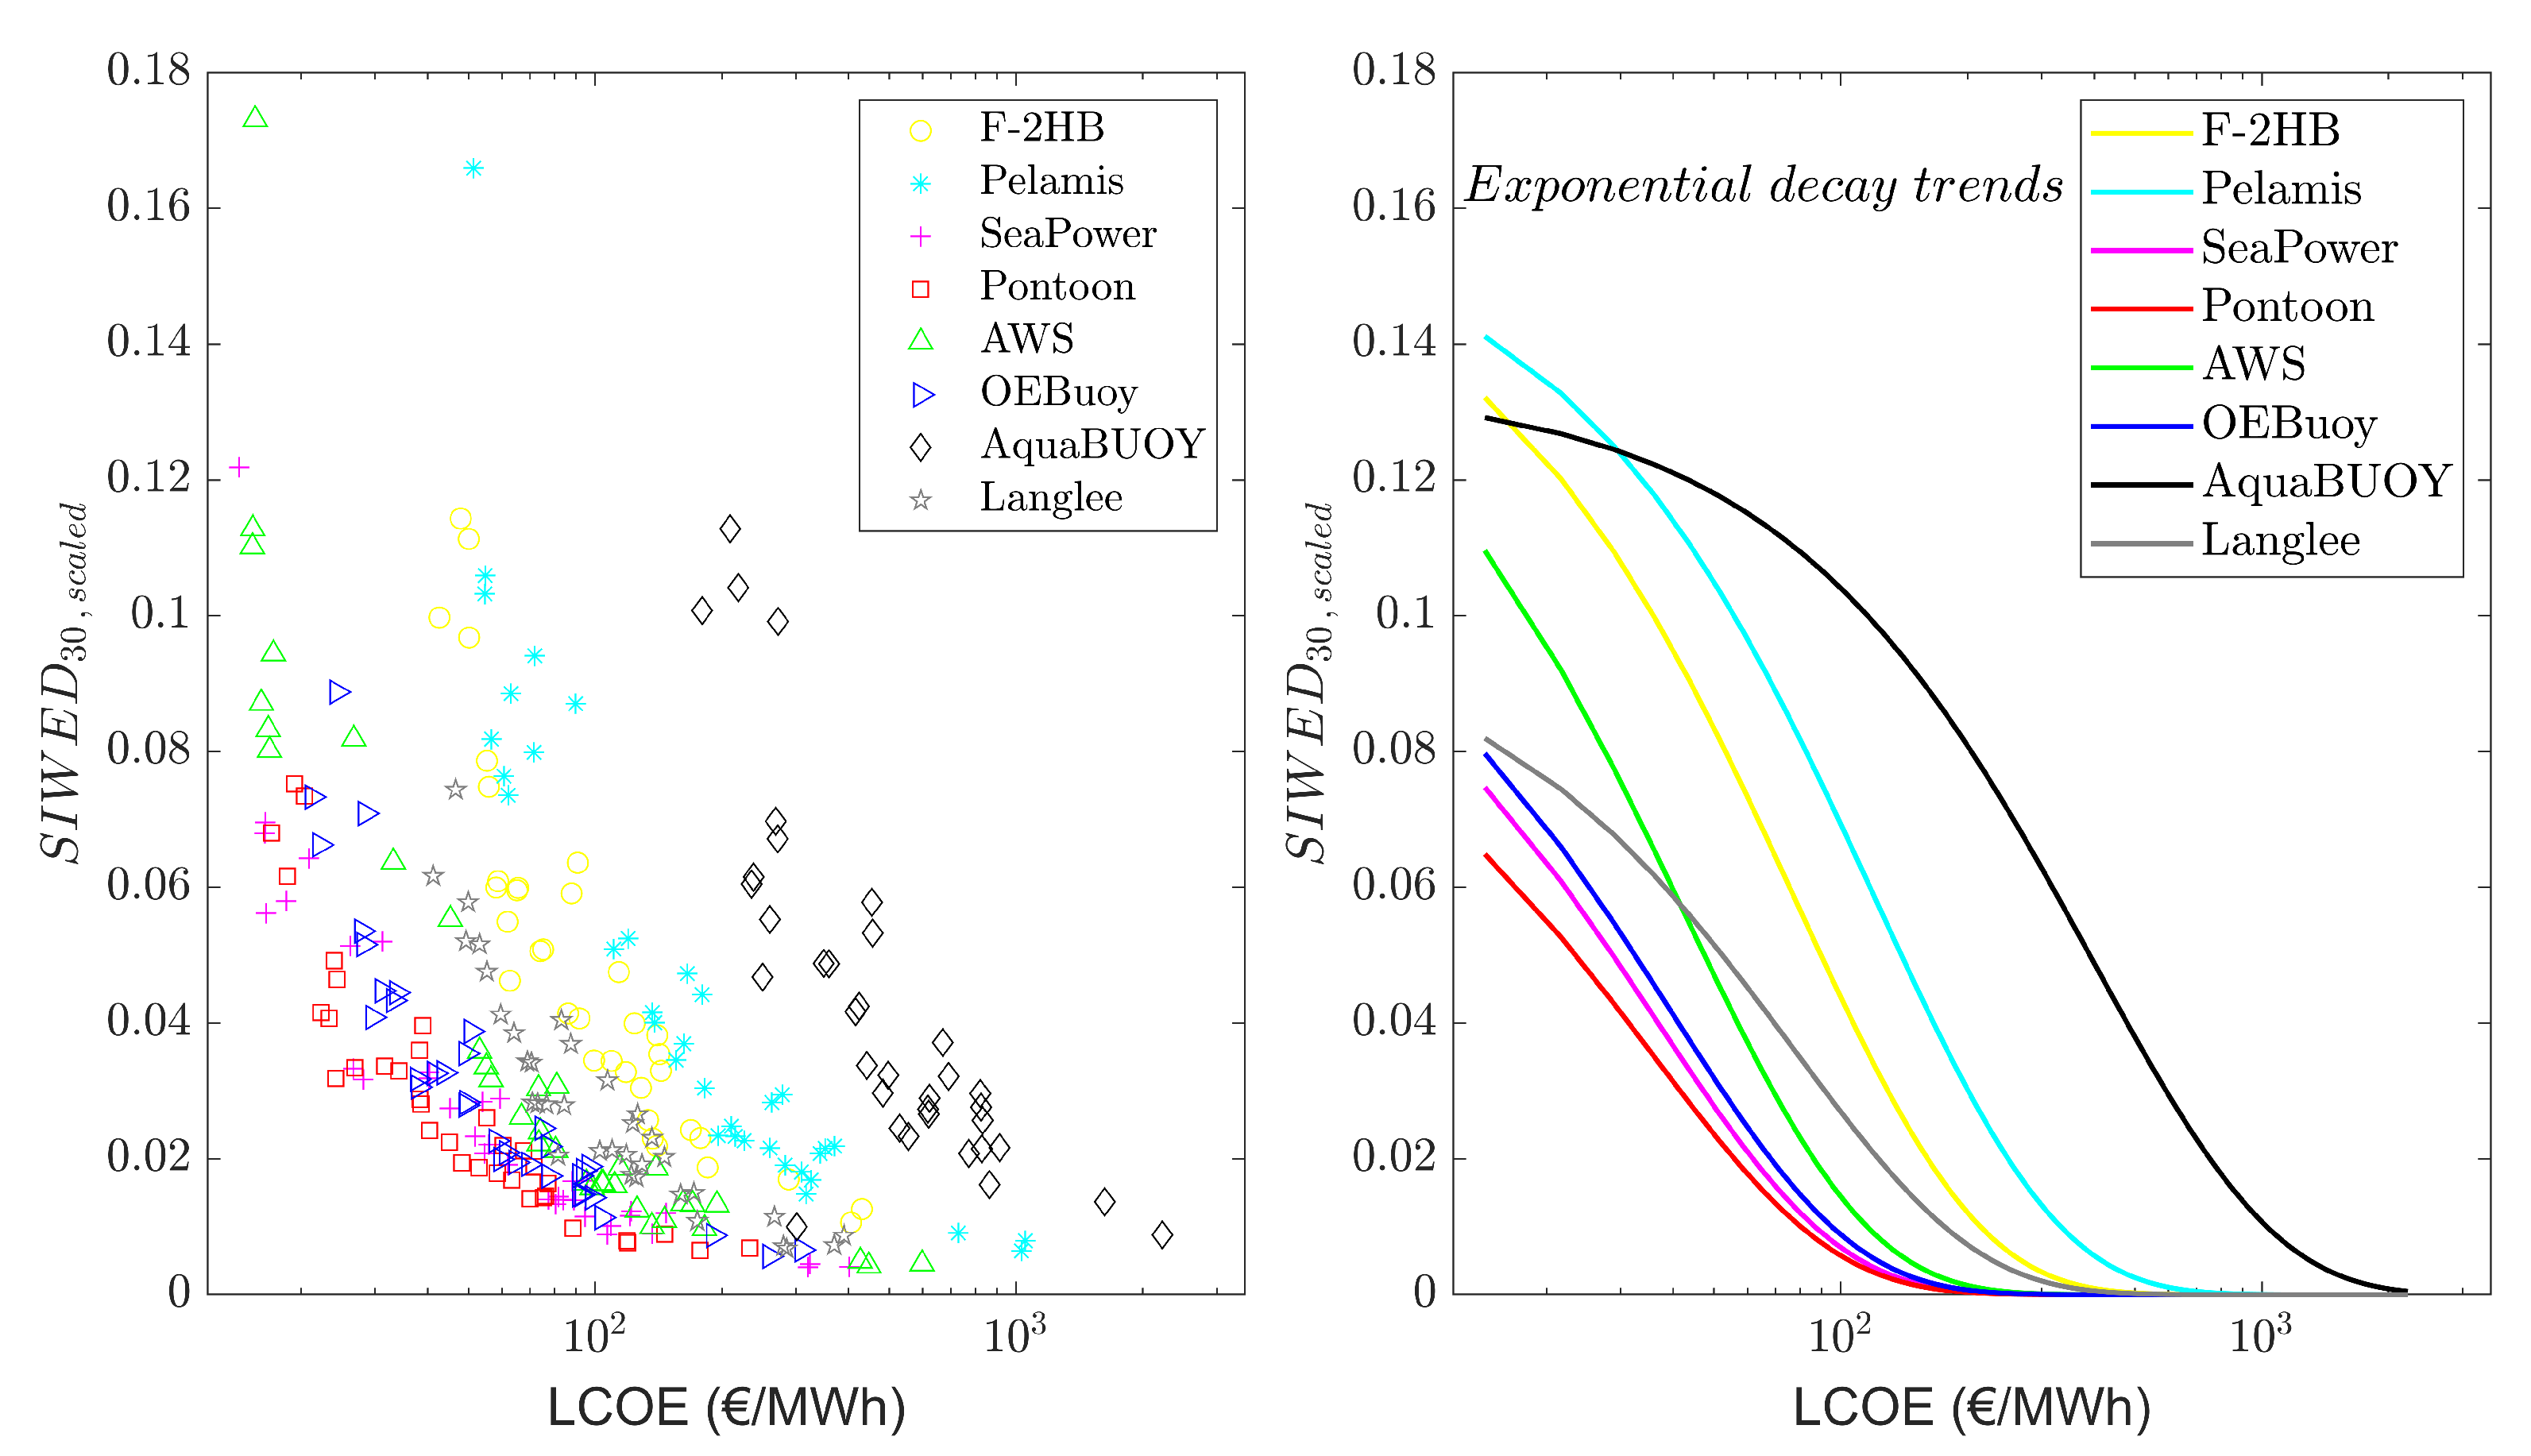
The scatter points shown in the left panel in Figure 12 describe graphically the performance and behavior as a function of the LCOE for all locations and all WECs, whereas the right panel of the figure shows the exponential decay trend based on the scatter points in the left panel. These trends facilitate the identification of differences in costs for each converter type. It is found that when downsizing the devices, Pelamis and F-2HB tend to offer greater performance based on the implicit CF in the S I W E D 30 , s c a l e d .

4. Discussion and Conclusions

The evaluation criteria for converters such as WEDI and SIWED before the devices’ scaling provide an initial idea about the locations at which the waves present less variability under moderate regime conditions, although they offer different patterns among locations. An insight is gained into the importance of considering extreme events in evaluating the performance of the converters after the WEDI and SIWED assessment for the non-scaled converters. Some locations seem to offer higher performance based on the WEDI, whereas these locations do not seem to have the highest SIWED performance, as in locations 2, 8, 19, and 20, for instance. Nevertheless, at this point, we simply note the high SIWED variability among WECs at each location.
Most locations reach a higher CF after WEC downsizing or, in other words, by adjusting the maximum wave converter power rate to the local wave conditions. This also has positive economic implications, as many of the CapEx and OpEx costs are related to the WECs’ sizes [32], even more so considering that all the assessed locations are in nearshore regions. Specifically, the Langlee converter has a flap mechanism as a PTO wherein the downsizing does not improve substantially its performance. In other words, for this type of converter, scaling to determine the new efficiency implicit in the CF is not advisable. However, when Langlee is downsized, its related costs are reduced too, as a function of λ (see Table 2).
In terms of the evaluated costs, the LCOE has been considered as the main economic index since it involves the profitability over the lifetime of the WEC. This factor implicitly takes into account the influences of inflation and the lending rates through the discount rate. However, limitations in the economic analysis, such as a lack of knowledge of the associated operational costs [50,68], as well as the estimation of a given cost as a percentage of another, produce inaccurate estimations of the real value of the investment.
The assumptions behind the COE and LCOE have been obtained from studies based on the North Sea and the Mediterranean Sea, which makes them valid for the Ligurian Sea. Given the limited exploration of the marine energy resources in many regions around the world, it is not possible to establish the factors associated with the COE and LCOE, as indicated by Wang et al. [69]. Certainly, it remains a drawback when generalizing or comparing potential cost findings in other latitudes of the world, where such technologies have not yet been implemented. In addition, the costs of marine energy generation are also related to the local wave conditions, so extrapolating the costs based on parameters such as the wave power or capacity factors would be inappropriate. In particular, the consideration of converter survival in this study using the SIWED parameter again focuses on a given region, given that extreme wave conditions vary with regional and global ocean meteorological conditions. Nevertheless, once the mean and extreme wave conditions have been characterized by a safety level for the converter, it is possible to determine the cost of the device and its components at any geographic location, as demonstrated in this evaluation.It has already been described how CapEx was estimated in this study; however, it is worth emphasizing that related costs such as concessions and permissions have not been considered. However, previously, in the selection of locations for wave energy harnessing, the locations of WECs in sectors with environmental limitations, and socioeconomic activities such as fishing, military protection, navigation, and recreation, have been included. Then, the OpEx costs entail considerable uncertainty, particularly owing to the dynamism of the currency market and the lack of knowledge of the concession cost for the exploitation of offshore energy resources, which leads to a greater margin of error. Currently, there is no regulation on the exploitation and commercialization of wave energy on the Italian coast [70]. This shortcoming needs to be addressed in order to progress along a path of sustainability, where GHG emissions would be reduced, the energy matrix would be diversified, and marine biodiversity would be protected.
In the context of MREs, the LCOE values of wind offshore farms for all of Italy, for instance, have been estimated at up to EUR 350 per MWh [71], which is a higher cost than EUR 209.34 per MWh, the mean LCOE of the WECs assessed in this study. Another comparison corresponds to the LCOE of between USD 274 and USD 361 per MWh (in 2020) for the combination of energy produced by solar resources and induced currents from tides, to produce up to 45 MW of installed capacity in the waters of the Philippines Sea and neighboring countries [72]. One should also note the cost of the study carried out in the Indonesian archipelago for ocean thermal energy conversion (OTEC), whose LCOE for 100 MW of installed capacity (conducted in 2018) was USD 156 per MWH [73].
In addition, the LCOE values obtained would be reduced during the next decade, according to the predictions provided by Piscopo et al. [74,75], where the LCOE values will be reduced to EUR 150 per MWh and EUR 100 per MWh in 2030 and 2035, respectively. A similar trend has been presented by Simonetti and Cappietti [30], who estimated a decrease in the future scenario (2071–2100) of the LCOE by about 20% along the Ligurian Sea, compared to the present period between 1986–2016. Such estimations are included in feasibility studies and investigations; when compared to the LCOE costs in this study, it is found that WECs in the Ligurian Sea become an attractive option, as long as there is viability in their PBP.
With respect to the PBP for energy converters, it is pertinent to consider the maintenance costs, such as repowering in the converters, mainly for those classified as OWC converters [76]. For the assessed WECs, since they are floating oscillating bodies, their costs do not consider the repowering cost: after its lifetime, it is more convenient to change the WEC rather than repair it. It was found that the converter with the highest PBP was SeaPower for the majority of locations, followed by AWS and OEBuoy.
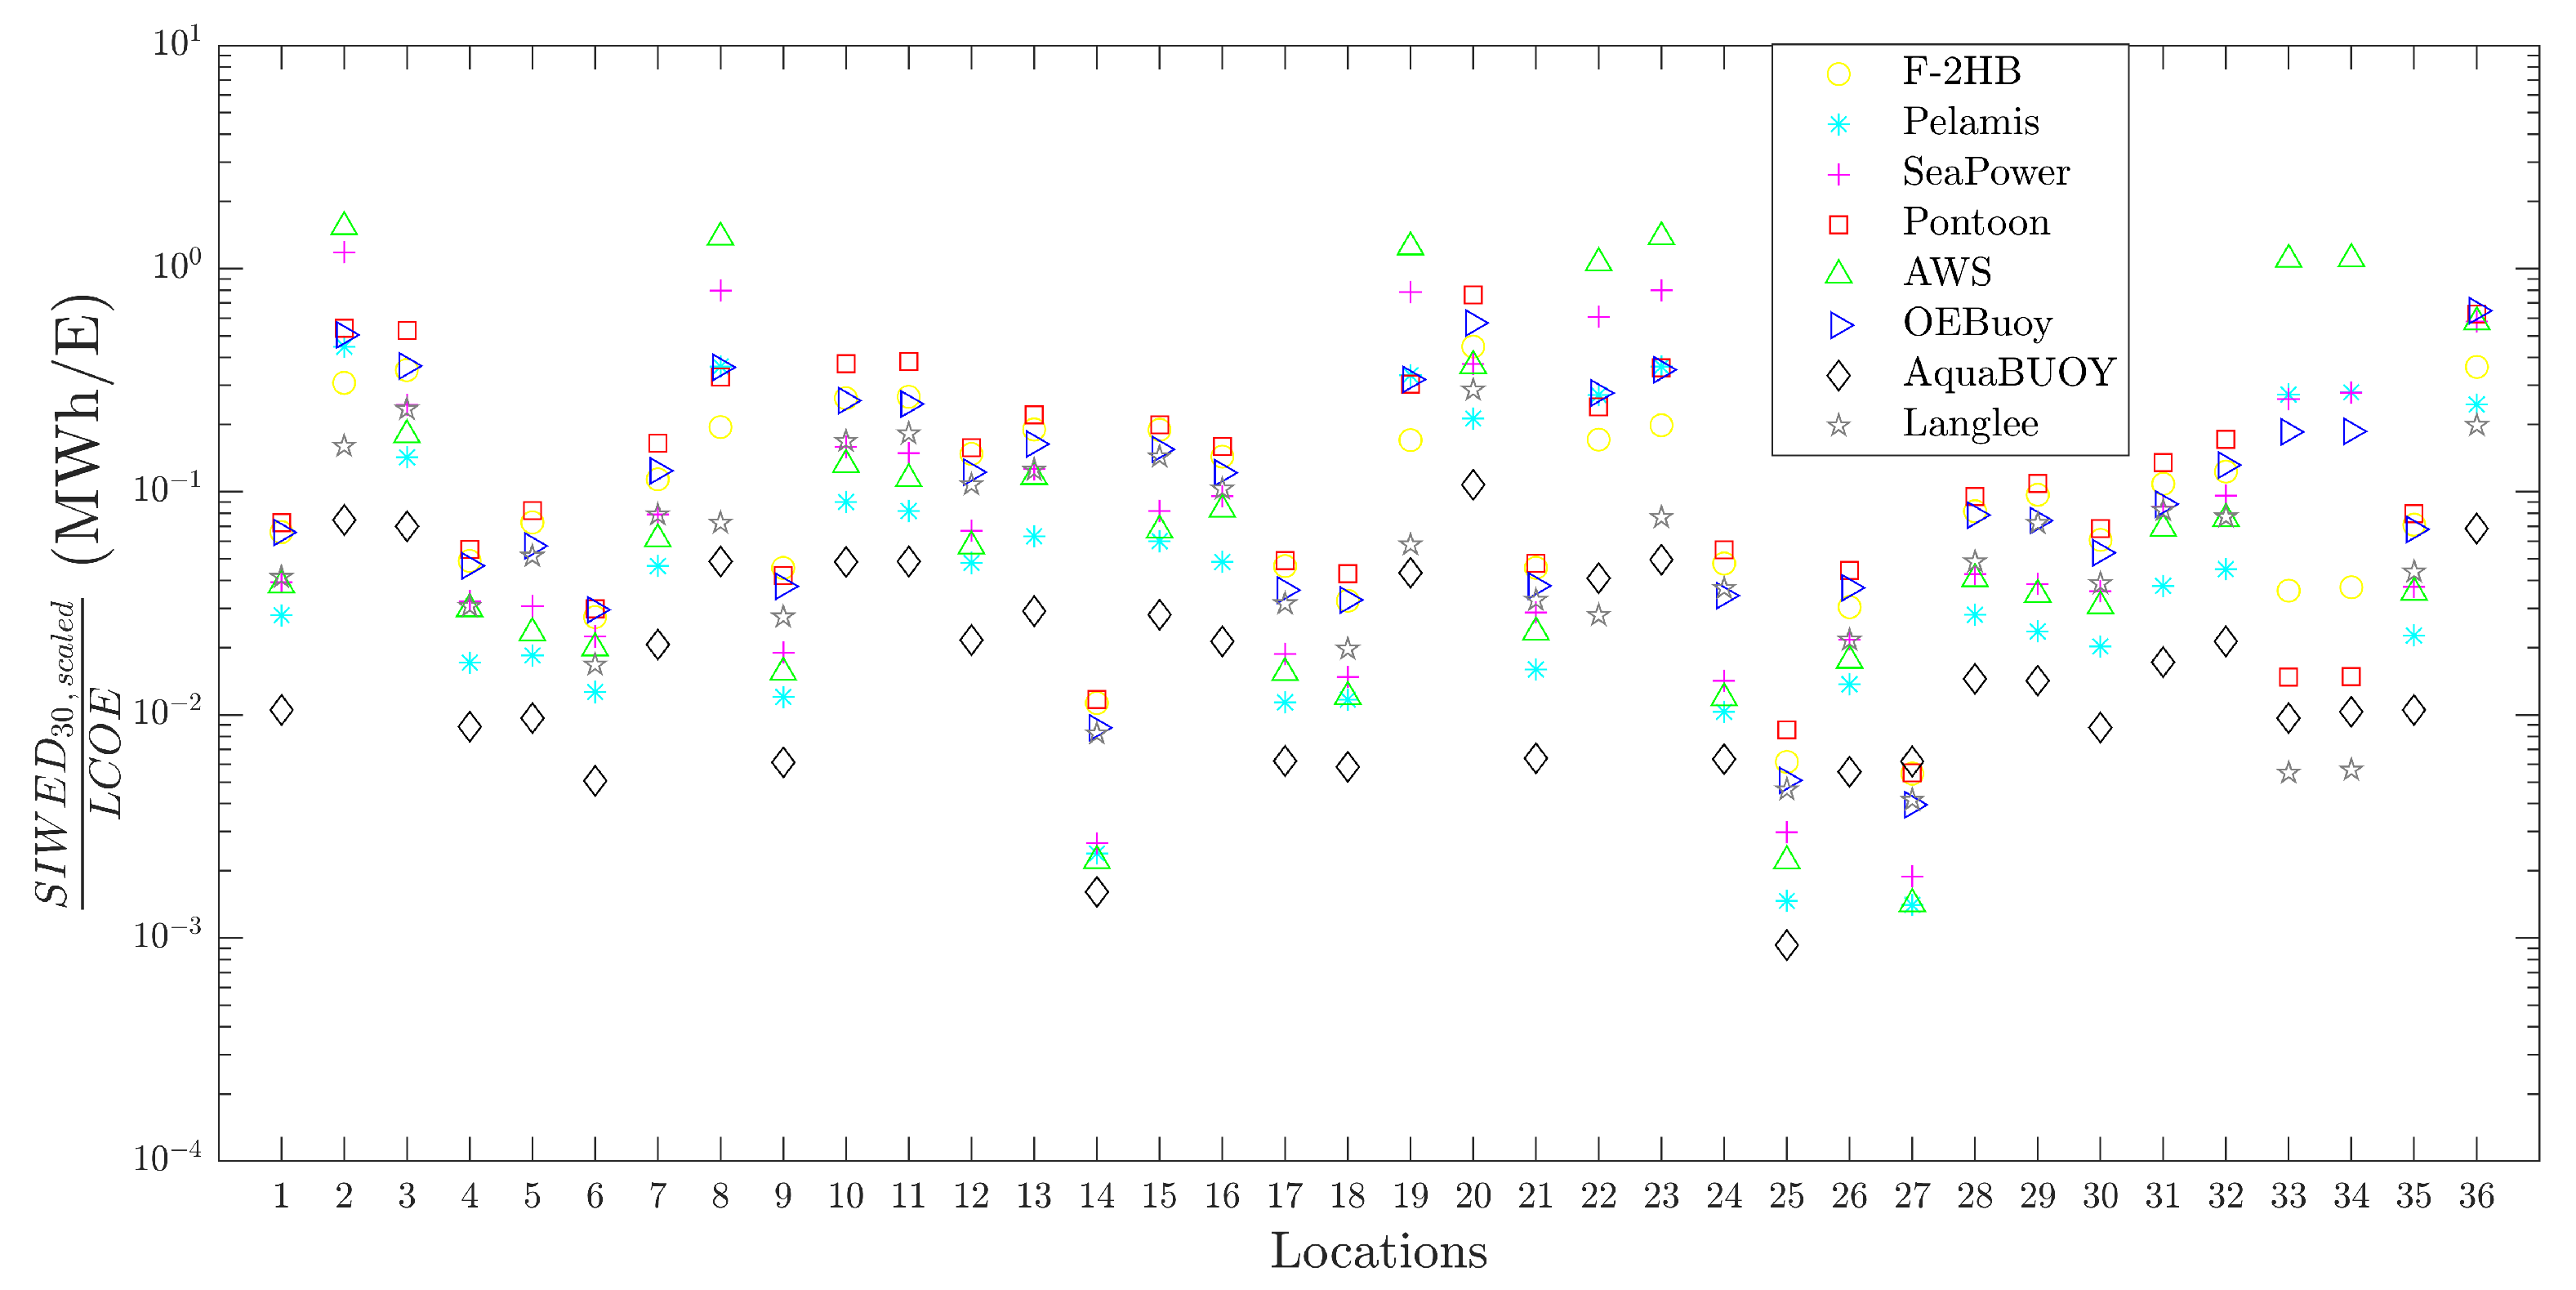
The relationship between the S I W E D 30 , s c a l e d and the LCOE has been estimated to determine which scaled device is the optimal one at each location, which corresponds to the maximum value at each location of the estimated rate of S I W E D 30 , s c a l e d (shown in Figure 6) divided by the LCOE, as shown in Figure 13.
The ratio shown in Figure 13 has not considered the PBP, which is why the converters whose PBP exceeds the threshold illustrated in Figure 11 must be excluded from the selection of the optimal converter. Specifically, the Langlee converter exceeds the viable PBP limit at locations 8, 19, and 23. The optimal converters by location are listed in Table 5.
In brief, it is concluded that the Ligurian Sea has potential for wave energy harvesting once the wave converters have been scaled. Maritime planning and mapping increase the quality and safety of wave energy deployment. An assessment from a technical and economic point of view clearly demonstrates the feasibility of energy harvesting through several WECs. The performance indices SIWED and WEDI have been demonstrated to be reliable indicators according to the results obtained in this study. It has been found that the costs of deploying wave energy converters vary depending on the location, and the type of WEC has a significant influence on the initial cost of the project.
The use of financial incentives for the exploitation of renewable energies can be applied to develop a marine energy strategy in this type of study. Finally, challenges such as the regulation of the commercialization, management, and establishment of marine energy are, however, still to be carefully addressed, as well as to promote the growth of ongoing research on marine energy resources and deployment technologies.

Author Contributions

M.C.-G. contributed to the methodology, formal analysis, investigation, and visualization. G.L. contributed to the formal analysis, supervision, and validation. G.B. contributed to the conceptualization, supervision, and validation. M.C.-G. and G.B. carried out the data curation, whereas all three authors aided in the writing of the manuscript. All authors have read and agreed to the published version of the manuscript.

Funding

This research received no external funding.

Institutional Review Board Statement

Not applicable.

Informed Consent Statement

Not applicable.

Data Availability Statement

The data presented in this study are available on request from the corresponding author.

Acknowledgments

The authors would like to thank the Istituto Idrografico della Marina Italiana (IMM) for their collaboration with the relevant mapping information.

Conflicts of Interest

The authors declare no conflict of interest.

Nomenclature

AEPAnnual electricity production (MWh per year)
CapExCapital expenditure (€ per MWh)
CFCapacity factor
COECost of energy (€ per MWh)
Δ T Time duration (hours)
E 0 Total energy produced (MWh)
Euro
EMECEuropean Marine Energy Center
EVAExtreme value analysis
F-2HBFloating two-body heavy buoy
F r Froude number
GHGGreenhouse gases
GISGeographic Information System
GPDGeneralized Pareto distribution
H m 0 Zeroth-order-moment wave height (m)
J w a v e Maximum wave power (kW/m)
£Sterling pound
LCOELevelized cost of energy (€ per MWh)
λ Scale factor
MREMarine renewable energy
OpExOperational expenditure (€ per MWh)
OTECOcean thermal energy conversion
OWCOscillating water column wave energy converter
P 0 Nominal rated power (kW)
P M Power matrix
PTOPower take-off
P w a v e Wave power (kW/m)
rDiscount rate (%)
SIWEDSelection Index for Wave Energy Deployments
T p Wave peak period (s)
T m 1 , 0 Wave energy period (s)
USD $United States Dollar
WECWave energy converter
WEDIWave Energy Development Index

Appendix A. Sources of Geographic Information System

Table A1. Sources of the geographic information layers.
Layer InformationSource
Marine protected areashttps://www.protectedplanet.net/en/thematic-areas/wdpa?tab=WDPA (accessed on 18 December 2022)
Marine vegetationhttp://srvcarto.regione.liguria.it/geoviewer2/pages/apps/geoportale/index.html (accessed on 16 December 2022)
Shore outfallsProvided by the IMM
Restricted military areasProvided by the IMM
Bathymetryhttps://www.gebco.net/data_and_products/gebco_web_services/web_map_service/ (accessed on 18 December 2022)
Port and harborshttp://srvcarto.regione.liguria.it/geoviewer2/pages/apps/geoportale/index.html (accessed on 11 December 2022)
Beacheshttp://srvcarto.regione.liguria.it/geoviewer2/pages/apps/geoportale/index.html (accessed on 11 December 2022)
Coastlinehttp://srvcarto.regione.liguria.it/geoviewer2/pages/apps/geoportale/index.html (accessed on 19 December 2022)
12-nautical-miles boundaryhttps://www.marineregions.org/downloads.php (accessed on 18 December 2022)
Marine fauna atlashttps://www.marineregions.org/downloads.php (accessed on 18 December 2022)
Concessions for coastal workshttp://srvcarto.regione.liguria.it/geoviewer2/pages/apps/geoportale/index.html (accessed on 16 December 2022)
Navigation routeshttps://www.ogc.org/standards/wms (accessed on 16 December 2022)

Appendix B. Locations and Features of Wave Energy Converters

Table A2. WEC locations shown in Figure 2.
LocationLongitude ( )Latitude ( )Depth (m)Distance to
the Shoreline (km)
17.5444143.77087531.26
27.5815743.76901512.61
37.6356043.77343891.12
47.7246443.78236561.70
57.7901143.79527502.35
67.8611943.81292612.06
77.9533743.82901682.03
87.9850143.83958552.08
98.0653643.87079551.97
108.1080543.88967522.99
118.1556143.91685582.48
128.1906343.967881031.71
138.2592744.06441752.74
148.2911644.12218602.06
158.3653944.16223901.17
168.4388444.213631162.14
178.4677244.27304641.99
188.5307444.32048521.29
198.5892444.35409510.71
208.6658744.37254612.00
218.7246844.39703582.18
228.7503844.360381027.03
238.8312244.39960541.88
248.8780244.38630702.05
258.9268444.38100631.21
269.0136344.35465853.21
279.1330544.32701701.17
289.1936544.29541991.26
299.2938144.29624532.48
309.3817144.25016741.81
319.4714544.22088511.40
329.5766644.15170722.64
339.6849144.08329654.49
349.7513344.06773522.07
359.7853043.99765536.96
369.8900943.915065314.94
Figure A1. Power matrices of assessed WECs. Data taken from [24,33,41,42].
Sustainability 15 09113 g0a1

References

  1. IEA; IRENA; U.W.B.; WHO. Tracking SDG 7: The Energy Progress Report 2022. 2022. Available online: https://www.worldbank.org/en/topic/energy/publication/tracking-sdg-7-the-energy-progress-report-2022 (accessed on 25 January 2023).
  2. Bozzi, S.; Archetti, R.; Passoni, G. Wave electricity production in Italian offshore: A preliminary investigation. Renew. Energy 2014, 62, 407–416. [Google Scholar] [CrossRef]
  3. Kulp, S.A.; Strauss, B.H. New elevation data triple estimates of global vulnerability to sea-level rise and coastal flooding. Nat. Commun. 2019, 10, 4844. [Google Scholar] [CrossRef] [PubMed] [Green Version]
  4. Pourali, M.; Kavianpour, M.R.; Kamranzad, B.; Alizadeh, M.J. Future variability of wave energy in the Gulf of Oman using a high resolution CMIP6 climate model. Energy 2023, 262, 125552. [Google Scholar] [CrossRef]
  5. Alessi, A.; Boi, E.; Malkowski, A.; Carlo, C.; Cresci, B.; Zanon, F.; Rana, G.; Furlan, F.; De Marchi, E.; Schiavon, R.; et al. Towards Wave Energy Utilization for Oil and Gas Assets and Wave Farms Development: The Adriatic Sea Demonstration Case. In Proceedings of the Offshore Mediterranean Conference and Exhibition, Ravenna, Italy, 27–29 March 2019. [Google Scholar]
  6. Lavidas, G. Energy and socio-economic benefits from the development of wave energy in Greece. Renew. Energy 2019, 132, 1290–1300. [Google Scholar] [CrossRef]
  7. Cornett, A.M. A global wave energy resource assessment. In Proceedings of the Eighteenth International Offshore and Polar Engineering Conference, Vancouver, BC, Canada, 6–11 July 2008. [Google Scholar]
  8. Sasaki, W. Predictability of global offshore wind and wave power. Int. J. Mar. Energy 2017, 17, 98–109. [Google Scholar] [CrossRef]
  9. Falcão, A.F.d.O. Wave energy utilization: A review of the technologies. Renew. Sustain. Energy Rev. 2010, 14, 899–918. [Google Scholar] [CrossRef]
  10. Foteinis, S. Wave energy converters in low energy seas: Current state and opportunities. Renew. Sustain. Energy Rev. 2022, 162, 112448. [Google Scholar] [CrossRef]
  11. Europe, O.E. Ocean Energy: Key Trends and Statistics 2021. 2022. Available online: https://www.oceanenergy-europe.eu/category/publication-library/ (accessed on 14 January 2023).
  12. Dal Ferro, B. Wave and tidal energy: Its emergence and the challenges it faces. Refocus 2006, 7, 46–48. [Google Scholar] [CrossRef]
  13. International Trade Administration. Italy Country Commercial Guide. Available online: https://www.trade.gov/country-commercial-guides/italy-natural-gas-renewable-energy (accessed on 4 March 2023).
  14. Onea, F.; Rusu, E. Wind energy assessments along the Black Sea basin. Meteorol. Appl. 2014, 21, 316–329. [Google Scholar] [CrossRef]
  15. Soomere, T.; Eelsalu, M. On the wave energy potential along the eastern Baltic Sea coast. Renew. Energy 2014, 71, 221–233. [Google Scholar] [CrossRef]
  16. Lavidas, G.; Agarwal, A.; Venugopal, V. Availability and accessibility for offshore operations in the mediterranean sea. Am. Soc. Civ. Eng. 2018, 144, 05018006. [Google Scholar] [CrossRef] [Green Version]
  17. Liberti, L.; Carillo, A.; Sannino, G. Wave energy resource assessment in the Mediterranean, the Italian perspective. Renew. Energy 2013, 50, 938–949. [Google Scholar] [CrossRef]
  18. Dialyna, E.; Tsoutsos, T. Wave Energy in the Mediterranean Sea: Resource Assessment, Deployed WECs and Prospects. Energies 2021, 14, 4764. [Google Scholar] [CrossRef]
  19. Vicinanza, D.; Cappietti, L.; Ferrante, V.; Contestabile, P. Estimation of the wave energy in the Italian offshore. J. Coast. Res. 2011, 64, 613–617. [Google Scholar]
  20. Vicinanza, D.; Contestabile, P.; Ferrante, V. Wave energy potential in the north-west of Sardinia (Italy). Renew. Energy 2013, 50, 506–521. [Google Scholar] [CrossRef]
  21. Nezhad, M.M.; Groppi, D.; Rosa, F.; Piras, G.; Cumo, F.; Garcia, D.A. Nearshore wave energy converters comparison and Mediterranean small island grid integration. Sustain. Energy Technol. Assess. 2018, 30, 68–76. [Google Scholar]
  22. Aristodemo, F.; Ferraro, D.A. Feasibility of WEC installations for domestic and public electrical supplies: A case study off the Calabrian coast. Renew. Energy 2018, 121, 261–285. [Google Scholar] [CrossRef]
  23. Bozzi, S.; Giassi, M.; Miquel, A.M.; Antonini, A.; Bizzozero, F.; Gruosso, G.; Archetti, R.; Passoni, G. Wave energy farm design in real wave climates: The Italian offshore. Energy 2017, 122, 378–389. [Google Scholar] [CrossRef] [Green Version]
  24. Bozzi, S.; Besio, G.; Passoni, G. Wave power technologies for the Mediterranean offshore: Scaling and performance analysis. Coast. Eng. 2018, 136, 130–146. [Google Scholar] [CrossRef]
  25. Van Den Akker, T. Techno-Economic Analysis of Seven Wave Energy Converters and Their Contribution to System Adequacy: A Case Study on Sweden and the UK. Master’s Thesis, Utrecht University, Utrecht, The Netherlands, 2021. Available online: https://studenttheses.uu.nl/handle/20.500.12932/38944 (accessed on 4 March 2023).
  26. Vicinanza, D.; Margheritini, L.; Kofoed, J.P.; Buccino, M. The SSG wave energy converter: Performance, status and recent developments. Energies 2012, 5, 193–226. [Google Scholar] [CrossRef] [Green Version]
  27. Iuppa, C.; Cavallaro, L.; Vicinanza, D.; Foti, E. Investigation of suitable sites for wave energy converters around Sicily (Italy). Ocean. Sci. 2015, 11, 543–557. [Google Scholar] [CrossRef] [Green Version]
  28. Mattiazzo, G. State of the art and perspectives of wave energy in the Mediterranean sea: Backstage of ISWEC. Front. Energy Res. 2019, 7, 114. [Google Scholar] [CrossRef] [Green Version]
  29. Vannucchi, V.; Cappietti, L. Wave energy assessment and performance estimation of state of the art wave energy converters in Italian hotspots. Sustainability 2016, 8, 1300. [Google Scholar] [CrossRef] [Green Version]
  30. Simonetti, I.; Cappietti, L. Mediterranean coastal wave-climate long-term trend in climate change scenarios and effects on the optimal sizing of OWC wave energy converters. Coast. Eng. 2023, 179, 104247. [Google Scholar] [CrossRef]
  31. Majidi, A.; Bingölbali, B.; Akpınar, A.; Iglesias, G.; Jafali, H. Downscaling wave energy converters for optimum performance in low-energy seas. Renew. Energy 2021, 168, 705–722. [Google Scholar] [CrossRef]
  32. Chozas, J.F.; Kofoed, J.P.; Jensen, N.E.H. User Guide–COE Calculation Tool for Wave Energy Converters: Ver. 1.6-April 2014; Department of Civil Engineering, Aalborg University: Aalborg, Denmark, 2014. [Google Scholar]
  33. Babarit, A.; Hals, J.; Muliawan, M.J.; Kurniawan, A.; Moan, T.; Krokstad, J. Numerical benchmarking study of a selection of wave energy converters. Renew. Energy 2012, 41, 44–63. [Google Scholar] [CrossRef]
  34. Day, A.; Babarit, A.; Fontaine, A.; He, Y.P.; Kraskowski, M.; Murai, M.; Penesis, I.; Salvatore, F.; Shin, H.K. Hydrodynamic modelling of marine renewable energy devices: A state of the art review. Ocean. Eng. 2015, 108, 46–69. [Google Scholar] [CrossRef] [Green Version]
  35. Weatherall, P.; Marks, K.M.; Jakobsson, M.; Schmitt, T.; Tani, S.; Arndt, J.E.; Rovere, M.; Chayes, D.; Ferrini, V.; Wigley, R. A new digital bathymetric model of the world’s oceans. Earth Space Sci. 2015, 2, 331–345. [Google Scholar] [CrossRef]
  36. Lavidas, G.; Blok, K. Shifting wave energy perceptions: The case for wave energy converter (WEC) feasibility at milder resources. Renew. Energy 2021, 170, 1143–1155. [Google Scholar] [CrossRef]
  37. Lira-Loarca, A.; Cáceres-Euse, A.; De-Leo, F.; Besio, G. Wave modeling with unstructured mesh for hindcast, forecast and wave hazard applications in the Mediterranean Sea. Appl. Ocean. Res. 2022, 122, 103118. [Google Scholar] [CrossRef]
  38. Holthuijsen, L.H. Waves in Oceanic and Coastal Waters; Cambridge University Press: Cambridge, UK, 2010. [Google Scholar]
  39. Holmberg, P.; Andersson, M.; Bolund, B.; Strandanger, K. Wave power-Surveillance study of the development. Elforsk Rapp 2011, 11, 47. [Google Scholar]
  40. Magagna, D.; Monfardini, R.; Uihlein, A. JRC Ocean Energy Status Report 2016 Edition; Publications Office of the European Union: Luxembourg, 2016. [Google Scholar]
  41. Dunnett, D.; Wallace, J.S. Electricity generation from wave power in Canada. Renew. Energy 2009, 34, 179–195. [Google Scholar] [CrossRef]
  42. SeaPowerLtd. Power Matrix of SeaPower Platform. Available online: http://www.seapower.ie/seapower-powermatrix/ (accessed on 11 January 2023).
  43. SeaPowerLtd. SeaPower Platform—Technology. Available online: http://www.seapower.ie/our-technology/ (accessed on 15 January 2023).
  44. Tay, Z.Y.; Wei, Y. Power enhancement of pontoon-type wave energy convertor via hydroelastic response and variable power take-off system. J. Ocean. Eng. Sci. 2020, 5, 1–18. [Google Scholar] [CrossRef]
  45. Sinden, G. Variability of UK Marine Resources; The Carbon Trust: London, UK, 2005. [Google Scholar]
  46. Weinstein, A.; Fredrikson, G.; Parks, M.; Nielsen, K. AquaBUOY-the offshore wave energy converter numerical modeling and optimization. In Proceedings of the Oceans’ 04 MTS/IEEE Techno-Ocean’04 (IEEE Cat. No. 04CH37600), Kobe, Japan, 9–12 November 2004; Volume 4, pp. 1854–1859. [Google Scholar]
  47. Clemente, D.; Rosa-Santos, P.; Ferradosa, T.; Taveira-Pinto, F. Wave energy conversion energizing offshore aquaculture: Prospects along the Portuguese coastline. Renew. Energy 2023, 204, 347–358. [Google Scholar] [CrossRef]
  48. Lavidas, G.; Venugopal, V.; Friedrich, D. Wave energy extraction in Scotland through an improved nearshore wave atlas. Int. J. Mar. Energy 2017, 17, 64–83. [Google Scholar] [CrossRef] [Green Version]
  49. Lavidas, G. Selection index for Wave Energy Deployments (SIWED): A near-deterministic index for wave energy converters. Energy 2020, 196, 117131. [Google Scholar] [CrossRef]
  50. Lavidas, G. Developments of energy in EU–unlocking the wave energy potential. Int. J. Sustain. Energy 2019, 38, 208–226. [Google Scholar] [CrossRef]
  51. De Andres, A.; Medina-Lopez, E.; Crooks, D.; Roberts, O.; Jeffrey, H. On the reversed LCOE calculation: Design constraints for wave energy commercialization. Int. J. Mar. Energy 2017, 18, 88–108. [Google Scholar] [CrossRef]
  52. Harris, R.E.; Johanning, L.; Wolfram, J. Mooring systems for wave energy converters: A review of design issues and choices. Proc. Inst. Mech. Eng. Part B J. Eng. Manuf. 2004, 220, 159–168. [Google Scholar]
  53. Bosserelle, C.; Reddy, S.; Krüger, J. Cost Analysis of Wave Energy in the Pacific; Waves and Coasts in the Pacific; Pacific Community (SPC): Suva, Fiji, 2015. [Google Scholar]
  54. O’Connor, M.; Lewis, T.; Dalton, G. Techno-economic performance of the Pelamis P1 and Wavestar at different ratings and various locations in Europe. Renew. Energy 2013, 50, 889–900. [Google Scholar] [CrossRef]
  55. Myhr, A.; Bjerkseter, C.; Ågotnes, A.; Nygaard, T.A. Levelised cost of energy for offshore floating wind turbines in a life cycle perspective. Renew. Energy 2014, 66, 714–728. [Google Scholar] [CrossRef] [Green Version]
  56. Bjerkseter, C.; Ågotnes, A. Levelised Costs of Energy for Offshore Floating Wind Turbine Concepts. Master’s Thesis, Norwegian University of Life Sciences, As, Norway, 2013. [Google Scholar]
  57. Ocean, S. Ocean Energy: Cost of Energy and Cost Reduction Opportunities; SI OCEAN: Brussels, Belgium, 2013. [Google Scholar]
  58. Badcock-Broe, A.; Flynn, R.; George, S.; Gruet, R.; Medic, N. Wave and Tidal Energy Market Deployment Strategy for Europe; SI OCEAN: Brussels, Belgium, 2014. [Google Scholar]
  59. Astariz, S.; Iglesias, G. The economics of wave energy: A review. Renew. Sustain. Energy Rev. 2015, 45, 397–408. [Google Scholar] [CrossRef]
  60. Astariz, S.; Vazquez, A.; Iglesias, G. Evaluation and comparison of the levelized cost of tidal, wave, and offshore wind energy. J. Renew. Sustain. Energy 2015, 7, 053112. [Google Scholar] [CrossRef]
  61. Magagna, D.; Uihlein, A. Ocean energy development in Europe: Current status and future perspectives. Int. J. Mar. Energy 2015, 11, 84–104. [Google Scholar] [CrossRef]
  62. Magagna, D.; Uihlein, A.; Silva, M.; Raventos, A. Wave and Tidal Energy in Europe: Assessing Present Technologies. In Proceedings of the EWTEC 2015: European Wave and Tidal Energy Conference, Nantes, France, 6–11 September 2015. [Google Scholar]
  63. De Andres, A.; MacGillivray, A.; Guanche, R.; Jeffrey, H. Factors affecting LCOE of Ocean energy technologies: A study of technology and deployment attractiveness. In Proceedings of the International Conference on Ocean Energy, Halifax, NS, Canada, 4–6 November 2014; pp. 4–6. [Google Scholar]
  64. Lam, P.; Yang, W. Factors influencing the consideration of Public-Private Partnerships (PPP) for smart city projects: Evidence from Hong Kong. Cities 2020, 99, 102606. [Google Scholar] [CrossRef]
  65. Guo, C.; Sheng, W.; De Silva, D.G.; Aggidis, G. A Review of the Levelized Cost of Wave Energy Based on a Techno-Economic Model. Energies 2023, 16, 2144. [Google Scholar] [CrossRef]
  66. Pisacane, G.; Sannino, G. Ocean Energy Exploitation in Italy: Ongoing R&D Activities; Position Paper/September 2017; ENEA National Agency for New Technologies, Energy and Sustainable Economic Development: Rome, Italy, 2017. [Google Scholar]
  67. Cavaleri, L.; Barbariol, F.; Bertotti, L.; Besio, G.; Ferrari, F. The 29 October 2018 storm in Northern Italy: Its multiple actions in the Ligurian Sea. Prog. Oceanogr. 2022, 201, 102715. [Google Scholar] [CrossRef]
  68. MacGillivray, A.; Jeffrey, H.; Winskel, M.; Bryden, I. Innovation and cost reduction for marine renewable energy: A learning investment sensitivity analysis. Technol. Forecast. Soc. Chang. 2014, 87, 108–124. [Google Scholar] [CrossRef]
  69. Wang, L.; Zhao, T.; Lin, M.; Li, H. Towards realistic power performance and techno-economic performance of wave power farms: The impact of control strategies and wave climates. Ocean. Eng. 2022, 248, 110754. [Google Scholar] [CrossRef]
  70. Zanuttigh, B.; Angelelli, E.; Kortenhaus, A.; Koca, K.; Krontira, Y.; Koundouri, P. A methodology for multi-criteria design of multi-use offshore platforms for marine renewable energy harvesting. Renew. Energy 2016, 85, 1271–1289. [Google Scholar] [CrossRef]
  71. Maienza, C.; Avossa, A.M.; Picozzi, V.; Ricciardelli, F. Feasibility analysis for floating offshore wind energy. Int. J. Life Cycle Assess. 2022, 27, 796–812. [Google Scholar] [CrossRef]
  72. Klaus, S. Financial and economic assessment of tidal stream energy—a case study. Int. J. Financ. Stud. 2020, 8, 48. [Google Scholar] [CrossRef]
  73. Langer, J.; Cahyaningwidi, A.A.; Chalkiadakis, C.; Quist, J.; Hoes, O.; Blok, K. Plant siting and economic potential of ocean thermal energy conversion in Indonesia a novel GIS-based methodology. Energy 2021, 224, 120121. [Google Scholar] [CrossRef]
  74. Piscopo, V.; Benassai, G.; Della Morte, R.; Scamardella, A. Cost-based design and selection of point absorber devices for the mediterranean sea. Energies 2018, 11, 946. [Google Scholar] [CrossRef] [Green Version]
  75. Giassi, M.; Castellucci, V.; Göteman, M. Economical layout optimization of wave energy parks clustered in electrical subsystems. Appl. Ocean. Res. 2020, 101, 102274. [Google Scholar] [CrossRef]
  76. Aderinto, T.; Li, H. Review on power performance and efficiency of wave energy converters. Energies 2019, 12, 4329. [Google Scholar] [CrossRef] [Green Version]
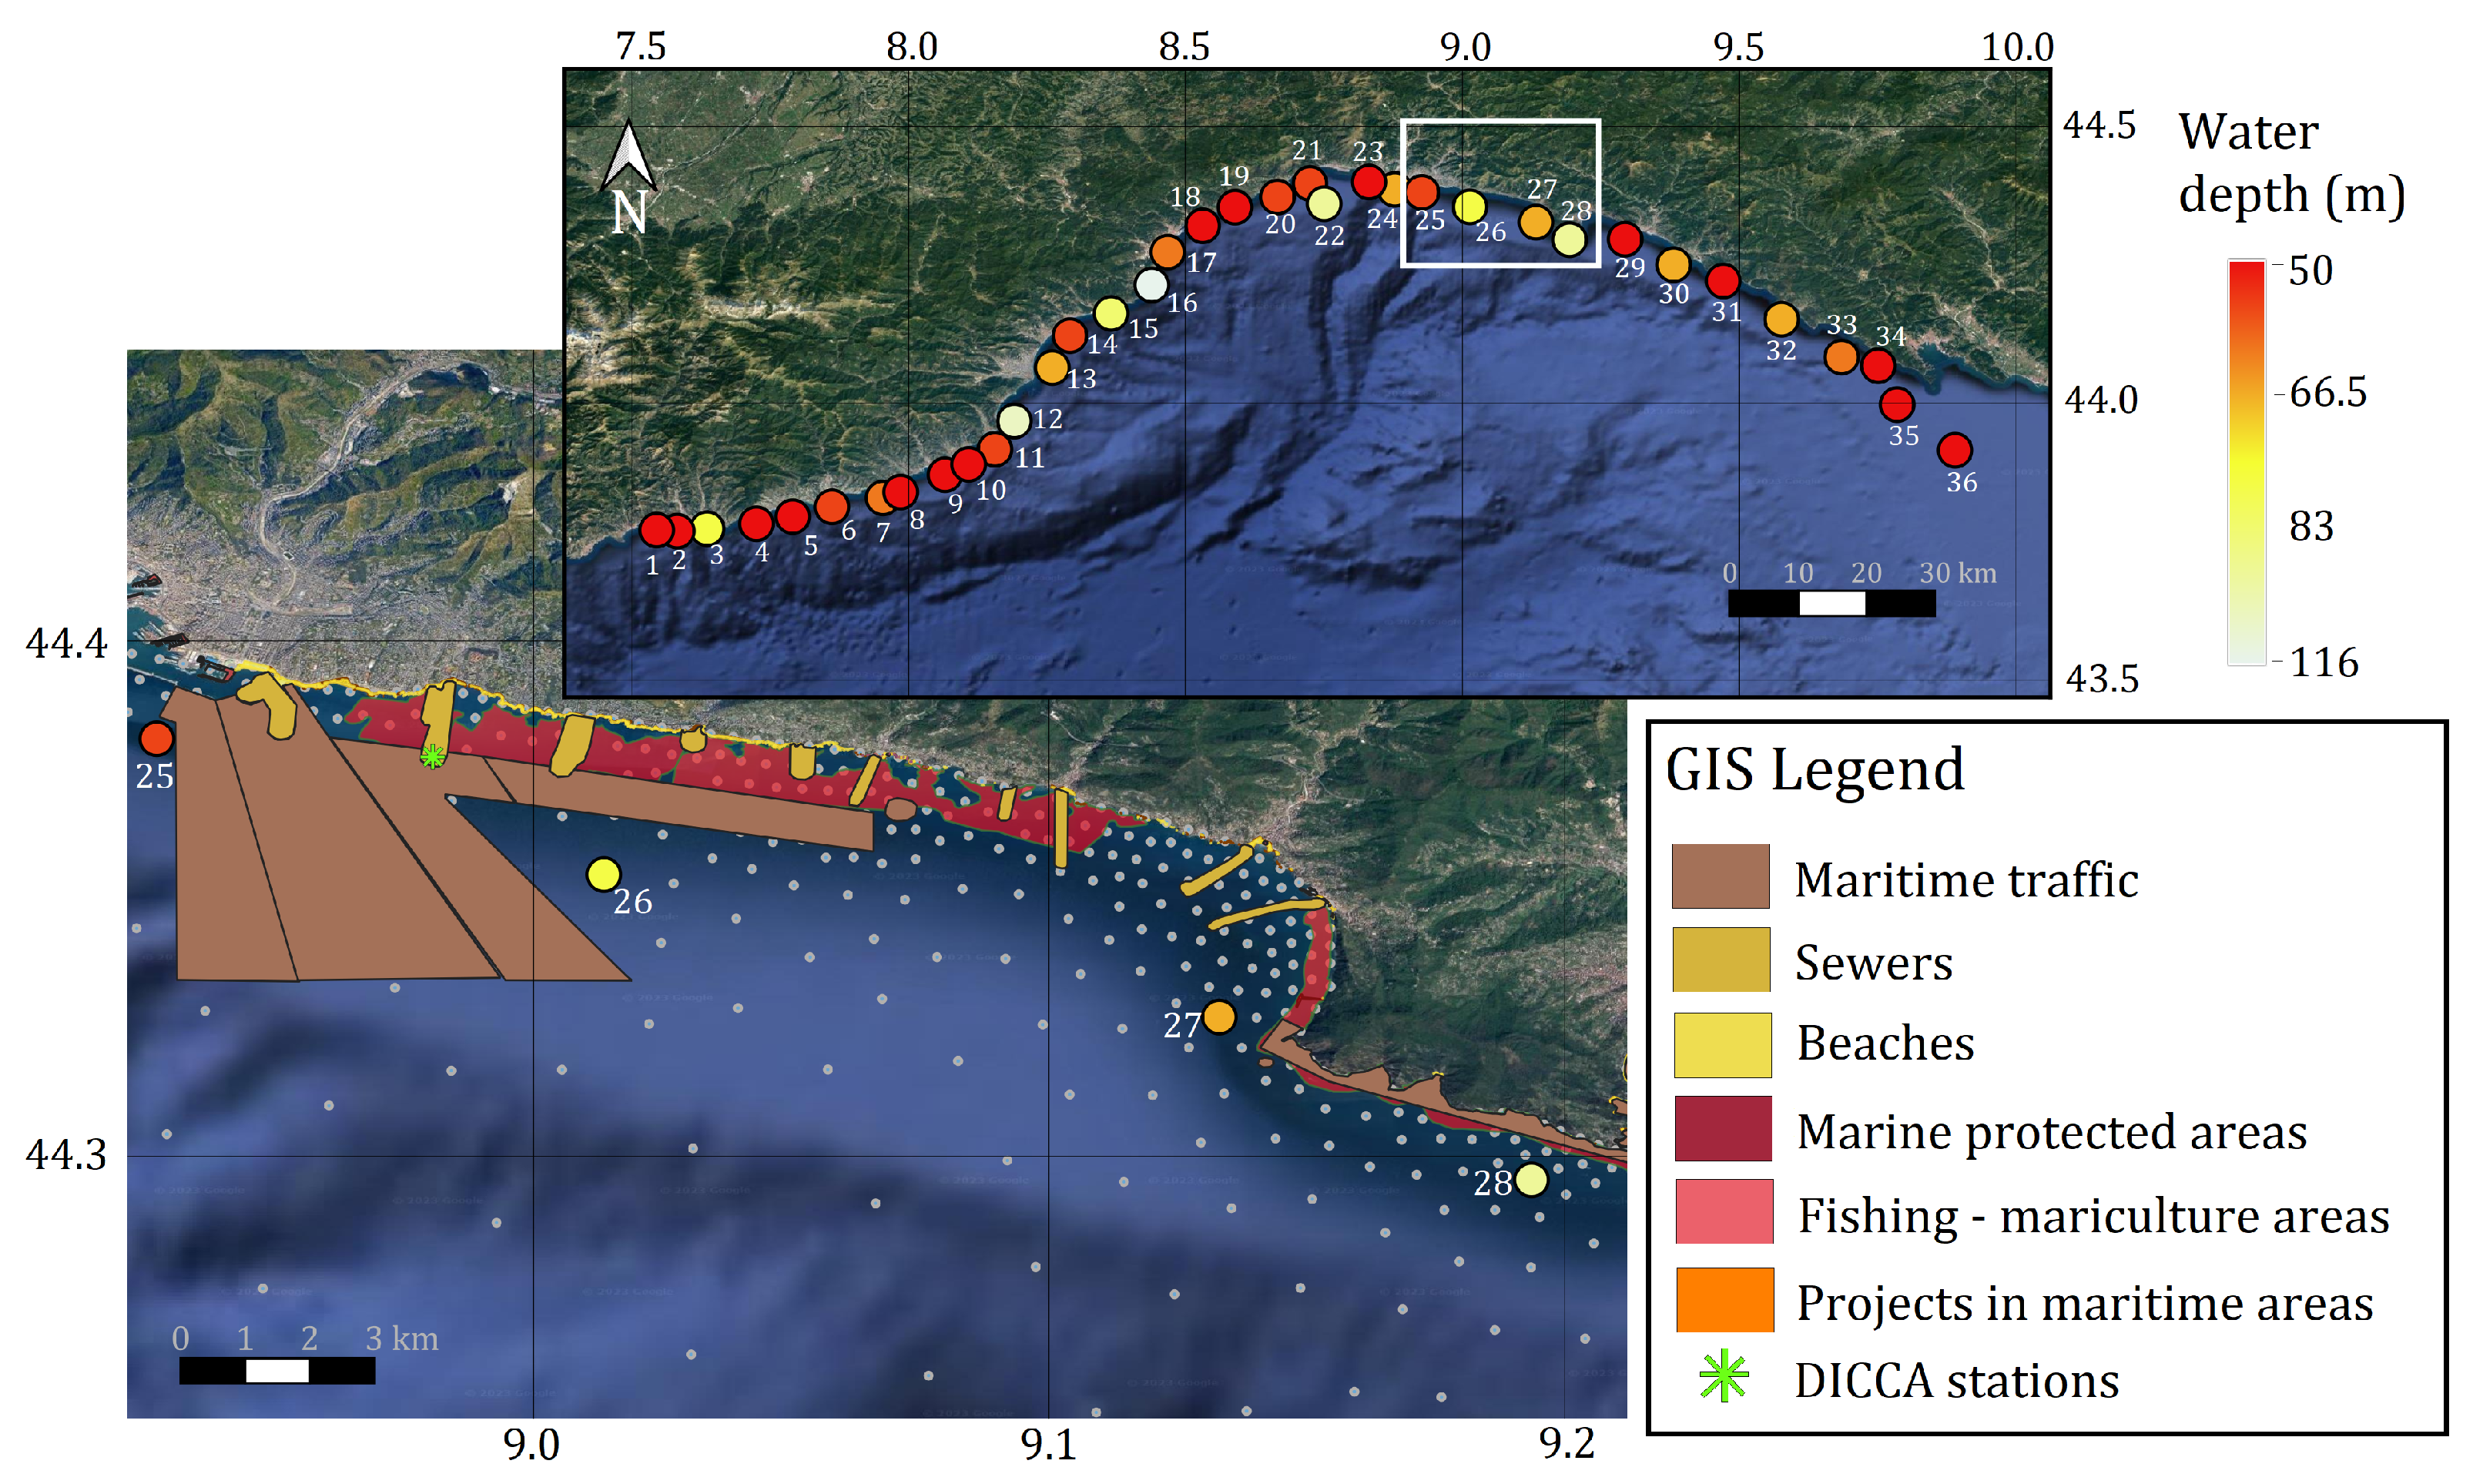
Figure 2. Map of the studied locations: upper panel presents the study locations, while the zoomed-in map at the bottom presents the GIS in a sector of the study region. The units of the shown coordinate system are degrees.
Sustainability 15 09113 g002
Figure 3. Monthly mean wave power along the Ligurian Sea, expressed in kW/m.
Sustainability 15 09113 g003
Figure 4. Total energy produced ( E 0 ) and capacity factors (CF) of all WECs at each location.
Sustainability 15 09113 g004
Figure 5. Mean yearly energy in kWh/m in locations 2, 11, 17, and 19. The dotted lines represent the wave power potential curves in kW/m.
Sustainability 15 09113 g005
Figure 6. SIWED and WEDI metrics at the studied locations.
Sustainability 15 09113 g006
Figure 7. CF scaled device over the CF of prototype device. The maximum values of the vertical axis of each chart are varied for better visualization.
Sustainability 15 09113 g007
Figure 8. Scale λ values with higher CF at the studied locations.
Sustainability 15 09113 g008
Figure 9. S I W E D 30 , s c a l e d for all locations.
Sustainability 15 09113 g009
Figure 10. Levelized cost of energy (indicated at the left-hand side vertical axis) and capital expenditure (indicated at the right-hand side vertical axis) for each converter, among all locations.
Sustainability 15 09113 g010
Figure 11. Cost of energy, levelized cost of energy, and payback period for the studied locations. The black dashed line in the bottom panel indicates the viable PBP of 20 years.
Sustainability 15 09113 g011
Figure 12. S I W E D 30 , s c a l e d versus levelized cost of energy for all locations (the horizontal axis is logarithmic). Left panel presents the values for all locations for each device, whereas right panel shows the trends of each WEC.
Sustainability 15 09113 g012
Figure 13. S I W E D 30 , s c a l e d over the LCOE cost ratio. The highest value of this ratio indicates which WEC is most suitable at each location.
Sustainability 15 09113 g013
Table 1. Wave energy converters’ features.
Wave ConverterSizeInstallation DepthPower Take OffRated Power
F-2HB [33]Characteristic
area 2120 m2
40–150 mHydraulic PTO system
driven by 2 bodies
1000 kW
Pelamis [41]150 m long,
3.5 m diameter
>50 mHigh-pressure hydraulic motors
and electrical generators
750 kW
SeaPower [42,43]Characteristic
length 40 feet
>50 mHydraulic motor/pump3587 kW
Pontoon [33,44]Characteristic
area 4800 m2
>50 mHigh-head water turbine3619 kW
AWS [45]7 m height,
4 m diameter
>25 mLinear generator2470 kW
OEbuoy [33]Characteristic
area 6500 m2
Deep watersBidirectional air turbine2880 kW
AquaBUOY [46,47]Float diameter 6 m150–250 feetHigh-head water turbine250 kW
Langlee [33]Characteristic
area 2160 m2
40–150 mRelative motion between
four hinged flaps
1500 kW
Table 2. Scaled energy-related costs. Information taken from [32].
ParameterScale Relationship
Development λ
Main frame and second frameIt is calculated based on on the weight of materials selected
Access system and platform λ 3
Machine housing λ 3
Total load carrying structure λ 3
PTO λ 3.5
Generator λ 3.5
Power electronics λ 3.5
Control and safety system λ 3.5
Total power take-off system λ 3.5
Mooring system λ 3
Pre-assembly and transport λ 3
Installation on site λ 3
Electrical connection λ 3.5
ContingenciesSame values as reference machine
Operation and maintenance per yearScaled by:
Total el. production scaled machine/Total el. production reference machine
Others
Table 3. Conversion of costs associated with WEC implementation, converted into EUR and projected to the present values in 2023.
Item Cost ref UnitYear Cost ref ReferencePresent CostUnit
PTO800€/kW2000 [51]1052.55€/kW
Mooring system250£/m2000 [52]371.68€/m
Pre-assembly and transportation10,000£2017 [51]12,138.40
Installation33% of WEC cost2015 [53]33% of WEC cost
Cables100£/m2000 [54]148.67€/m
Cost of steel1.6£/kg2014 [55]2.01€/kg
Electrical connection5% of WEC cost2015 [53]5.00% of WEC cost
Development3% of CapEx2014 [32]2.1% of CapEx
Construction phase insurance17,500,000€/MW2013 [56]19,717,106.11€/MW
Operations and maintenance costs (OM)10–30%% of CapEx2014 [40,57,58,59,60,61,62]8% of CapEx
F-2HB 830.37US $/MW2015 [63]855.14€/MW
Pelamis4666.67US $/MW2015 [53]4748.90€/MW
SeaPower 542.08US $/MW2014 [63]558.25€/MW
Pontoon 107.46US $/MW2014 [63]110.66€/MW
AWS 209.93US $/MW2014 [63]216.19€/MW
OEBuoy 180.04US $/MW2014 [63]185.41€/MW
AquaBUOY 13,827.16US $/MW2014 [63]14,239.65€/MW
Langlee 3989.75US $/MW2014 [63]4108.78€/MW
Extrapolated by WEC weight.
Table 4. Scale values λ for the most efficient WECs. Cells with scaled down devices are colored in green, whereas non-scaled and scaled up devices are colored in yellow and blue, respectively.
LocationF-2HBPelamisSeaPowerPontoonAWSOEBuoyAquaBUOYLanglee
10.70.70.70.70.70.70.70.7
21.00.80.81.10.70.81.01.5
30.90.80.80.90.70.80.90.9
40.90.80.70.90.70.90.90.9
50.70.60.60.70.50.70.70.7
60.70.70.70.80.70.70.80.9
70.70.70.60.70.60.70.70.8
81.30.91.01.40.90.91.31.6
90.70.60.60.70.50.70.70.7
100.90.90.70.90.70.90.90.9
110.90.80.80.90.80.90.90.9
120.90.80.70.80.70.80.80.9
130.90.80.70.90.70.90.90.9
140.70.70.60.70.60.70.70.7
150.90.80.70.80.70.80.80.9
160.90.70.70.80.70.80.80.9
170.70.60.60.70.60.70.70.7
180.70.70.60.70.60.70.70.7
191.30.91.01.40.90.91.31.6
200.90.90.70.90.60.90.91.0
210.90.70.70.80.70.70.80.9
221.41.01.11.51.01.01.41.4
231.30.91.01.40.90.91.31.6
240.70.60.50.70.50.70.70.7
250.60.50.50.60.50.60.60.6
260.70.70.70.70.70.70.70.8
270.60.50.50.50.40.50.50.6
280.90.90.70.90.70.90.90.9
290.90.90.70.90.70.90.90.9
300.70.60.60.70.60.70.70.7
310.90.70.70.90.70.80.91.0
320.70.60.60.70.60.70.70.7
331.21.01.11.01.01.01.21.2
341.21.01.21.01.01.01.21.2
350.90.90.70.90.70.90.90.9
360.90.90.81.00.70.90.91.1
Table 5. Selected optimal WECs by location. Numbers within parentheses indicate the λ for the optimal scaled WECs.
LocationOptimal WECLocationOptimal WECLocationOptimal WECLocationOptimal WEC
1Pontoon (0.7)10Pontoon (0.9)19AWS (0.9)28Pontoon (0.9)
2AWS (0.7)11Pontoon (0.9)20Pontoon (0.9)29Pontoon (0.9)
3Pontoon (0.9)12Pontoon (0.8)21Pontoon (0.8)30Pontoon (0.7)
4Pontoon (0.9)13Pontoon (0.9)22AWS (1)31Pontoon (0.9)
5Pontoon (0.7)14Pontoon (0.7)23AWS (0.9)32Pontoon (0.7)
6Pontoon (0.8)15Pontoon (0.8)24Pontoon (0.7)33AWS (1)
7Pontoon (0.7)16Pontoon (0.8)25Pontoon (0.6)34AWS (1)
8AWS (0.9)17Pontoon (0.7)26Pontoon (0.7)35Pontoon (0.9)
9F-2HB (0.7)18Pontoon (0.7)27AquaBUOY (0.5)36OEBuoy (0.9)
Disclaimer/Publisher’s Note: The statements, opinions and data contained in all publications are solely those of the individual author(s) and contributor(s) and not of MDPI and/or the editor(s). MDPI and/or the editor(s) disclaim responsibility for any injury to people or property resulting from any ideas, methods, instructions or products referred to in the content.