

The Impact of Housing Support Expenditure on Urban Residents’ Consumption—Evidence from China


Abstract
:1. Introduction
2. Literature Review
3. Theoretical Analysis and Hypothesis Formulation
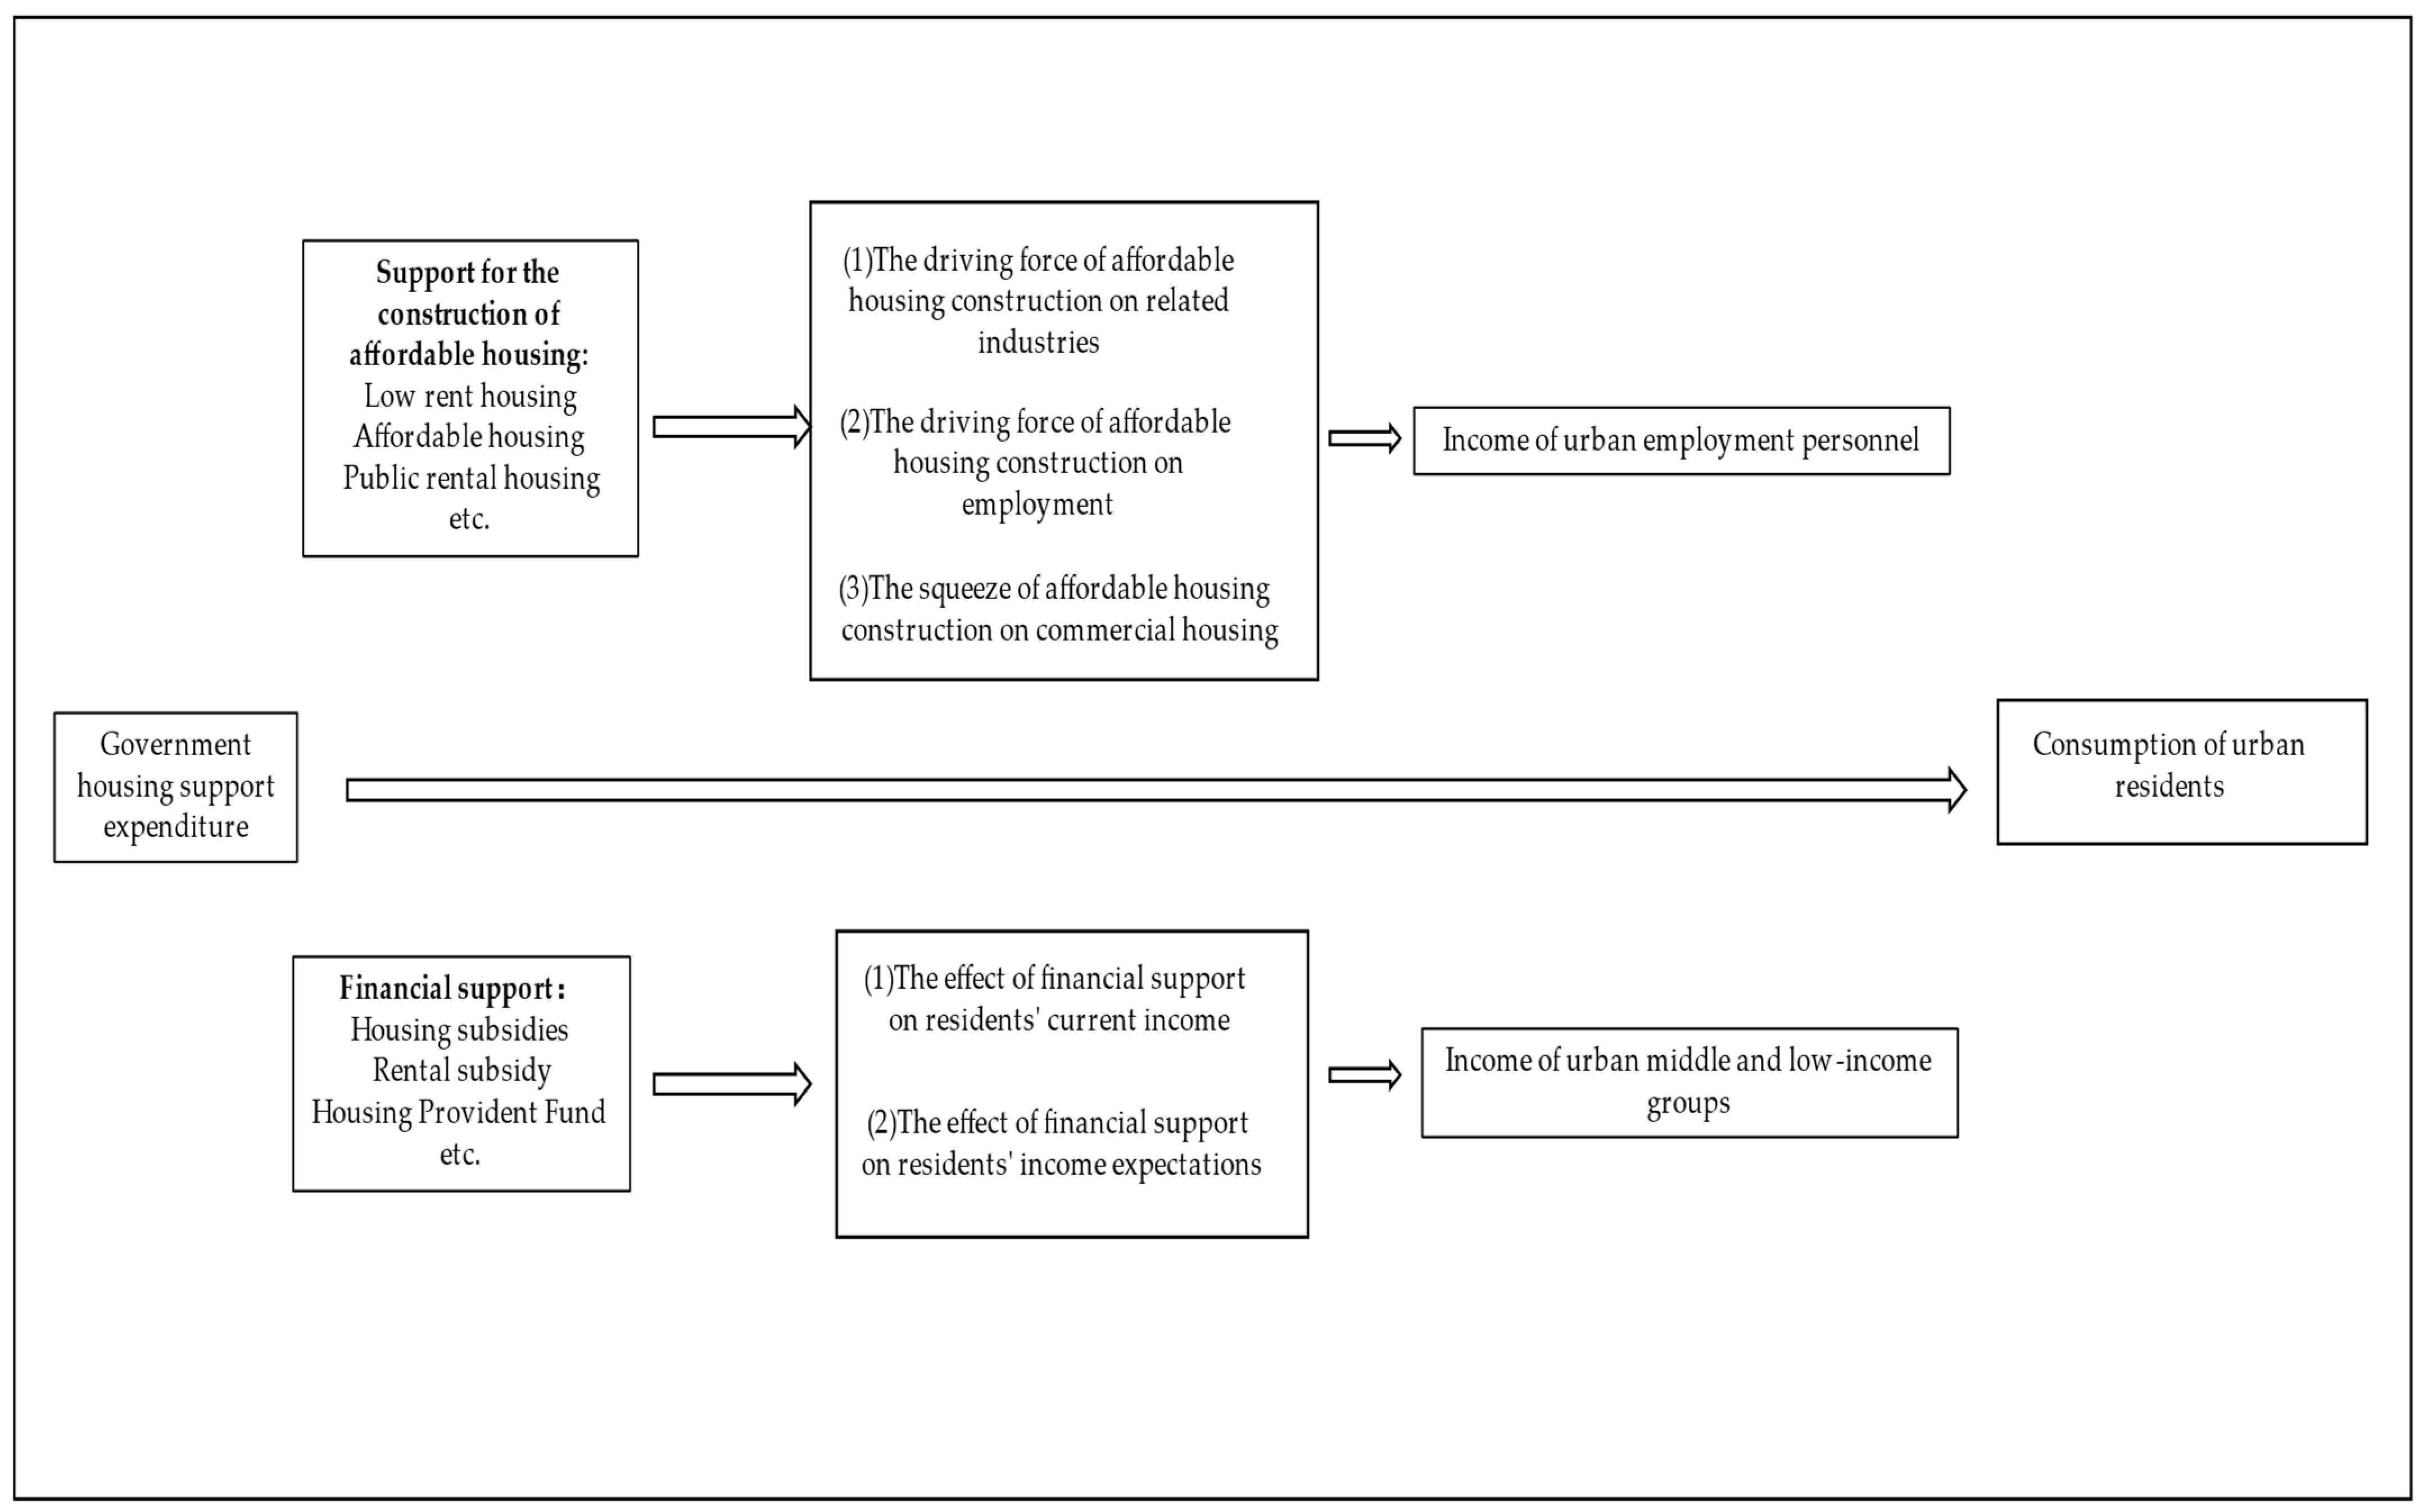
3.1. Analysis from the Perspective of Guaranteed Housing Supply
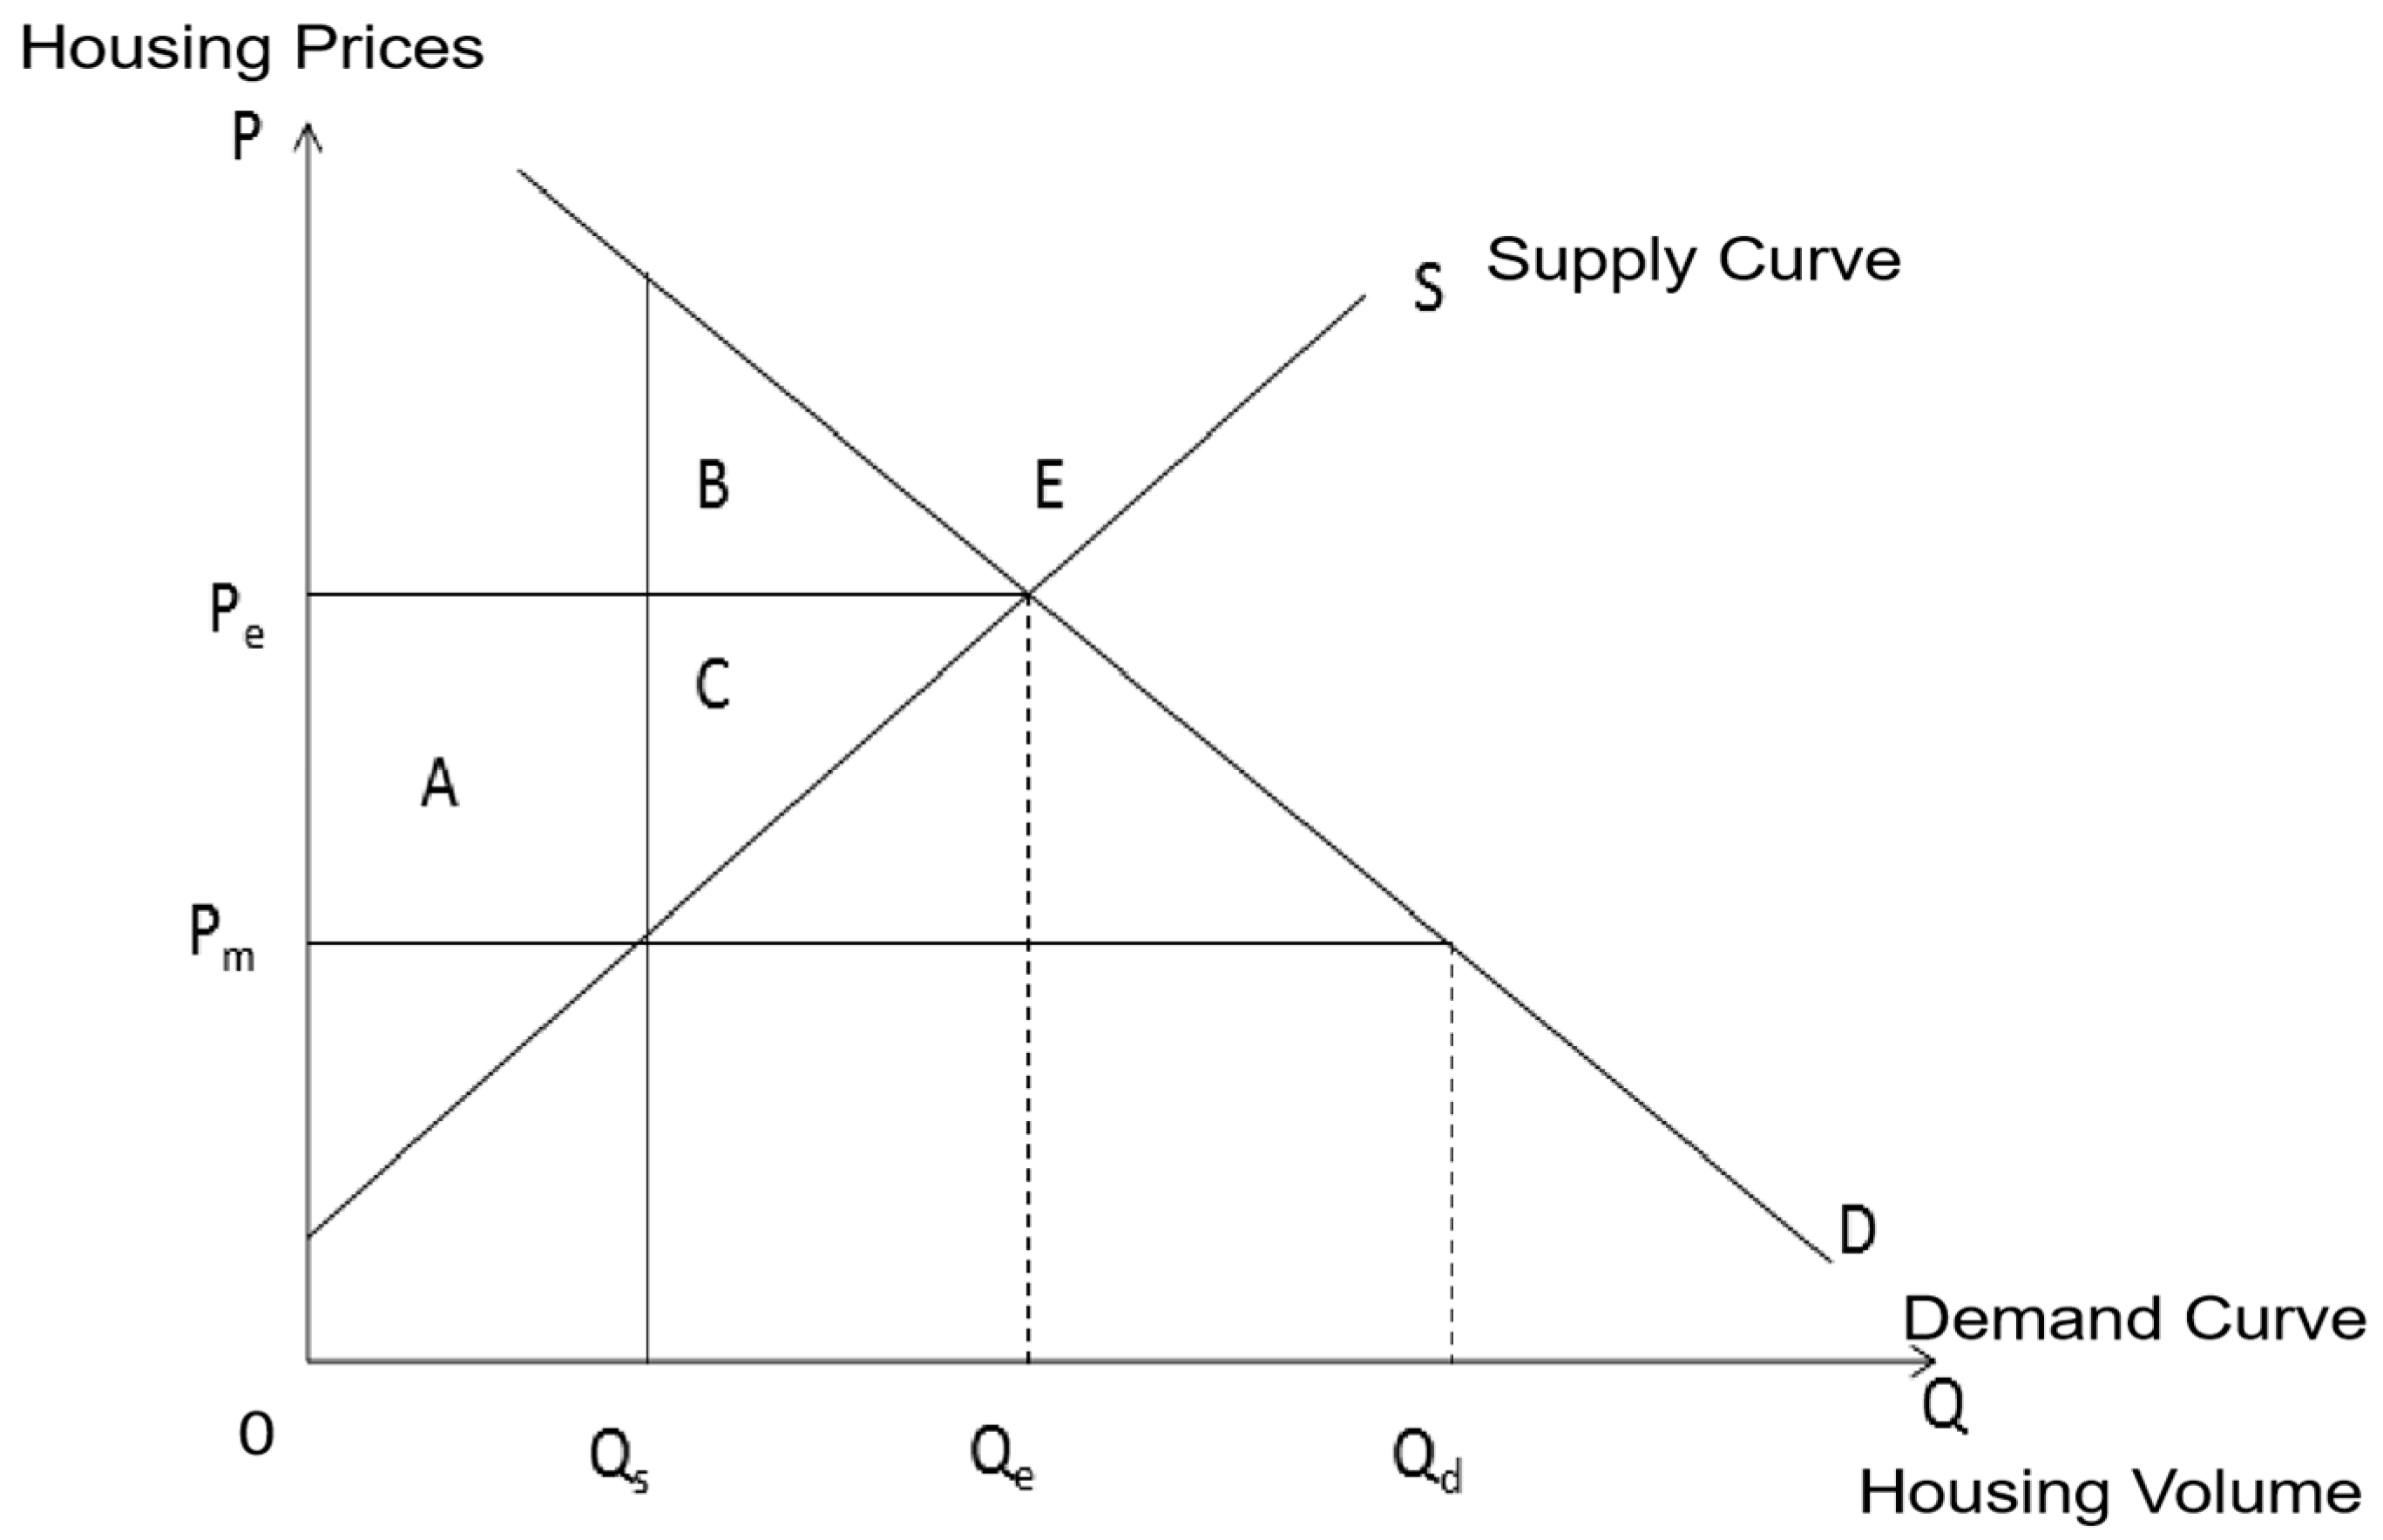
3.1.1. Analysis of the Impact of Affordable Housing on the Total Consumption of Urban Residents
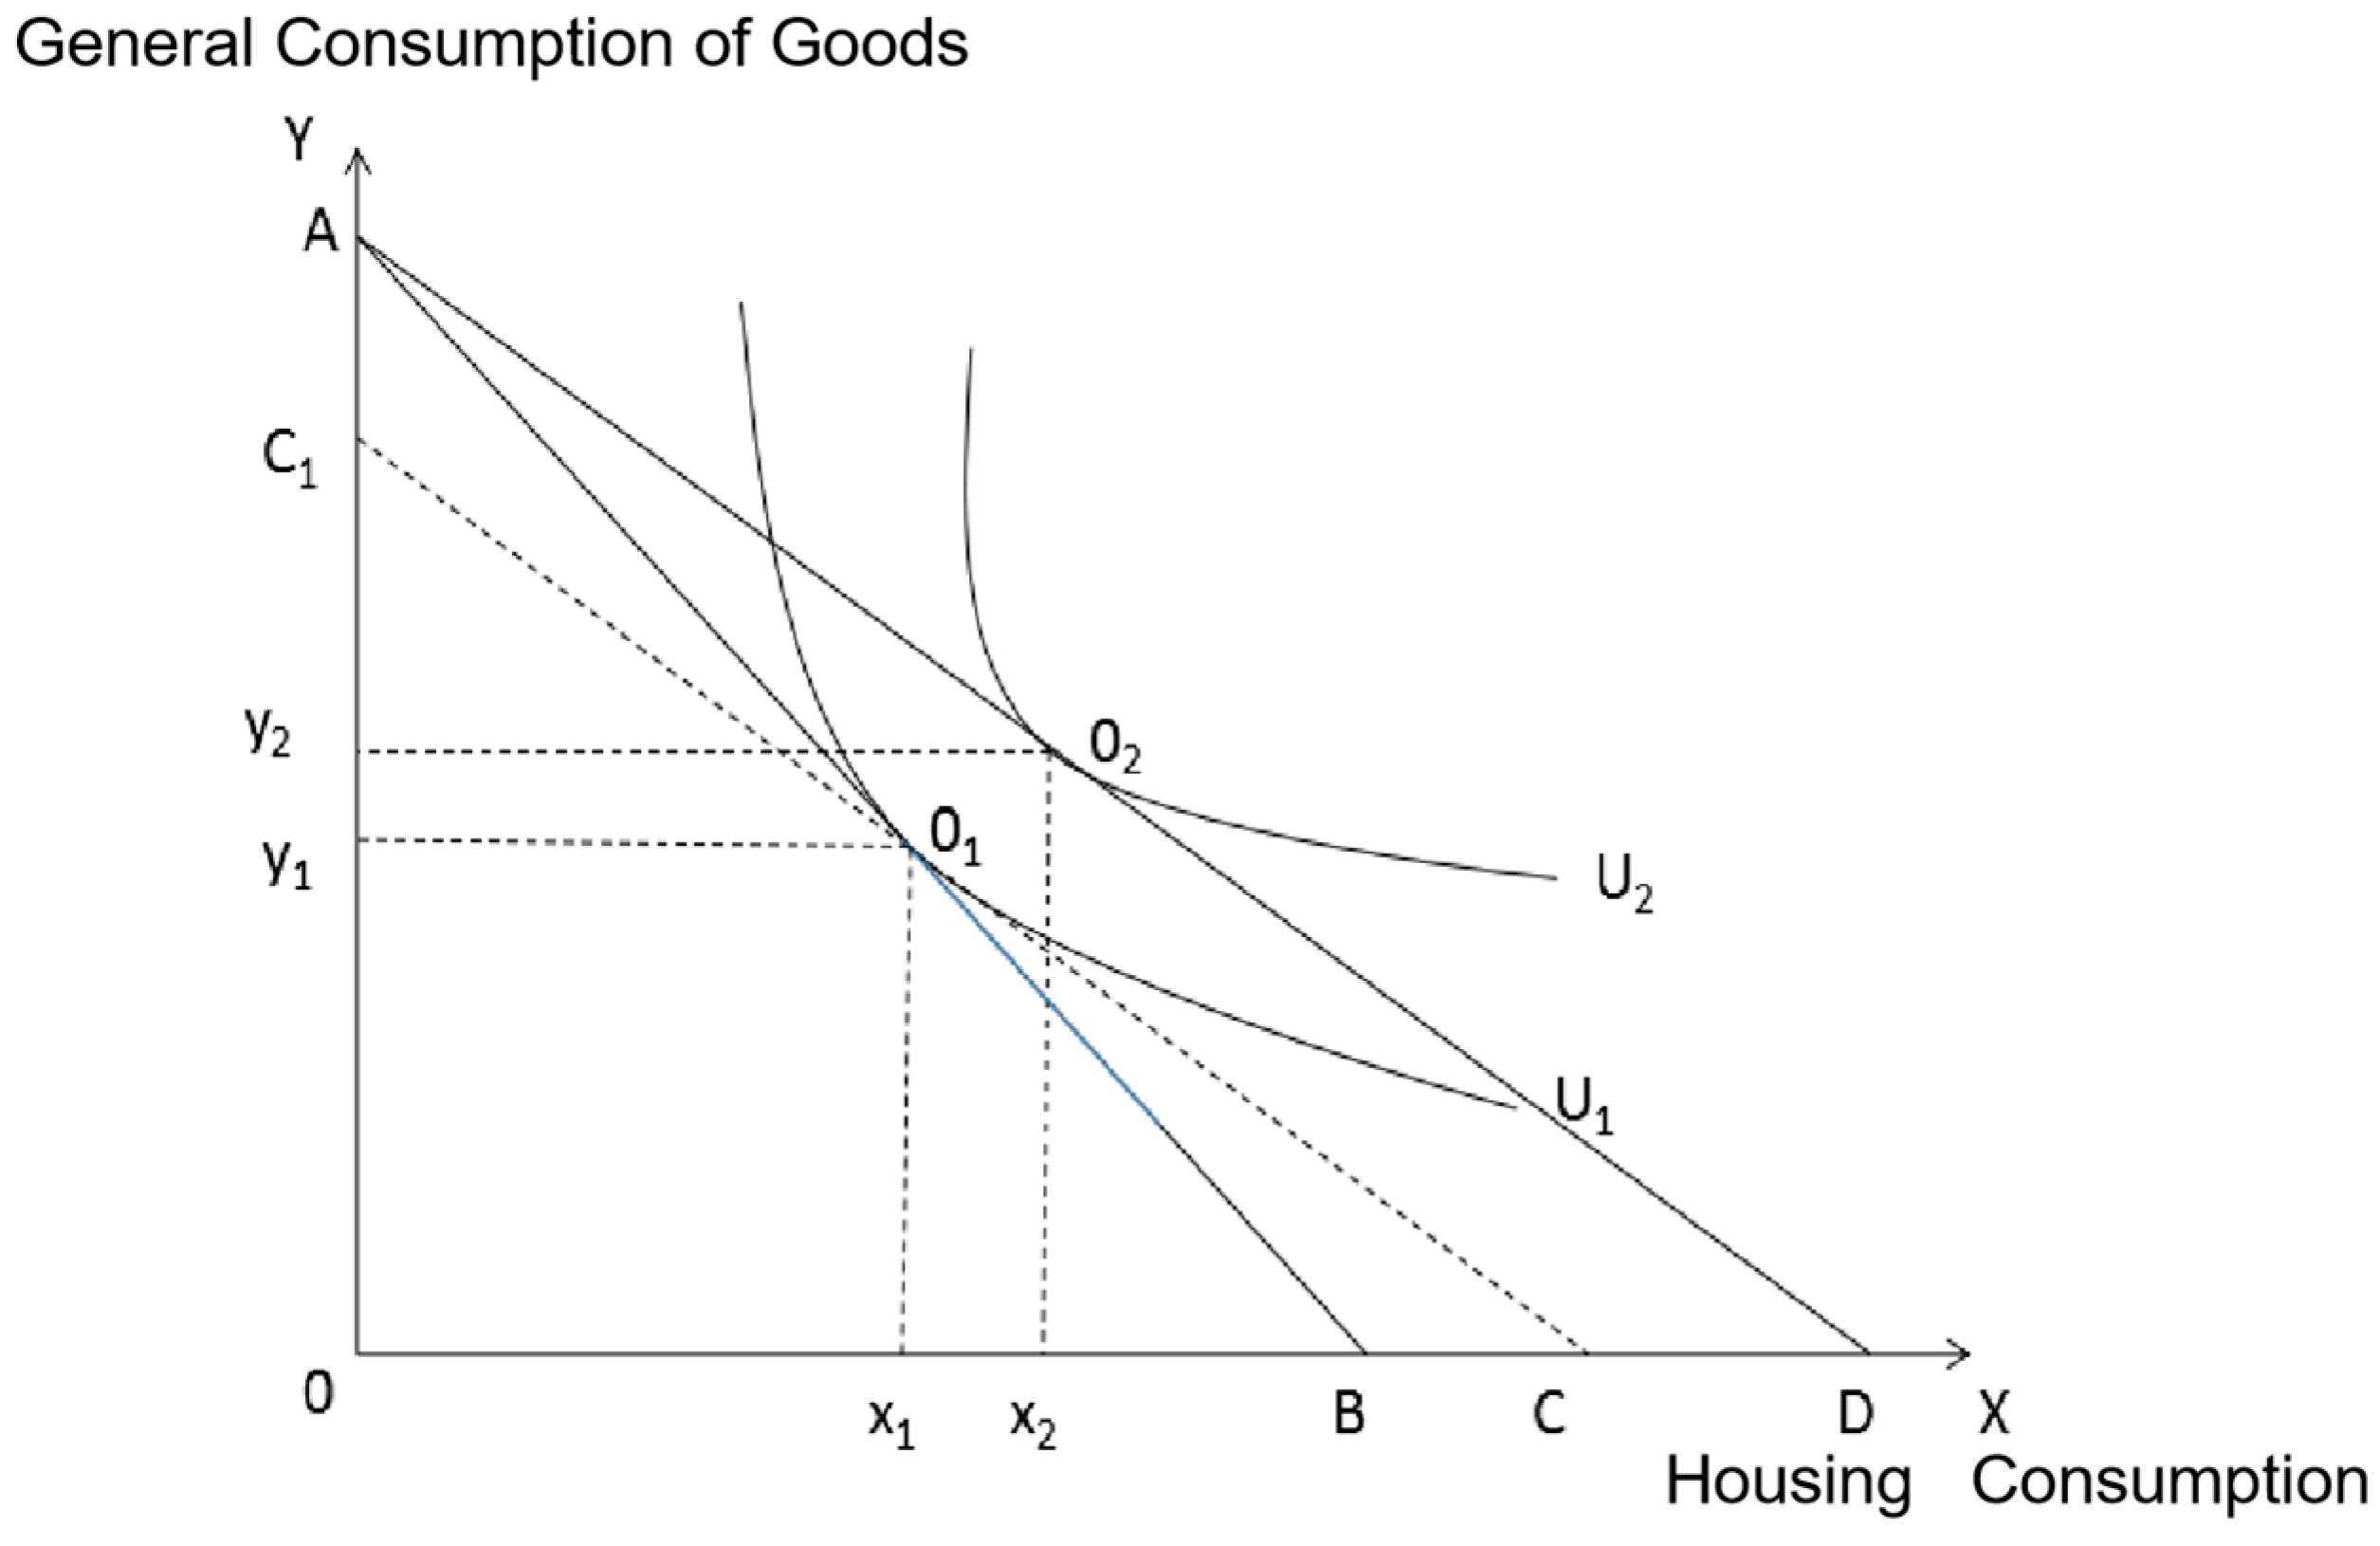
3.1.2. Analysis of the Impact of Low-Rent Housing on the Total Consumption of Urban Residents
3.2. Analysis from a Public Expenditure Perspective
4. Empirical Analysis
4.1. Data Sources and Variable Descriptions
4.1.1. Data Sources
4.1.2. Variable Description
- (1)
- Dependent variable: In this section, the main investigation is the impact of government housing support expenditure on the overall consumption level of urban residents. Therefore, the overall consumption level of urban residents must be the main dependent variable. It is also necessary to choose the variables that are more representative of the overall consumption level of urban residents as its proxy variables. In previous studies, the variables that measure the overall consumption level of residents are mainly total per capita household consumption expenditure, resident consumption rate, resident consumption-to-GDP ratio, the average propensity to consume, and marginal propensity to consume. In the analysis of this paper, consumption per capita household expenditure (consumption) is used as the explanatory variable to visualize the interaction between the variables.
- (2)
- Investigation variables: The main investigation variable of this paper is government housing support expenditure, which is divided into two time periods; including the housing support expenditure data from 1999 to 2009 and the data related to affordable housing, as well as the data related to government housing support financial expenditure in each region from 2010 to 2020. As can be seen, this paper applies the meaning of government housing expenditure in a broad sense, i.e., unless otherwise specified in the following, the amount of affordable housing investment, as the dependent variable, and government housing expenditure, as the dependent variable, are collectively referred to as housing expenditure in this paper. The use of these two kinds of data for examination helps this paper to analyze the problem more carefully. The corresponding indicator is housing support expenditure per urban resident (hse—housing support expenditure), which is obtained by dividing the total housing support expenditure of each province and city by the number of the urban population in that province and city.
- (3)
- Control variables: The control variables in this paper are residents’ income, urban household dependency ratio, the proportion of the secondary industry, the proportion of the tertiary industry, and the housing price. According to the consumption theory, income is the main factor which affects residents’ consumption; therefore, urban per capita disposable income (income) is selected as the indicator of residents’ income; the ratio of the minor population (up to 14 years old) and the old population (65 years old and above) to the working age population (15–64 years old) in urban households is selected as the indicator of urban household dependency ratio (bring); the ratio of the secondary industry (industry) is the ratio of secondary industry GDP to regional GDP; the ratio of the tertiary industry (service) is the ratio of tertiary industry GDP to regional GDP. With the fluctuation in housing prices in recent years, the price of commercial housing has also become an important variable which affects urban residents’ consumption; therefore, the average prices of commercial housing (chp—commercial housing prices) in each province and city are selected as an indicator of housing price in this paper. The results of specific statistical tests for each variable are shown in the following tables (Table 1 and Table 2).
4.2. Sample Data Stationarity Test
4.3. Model Construction and Analysis of Empirical Results
4.3.1. Model Construction
4.3.2. Analysis of Empirical Results
4.4. Model Robustness Tests
5. Discussion
6. Conclusions and Policy Recommendation
6.1. Conclusions
6.2. Policy Recommendation
Author Contributions
Funding
Institutional Review Board Statement
Informed Consent Statement
Data Availability Statement
Acknowledgments
Conflicts of Interest
References
- Hu, F.Z.Y.; Qian, J. The impact of housing price on entrepreneurship in Chinese cities: Does the start-up motivation matter? Cities 2022, 131, 104045. [Google Scholar] [CrossRef]
- Huang, X.; Chen, M. Understanding the role of housing in rural migrants’ intention to settle in cities: Evidence from China. Habitat. Int. 2022, 128, 102650. [Google Scholar] [CrossRef]
- Zou, J.; Deng, X. Housing tenure choice and socio-economic integration of migrants in rising cities of China. China Econ. Rev. 2022, 74, 101830. [Google Scholar] [CrossRef]
- Wu, Y.; Chen, J.; Bian, Z.; Wang, H.; Wang, Z. Housing, Housing Stratification, and Chinese Urban Residents’ Social Satisfaction: Evidence from a National Household Survey. Soc. Indic. Res. 2020, 152, 653–671. [Google Scholar] [CrossRef]
- China Statistical Yearbook. Statistics of Various Years. 2022. Available online: http://www.stats.gov.cn/sj/ndsj/2022/indexeh.htm (accessed on 15 February 2023).
- Keynes, J.M. The General Theory of Employment, Interest and Money; Harcout, Brace and Company: New York, NY, USA, 1936; pp. 245–289. [Google Scholar]
- Duesenberry, J.S. Income, Saving and the Theory of Consumer Behavior; Harvard University Press: Cambridge, MA, USA, 1949; p. 128. [Google Scholar]
- Friedman, M. A Theory of the Consumption Function; Princeton University Press: Princeton, NJ, USA, 1957. [Google Scholar] [CrossRef]
- Modigliani, F.; Brumberg, R. Utlity Analysis and the Consumption Function: An Interpretation of Cross-section Data. In Post-Keynesian Economics; Kurihara, K.K., Ed.; Rutgers University Press: New Brunswick, NJ, USA, 1954; pp. 15–35. [Google Scholar]
- Leland, H.E. Saving and Uncertainty: The Precautionary Demand for Saving. Q. J. Econ. 1968, 82, 465. [Google Scholar] [CrossRef]
- Horioka, C.Y. The causes of Japan’s “lost decade”: The role of household consumption. JPN World Econ. 2006, 18, 378–400. [Google Scholar] [CrossRef] [Green Version]
- Ogawa, K.; Wan, J. Household debt and consumption: A quantitative analysis based on household micro data for Japan. J. Hous. Econ. 2007, 16, 127–142. [Google Scholar] [CrossRef]
- Jensen, J.O. Measuring consumption in households: Interpretations and strategies. Ecol. Econ. 2008, 68, 353–361. [Google Scholar] [CrossRef]
- Kerkhof, A.C.; Nonhebel, S.; Moll, H.C. Relating the Environmental Impact of Consumption to Household Expenditures: An Input-Output Analysis. Ecol. Econ. 2009, 68, 1160–1170. [Google Scholar] [CrossRef]
- Easaw, J.Z.; Heravi, S.M. Evaluating Consumer Sentiments as Predictors of UK Household Consumption Behavior. Int. J. Forecast. 2004, 20, 671–681. [Google Scholar] [CrossRef]
- Cherchye, L.; De Rock, B.; Vermeulen, F. An Afriat Theorem for the collective model of household consumption. J. Econ. Theory 2010, 145, 1142–1163. [Google Scholar] [CrossRef] [Green Version]
- Skinner, J. Risky income, life cycle consumption, and precautionary savings. J. Monet. Econ. 1988, 22, 237–255. [Google Scholar] [CrossRef] [Green Version]
- Case, K.E.; Quigley, J.M.; Shiller, R.J. Comparing Wealth Effects:The Stock Market versus the Housing Market. Adv. Macroecon. 2005, 5, 20121001. [Google Scholar] [CrossRef] [Green Version]
- Zeldes, S.P. Consumption and Liquidity Constraints: An Empirical Investigation. J. Political Econ. 1989, 97, 305–346. [Google Scholar] [CrossRef]
- Galster, G.; Lee, K.O. Housing affordability: A framing, synthesis of research and policy, and future directions. Int. J. Urban Sci. 2021, 25, 7–58. [Google Scholar] [CrossRef]
- Thorns, D. Housing booms and changes to New Zealand housing affordability: The policy challenge. J. Asian Public Policy 2009, 2, 171–189. [Google Scholar] [CrossRef]
- Seitz, W. Urbanization in Kazakhstan: Desirable cities, unaffordable housing, and the missing rental market. J. Int. J. Urban Sci. 2021, 25, 135–166. [Google Scholar] [CrossRef]
- Jiburum, U.; Nwachukwu, M.U.; Mba, H.C.; Okonkwo, C.N.; Okeke, D.C. Determinants of Public Housing Affordability for Large Income Diversity Groups in a New-Town Capital City: A Case Study of Abuja, Nigeria; SAGE Open: Thousand Oaks, CA, USA, 2021; Volume 11. [Google Scholar] [CrossRef]
- Olsen, E.O.; Barton, D.M. The benefits and costs of public housing in New York City. J. Public Econ. 1983, 20, 299–332. [Google Scholar] [CrossRef]
- Auyezkhanuly, A.; Almagul, M.; Akpanov, A.; Karshalova, A. The Study of the Residential Real Estate Market in the Republic of Kazakhstan. J. Real. Estate Lit. 2019, 27, 117–133. [Google Scholar] [CrossRef]
- Sharafeddin, A.; Arocho, I. Toward sustainable public housing: A comparison of social aspects in public housing in the United State and Libya. Habitat. Int. 2022, 122, 102513. [Google Scholar] [CrossRef]
- Hananel, R.; Krefetz, S.P.; Vatury, A. Public Housing Matters: Public Housing Policy in Sweden, the United States, and Israel. J. Plan. Educ. Res. 2021, 41, 461–476. [Google Scholar] [CrossRef]
- Sinai, T.; Waldfogel, J. Do Low-Income Housing Subsidies Increase the Occupied Housing Stock? J. Public. Econ. 2005, 89, 2137–2164. [Google Scholar] [CrossRef] [Green Version]
- Kushendar, D.H.; Rusli, B.; Muhtar, E.A.; Candradewini. Public Housing Management: Review of Rusunawa Policy in Cimahi City, Indonesia. Acad. Strateg. Manag. J. 2021, 20, 1–11. Available online: https://www.proquest.com/scholarly-journals/public-housing-management-review-rusunawapolicy/docview/2574463750/se-2 (accessed on 15 February 2023).
- Wang, W.; Wu, Y.; Choguill, C. Prosperity and inclusion: The impact of public housing supply on urban inclusive growth in China. Land Use Policy 2021, 105, 105399. [Google Scholar] [CrossRef]
- Das, A. Public Housing in the Global Cities: Hong Kong and Singapore at the Crossroads. Urban Reg. Plan. 2021, 6, 41–46. [Google Scholar] [CrossRef]
- Blanco, H. Pecuniary effects of public housing demolitions: Evidence from Chicago. Reg. Sci. Urban Econ. 2023, 98, 103847. [Google Scholar] [CrossRef]
- Kim, S.; Hwang, J.; Lee, M.-H. Effect of Housing Support Programs on Residential Satisfaction and the Housing Cost Burden: Analysis of the Effect of Housing Support Programs in Korea Based on Household Attributes. Land 2022, 11, 1392. [Google Scholar] [CrossRef]
- Liu, Z.; Ma, L. Residential experiences and satisfaction of public housing renters in Beijing, China: A before-after relocation assessment. Cities 2021, 113, 103148. [Google Scholar] [CrossRef]
- Franklin, S. Enabled to work: The impact of government housing on slum dwellers in South Africa. J. Urban Econ. 2020, 118, 103265. [Google Scholar] [CrossRef]
- Bourassa, S.C.; Yin, M. Housing Tenure Choice in Australia and the United States: Impacts of Alternative Subsidy Policies. Real. Estate Econ. 2006, 34, 303–328. [Google Scholar] [CrossRef]
- Kumar, T. The housing quality, income, and human capital effects of subsidized homes in urban India. J. Dev. Econ. 2021, 153, 102738. [Google Scholar] [CrossRef]
- Ellen, I.G. What do we know about housing choice vouchers? Reg. Sci. Urban Econ. 2020, 80, 103380. [Google Scholar] [CrossRef]
- Aubry, T.; Bloch, G.; Brcic, V.; Saad, A.; Magwood, O.; Abdalla, T.; Alkhateeb, Q.; Xie, E.; Mathew, C.; Hannigan, T.; et al. Effectiveness of Permanent Supportive Housing and Income Assistance Interventions for Homeless Individuals in High-Income Countries: A Systematic Review. Lancet Public Health 2020, 5, e342–e360. [Google Scholar] [CrossRef] [PubMed]
- Tiwari, P.; Hasegawa, H. Welfare effects of public housing in Tokyo. J. Policy Model. 2001, 23, 421–431. [Google Scholar] [CrossRef]
- Kattenberg MA, C.; Wolter, H.; Janneke, P. The Economics of Social Housing: Implications for Welfare, Consumption, and Labor Market Composition; Utrecht University: Utrecht, The Netherlands, 2014; pp. 127–132. [Google Scholar]
- Shi, X. The health-wealth nexus for the elderly: Evidence from the booming housing market in China. Labour Econ. 2022, 78, 102247. [Google Scholar] [CrossRef]
- Yuan, C.; He, X.; Kim, Y. Home ownership, housing price and social support expenditure. China Econ. Rev. 2017, 46, 290–305. [Google Scholar] [CrossRef]
- Zheng, S.Q.; Liu, H.Y.; Ren, R.R.; Yu, Q.M. Housing consumption characteristics of prefecture-level and above cities in China--an analysis based on the National Bureau of Statistics 2007 Urban Household Large Sample Survey. Urban Reg. Plan. Res. 2009, 2, 87–99. (In Chinese) [Google Scholar]
- Wan, J.; Qiu, Q. Industrial investments and housing prices in China. Int. Rev. Econ. Financ. 2023, 84, 832–852. [Google Scholar] [CrossRef]
- Maddala, G.S.; Shaowen, W. A Comparative Study of Unit Root Tests with Panel Data and a New Simple Test. Oxf. Bull. Econ. Stat. 1999, 61, 631–652. [Google Scholar] [CrossRef]
- Levin, A.; Lin, C.F.; James Chu, C.-S. Unit root tests in panel data: Asymptotic and finite-sample properties. J. Econometr. 2002, 108, 1–24. [Google Scholar] [CrossRef]
- Breitung, J. Some simple tests of the moving-average unit root hypothesis. J. Time Ser. Anal. 1994, 15, 351–370. [Google Scholar] [CrossRef]
- Amini, S.; Delgado, M.S.; Henderson, D.J.; Parmeter, C.F. Fixed vs Random: The Hausman Test Four Decades Later; Baltagi, B.H., Carter Hill, R., Newey, W.K., White, H.L., Eds.; In Honor of Jerry Hausman (Advances in Econometrics, Volume 29); Emerald Group Publishing Limited: Bingley, UK, 2012; pp. 479–513. [Google Scholar] [CrossRef]
- Hausman, J.A. Specification Tests in Econometrics. Econometrica 1978, 46, 1251–1271. [Google Scholar] [CrossRef] [Green Version]
- Arellano, M.; Bond, S. Some Tests of Specification for Panel Data: Monte Carlo Evidence and an Application to Employment Equations. Rev. Econ. Stud. 1991, 58, 277–297. [Google Scholar] [CrossRef] [Green Version]
- Blundell, R.; Bond, S. Initial conditions and moment restrictions in dynamic panel data models. J. Econometr. 1998, 87, 115–143. [Google Scholar] [CrossRef] [Green Version]
- Arellano, M.; Bover, O. Another look at the instrumental variable estimation of error-components models. J. Econometr. 1995, 68, 29–51. [Google Scholar] [CrossRef] [Green Version]
- Zhou, L. A study on the consumption promotion effect of housing subsidy policy and its influencing factors--Logistic analysis based on monetary rent allocation policy of low-cost housing in Shanghai. J. Shanghai Econ. Res. 2010, 4, 90–98. (In Chinese) [Google Scholar]


| Variable Name | Variable Meaning | Unit | Average Value | Standard Deviation | Minimum Value | Maximum Value | Number of Observations | |
|---|---|---|---|---|---|---|---|---|
| Dependent variable | lnconsume | Real value of per capita cash consumption expenditure of urban households | Yuan/person | 8.780271 | 0.3177255 | 8.148623 | 9.646826 | 319 |
| Examining variables | lnhse | Actual value of affordable housing investment per capita (1999–2009) | Yuan/person | 4.698569 | 0.8399499 | 1.595801 | 6.923169 | 319 |
| Control variables | lnincome | Real value of per capita disposable income of urban residents | Yuan/person | 9.054412 | 0.3485144 | 8.372239 | 10.0485 | 319 |
| lnchp | Actual value of average sales price of commercial housing units | Yuan/per square meter | 7.618805 | 0.4365458 | 6.709304 | 9.393124 | 319 | |
| service | Tertiary industry share | % | 0.3849921 | 0.0629665 | 0.286 | 0.755 | 319 | |
| industry | Percentage of secondary industry | % | 0.4636041 | 0.0750656 | 0.1976 | 0.615 | 319 | |
| bring | Urban family dependency ratio | % | 0.3435917 | 0.043563 | 0.2415781 | 0.4792317 | 319 |
| Variable Name | Variable Meaning | Unit | Average Value | Standard Deviation | Minimum Value | Maximum Value | Number of Observations | |
|---|---|---|---|---|---|---|---|---|
| Dependent variable | lnconsume | Real value of per capita cash consumption expenditure of urban households | Yuan/person | 9.864469 | 0.303365 | 9.216152 | 10.74415 | 319 |
| Examining the variables | lnhse | Real value of financial expenditure on housing support per urban resident | Yuan/person | 6.483025 | 0.652691 | 4.113154 | 8.30304 | 319 |
| Control variables | lnincome | Real value of per capita disposable income of urban residents | Yuan/person | 10.2391 | 0.3288864 | 9.521038 | 11.23323 | 319 |
| lnchp | Actual value of average sales price of commercial housing units | Yuan/per square meter | 8.752894 | 0.4518343 | 8.008033 | 10.53649 | 319 | |
| service | Tertiary industry share | % | 0.476531 | 0.0875437 | 0.3246 | 0.839 | 319 | |
| industry | Percentage of secondary industry | % | 0.4209928 | 0.0825777 | 0.158 | 0.62 | 319 | |
| bring | Urban family dependency ratio | % | 0.3242129 | 0.0524292 | 0.2013459 | 0.4635434 | 319 |
| 1999–2019 Data | |||||
|---|---|---|---|---|---|
| Test Methods/ Variables | ADF-Fisher Test (Chi-Square Statistic) | LLC Inspection (t-Star) | IPS Inspection W (t-Bar) | Whether to Include the Unit Root | |
| lnconsume | Level Value | 59.4797 (0.4215) | −2.27820 (0.0114) | 0.821 (0.794) | Yes |
| First order differential | 208.7858 (0.0000) | −7.51615 (0.0000) | −4.194 (0.000) | No | |
| lnhse | Level Value | 125.3062 (0.0000) | 1.53816 (0.9380) | 1.384 (0.917) | Yes |
| First order differential | 196.4498 (0.0000) | −3.55169 (0.0002) | −3.599 (0.000) | No | |
| lnchp | Level value | 49.1878 (0.7884) | −2.77352 (0.0028) | 0.595 (0.724) | Yes |
| First order differential | 181.3194 (0.0000) | −5.85586 (0.0000) | −3.748 (0.000) | No | |
| lnincome | Level value | 67.7208 (0.1794) | −7.08551 (0.0000) | −0.754 (0.225) | Yes |
| First order differential | 211.9550 (0.0000) | −7.17043 (0.0000) | −3.733 (0.000) | No | |
| Data for 2010–2020 | |||||
| lnconsume | Level Value | 228.1153 (0.0000) | −11.1735 (0.0000) | −5.9295 (0.0000) | Smooth and stable |
| First order differential | |||||
| lnhse | Level Value | 370.8961 (0.0000) | −4.9686 (0.0000) | −6.6545 (0.0000) | Smooth and stable |
| First order differential | −13.0158 (0.0000) | ||||
| lnchp | Level Value | 34.3678 (0.9943) | 0.4834 (0.6856) | 4.9931 (1.0000) | non-stationary |
| First order differential | 185.3725 (0.0000) | −4.8698 (0.0000) | Smooth and stable | ||
| lnincome | Level value | 734.8359 (0.0000) | −9.7697 (0.0000) | −9.0816 (0.0000) | Smooth and stable |
| First order differential | |||||
| Variables | 1999–2009 | 2010–2020 | ||
|---|---|---|---|---|
| Model 1-Fe | Model 2-Fe | Model 3-Fe | Model 4-Fe | |
| lnhse | 0.027 * (0.017) | 0.152 ** (0.063) | 0.021 *** (0.007) | 0.023 *** (0.008) |
| bring | 0.246 (0.216) | 0.526 ** (0.254) | −0.376 *** (0.096) | |
| lnincome | 0.847 *** (0.018) | 0.857 *** (0.018) | 0.859 *** (0.010) | 0.869 *** (0.027) |
| lnchp | −0.012 (0.016) | 0.049 (0.033) | −0.045 * (0.027) | |
| lnhse*bring | −0.080 * (0.048) | −0.142 ** (0.057) | ||
| lnhse*lnchp | −0.013 ** (0.006) | |||
| service | 0.230 * (0.136) | 0.150 (0.141) | 0.627 *** (0.219) | |
| industry | 0.284 ** (0.122) | 0.200 (0.128) | 0.247 (0.206) | |
| Intercept term | 0.900 *** (0.101) | 0.9010 *** (0.101) | 0.938 *** (0.083) | 0.940 *** (0.204) |
| Number of samples | 319 | 319 | 319 | 319 |
| Within-R2 | 0.787 | 0.767 | 0.776 | 0.779 |
| 1999–2009 | 2010–2020 | |||
|---|---|---|---|---|
| Model 1-Gmm | Model 2-Gmm | Model 3-Gmm | Model 4-Gmm | |
| L.lnconsume | 0.648 *** (0.087) | 0.596 *** (0.067) | 0.848 *** (0.011) | 0.636 ** (0.206) |
| lnincome | 0.319 *** (0.076) | 0.340 *** (0.056) | 1.628 *** (0.212) | |
| lnhse | 0.006 * (0.004) | 0.185 * (0.094) | 0.023 * (0.014) | 0.030 ** (0.015) |
| lnchp | −0.109 ** (0.050) | −0.16 ** (0.054) | ||
| bring | 0.353 (0.392) | |||
| lnhsebring | −0.095 (0.083) | |||
| lnhselnsh | −0.019 ** (0.009) | |||
| service | ||||
| industry | ||||
| Number of samples | 261 | 261 | 261 | 261 |
| ar1p | 0.000 | 0.000 | 0.000 | 0.000 |
| ar2p | 0.229 | 0.379 | 0.015 | 0.144 |
| hansenp | 0.255 | 0.286 | 0.250 | 0.225 |
| Region | Include Provinces and Cities | Number |
|---|---|---|
| Eastern Region | Beijing, Zhejiang, Jiangsu, Fujian, Guangdong, Shandong, Liaoning, Tianjin, Hebei, Hainan | 10 |
| Central Region | Heilongjiang, Jilin, Hubei, Hunan, Shanxi, Henan, Anhui, Jiangxi | 8 |
| Western Region | Ningxia, Shaanxi, Inner Mongolia, Qinghai, Sichuan, Xinjiang, Chongqing, Yunnan, Guangxi, Gansu, Guizhou | 11 |
| 1999–2009 (Fixed Effects Regression) | 2010–2020 (Fixed Effects Regression) | |||||
|---|---|---|---|---|---|---|
| Eastern Region | Central Region | Western Region | Eastern Region | Central Region | Western Region | |
| lnincome | 0.340 *** (0.087) | 0.324 *** (0.034) | 0.311 *** (0.076) | 0.535 *** (0.100) | 0.836 *** (0.037) | 0.836 *** (0.037) |
| lnphi | 0.162 * (0.073) | 0.448 (0.282) | −0.149 (0.235) | 0.069 (0.17) | 0.003 * (0.016) | 0.057 *** (0.014) |
| lnchp | 0.117 ** (0.037) | 0.268 (0.167) | −0.075 (0.154) | 0.763 (0.477) | ||
| bring | 0.184 (0.467) | 0.807 (0.681) | 0.295 (0.480) | |||
| lnphi bring | −0.053 (0.114) | −0.193 (0.144) | −0.118 (0.095) | |||
| lnphilnchp | −0.018 ** (0.007) | −0.049 (0.035) | 0.026 (0.030) | |||
| service | 0.110 (0.112) | 0.076 (0.057) | 0.256 (0.190) | 14.316 *** (1.640) | 0.623 ** (0.278) | 1.001 ** (0.400) |
| industry | 0.085 * (0.045) | −0.153 (0.086) | 0.083 (0.236) | 12.505 *** (3.336) | 0.447 ** (0.217) | 1.534 *** (0.429) |
| Intercept term | −0.384 (0.393) | −1.712 (1.403) | 1.227 (1.217) | −19.029 *** (6.165) | 0.772 *** (0.280) | 2.363 *** (0.381) |
| Number of samples | 110 | 88 | 121 | 110 | 88 | 121 |
| Within-R2 | 0.439 | 0.469 | 0.287 | 0.669 | 0.451 | 0.778 |
| 1999–2009 | 2010–2020 | |||
|---|---|---|---|---|
| Model 1-Gmm | Model 2-Gmm | Model 4-Gmm | Model 5-Gmm | |
| L.lnconsume | 0.621 *** (0.098) | 0.557 *** (0.054) | 0.8478 *** (0.012) | 0.3276 * (0.177) |
| lnincome | 0.344 *** (0.086) | 0.366 *** (0.048) | 1.3164 *** (0.184) | |
| lnhse | 0.005 * (0.005) | 0.181 * (0.097) | 0.0316 * (0.018) * | 0.0325 * (0.019) |
| lnchp | 0.105 ** (0.048) | −0.1419 ** (0.057) | ||
| bring | 0.344 (0.389) | |||
| lnhse*bring | −0.102 (0.090) | |||
| lnhse*lnsh | −0.018 * (0.010) | |||
| service | 0.231 ** (0.097) | |||
| industry | 0.031 (0.061) | |||
| Observations | 234 | 234 | 234 | 234 |
| ar1p | 0.000 | 0.000 | 0.002 | 0.009 |
| ar2p | 0.231 | 0.166 | 0.017 | 0.379 |
| hansenp | 0.346 | 0.335 | 0.381 | 0.373 |
Disclaimer/Publisher’s Note: The statements, opinions and data contained in all publications are solely those of the individual author(s) and contributor(s) and not of MDPI and/or the editor(s). MDPI and/or the editor(s) disclaim responsibility for any injury to people or property resulting from any ideas, methods, instructions or products referred to in the content. |
© 2023 by the authors. Licensee MDPI, Basel, Switzerland. This article is an open access article distributed under the terms and conditions of the Creative Commons Attribution (CC BY) license (https://creativecommons.org/licenses/by/4.0/).
Share and Cite
Shang, L.; Zhang, X.; Tang, D.; Ma, X.; Lu, C. The Impact of Housing Support Expenditure on Urban Residents’ Consumption—Evidence from China. Sustainability 2023, 15, 9223. https://doi.org/10.3390/su15129223
Shang L, Zhang X, Tang D, Ma X, Lu C. The Impact of Housing Support Expenditure on Urban Residents’ Consumption—Evidence from China. Sustainability. 2023; 15(12):9223. https://doi.org/10.3390/su15129223
Chicago/Turabian StyleShang, Li, Xiaoling Zhang, Decai Tang, Xiaoxue Ma, and Chunfeng Lu. 2023. "The Impact of Housing Support Expenditure on Urban Residents’ Consumption—Evidence from China" Sustainability 15, no. 12: 9223. https://doi.org/10.3390/su15129223
APA StyleShang, L., Zhang, X., Tang, D., Ma, X., & Lu, C. (2023). The Impact of Housing Support Expenditure on Urban Residents’ Consumption—Evidence from China. Sustainability, 15(12), 9223. https://doi.org/10.3390/su15129223