Article

Sustainability of Multiwall Carbon Nanotube Fibers and Their Cellulose Composite

1
Faculty of Applied Sciences, Ton Duc Thang University, Ho Chi Minh City 700000, Vietnam
2
Intelligent Materials and Systems Lab, Institute of Technology, University of Tartu, Nooruse 1, 50411 Tartu, Estonia
3
Conducting Polymers in Composites and Applications Research Group, Faculty of Applied Sciences, Ton Duc Thang University, Ho Chi Minh City 700000, Vietnam
*
Author to whom correspondence should be addressed.
Sustainability 2023, 15(12), 9227; https://doi.org/10.3390/su15129227
Submission received: 9 May 2023 / Revised: 1 June 2023 / Accepted: 5 June 2023 / Published: 7 June 2023
(This article belongs to the Special Issue Sustainable Materials Science and Technology)

Abstract

:
Nowadays, the research community envisions smart materials composed of biodegradable, biocompatible, and sustainable natural polymers, such as cellulose. Most applications of cellulose electroactive materials are developed for energy storage and sensors, while only a few are reported for linear actuators. Therefore, we introduce here cellulose-multiwall carbon nanotube composite (Cell-CNT) fibers compared with pristine multiwall carbon nanotube (CNT) fibers made by dielectrophoresis (DEP) in their linear actuation in an organic electrolyte. Electrochemical measurements (cyclic voltammetry, square wave potential steps, and chronopotentiometry) were performed with electromechanical deformation (EMD) measurements. The linear actuation of Cell-CNT outperformed the main actuation at discharging, having 7.9 kPa stress and 0.062% strain, making this composite more sustainable in smart materials, textiles, or robotics. The CNT fiber depends on scan rates switching from mixed actuation to main expansion at negative charging. The CNT fiber-specific capacitance was much enhanced with 278 F g−1, and had a capacity retention of 96% after 5000 cycles, making this fiber more sustainable in energy storage than the Cell-CNT fiber. The fiber samples were characterized by scanning electron microscopy (SEM), BET (Braunauer-Emmett-Teller) measurement, energy dispersive X-ray (EDX) spectroscopy, FTIR, and Raman spectroscopy.

1. Introduction

There is a strong demand for future materials of natural biodegradable polymers to reduce the pollution of synthetic polymers in nature. Cellulose is one of those natural polymers which receive, in recent years, much attention serving as a host matrix [1] with electroactive fillers in composites for batteries [2], flexible electronics [3], sensors [4,5], supercapacitors [6], electromagnetic shielding [7], etc. Paper-based composites as sustainable environmental supercapacitors have recently been shown in multifunctional applications [8], while more attention needs to be drawn to the electrolyte effect in electrochemical supercapacitors, recently shown for aerogel electrodes [9]. The electroactive materials applied in cellulose composites are not limited, but some examples are carbon nanotubes [10], reduced graphene oxides [11], conducting polymers [12], or a combination of them [13]. In one way, cellulose has to be dissolved, whereas, in most ways, ionic liquids are applied [14], breaking down the hydrogen bonding of cellulose and forming a cellulose ionic liquid suspension. When electroactive materials have been added to the suspension, cellulose composites are generally regenerated in an antisolvent, such as deionized water or acetone [15]. Other paths to combining cellulose with electroactive materials involve using the coating technology of electroactive polymer (EAP), either on cellulose paper [16,17] or cellulose fibers [18], or dipping technology [19]. Multifunctional MWCNT (CNT) can also be made in fiber material using dielectrophoresis (DEP) techniques [20] with high tensile strength. The CNTs are kept together over van der Waals forces, and the porosity/density of those fibers can be controlled over the applied electric field [21]. Research has been made using such CNT fiber in linear actuation properties, revealing relatively weak stress and strain [20,22]. Other research using DEP-formed CNT fibers allows the alignment of the CNT to obtain higher tensile strength [23] with various applications in sensors [24] as well as supercapacitors [25].
The charging/discharging mechanism of carbon nanotubes (CNT) acts as an electrochemical capacitor. The process forms an electrical double layer (EDL) related to the non-faradaic process induced by ion-injection, which leads to a change of C-C bonds [26]. The injected charge over an applied potential is balanced either by anions or cations forming the EDL. During actuation cycles, the carbon nanotubes are charged and discharged [27]. Several actuation mechanisms are proposed, from electrostatic actuation [28] to faradaic processes [29]. Comparison to other actuator work is often tricky due to different actuation conditions. For example, if the actuators are applied with different CNT materials (modified or unmodified), electrolytes, solvents, and potential ranges [30], as well as different procedures of CNT in composites, coatings, yarns, and fibers, this may lead to different outcomes.
CNT is often criticized for its toxic properties [31]. In vivo, it can lead to cancer due to the sharp needle form of its nanoparticles, leading to limited application ranges. The design of the Cell-CNT composite fiber avoids exposed CNT particles, making these composites more sustainable. The performance of such actuator material should be comparable to that of the pristine CNT fiber. Therefore, our goal in this work is to compare CNT fibers made by dielectrophoresis [20] and Cell-CNT composite fibers made over extrusion. The linear actuation properties and the specific capacitance are compared.
The electromechanical deformation (EMD) measurements of the CNT and Cell-CNT fibers (50 weight % CNT in cellulose) with cyclic voltammetry and square wave potential steps at frequencies from 0.0025 Hz to 0.1 Hz, are performed in bis(trifluoromethane)sulfonimide lithium salt with propylene carbonate solvent (LiTFSI-PC) at the same potential range of 0.65 V to −0.6 V. The CNT and Cell-CNT fibers were characterized by scanning electron microscopy (SEM), electric conductivity, BET measurements, and energy dispersive X-ray (EDX) spectroscopy. From linear actuation, it was revealed that Cell-CNT performs better than CNT fibers for stress and strain in long-term measurements.

2. Materials and Methods

2.1. Materials

Cellulose (microcrystalline, average particle size of 20 µm), 1-ethyl-3-methylimidazolium chloride ([EMIMCl], >97%), bis(trifluoromethane)sulfonimide lithium salt (LiTFSI, ≥99%), polyvinylpyrrolidone (PVP, average mol. Wt. 40,000), ethanol (technical), and propylene carbonate (PC, 99%) were purchased from Sigma-Aldrich (Taufkirchen Germany) and used as received. The material to form single MWCNT fibers as well cellulose MWCNT composite fibers contained multiwalled carbon nanotubes (MWCNT) (Baytubes® C 150 P; amorphous carbon content 0%, average outside diameter 13 nm, average inside diameter 4 nm, length > 1 µm) which were purchased from Bayer Material Science (Leverkusen, Germany) and used as received. Cellulose MWCNT fibers were formed in antisolvent using deionized water (Milli-Q Direct Water Purification System, Merck, Darmstadt, Germany).

2.2. MWCNT (CNT) and Cellulose MWCNT (Cell-CNT) Composite Fiber

MWCNTs were dispersed in deionized water with a surfactant PVP and ultrasonicated (Hielscher UP200S, 200 W, 24 kHz, Mount Holly, NJ, USA) for 30 min at 50% amplitude. The surfactant PVP is applied to assure the stability of the suspension. CNT fibers are made from previous research [22] over dielectrophoresis [23]. The CNT fibers were directly drawn from the suspension over the AC voltage (0–350 Vpp, 2 MHz) of a tungsten tip and metal plate, as shown in Scheme 1a. The obtained CNT fibers were washed with ethanol and dried in the oven for 12 h (60 °C, 2 mbar). The dimensions of the fibers were determined over microscopy (SEM), and their masses were measured with an analytical balance (Mettlor Toledo, readability 0.002 mg to 0.1 mg, Columbus, OH, USA). For CNT fibers, the mass was very low. Therefore, several fibers were produced to obtain 1 mg in weight. The CNT fibers in 0.5 cm length had a diameter of 134 ± 10 µm with fiber weight in the range of 37 ± 4 µg. After the charging/discharging cycles in the electrolyte, the CNT fiber diameter was determined over a micrometer (Dainu, 0.001 mm sensitivity, Šiauliai, Lithuania) and found a swelling of 14% with a diameter increase at the range of 152 ± 13 µm. The weight of the swollen fibers was determined to be 52 ± 5 µg.
Cellulose is not soluble in an aqueous solution. The procedure to obtain Cell-CNT composites was different [32]. Micro cellulose was dissolved in ionic liquids (EMIMCl). Afterward, MWCNTs were added in 50 wt.% with ultrasonication for 15 min (Hielscher UP200S, Teltow, Germany) and directly pressed through a syringe (0.76 mm inner diameter) into deionized water. The deionized water works as an antisolvent (regeneration of cellulose), forming cylindrical Cell-CNT fibers, as presented in Scheme 1b. The Cell-CNT fibers were washed with ethanol to remove the excess of EMIMCl and dried in the oven for 12 h (40 °C, 2 mbar). The diameter of the Cell-CNT fibers was measured over microscopy. The Cell-CNT fibers applied in this research had a length of 0.5 cm with a diameter of 800 ± 62 µm, with the weight of the samples found at 0.71 ± 0.06 mg. After the charging/discharging cycles in an electrolyte, the fiber swelling rate was found in the range of 7%, with the fibers’ diameter increasing to 850 ± 60 µm and their weight increasing to 0.76 ± 0.07 mg. The CNT content inside the fiber with 50 wt.% was found at a weight of 385 ± 32 µg.
The CNT and Cell-CNT fibers in the same length of 0.5 cm were clamped between a force sensor (TRI202PAD, Panlab, Barcelona, Spain) connected with the linear muscle analyzer setup [33]. They were fixed from the other end to an installed arm that contains gold contacts in a three-electrode compartment. The CNT or Cell-CNT fibers are the working electrodes, a platinum sheet (12 cm2) is the counter electrode, and Ag/AgCl (3 M KCl) is the reference electrode. The electrolyte in the measurement cell was 0.1 M LiTFSI in propylene carbonate (LiTFSI-PC). The CNT and Cell-CNT fibers were stretched (the linear muscle analyzer contains a movable stage) in a range of 0.1%, holding in the electrolyte solution for 6 h before the measurement commenced. Isometric (constant length of 1 mm) measurements were made to determine the change of weight (calculated to stress σ (kPa) = F A−1, F force in mN and A the fiber cross-section π ∙ r2). Isotonic measurements (constant force of 0.5 mN) were made to record length change (strain ε (%) = Δl/l∙100; Δl = l1 − l, l1 length change, l original length). The linear muscle analyzer was connected to the potentiostat (Biologic PG581, France) conducted over in-house software to measure changes in mass or length in real time [33].
Different electrochemical programs such as cyclic voltammetry (scan rate 5 mV s−1–100 mV s−1) and square wave potential step measurements at different frequencies (0.0025 Hz to 0.1 Hz) of the Cell-CNT and CNT fibers were conducted at a potential range from 0.65 V to −0.6 V. Long-term measurements at 0.05 Hz frequency in stress and strain in up to 120 cycles are performed. To determine the specific capacitance of Cell-CNT and CNT fibers, chronopotentiometry measurements were conducted at applied current i ± 0.05 mA, ±0.1 mA, ±0.2 mA, ±0.5 mA, ±1 mA, and ±2 mA. The specific capacitance Cs was calculated regarding Equation (1) [34] using the potential time curve at each applied current to obtain the slope (after IR drop) at discharging.
C s = i s l o p e · m
The mass of the Cell-CNT fiber considering the CNT mass (385 ± 32 µg) having a constant charge of 26 C g−1 at varied current. The CNT fiber mass was 52 ± 4 µg, leading to a constant charge density of 181.8 C g−1 at each applied current density.

2.3. Characterizations

SEM (Helios NanoLab 600, FEI, Lausanne, Switzerland) characterized the Cell-CNT and CNT fibers in surface and cross-section images. To determine the pore diameter of the fibers, ImageJ software was applied [35]. Raman spectroscopy (Renishaw inVia micro Raman, resolution 2 cm−1) was used with the 514 nm wavelength of an argon-ion laser for excitation. The 50 times objective was used for focusing the laser beam to obtain Raman signals in the region of 1200–1800 cm−1. FTIR (Fourier-transform infrared) spectroscopy (Bruker-Alpha with Platinum ATR, USA) at a wavelength range of 4000–800 cm−1 was applied to measure cellulose (unprocessed), Cell-CNT, and CNT fiber. Braunauer-Emmett-Teller (BET) was used to characterize the surface area of the CNT and Cell-CNT fibers over N2 adsorption–desorption isotherms at 77 K at relative pressure P/P0 in the range of 0–1 using the Quantachrome Nova Win2 instrument (Quantachrome Instruments, Boynton Beach, FL, USA). The BJH (Barrett, Joyner, and Halenda) method was applied to calculate the pore size distribution from the desorption isotherm. The maximum sample weight of the CNT fiber was 6.7 mg, and that of the Cell-CNT fiber was in the range of 100 mg. The reason for this weight difference comes from the samples’ sizes. The Cell-CNT fiber has a larger diameter than the CNT fiber. This means that 6.7 mg of the CNT fiber can cover the full BET container for calculation.
The resistivity R of the samples was determined over two-point probes with a digital multimeter (LCR Meter LCR200, EXTECH Instruments, Nashua, NH, USA), whereas from Equation (2), the electronic conductivity σe with volume the length of the fiber and A the areal of fibers was calculated.
σ e = l R · A  
EDX spectroscopy (Oxford Instruments with X-Max 50 mm2 detector, Abington, UK) was made (charging at 0.65 V for 2 min and discharging at −0.6 V for 2 min) of fibers in cross-section images to analyze the element contents of the fibers after actuation.

3. Results and Discussions

This work compared two kinds of fiber structures in energy storage applications. The CNT fiber was made with the DEP method, and the Cell-CNT fiber was made over extrusion. The Cell-CNT fibers are quite strong and contain CNT chains surrounded by cellulose. The CNT fiber obtained over the dielectrophoretic method [36] led to brittle fibers, consisting of only CNT bundles keeping together over van der Waals forces [22]. We are concentrating on linear actuation measurements to compare those two kinds of fibers to evaluate which shows better durability and sustainability for actuator applications. Additionally, the material’s energy storage capacity (specific capacitance) to distinguish potential applications of the two different fiber materials are compared.

3.1. Characterizations of CNT and Cell-CNT Fibers

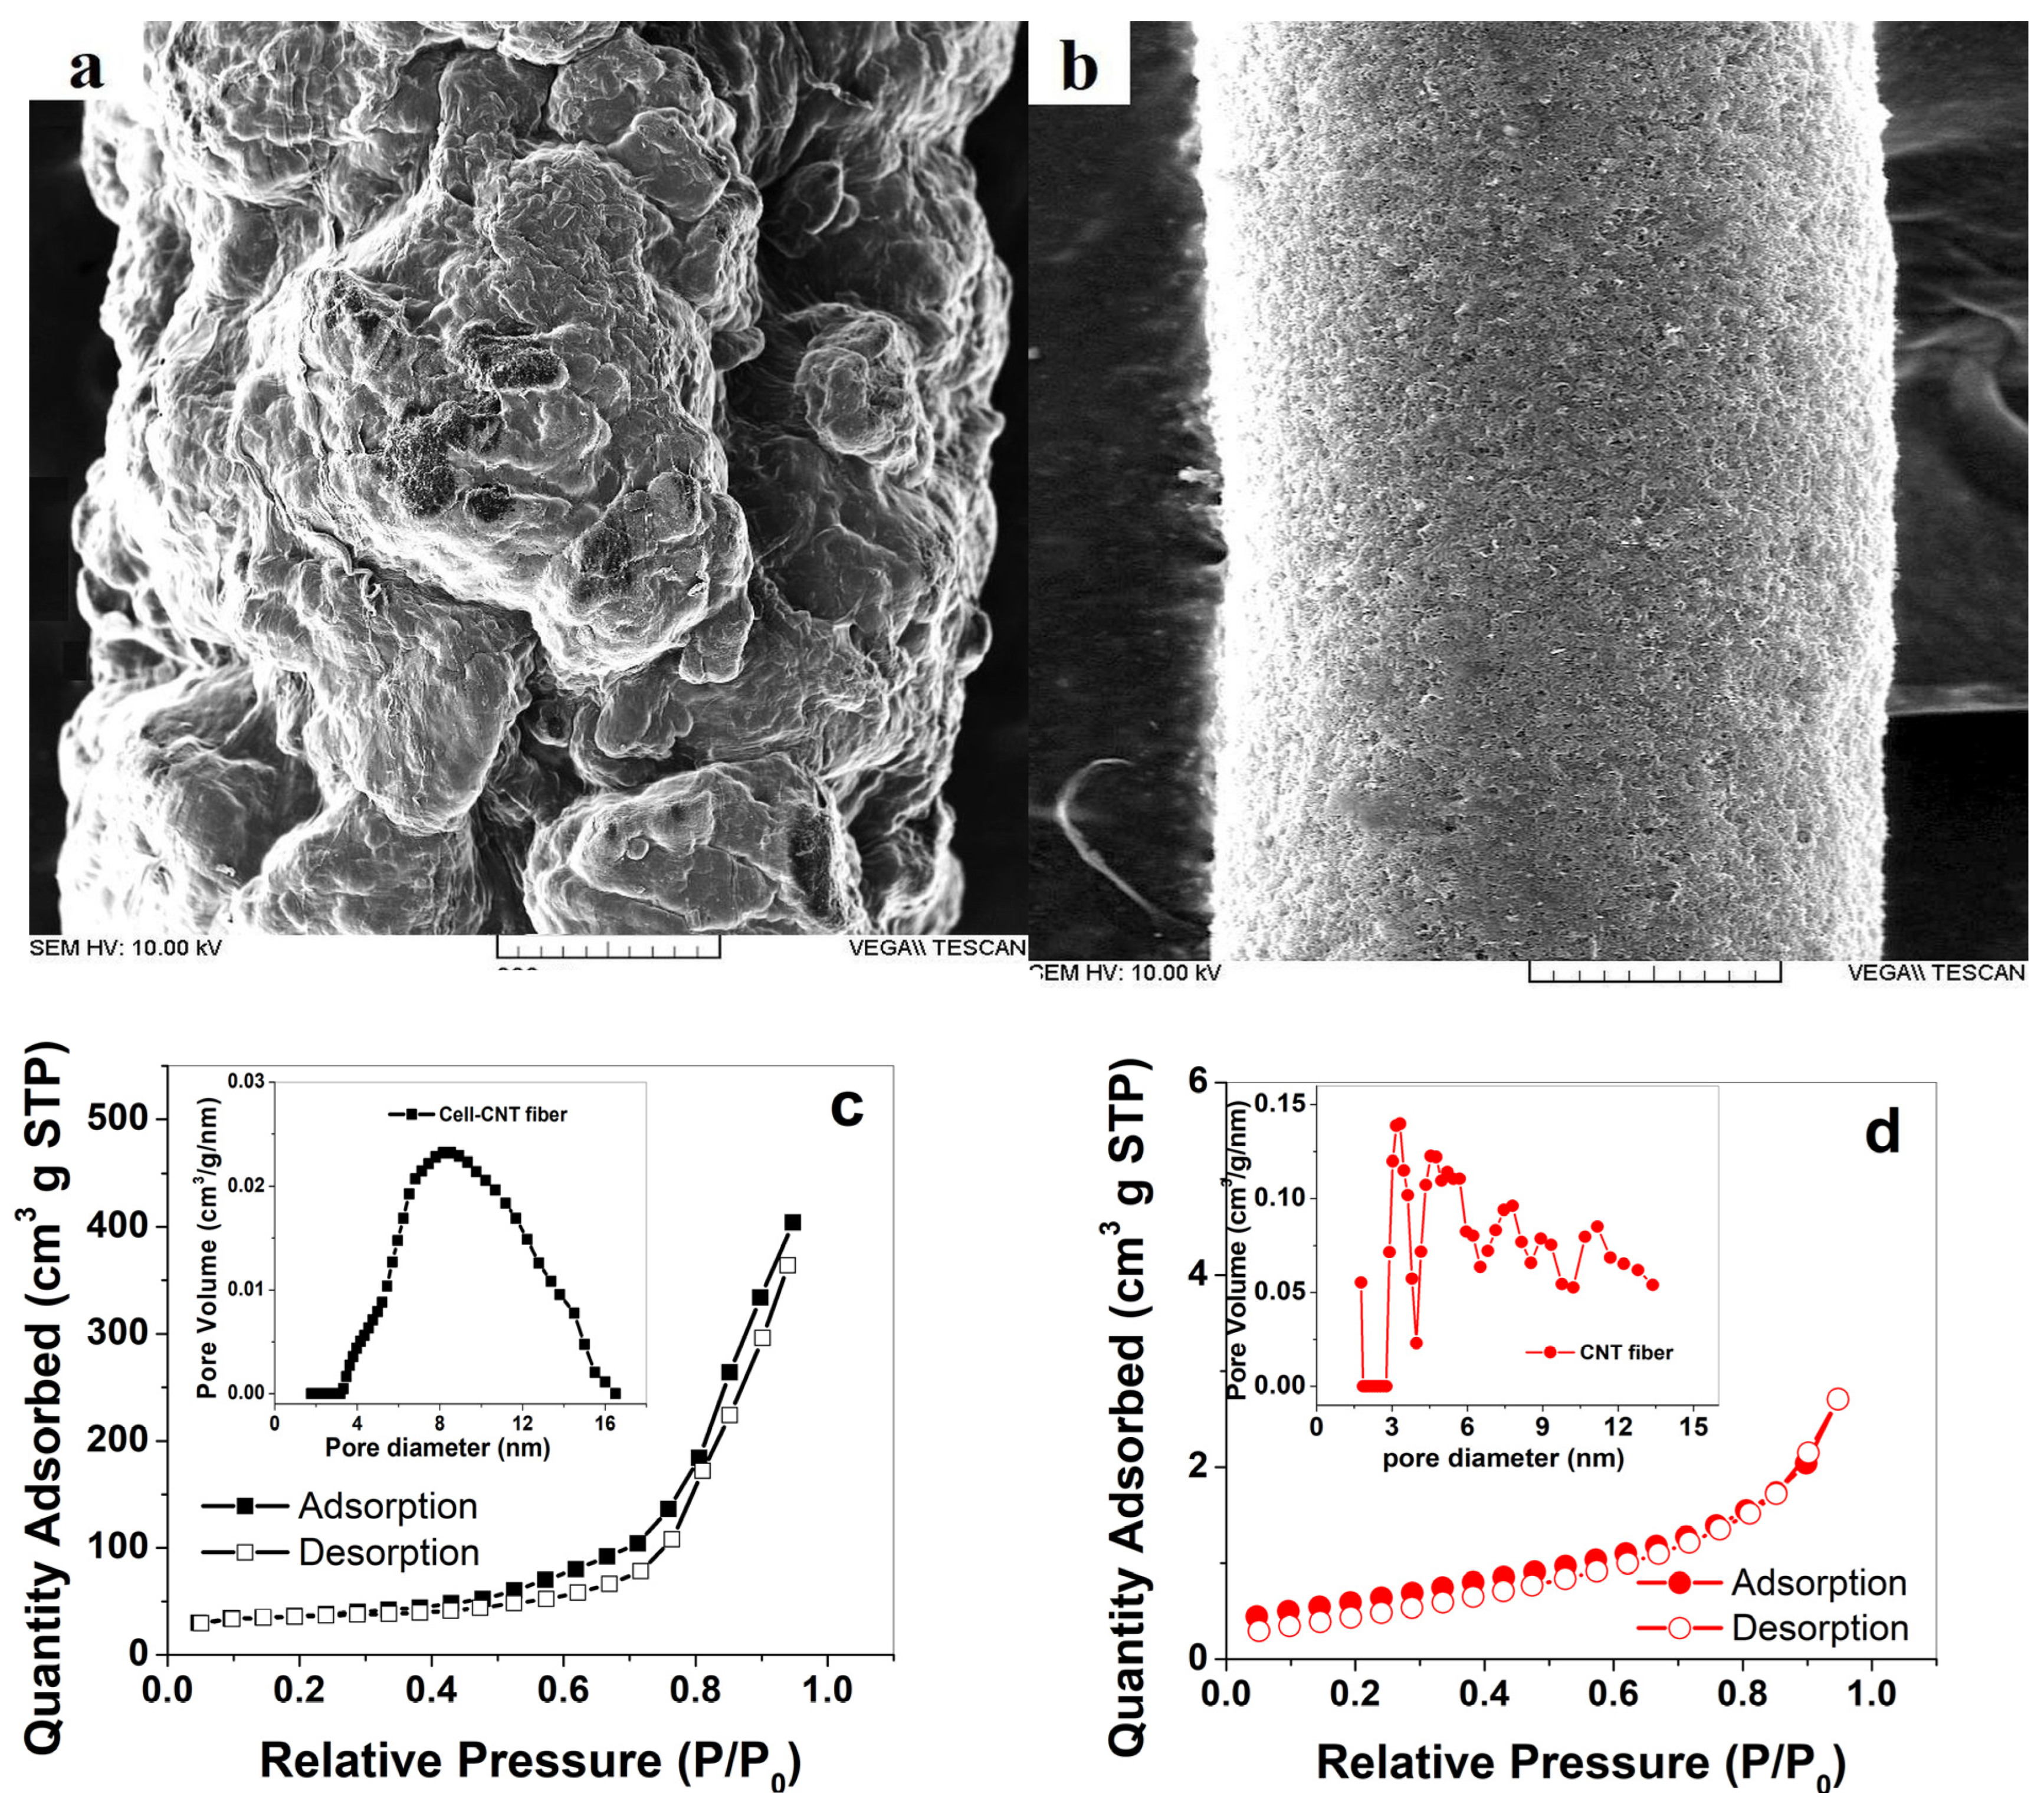
The SEM images of the surface of the Cell-CNT and CNT fibers are presented in Figure 1a,b, respectively. To compare pore diameter, we have applied ImageJ (1.53t) software to calculate the average pore diameter of the fibers using the surface of the CNT fiber and the inner cross-section of the Cell-CNT fiber, as this is where most CNT fibers are located. A SEM cross-section image is shown in Figure S1a, and the higher resolution of the inner core with an inset of pore diameter obtained from ImageJ (1.53t) software is shown in Figure S1b. The cross-section image of the CNT fiber is presented in Figure S1c, and the higher resolution of the fiber surface is shown in Figure S1d, with an inset of pore diameter. The isotherms (adsorption/desorption) obtained over BET with an inset of the pore size distribution are presented for the Cell-CNT fiber in Figure 1c and the CNT fiber in Figure 1d.
The surface morphology of the Cell-CNT fibers (Figure 1a) revealed no visible CNT chains, with their rough morphology reflecting cellulose. The cross-section image (Figure S1a) of the Cell-CNT fiber shows that most CNT chains are located in the inner center of the fiber, with cellulose surrounding those chains [36]. CNT at higher loads (above 25 wt.%) tends to bundle in polymers due to their intertube Van der Waals force [37]. Taking a higher magnification of the inner core shown in Figure S1b, the pore diameter determined by ImageJ software (inset of Figure S1b) revealed an average pore diameter of 2.46 ± 0.8 µm. In contrast, the CNT fiber shown in Figure 1b has a more porous surface [38] in the cross-section image in Figure S1c. The pore diameter of the CNT fiber surface (Figure S1d (inset)) was found to be 2.4 times smaller, with 1.02 ± 0.3 µm. The larger pore diameter from the Cell-CNT fiber is why the cellulose chains surrounding them lead to some increase in pore diameters compared to the CNT fiber.
The BET measurements of the isotherms of the Cell-CNT and CNT fibers (Figure 1c,d) show a type IV isotherm with small hysteresis at adsorption/desorption, revealing mesopores between 2 nm and 50 nm. In the previous study [39], 70 wt.% MWCNT in cellulose gave 128.57 m2 g−1. The CNT content inside the fiber in our study with 50 wt.% of the Cell-CNT fiber has a BET-specific surface area of 101.62 m2 g−1, which exhibits an excellent competition to the previous report. The CNT fiber-specific surface area was more than 3 times higher, with 329.39 m2 g−1, comparable to the reported MWCNT materials with a specific surface area of up to 300 m2 g−1 [40]. The differences between the two fiber samples can also be observed in the average pore size distribution (inset of Figure 1c,d) shown for the Cell-CNT fiber (7.55 nm) and the CNT fiber (3.32 nm). The CNT fiber has very narrow pores (Figure 1d, inset) of 1.6 nm and larger pores around 6–11 nm. As expected, the CNT fiber has a much smaller pore size distribution (~two times) than the Cell-CNT composites. The surface conductivity of the CNT fiber was found in the range of 11.2 ± 0.1 S cm−1, while the Cell-CNT fiber had a value of 2.96 ± 0.2 mS cm−1.
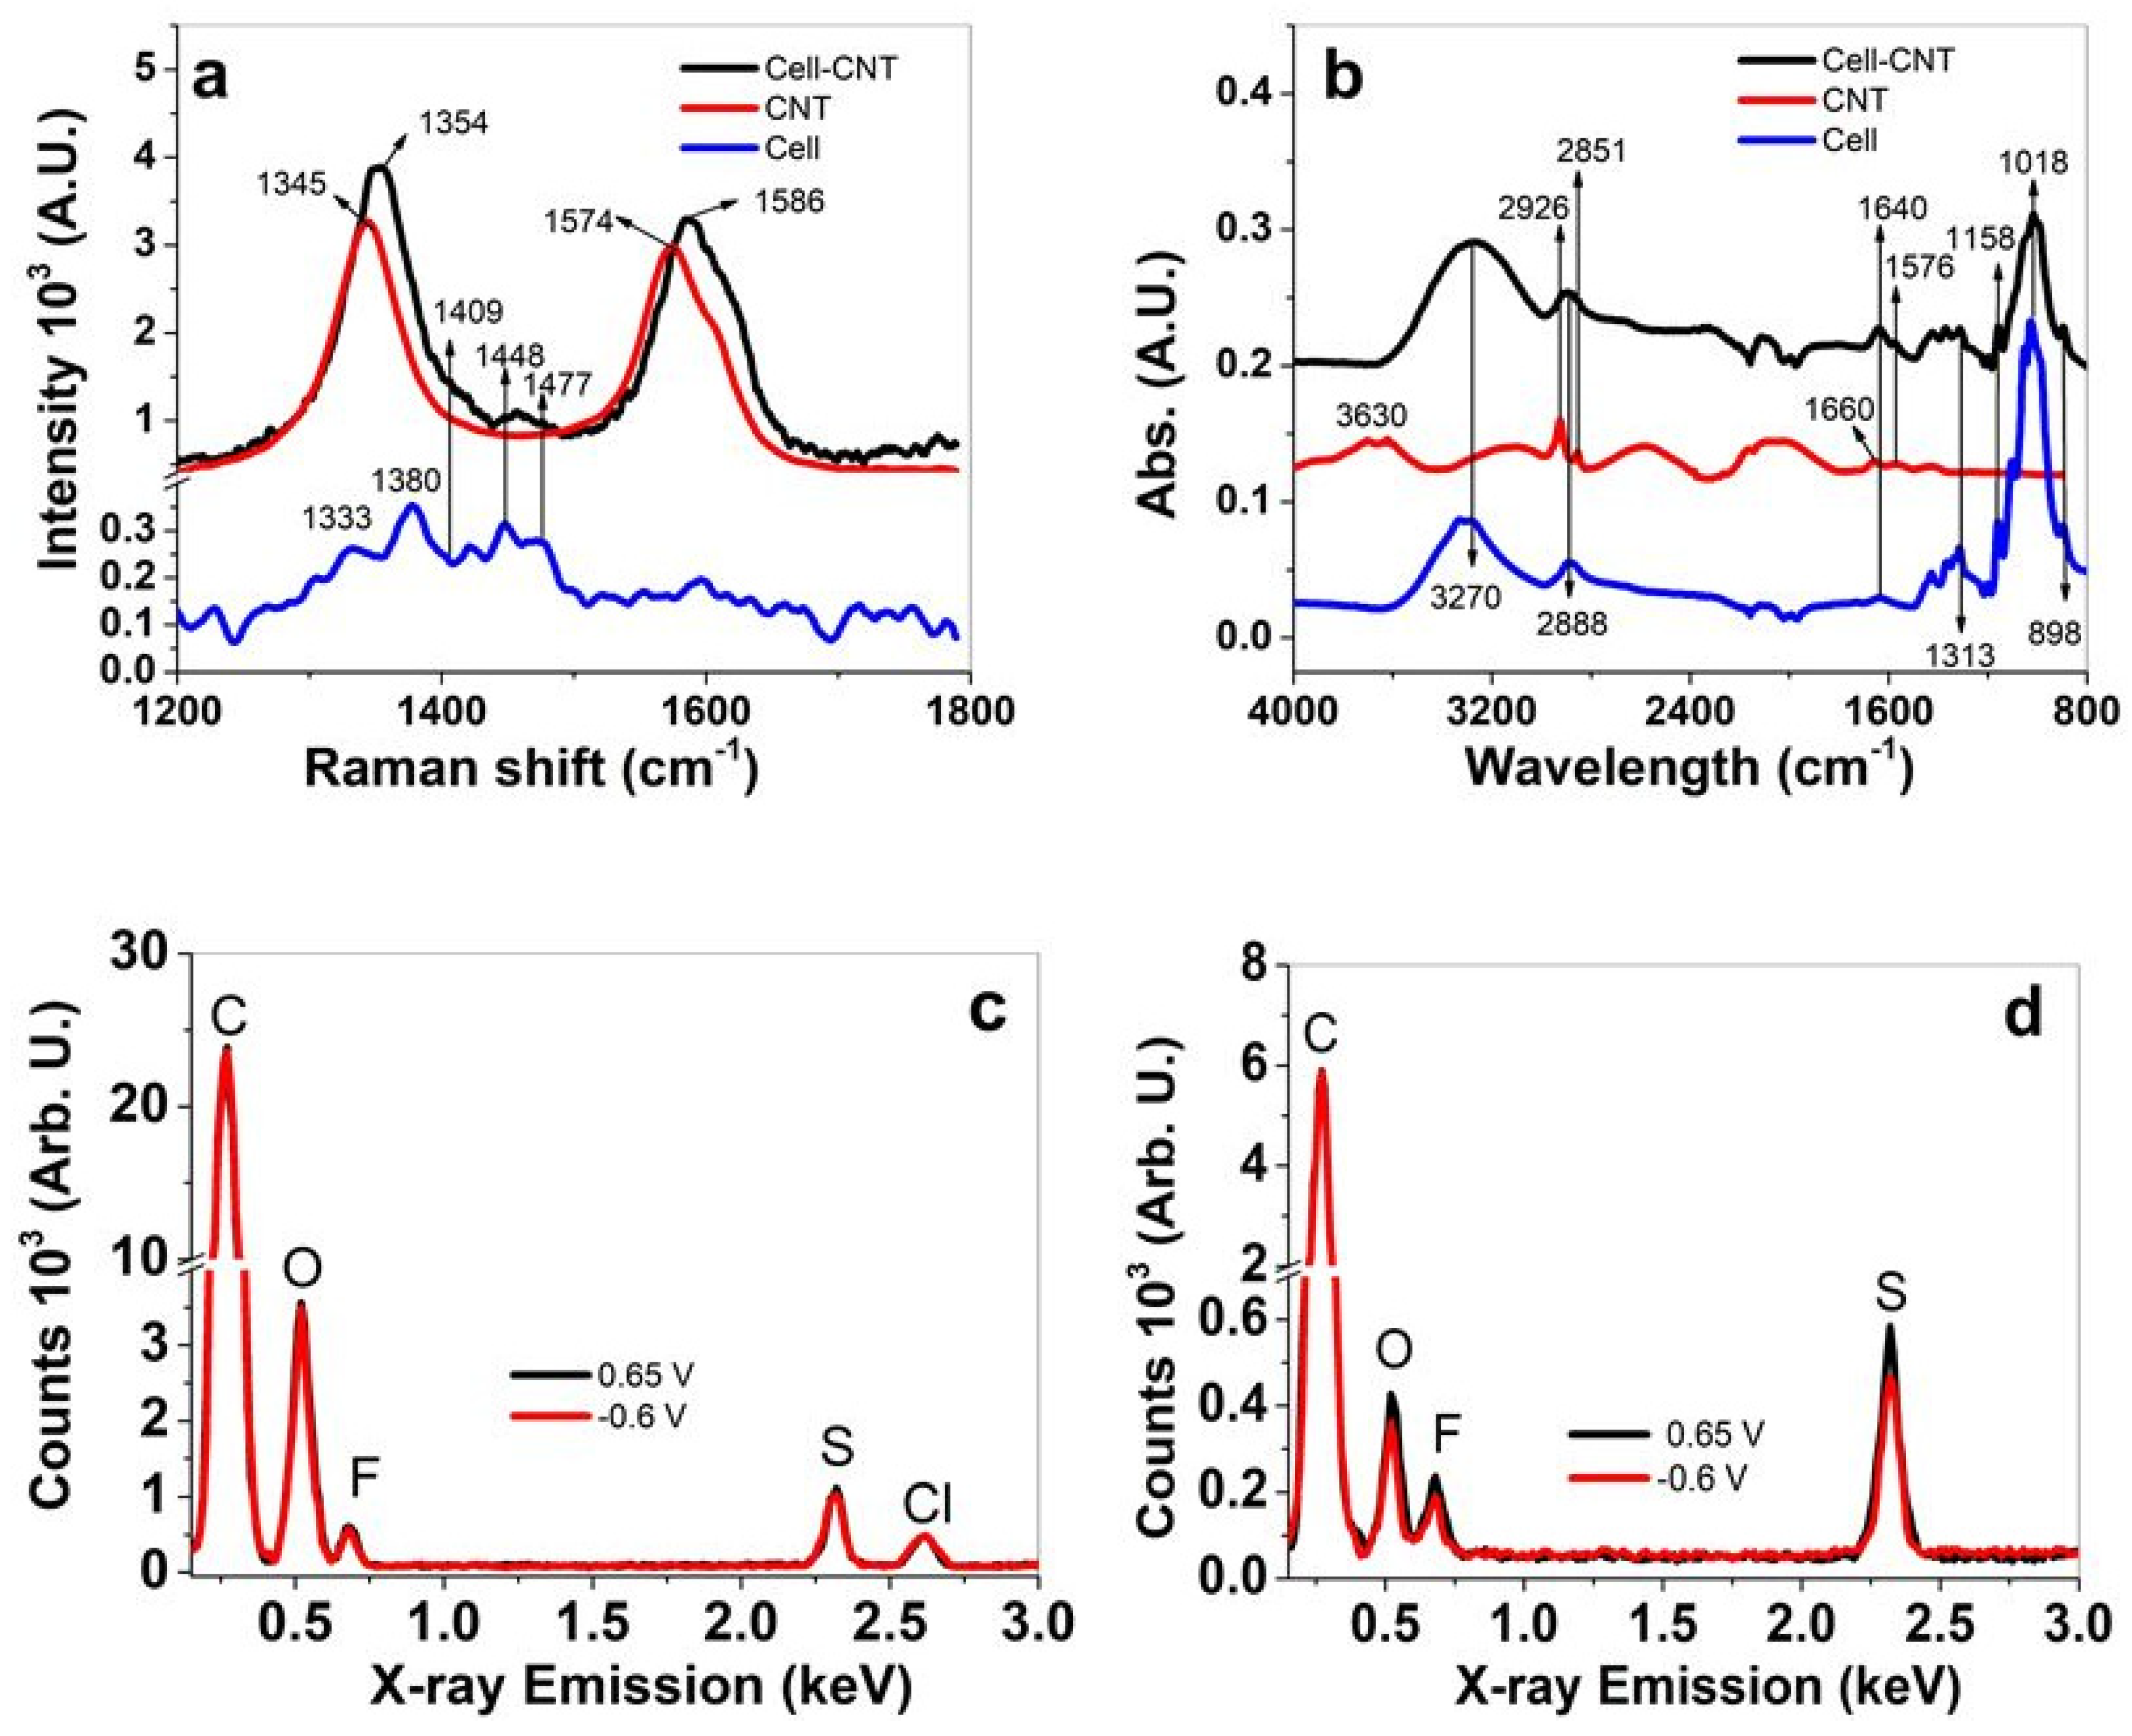
The further characterization of the Cell-CNT and CNT fibers was conducted in Raman and FTIR spectroscopy, with the results shown in Figure 2a,b, respectively. EDX spectroscopy of the cross-sections was performed at positive and negative charging to determine the element content in the fiber samples. The results for the Cell-CNT fiber are shown in Figure 2c and those for the CNT fiber are shown in Figure 2d.
The D peak at 1344 cm−1 and G peak at 1576 cm −1 are shown in Raman spectroscopy in Figure 2a, with those belonging to the in-plane vibration of the C-C bonds of the CNT fiber. Compared with the Cell-CNT fiber, those peaks shift to the right side at 10–12 cm−1. Previous research using MWCNT with synthetic polymers revealed that a shift to a higher wavelength appears due to CH-π interaction if polymers cover most of the MWCNT [41]. In our case, the hydrophilic cellulose (Figure 1a and Figure S1a) is attached to CNT. Therefore, the shifts of the D and G peaks are more pronounced. The cellulose spectra (Figure 2a) with signals at 1333 cm−1 and 1380 cm−1 belong to the deformation of the cellulose backbone [42] and cannot be detected in Cell-CNT due to the strong D peak in that region. Other signals which appear in Cell and Cell-CNT fibers are found at 1409 cm−1, and are cellulose backbone vibrations [43] with an additional 1448 cm−1 signal (in the literature 1454 cm−1 [43]) that presents the HCH and HOC bending vibration [44]. The 1477 cm−1 small peak in Cell-CNT and the broad signal in Cell (in the literature 1481 cm−1 [42]) represents the CH2 bending vibration of cellulose.
The FTIR spectra (Figure 2b) also have characteristic absorption peaks for cellulose and Cell-CNT at 3270 cm−1 for hydrogen -OH bonding stretching vibrations [45], with that absorption peak found at 3630 cm−1 for the CNT fiber. Additional absorption peaks for the CNT fiber and Cell-CNT fiber are located at 2926 cm−1 and 2851 cm−1, which refer to C-H stretching vibrations. The absorption peak at 1660 cm−1 is shown only in the CNT fiber, which belongs to the C=O stretching of PVP [44] used in the DEP process, avoiding CNT bundling. The 1576 cm−1 absorption peak is shown in Cell-CNT, and the CNT fiber describes the C=C bonding vibrations [46].
A broader absorption peak at 2888 cm−1 (C-H stretching vibrations) is shown in cellulose and the Cell-CNT fiber with absorption peaks at 1640 cm−1 (absorbed water [45]) and 1313 cm−1 (CH2 wagging found in the literature at 1318 cm−1 [47]). The absorption peaks at 1158 cm−1 are the bridge stretching [48] of C-O-C bonds in cellulose with the β-glycosidic linkage (C-O-C) shown at 897 cm−1. Additional absorption peaks of cellulose and Cell-CNT are shown at 1018 cm−1, which belongs to the primary hydroxy groups in general, as demonstrated in regions between 1000 and 1075 cm−1 [49].
Figure 2c,d show signals of carbon (C) at 0.27 keV, oxygen (O) at 0.52 keV, fluoride (F) at 0.68 keV, sulfur (S) at 2.32 keV, and chloride (Cl) (only Figure 2a) at 2.62 keV. The carbon and oxygen peak refers to cellulose and CNT material, while the chloride peak relates to a residue of EMIMCl in the Cell-CNT fibers [32]. The fluoride and sulfur peak (partly oxygen) also refer to the element’s content of the anion TFSI of the LiTFSI electrolyte (Li cannot be detected due to their small size). Such peaks at negative charging compared to positive charging suggests that TFSI anions are incorporated in the pores of CNT and Cell-CNT fibers. In the case of the CNT fiber (Figure 2d), the oxygen, fluoride, and sulfur peak decrease slightly at negative charging. Fluoride is only found in TFSI anions, which we assume are incorporated in the CNT pores. At discharging, the EDX spectra revealed reduced fluoride contents, suggesting that those TFSI anions are partly expelled from CNT.

3.2. Isometric and Isotonic EMD Measurement

From each Cell-CNT and CNT fiber, at least three fiber samples were indifferent from each measured, and the results were shown in mean values with standard deviations. Before linear actuation measurements, the fibers were stored in a stretched position to ensure that no irreversible swelling over the solvent influences the outcome. The changes in mass (calculated to stress) were directly obtained over isometric EMD measurements, while the changes in length required a calibration of the force sensor, which was made for each fiber sample separated (stiffness factor k). To determine the stiffness of the fibers before and after the actuation measurements, the fibers were stretched 1 µm in length over the movable stage of the linear muscle analyzer [33], and the stiffness factor k in mg/µm (stress/strain calculated to elastic modulus Y) was determined. From previous research, changes in stiffness (elastic modulus) before and after actuation changed the outcome of the strain results [50]. Table 1 compares the fiber samples’ stiffness k (measured) and elastic modulus Y before and after the actuation measurements.
The stiffness changes, also known as elastic modulus (Table 1), revealed a 1.2 times decrease for the Cell-CNT fiber after the actuation cycles. Previous research [50] found that softening effects appeared most likely on the deep eutectic solvents shown for tetrabutylammonium bromide propylene carbonate reducing hydrogen bonds in cellulose, whereas here, LiTFSI-PC was applied. The four times increase in the elastic modulus in the CNT fibers after the actuation cycles in the electrolyte is why the solvent PC interaction regarding the Lenard-Jones model strengthens the van der Waals interaction [51]. In the following sections, different electrochemical techniques (cyclic voltammetry and square wave potential steps) are conducted to investigate the linear actuation properties.

3.2.1. Cyclic Voltammetry

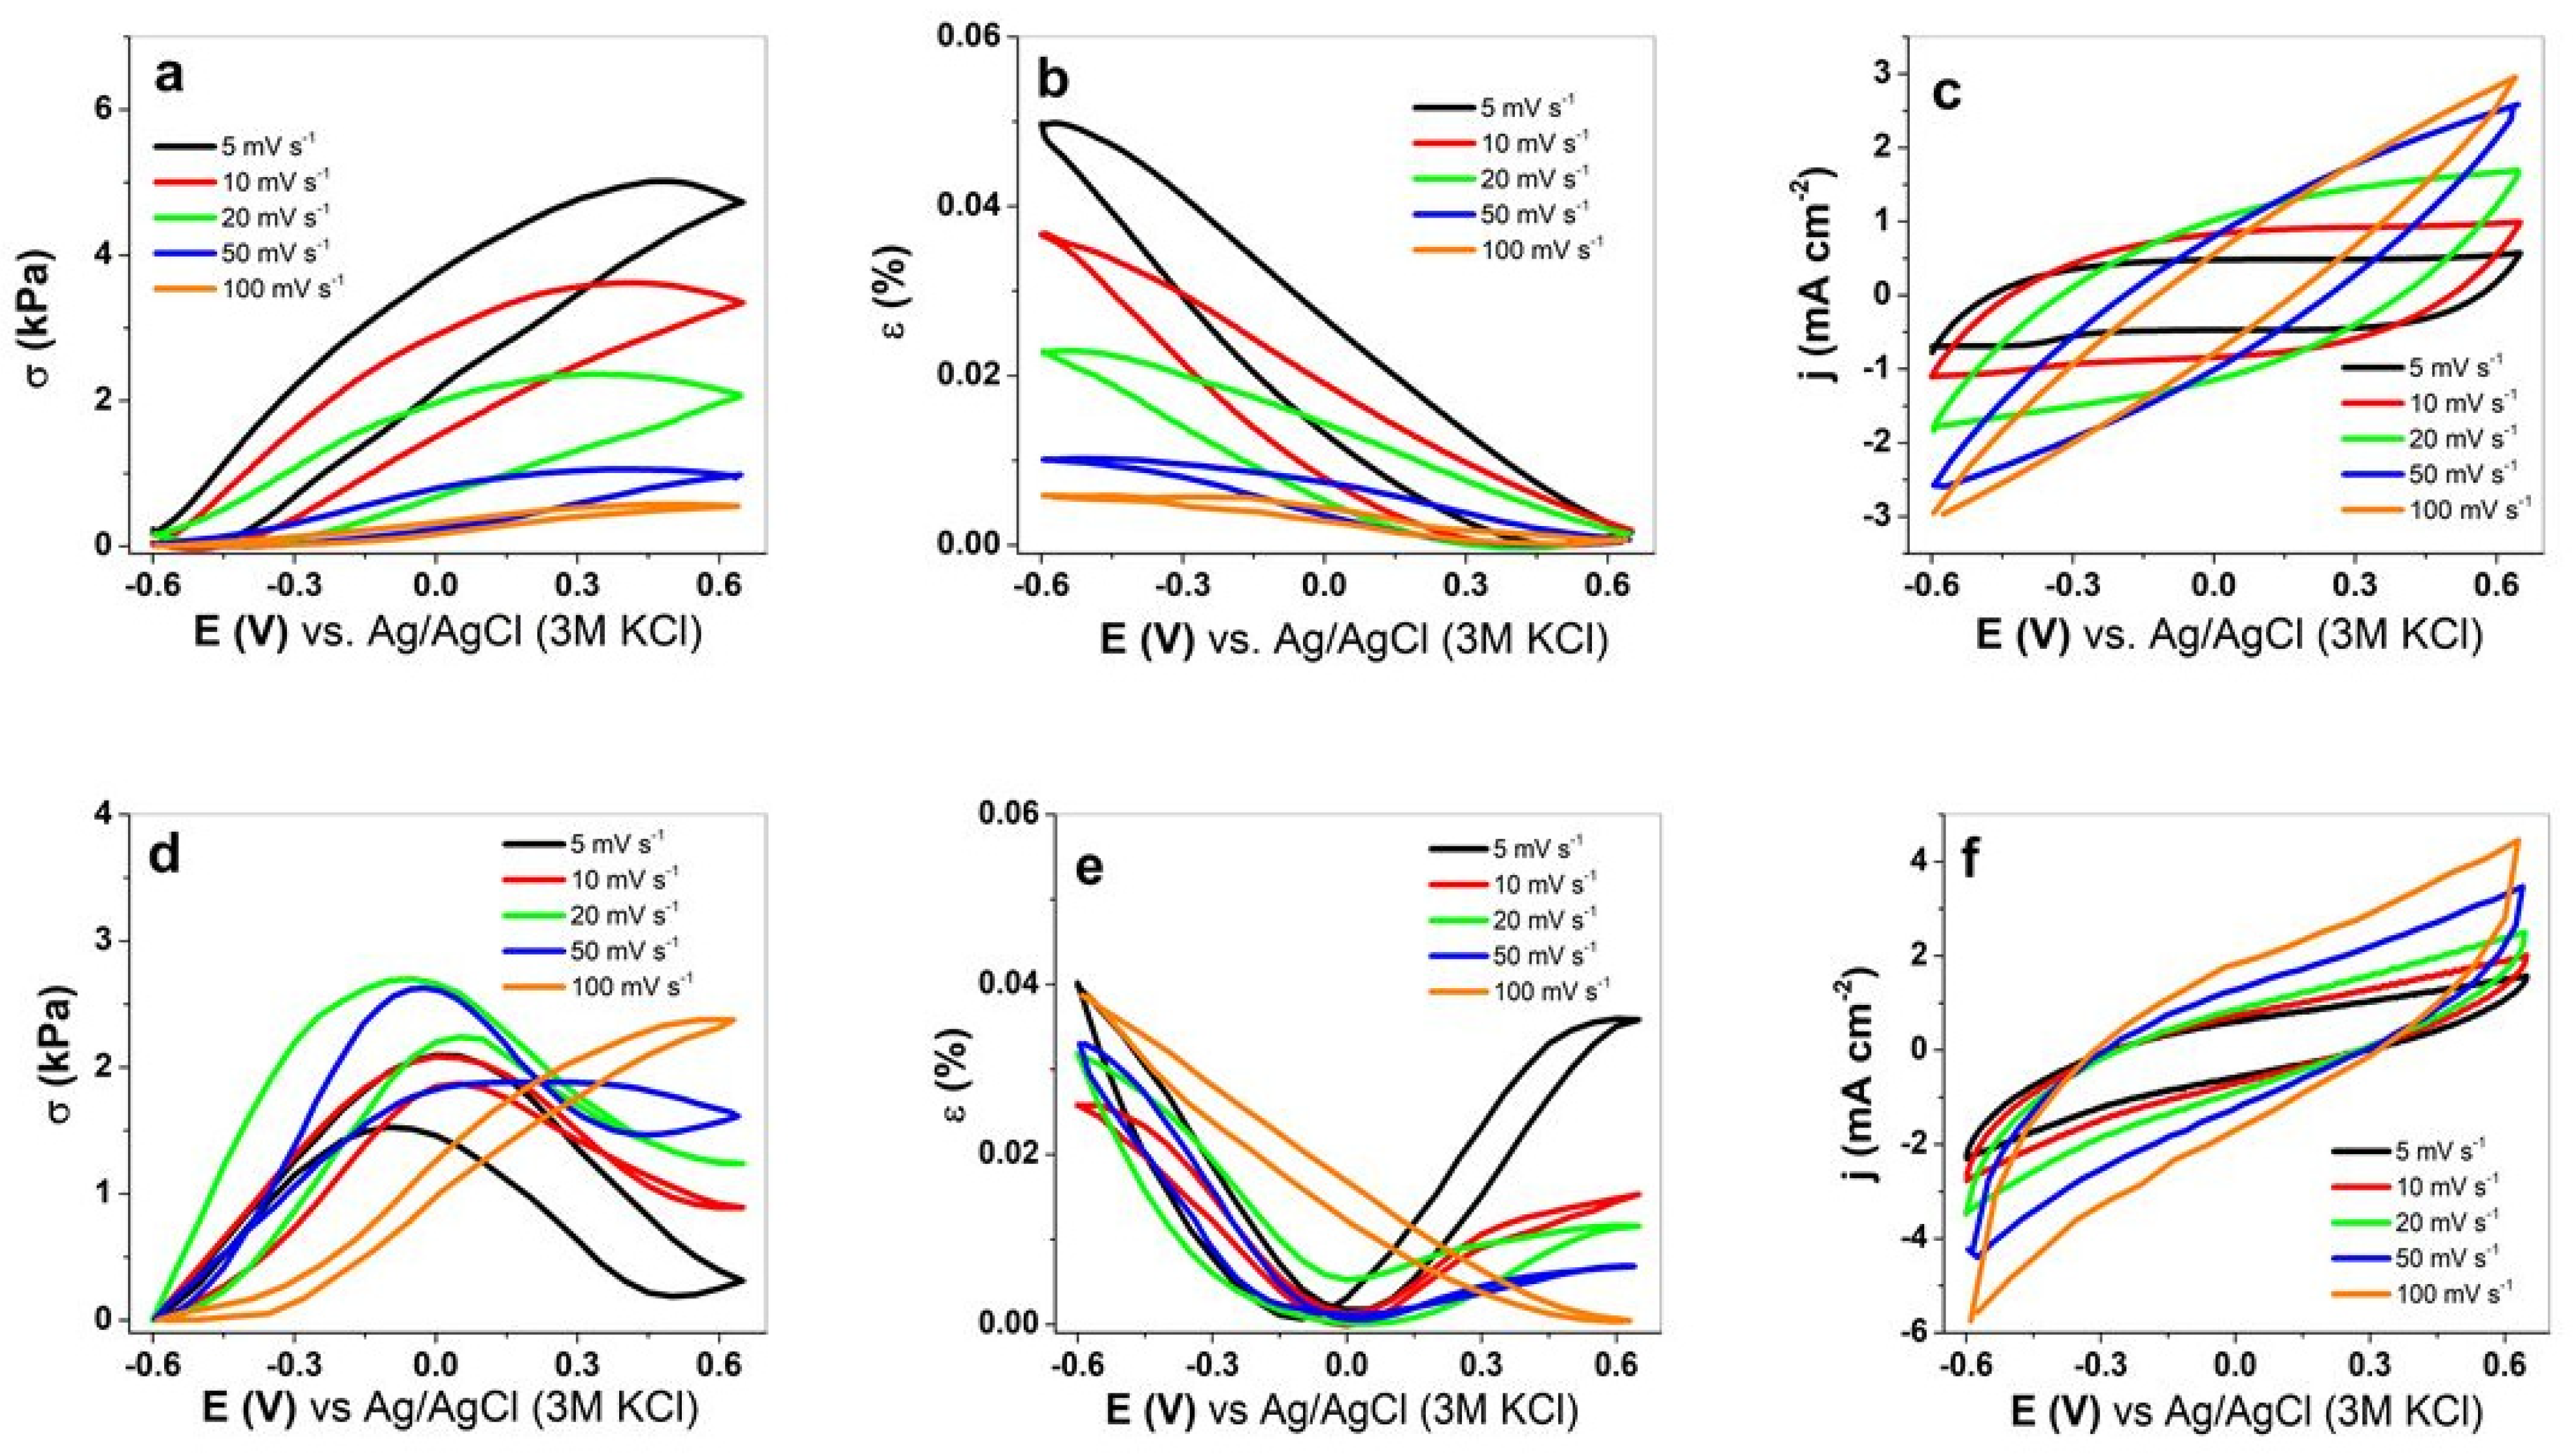
Linear actuation in isometric and isotonic EMD measurements was performed by applying cyclic voltammetry. Different scan rates (5–100 mV s−1) with stress curves are shown in Figure 3a, strain is shown in Figure 3b, and the current density (CV shapes) is shown in Figure 3c, regarding the Cell-CNT fibers. For the CNT fibers, the actuation results of stress, strain, and current density are presented in Figure 3d–f, respectively. The charge density curves for the Cell-CNT fibers are shown in Figure S2a, and those for the CNT fibers are shown in Figure S2b.
Main expansion at negative charging (−0.6 V) is revealed for the Cell-CNT fibers (Figure 3a,b), with stress in the range of 4.7 kPa and a strain of 0.05% at a scan rate of 5 mV s−1. With increasing scan rate, the stress and strain decreased and were 0.54 kPa and 0.006%, respectively, at 100 mV s−1. In the case of the CNT fiber (Figure 3d,e), there is mixed ion actuation, with main expansion at negative charging as an example for strain at a scan rate of 5 mV s−1 (Figure 3e). The expansion at positive charging showed 0.036%, and showed 0.04% at negative charging. With increasing scan rates at positive charging, the expansion decreased, showing 2.37 kPa stress and 0.039% strain at a scan rate of 100 mV s−1. It needs to be noticed that at this scan rate, only expansion at negative charging appeared. The actuation mechanism of the Cell-CNT and CNT fibers refers to ion-injection-induced EDL [26] formation, whereas at negative charging, the fibers are balanced by cations forming the electrical double layer. Considering that the TFSI anions are linear [52], the more porous surface structure of CNT fibers allows some TFSI anions to be left at negative charging, leading to mixed actuation. At faster scan rates, the time is too short, and most TFSI anions stay in the CNT fibers, which leads to expansion at discharging. TFSI anions are hydrophobic, and we assume this is another reason why the exchange of anions occurs at a lower scan rate of the hydrophobic CNT fiber. In the case of Cell-CNT fibers, a more complex mechanism of charging/discharging induced linear actuation exists, despite the fibers’ generally compact structure due to cellulose covering most of the CNT materials (Figure 1a) [32]. Besides which solvent, aqueous or organic, is chosen, the choice of the applied potential range plays a vital role [30]. The TFSI anions are incorporated in the Cell-CNT fiber, and the chloride anions of EMIMCl residue are still inside the Cell-CNT fiber (fluoride and chloride elements are shown in EDX in Figure 2c). Therefore, to balance such negative charges, the hydrophilic Li+ cations form the EDL at negative charging, and as a consequence, expansion at negative charging takes place.
From the current density potential curves in Figure 3c, the Cell-CNT fibers have a small discharging peak at −0.41 V, with no charging peaks observed. Previous research stated that the existence of charging or discharging waves refers to faradaic processes [29], while others explained that the appearance of such peaks is the reason for left impurities [53]. The potential range from 0.65 V to −0.6 V was chosen due to the charging/discharging in balance, as seen in Figure S2a,b, of the close loops for the Cell-CNT and CNT fibers.
The charge density of Cell-CNT at a scan rate of 5 mV s−1 was 102.7 mC cm−2, while the CNT fiber at the same scan rate had two times higher charge density (212.4 mC cm−2), which was found to be similar at higher scan rates. The main reason for the more than double charge density is the much higher specific surface area of the CNT fiber, with nearly three times higher values (BET measurements in Figure 1c,d) compared to the Cell-CNT fiber. The much better electronic conductivity of the CNT fiber contributes to faster charging/discharging properties.

3.2.2. Square Wave Potential Steps

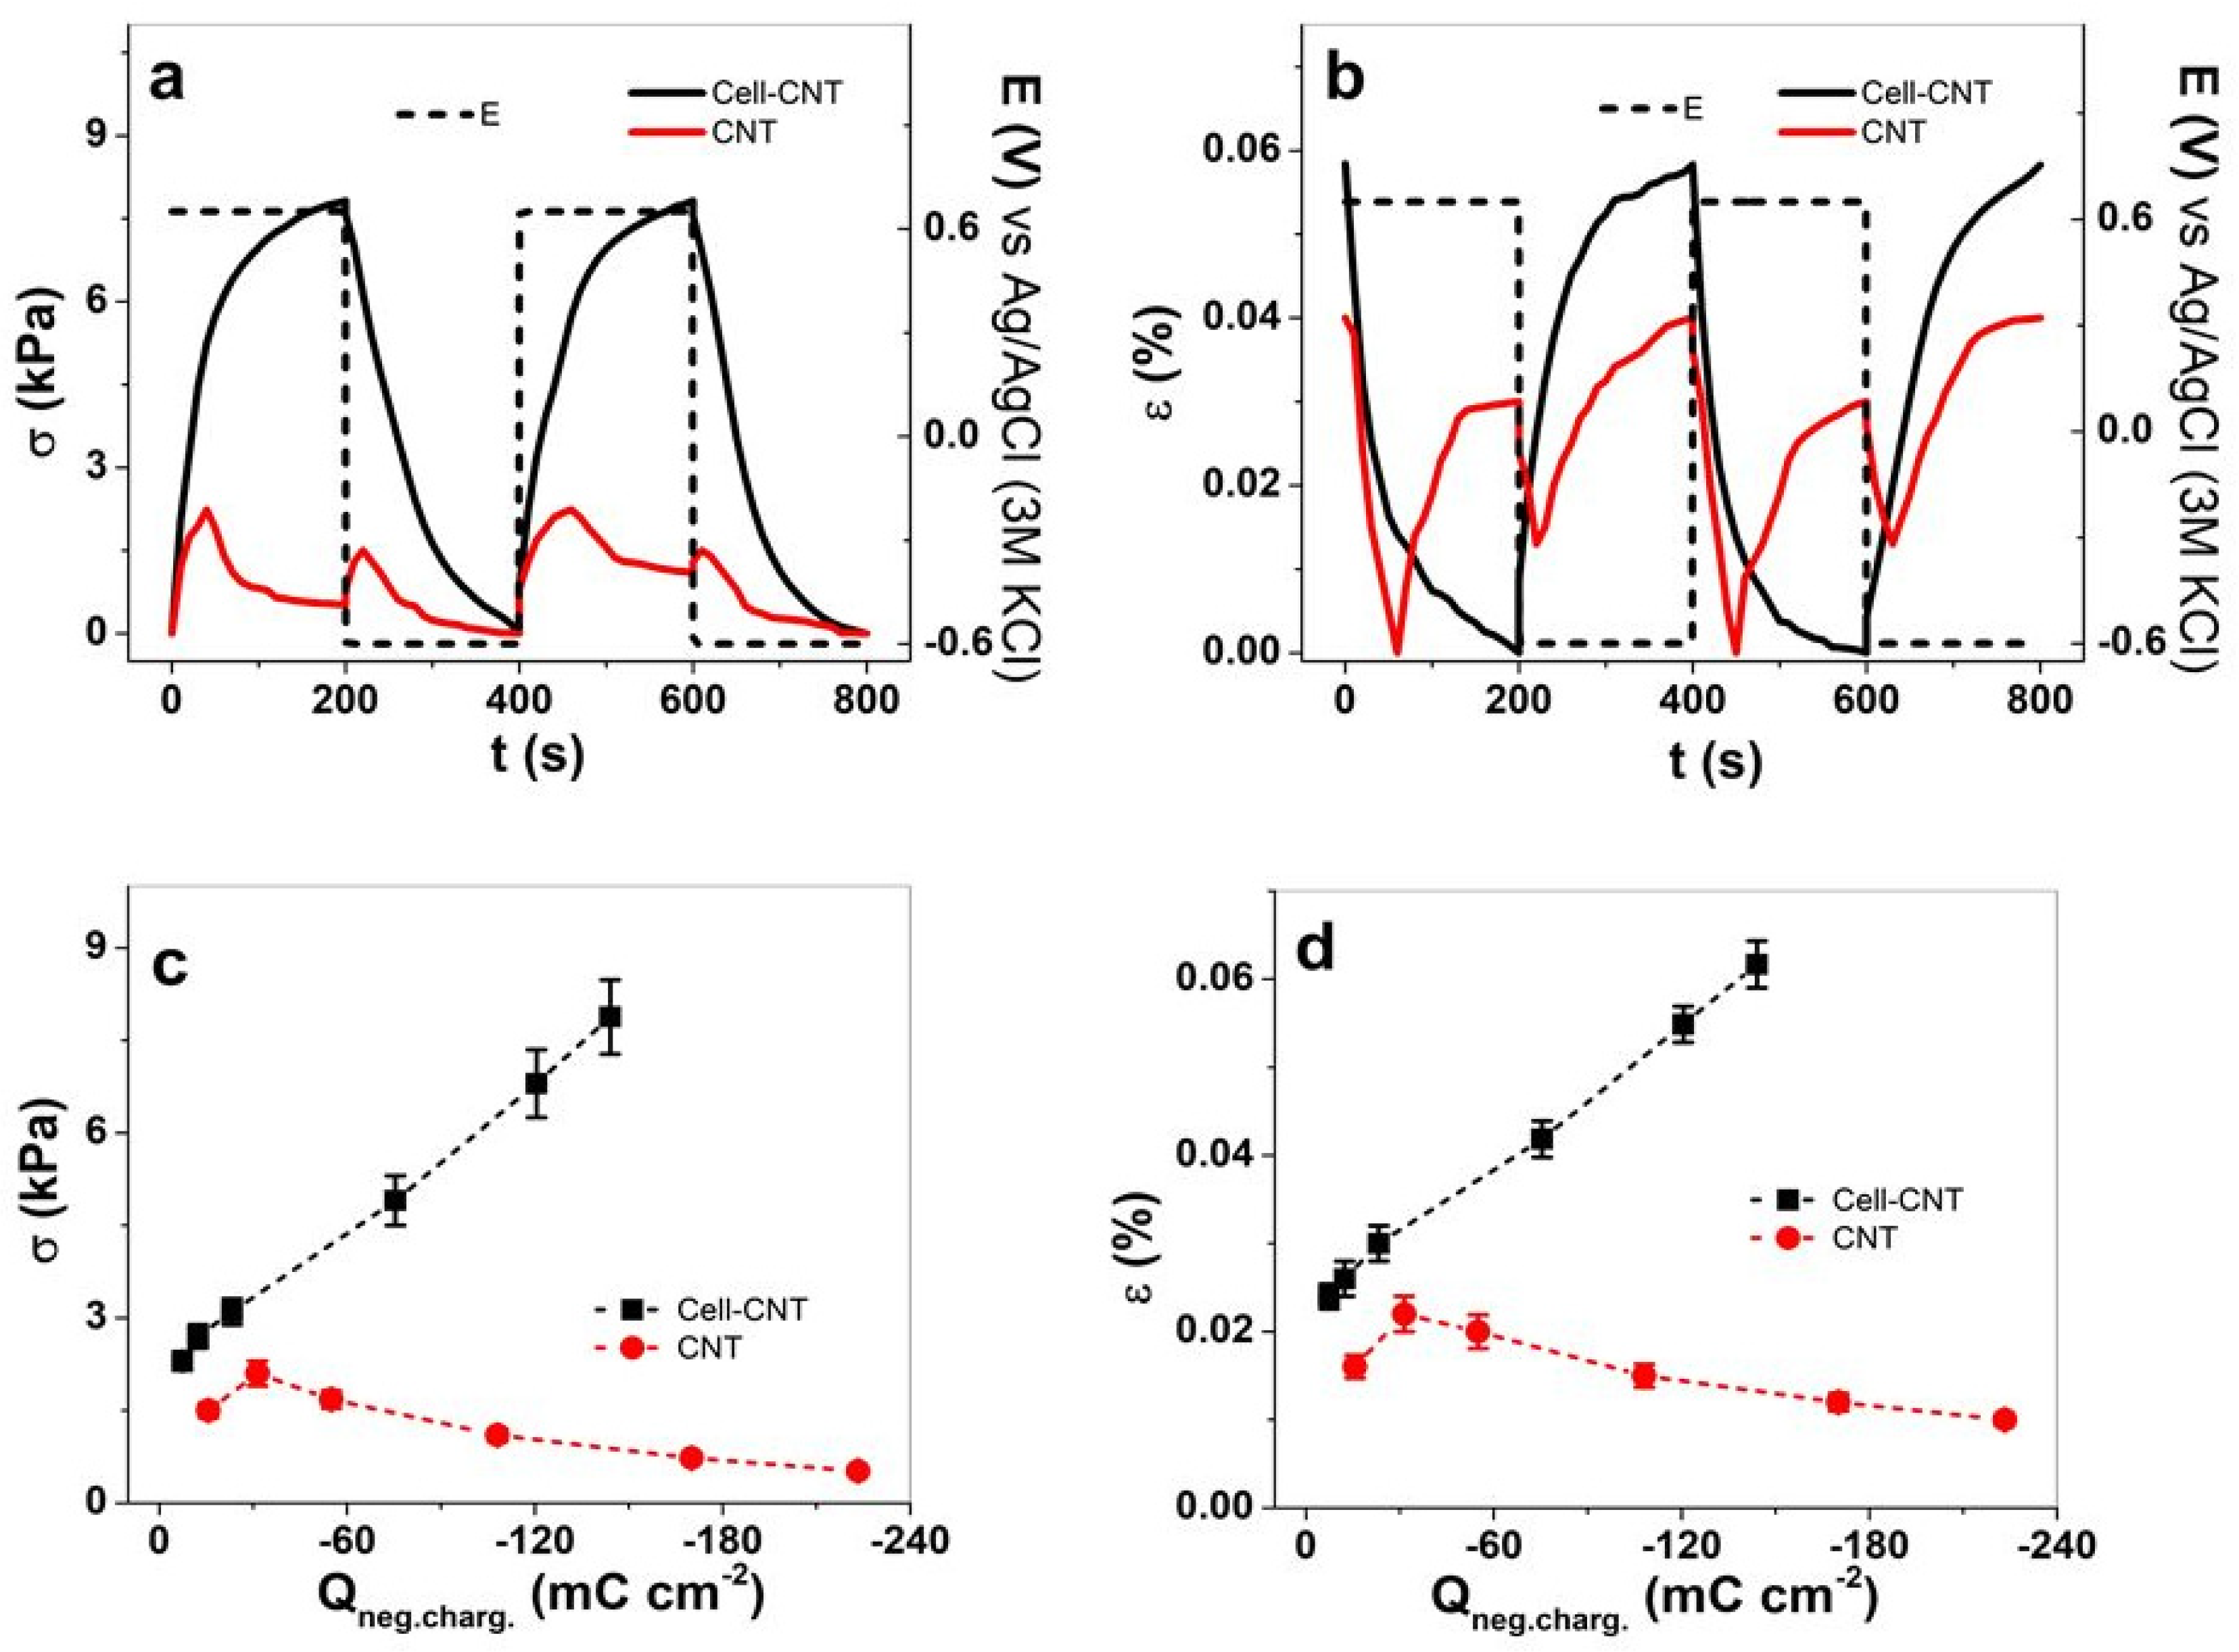
Square wave potential step measurements of the Cell-CNT and CNT fibers were performed at different frequencies from 0.0025 Hz to 0.1 Hz to determine the linear actuation. The stress (lowest points set to zero) and strain profile of both samples at a frequency of 0.0025 Hz are shown in Figure 4a,b, respectively. The charge density was determined by integrating the current density time curves at each frequency, and the results of strain and stress against the charge density (at negative charging) are shown in Figure 4c,d. The strain and stress results against applied frequencies are presented in Figure S3a,b.
Recent research shows that the CNT fiber stress and strain profile (Figure 4a,b) revealed mixed actuation with expansion at negative and positive charging [20]. Mixed actuation properties are not ideal in linear actuators, as the overall stress and strain is reduced, as shown with a stress difference of 0.52 kPa and a strain of 0.01%. In the case of Cell-CNT, the stress and strain profiles had only main expansion at negative charging with stress at 7.9 kPa and a strain of 0.062%. With increasing frequency (Figure S3a,b), the stress and strain increased to 0.05 Hz and decreased slightly at 0.1 Hz for the CNT fiber. A similar phenomenon is observed by taking the strain and stress of the CNT fiber against the charge density at negative charging (Figure 4c,d). At a high charge density, the lowest stress and strain are found, while with decreasing charge density, the stress and strain increased to 2.1 kPa stress and 0.022% strain (at −31.4 mC cm−2 charge density). Other MWCNT fiber actuators are reported from MWCNT-PET coiled yarn [54], that had a comparable strain of 0.02%, and with the addition of PPy, the strain increased up to 0.22%. MWCNT yarn is often applied in twisted or coiled designs [55], operated in the electrolyte at −2.5 V, and shows strain up to 0.5% [27].
The tendency of shifting from mixed actuation to main actuation at negative charging is shown in the Figure S4a–d stress profiles from 0.01 Hz to 0.1 Hz. The main reason for such phenomena, as shown in Figure 3d,e, is the kinetic effects of the more hydrophobic and narrow pores of the CNT fiber. At a shorter time (frequency of 0.05 and 0.1 Hz), less egress of anions TFSI takes place, resulting in the formation of EDL at negative charging. In the case of Cell-CNT (Figure 4c,d), the best stress and strain were found at a high negative charge density (low frequency). The strain and stress decreased at a lower charge density (higher frequency).
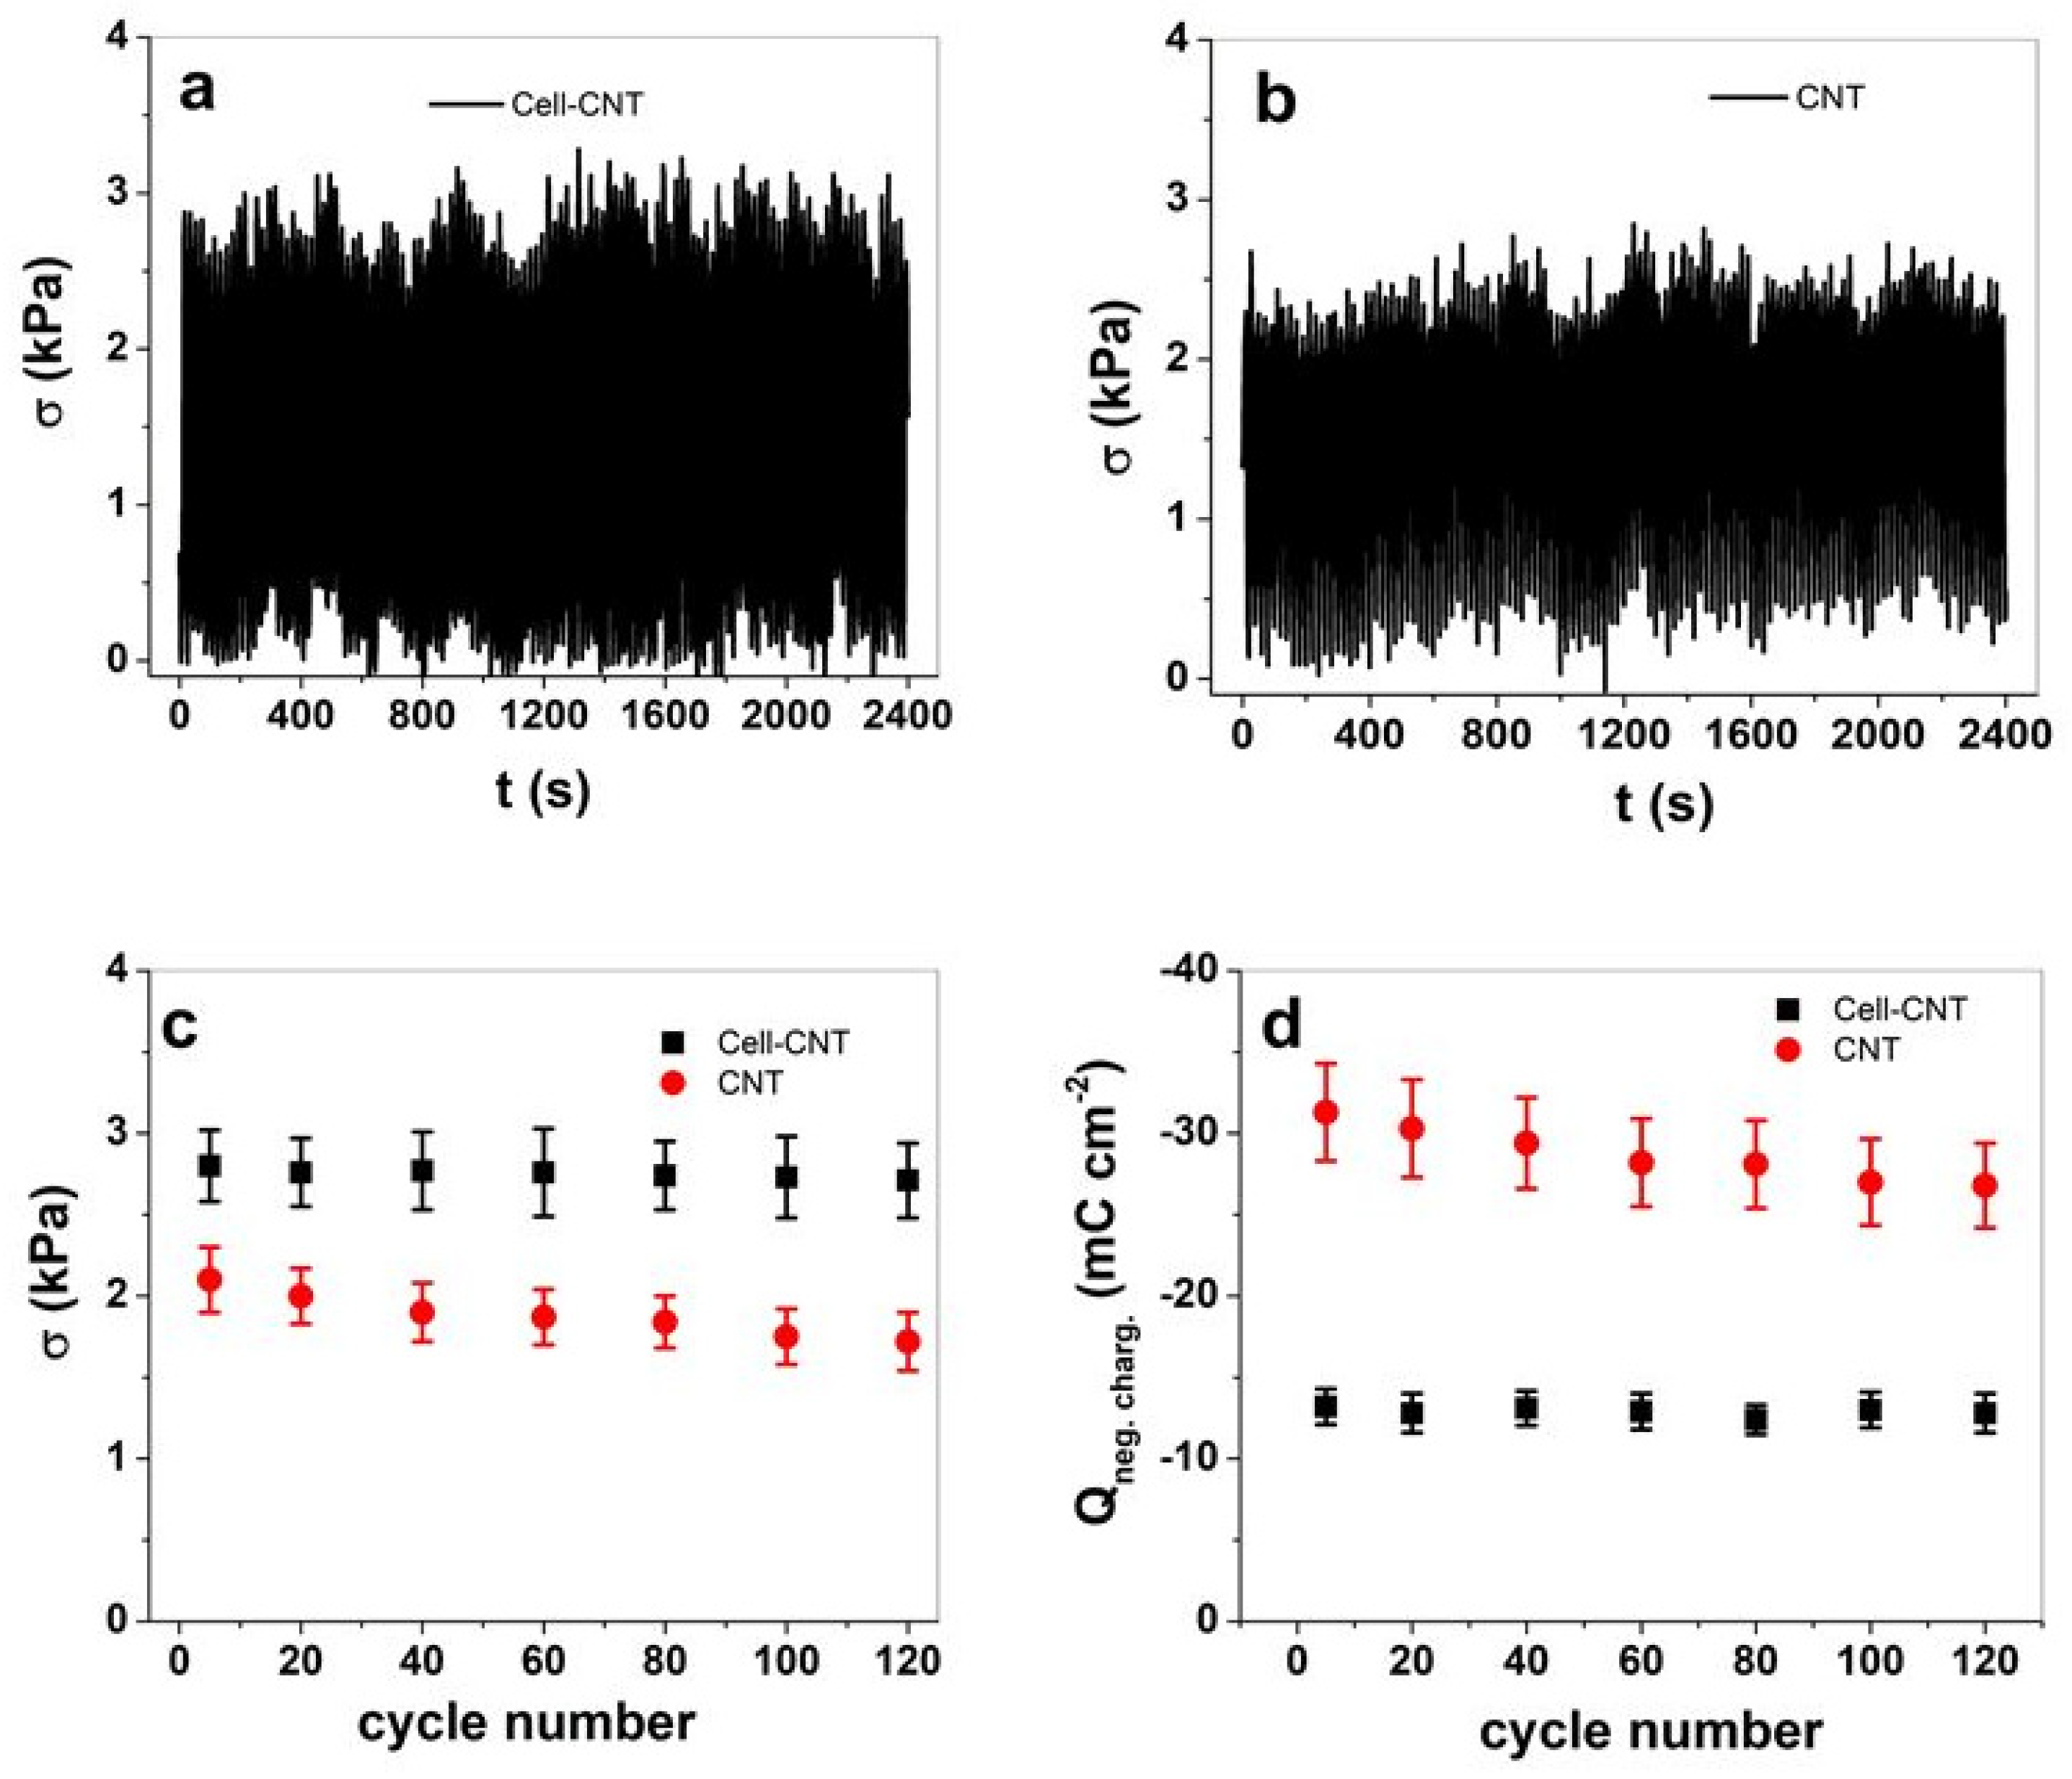
Improvement in strain and stress for the Cell-CNT fiber is still an option by increasing conductivity and decreasing fiber thickness. The general principle from the results revealed that the Cell-CNT fiber exhibits better linear actuation properties than the dielectrophoretic-made CNT fiber. Further analysis in long-term measurements (120 cycles, 0.05 Hz) compared the stress response of both fiber samples, with the results shown in Figure 5.
The stress-time profiles of up to 120 cycles (1200 s), as shown in Figure 5a, revealed a consistent behavior for the Cell-CNT fiber, with stress in the range of 2.8 kPa at cycle 5 and a strain of 0.026% (Figure S5a). Compared with the CNT fiber shown in Figure 5b, a less reconcilable behavior was observed, showing stress fluctuation at cycling (2.1 kPa) with shifting of baseline after 120 cycles at the range of 0.34 kPa, which was identified as a creep. The strain of the CNT fiber was found at 0.022% (Figure S5b), with a small creep appearing after 120 cycles of 0.008% (Figure S5b). The creep phenomenon often occurs in linear or bending actuators in baseline drifts. The creep is not fully explained for conducting polymers being a reason for irreversible charging [56]. The creep on non-faradaic actuators related to CNT materials [22] is assumed to be a sliding effect of the MWCNT chains in the fibers under applied load [57]. In the case of Cell-CNT, where the CNT was embedded in cellulose, the creep did not appear, making such composite material more reliable and sustainable for future actuator applications. Figure 5c revealed the stress values against cycle numbers with a small decrease in the stress of the Cell-CNT fiber to 2.71 kPa after 120 cycles (~−4%), while the CNT fiber decreased to 1.72 kPa (~−18% after 120 cycles). The strain (Figure S5c) revealed a similar tendency of a larger decrease after 120 cycles for the CNT fiber (~−21%) compared to the Cell-CNT fiber with ~−4.2% after 120 cycles. The charge density at negative charging (Figure 5d) of the CNT fiber was nearly 2.4 times higher than that of the Cell-CNT fiber due to a three times higher specific surface area (BET measurements in Figure 1c).
In summary, the Cell-CNT fiber performed much better with higher stress, strain response, and durability in long-term measurements. Therefore, the Cell-CNT composite fiber is the ideal candidate for application in smart textiles and other electromechanical applications devices in sustainable functionality.

3.3. Energy Storage

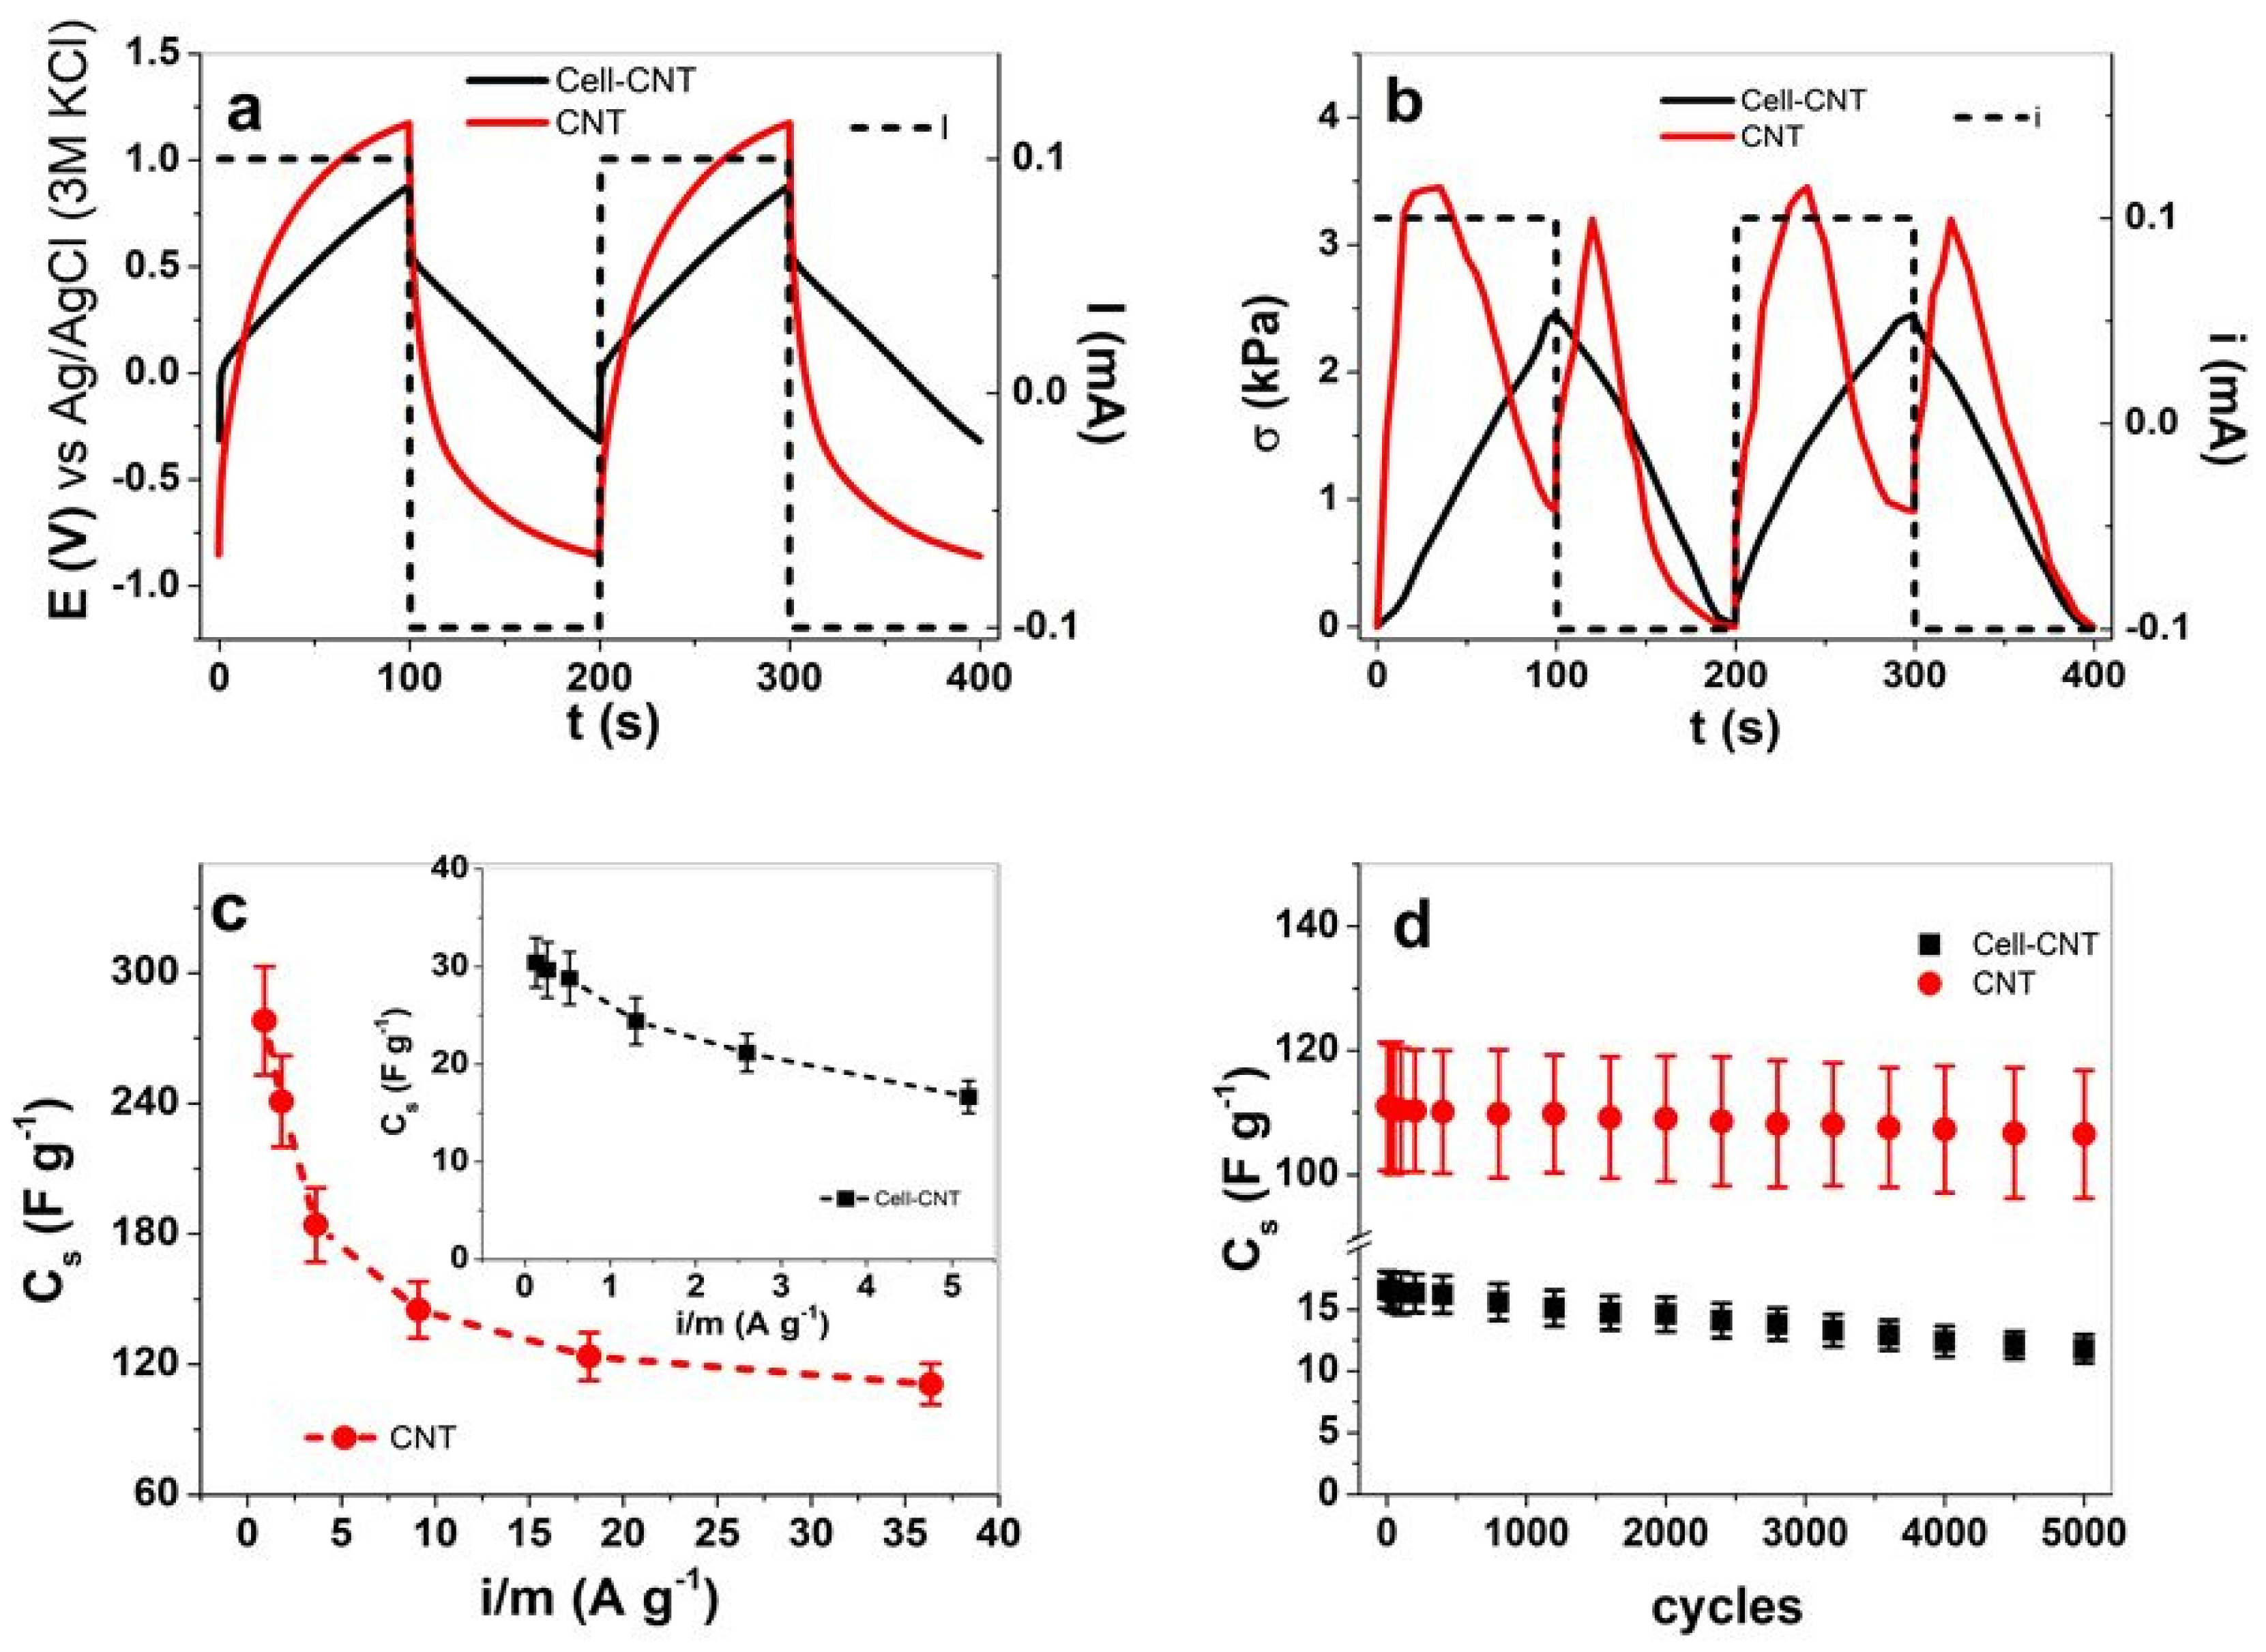
Chronopotentiometric measurements of the Cell-CNT and CNT fibers were performed regarding Equation (1) to determine the specific capacitance. The CNT fiber weight was 52 ± 4 µg, and the Cell-CNT fiber weight (considering MWCNT weight) was 385 ± 32 µg. The current i was varied between ± 0.05 mA and ± 2 mA, resulting in the different weights of the fibers being considered at a constant charge density for the CNT fiber at ± 181.8 C g−1 and for Cell-CNT fiber at 26 C g−1. The potential time curves of the Cell-CNT and CNT fibers at a frequency of 0.005 Hz (current ± 0.1 mA) are shown in Figure 6a, with the corresponding stress curves shown in Figure 6b. The specific capacitance calculated from Equation (1) against the current density i/m of the CNT fiber is shown in Figure 6c, with an inset of the Cell-CNT fiber. The long-term measurements at the current of 2 mA (0.1 Hz) of 5000 cycles presenting the specific capacitance are shown in Figure 6d.
The potential time curves of the Cell-CNT and CNT fibers in Figure 6a show concurrent cycles, revealing at each fiber sample that charging/discharging is in balance. The potential evolution of the Cell-CNT fiber is 0.88 V at positive charging and −0.37 V at negative charging (Figure 6a), while those from the CNT fiber were higher with 1.17 V and −0.86 V. The main reason for such differences is the much higher surface area of the CNT fiber and its smaller pore diameter (Figure 1d), which affects ions’ diffusion and adsorption, resulting in higher potential evolution. In contrast, the pore diameter for the Cell-CNT fiber was larger, with hydrophilic cellulose surrounding the CNT. The differences regarding linear actuation properties are displayed in the stress profile as the same applied current (Figure 6b). The CNT fiber shows mixed actuation properties, with anions and cations moving simultaneously during charging/discharging. The TFSI anions are incorporated in Cell-CNT (the Li+ cations at discharging form the EDL), supposedly affecting the diffusion and adsorption of ions that lower the potentials at charging/discharging. The specific capacitance Cs shown in Figure 6c of the CNT fiber is quite different, with 278 F g−1 at 0.91 A g−1, while the Cell-CNT fiber (inset of Figure 6c) had 30.4 F g−1 (0.13 A g−1). Pristine CNT (MWCNT) with included MnO2 had a specific capacitance of 250.5 F g−1 [58], while the DEP-formed CNT fiber did reveal in former research [20] around 100 F g−1 (0.9 A g−1), and the carbide-derived-carbon particles included had a specific capacitance of 175 F g−1 (0.54 A g−1) [20]. Other combinations of MWCNT and pseudocapacitors (for example, conducting polymers) can reach 300–400 F g−1 [59]. The Cell-CNT fiber is different from the DEP-formed CNT fiber in that is has much lower conductivity and is relatively hydrophilic due to the cellulose surrounding the CNT chains, resulting in nine times lower specific capacitance. The composites of aligned CNT with cellulose paper contained room temperature ionic liquids [45], which revealed gravimetric capacitance in the range of 22 F g−1, while the increased loading (50 wt.%) of aligned CNT in cellulose paper [60] extended the capacitance to 46 F g−1. So far, the best specific capacitance reported has been found for cellulose microfiber carbon composites [6], with a specific capacitance of 200 F g−1. The long-term measurements of the Cell-CNT fiber shown in Figure 6d at the current density of 5.2 A g−1 showed specific capacitance at 16.6 F g−1 (cycle 5), which decreased after 5000 cycles to 11.8 F g−1, related to the capacitance retention of 71%. The CNT fiber (Figure 6d) had a specific capacitance of 111 F g−1 (36.4 A g−1) at cycle 5. It decreased to 106.5 F g−1 after 5000 cycles, with the specific capacitance retention having an excellent value of 96%. Former research [61] investigated CNT on carbon cloth, showing a cell capacitance of 5.8 F g−1 (1 A g−1) with a capacity retention of 93% after 1 million cycles.
The CNT fiber shown in this work is the better candidate for energy storage reaching a high capacitance and promising retention, while the Cell-CNT fiber’s performance as energy storage is rather low.

4. Conclusions

The Cell-CNT fiber made over extrusion and the CNT fiber made over the DEP process are compared in their linear actuation properties (LiTFSI-PC electrolyte) to evaluate which materials have better sustainability in actuation. The main expansion for the Cell-CNT fiber is found at negative charging, and the CNT fiber exhibits mixed actuation with expansion at charging and discharging. With increasing scan rates (or frequency), the CNT fiber showed main expansion at negative charging. The stress (strain) of the Cell-CNT fiber was found at 7.9 kPa (0.062%), while for the CNT fiber, 0.52 kPa (0.01%) was obtained. The long-term measurements (120 cycles) at 0.05 Hz frequency showed a more stable response from the Cell-CNT fiber, with less creep than the CNT fiber, making the Cell-CNT composite fiber more sustainable in actuation performance. The much better charging/discharging values of the CNT fiber (nearly double in comparison to those of the Cell-CNT fiber) are reflected in the superior specific capacitance of the CNT fiber, which is found at 278 F g−1 (0.91 A g−1), while for the Cell-CNT fiber, 30.4 F g−1 (0.13 A g−1) is obtained. BET measurements revealed two times lower pore size distribution and three times higher specific surface area for the CNT fiber. With their excellent capacitance retention of 96% after 5000 cycles, the CNT fibers are superior in energy storage with possible applications in sustainable supercapacitors. The drawbacks of the CNT fiber include its brittleness, which needs to be solved in future developments. The linear actuation properties are shown to be much better in the Cell-CNT fiber, making such material suitable for in-woven smart fabrics. The future direction should focus on sustainable Cell-CNT fiber development, aiming to make thinner fibers and use different formation techniques to achieve better energy storage capabilities.

Supplementary Materials

The following supporting information can be downloaded at: https://www.mdpi.com/article/10.3390/su15129227/s1, Figure S1: Cell-CNT fiber SEM images of cross-section (scale bar 200 µm) in (a), with the magnification of inner core (scale bar 10 µm) with inset of pore diameter obtained from ImageJ shown in (b). The CNT fiber cross-section (scale bar 100 µm) is presented in (c) with the magnification of the fiber surface (scale bar 10 µm) displayed in (d) with an inset of pore diameter. Figure S2: Charge density Q potential E (potential range 0.65 V to −0.6 V) curves in LiTFSI-PC electrolyte at scan rates 5 mV s−1 (black line), 10 mV s−1 (red line), 20 mV s−1 (green line), 50 mV s−1 (blue line) and 100 mV s−1 (orange line) showing in (a): Cell-CNT fiber and (b): CNT fiber. Figure S3: Square wave potential step measurements of Cell-CNT (--■--) and CNT fiber (--●--) showing in (a): stress σ and in (b): strain ε against frequency f (0.0025 Hz–0.1 Hz) at potential range 0.65 V to −0.6 V in LiTFSI-PC electrolyte. Figure S4: Square wave potential step profiles of stress σ against time t (3rd–4th cycle) of CNT fiber in LiTFSI-PC at potential range E (dashed line) of 0.65 V to −0.6 V showing different frequencies in (a): 0.01 Hz, (b): 0.025 Hz, (c): 0.05 Hz and (d): 0.1 Hz. Figure S5: Long-term measurements (120 cycles) in square wave potential steps at 0.05 Hz at a potential range 0.65 V to −0.6 V in LiTFSI-PC electrolyte showing Cell-CNT strain ε time t curves in (a) and CNT in (b). The strain against cycle number of Cell-CNT (■) and CNT fiber () is presented in (c).

Author Contributions

Conceptualization, N.Q.K. and Q.B.L.; Methodology, F.E. and R.K.; Software, Q.B.L.; Validation, Q.B.L.; Formal analysis, N.Q.K., F.E. and R.K.; Investigation, N.Q.K.; Resources, F.E.; Writing—original draft, N.Q.K.; Writing—review & editing, F.E., Q.B.L. and R.K.; Project administration, R.K. All authors have read and agreed to the published version of the manuscript.

Funding

The APC was not funded by any grant only the research.

Institutional Review Board Statement

Not applicable.

Informed Consent Statement

Not applicable.

Data Availability Statement

The data presented in this study are available on request from the corresponding author.

Conflicts of Interest

The authors declare no conflict of interest.

References

  1. Wang, Z.; Lee, Y.H.; Kim, S.W.; Seo, J.Y.; Lee, S.Y.; Nyholm, L. Why Cellulose-Based Electrochemical Energy Storage Devices? Adv. Mater. 2020, 33, 2000892. [Google Scholar] [CrossRef] [PubMed]
  2. Jabbour, L.; Bongiovanni, R.; Chaussy, D.; Gerbaldi, C.; Beneventi, D. Cellulose-Based Li-Ion Batteries: A Review. Cellulose 2013, 20, 1523–1545. [Google Scholar] [CrossRef]
  3. Jung, Y.H.; Chang, T.H.; Zhang, H.; Yao, C.; Zheng, Q.; Yang, V.W.; Mi, H.; Kim, M.; Cho, S.J.; Park, D.W.; et al. High-Performance Green Flexible Electronics Based on Biodegradable Cellulose Nanofibril Paper. Nat. Commun. 2015, 6, 7170. [Google Scholar] [CrossRef] [PubMed] [Green Version]
  4. Ummartyotin, S.; Manuspiya, H. A Critical Review on Cellulose: From Fundamental to an Approach on Sensor Technology. Renew. Sustain. Energy Rev. 2015, 41, 402–412. [Google Scholar] [CrossRef]
  5. Elhi, F.; Puust, L.; Kiefer, R.; Tamm, T. Electrolyte Contribution to the Multifunctional Response of Cellulose Carbon Nanotube Fibers. React. Funct. Polym. 2023, 182, 105480. [Google Scholar] [CrossRef]
  6. Wang, Z.; Tammela, P.; Strømme, M.; Nyholm, L. Cellulose-Based Supercapacitors: Material and Performance Considerations. Adv. Energy Mater. 2017, 7, 1700130. [Google Scholar] [CrossRef]
  7. Anju, V.P.; Manoj, M.; Mohanan, P.; Narayanankutty, S.K. A Comparative Study on Electromagnetic Interference Shielding Effectiveness of Carbon Nanofiber and Nanofibrillated Cellulose Composites. Synth. Met. 2019, 247, 285–297. [Google Scholar] [CrossRef]
  8. Xiong, C.; Yang, Q.; Dang, W.; Zhou, Q.; Jiang, X.; Sun, X.; Wang, Z.; An, M.; Ni, Y. A Multifunctional Paper-Based Supercapacitor with Excellent Temperature Adaptability, Plasticity, Tensile Strength, Self-Healing, and High Thermoelectric Effects. J. Mater. Chem. A 2023, 11, 4769–4779. [Google Scholar] [CrossRef]
  9. Xiong, C.; Zhang, Y.N. Recent Progress on Development of Electrolyte and Aerogel Electrodes Applied in Supercapacitors. J. Power Sources 2023, 560, 232698. [Google Scholar] [CrossRef]
  10. Zhang, H.; Wang, Z.; Zhang, Z.; Wu, J.; Zhang, J.; He, J. Regenerated-Cellulose/Multiwalled-Carbon-Nanotube Composite Fibers with Enhanced Mechanical Properties Prepared with the Ionic Liquid 1-Allyl-3-Methylimidazolium Chloride. Adv. Mater. 2007, 19, 698–704. [Google Scholar] [CrossRef]
  11. Ouyang, W.; Sun, J.; Memon, J.; Wang, C.; Geng, J.; Huang, Y. Scalable Preparation of Three-Dimensional Porous Structures of Reduced Graphene Oxide/Cellulose Composites and Their Application in Supercapacitors. Carbon N. Y. 2013, 62, 501–509. [Google Scholar] [CrossRef]
  12. Raghunathan, S.P.; Narayanan, S.; Poulose, A.C.; Joseph, R. Flexible Regenerated Cellulose/Polypyrrole Composite Films with Enhanced Dielectric Properties. Carbohydr. Polym. 2017, 157, 1024–1032. [Google Scholar] [CrossRef] [PubMed]
  13. Sun, Z.; Qu, K.; You, Y.; Huang, Z.; Liu, S.; Li, J.; Guo, Q.H. Overview of Cellulose-Based Flexible Materials for Supercapacitors. J. Mater. Chem. A 2021, 9, 7278–7300. [Google Scholar] [CrossRef]
  14. Liu, Y.; Wang, Y.; Nie, Y.; Wang, C.; Ji, X.; Zhou, L.; Pan, F.; Zhang, S. Preparation of MWCNTs-Graphene-Cellulose Fiber with Ionic Liquids. ACS Sustain. Chem. Eng. 2019, 7, 20013–20021. [Google Scholar] [CrossRef]
  15. Zhu, S.; Wu, Y.; Chen, Q.; Yu, Z.; Wang, C.; Jin, S.; Ding, Y.; Wu, G. Dissolution of Cellulose with Ionic Liquids and Its Application: A Mini-Review. Green Chem. 2006, 8, 325–327. [Google Scholar] [CrossRef]
  16. Hassan, S.H.; Voon, L.H.; Velayutham, T.S.; Zhai, L.; Kim, H.C.; Kim, J. Review of Cellulose Smart Material: Biomass Conversion Process and Progress on Cellulose-Based Electroactive Paper. J. Renew. Mater. 2018, 6, 1–25. [Google Scholar] [CrossRef]
  17. Xiong, C.; Zhang, Y.; Xu, J.; Dang, W.; Sun, X.; An, M.; Ni, Y.; Mao, J. Kinetics Process for Structure-Engineered Integrated Gradient Porous Paper-Based Supercapacitors with Boosted Electrochemical Performance. Nano Res. 2023, in print. [Google Scholar] [CrossRef]
  18. Alimohammadi, F.; Gashti, M.P.; Shamei, A. A Novel Method for Coating of Carbon Nanotube on Cellulose Fiber Using 1,2,3,4-Butanetetracarboxylic Acid as a Cross-Linking Agent. Prog. Org. Coat. 2012, 74, 470–478. [Google Scholar] [CrossRef]
  19. Huniade, C.; Melling, D.; Vancaeyzeele, C.; Nguyen, G.T.-M.; Vidal, F.; Plesse, C.; Jager, E.W.H.; Bashir, T.; Persson, N.-K. Ionofibers: Ionically Conductive Textile Fibers for Conformal i-Textiles. Adv. Mater. Technol. 2022, 7, 2101692. [Google Scholar] [CrossRef]
  20. Kiefer, R.; Plaado, M.; Harjo, M.; Tamm, T. Tuning the Linear Actuation of Multiwall Carbon Nanotube Fibers with Carbide-Derived Carbon. Synth. Met. 2022, 288, 117099. [Google Scholar] [CrossRef]
  21. Tran, C.D.; Le-Cao, K.; Bui, T.T.; Dau, V.T. Dielectrophoresis Can Control the Density of CNT Membranes as Confirmed by Experiment and Dissipative Particle Simulation. Carbon N. Y. 2019, 155, 279–286. [Google Scholar] [CrossRef]
  22. Plaado, M.; Kaasik, F.; Valner, R.; Lust, E.; Saar, R.; Saal, K.; Peikolainen, A.-L.; Aabloo, A.; Kiefer, R. Electrochemical Actuation of Multiwall Carbon Nanotube Fiber with Embedded Carbide-Derived Carbon Particles. Carbon N. Y. 2015, 94, 911–918. [Google Scholar] [CrossRef]
  23. Tang, J.; Gao, B.; Geng, H.; Velev, O.D.; Qin, L.C.; Zhou, O. Assembly of 1D Nanostructures into Sub-Micrometer Diameter Fibrils with Controlled and Variable Length by Dielectrophoresis. Adv. Mater. 2003, 15, 1352–1355. [Google Scholar] [CrossRef]
  24. Abdulhameed, A.; Halim, M.M.; Halin, I.A. Dielectrophoretic Alignment of Carbon Nanotubes: Theory, Applications, and Future. Nanotechnology 2023, 34, 242001–242039. [Google Scholar] [CrossRef] [PubMed]
  25. Kundu, S.; George, S.J.; Kulkarni, G.U. Electric Field Assisted Assembly of 1D Supramolecular Nanofibres for Enhanced Supercapacitive Performance. J. Mater. Chem. A 2020, 8, 13106–13113. [Google Scholar] [CrossRef]
  26. Kosidlo, U.; Omastova, M.; Micusik, M.; Ciric-Marjanovic, G.; Randriamahazaka, H.; Wallmersperger, T.; Aabloo, A.; Kolaric, I.; Bauernhansl, T. Nanocarbon Based Ionic Actuators-a Review. Smart Mater. Struct. 2013, 22, 104022. [Google Scholar] [CrossRef]
  27. Mirfakhrai, T.; Oh, J.; Kozlov, M.; Fok, E.C.W.; Zhang, M.; Fang, S.; Baughman, R.H.; Madden, J.D.W. Electrochemical Actuation of Carbon Nanotube Yarns. Smart Mater. Struct. 2007, 16, S243–S249. [Google Scholar] [CrossRef]
  28. Kim, P.; Lieberl, C.M. Nanotube Nanotweezers. Science 1999, 286, 2148–2150. [Google Scholar] [CrossRef]
  29. Otero, T.F.; Martinez, J.G.; Asaka, K. Faradaic and Capacitive Components of the CNT Electrochemical Responses. Front. Mater. 2016, 3, 3. [Google Scholar] [CrossRef] [Green Version]
  30. Kiefer, R.; Elhi, F.; Peikolainen, A.-L.; Tamm, T. Wider Potential Windows of Cellulose Multiwall Carbon Nanotube Fibers Leading to Qualitative Multifunctional Changes in an Organic Electrolyte. Polymers 2021, 13, 4439. [Google Scholar] [CrossRef]
  31. Johnston, H.J.; Hutchison, G.R.; Christensen, F.M.; Peters, S.; Hankin, S.; Aschberger, K.; Stone, V. A Critical Review of the Biological Mechanisms Underlying the in Vivo and in Vitro Toxicity of Carbon Nanotubes: The Contribution of Physico-Chemical Characteristics. Nanotoxicology 2010, 4, 207–246. [Google Scholar] [CrossRef] [PubMed]
  32. Elhi, F.; Peikolainen, A.L.; Kiefer, R.; Tamm, T. Cellulose-Multiwall Carbon Nanotube Fiber Actuator Behavior in Aqueous and Organic Electrolyte. Materials 2020, 13, 3213. [Google Scholar] [CrossRef] [PubMed]
  33. Harjo, M.; Tamm, T.; Anbarjafari, G.; Kiefer, R. Hardware and Software Development for Isotonic Strain and Isometric Stress Measurements of Linear Ionic Actuators. Polymers 2019, 11, 1054. [Google Scholar] [CrossRef] [Green Version]
  34. Kaempgen, M.; Chan, C.K.; Ma, J.; Cui, Y.; Gruner, G. Printable Thin Film Supercapacitors Using Single-Walled Carbon Nanotubes. Nano Lett. 2009, 9, 1872–1876. [Google Scholar] [CrossRef] [PubMed]
  35. Schneider, C.; Rasband, W.; Eliceiri, K. NIH Image to ImageJ: 25 Years of Image Analysis. Nat. Methods 2012, 9, 671–675. [Google Scholar] [CrossRef]
  36. Kiefer, R.; Elhi, F.; Peikolainen, A.-L.; Puust, L.; Tamm, T. The Importance of Potential Range Choice on the Electromechanical Response of Cellulose-Carbon Nanotube Fibers. Synth. Met. 2022, 283, 116966. [Google Scholar] [CrossRef]
  37. Liu, Y.; Kumar, S. Polymer/Carbon Nanotube Nano Composite Fibers—A Review. ACS Appl. Mater. Interfaces 2014, 6, 6069–6087. [Google Scholar] [CrossRef]
  38. Plaado, M.; Mononen, R.M.; Lhmus, R.; Kink, I.; Saal, K. Formation of Thick Dielectrophoretic Carbon Nanotube Fibers. Nanotechnology 2011, 22, 305711. [Google Scholar] [CrossRef] [Green Version]
  39. Jyothibasu, J.P.; Wang, R.-H.; Ong, K.; Ong, J.H.L.; Lee, R.-H. Cellulose/Carbon Nanotube/MnO2 Composite Electrodes with High Mass Loadings for Symmetric Supercapacitors. Cellulose 2021, 28, 3549–3567. [Google Scholar] [CrossRef]
  40. Birch, M.E.; Ruda-Eberenz, T.A.; Chai, M.; Andrews, R.; Hatfield, L.R. Properties That Influence the Specific Surface Areas of Carbon Nanotubes and Nanofibers. Ann. Occup. Hyg. 2013, 57, 1148–1166. [Google Scholar] [CrossRef] [Green Version]
  41. Baskaran, D.; Mays, J.W.; Bratcher, M.S. Noncovalent and Nonspecific Molecular Interactions of Polymers with Multiwalled Carbon Nanotubes. Chem. Mater. 2005, 17, 3389–3397. [Google Scholar] [CrossRef] [Green Version]
  42. Zhang, K.; Feldner, A.; Fischer, S. FT Raman Spectroscopic Investigation of Cellulose Acetate. Cellulose 2011, 18, 995–1003. [Google Scholar] [CrossRef]
  43. Agarwal, U.P.; Atalla, R.H. Raman Spectroscopy. In Surface Analysis of Paper; Conners, T.E., Banerjee, S., Eds.; CRC Press: Boca Raton, FL, USA, 1995; pp. 152–181. ISBN 9780429279997. [Google Scholar]
  44. Lucas, M.; Wagner, G.L.; Nishiyama, Y.; Hanson, L.; Samayam, I.P.; Schall, C.A.; Langan, P.; Rector, K.D. Reversible Swelling of the Cell Wall of Poplar Biomass by Ionic Liquid at Room Temperature. Bioresour. Technol. 2011, 102, 4518–4523. [Google Scholar] [CrossRef] [PubMed] [Green Version]
  45. Oh, S.Y.; Yoo, D.; Shin, Y.; Seo, G. FTIR Analysis of Cellulose Treated with Sodium Hydroxide and Carbon Dioxide. Carbohydr. Res. 2005, 340, 417–428. [Google Scholar] [CrossRef] [PubMed]
  46. Van Trinh, P.; Anh, N.N.; Thang, B.H.; Quang, L.D.; Hong, N.T.; Hong, N.M.; Khoi, P.H.; Minh, P.N.; Hong, P.N. Enhanced Thermal Conductivity of Nanofluid-Based Ethylene Glycol Containing Cu Nanoparticles Decorated on a Gr-MWCNT Hybrid Material. RSC Adv. 2017, 7, 318–326. [Google Scholar] [CrossRef] [Green Version]
  47. Bodirlau, R.; Teaca, C.-A.; Spiridon, I. Influence of Ionic Liquid on Hydrolyzed Cellulose Material: FT-IR Spectroscopy and TG-DTG-DSC Analysis. Int. J. Polym. Anal. Charact. 2010, 15, 460–469. [Google Scholar] [CrossRef]
  48. Spiridon, I.; Teacă, C.-A.; Bodîrlău, R. Pretreatment with Ionic Liquids. BioResources 2011, 6, 400–413. [Google Scholar] [CrossRef]
  49. Langkilde, F.W.; Svantesson, A. Identification of Celluloses with Fourier-Transform (FT) Mid-Infrared, FT-Raman and near-Infrared Spectrometry. J. Pharm. Biomed. Anal. 1995, 13, 409–414. [Google Scholar] [CrossRef]
  50. Zondaka, Z.; Valner, R.; Tamm, T.; Aabloo, A.; Kiefer, R. Carbide-Derived Carbon in Polypyrrole Changing the Elastic Modulus with a Huge Impact on Actuation. RSC Adv. 2016, 6, 26380–26385. [Google Scholar] [CrossRef] [Green Version]
  51. Chaudhari, M.I.; Muralidharan, A.; Pratt, L.R.; Rempe, S.B. Assessment of Simple Models for Molecular Simulation of Ethylene Carbonate and Propylene Carbonate as Solvents for Electrolyte Solutions. Top. Curr. Chem. 2018, 376, 7. [Google Scholar] [CrossRef] [Green Version]
  52. Khan, M.S.; Karatrantos, A.V.; Ohba, T.; Cai, Q. The Effect of Different Organic Solvents and Anion Salts on Sodium Ion Storage in Cylindrical Carbon Nanopores. Phys. Chem. Chem. Phys. 2019, 21, 22722–22731. [Google Scholar] [CrossRef] [PubMed]
  53. Lyon, J.L.; Stevenson, K.J. Anomalous Electrochemical Dissolution and Passivation of Iron Growth Catalysts in Carbon Nanotubes. Langmuir 2007, 23, 11311–11318. [Google Scholar] [CrossRef] [PubMed]
  54. Aziz, S.; Martinez, J.G.; Foroughi, J.; Spinks, G.M.; Jager, E.W.H. Artificial Muscles from Hybrid Carbon Nanotube-Polypyrrole-Coated Twisted and Coiled Yarns. Macromol. Mater. Eng. 2020, 305, 2000421. [Google Scholar] [CrossRef]
  55. Foroughi, J.; Spinks, G. Carbon Nanotube and Graphene Fiber Artificial Muscles. Nanoscale Adv. 2019, 1, 4592–4614. [Google Scholar] [CrossRef] [PubMed] [Green Version]
  56. Valero, L.; Martinez, J.G.; Otero, T.F. Creeping and Structural Effects in Faradaic Artificial Muscles. J. Solid State Electrochem. 2015, 19, 2683–2689. [Google Scholar] [CrossRef] [Green Version]
  57. Michardière, A.S.; Mateo-Mateo, C.; Derré, A.; Correa-Duarte, M.A.; Mano, N.; Poulin, P. Carbon Nanotube Microfiber Actuators with Reduced Stress Relaxation. J. Phys. Chem. C 2016, 120, 6851–6858. [Google Scholar] [CrossRef]
  58. Schnorr, J.M.; Swager, T.M. Emerging Applications of Carbon Nanotubes. Chem. Mater. 2011, 23, 646–657. [Google Scholar] [CrossRef] [Green Version]
  59. Gaikwad, N.; Gadekar, P.; Kandasubramanian, B.; Kaka, F. Advanced Polymer-Based Materials and Mesoscale Models to Enhance the Performance of Multifunctional Supercapacitors. J. Energy Storage 2023, 58, 106337. [Google Scholar] [CrossRef]
  60. Pang, Z.; Sun, X.; Wu, X.; Nie, Y.; Liu, Z.; Yue, L. Fabrication and Application of Carbon Nanotubes/Cellulose Composite Paper. Vacuum 2015, 122, 135–142. [Google Scholar] [CrossRef]
  61. Felhősi, I.; Keresztes, Z.; Marek, T.; Pajkossy, T. Properties of Electrochemical Double-Layer Capacitors with Carbon-Nanotubes-on-Carbon-Fiber-Felt Electrodes. Electrochim. Acta 2020, 334, 135548. [Google Scholar] [CrossRef] [Green Version]
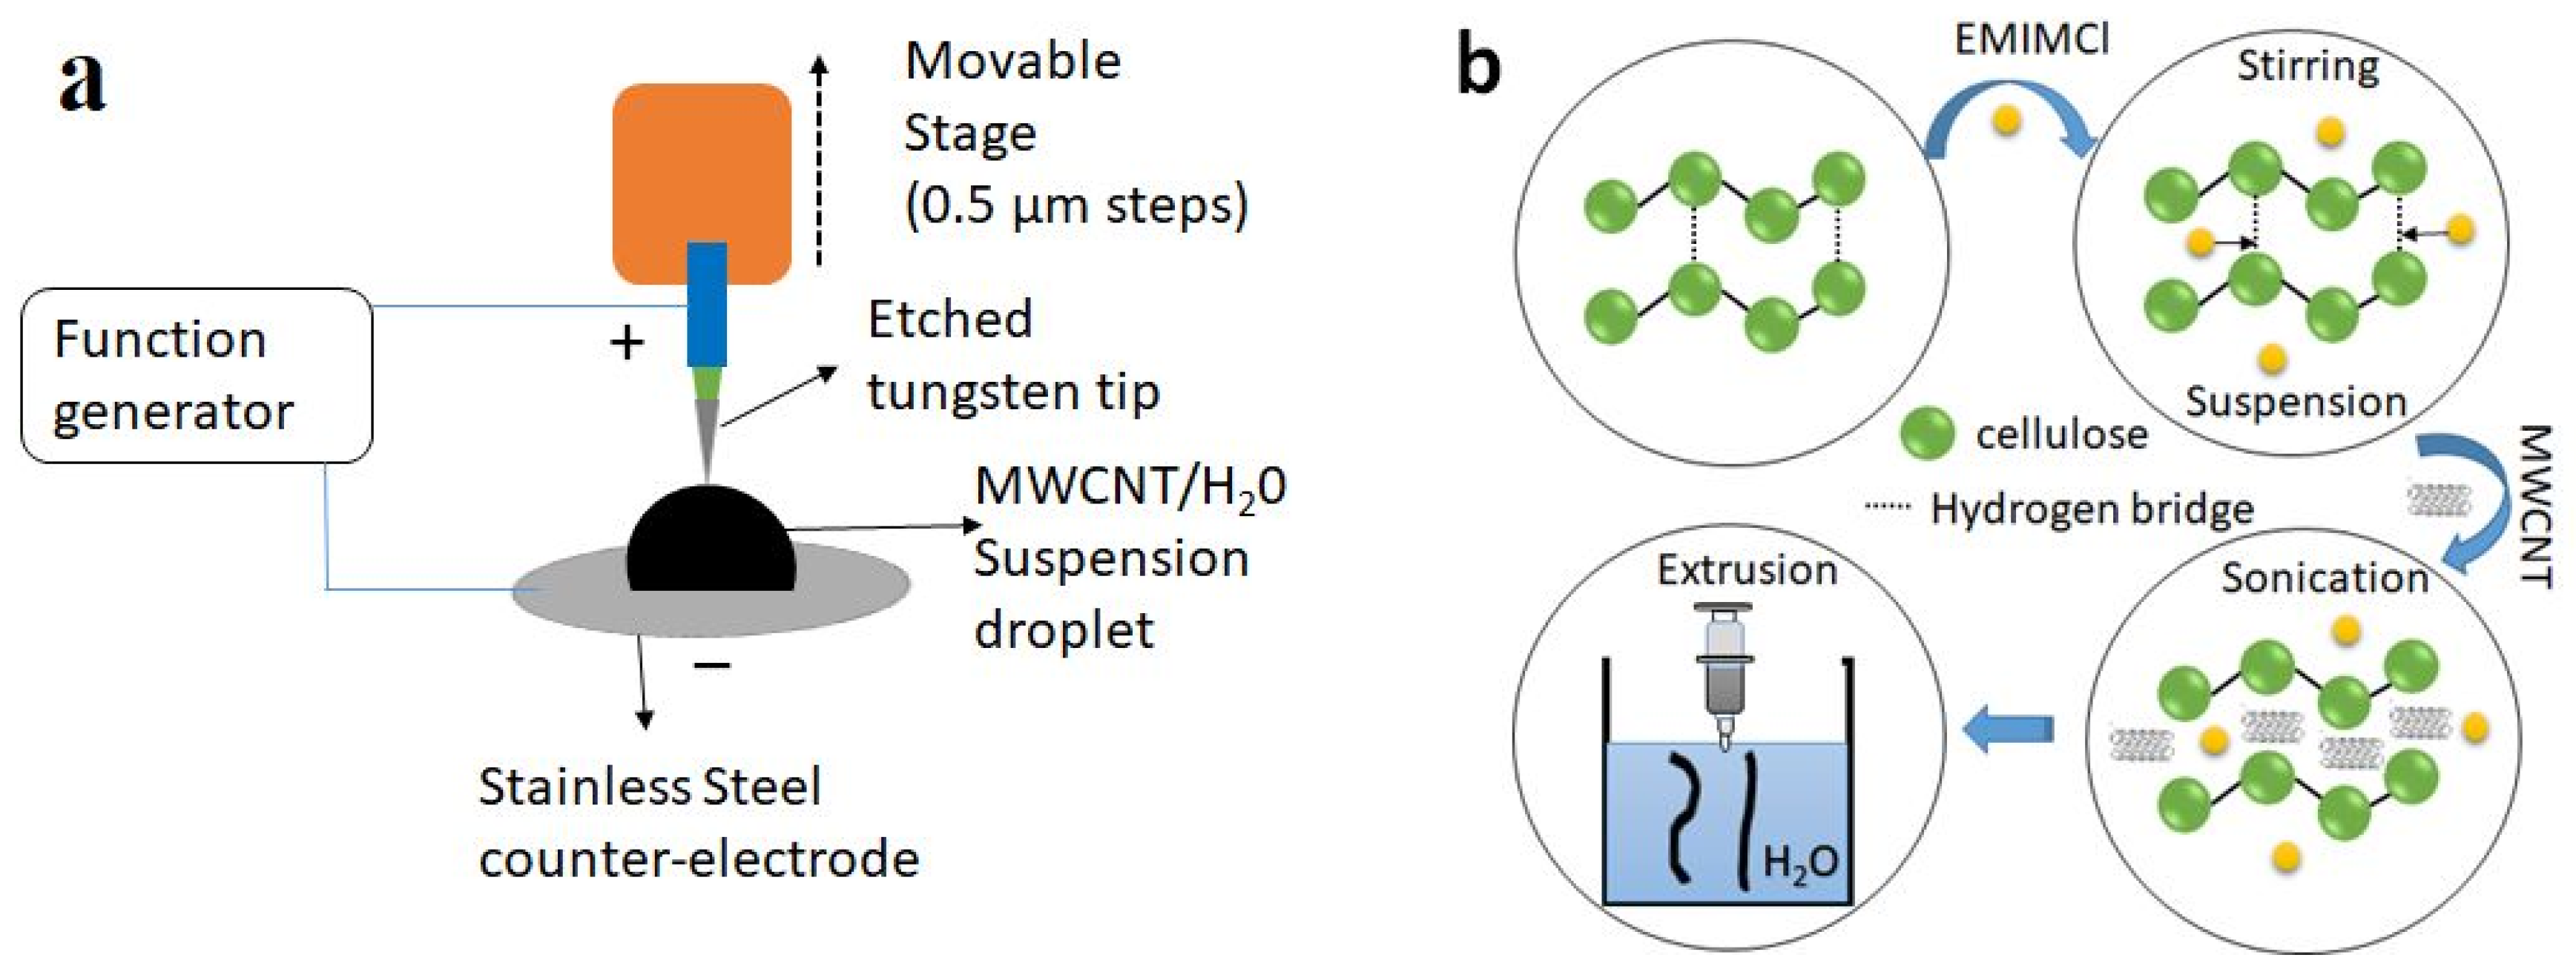
Scheme 1. (a) Formation of MWCNT (CNT) fiber over DEP method and in (b) the Cell-CNT fiber formation over extrusion.
Sustainability 15 09227 sch001
Figure 1. SEM image of fibers showing in (a) Cell-CNT fiber (scale bar 200 µm) and in (b) CNT fiber (scale bar 50 µm). Nitrogen adsorption/desorption isotherms (BET) with inset pore size distribution calculated over BJH methods showing in (c) Cell-CNT fiber and (d) CNT fiber.
Sustainability 15 09227 g001
Figure 2. The Cell-CNT fiber (black line), CNT fiber (red line), and Cell (blue line) are displayed in (a) Raman spectroscopy (514 nm Argon laser, 1200–1800 cm−1) and in (b) FTIR spectroscopy (4000–800 cm−1). EDX spectroscopy of cross-section of fibers at positive charging at 0.65 V (black line) and negative charging at −0.6 V (red line) showing in (c) Cell-CNT fibers and (d) CNT fibers after actuation cycles.
Sustainability 15 09227 g002
Figure 3. Cyclovoltammetric EMD measurements applying different scan rates 5 mV s−1 (black line), 10 mV s−1 (red line), 20 mV s−1 (green line), 50 mV s−1 (blue line), and 100 mV s−1 (orange line) at potential range from 0.65 V to −0.6 V in LiTFSI-PC electrolyte. Cell-CNT fiber results are presented in (a) stress σ, (b) strain ε, in (c) current density j, and the CNT fiber showing in (d) stress, (e) strain, and (f) current density against potential E. From each fiber sample, the 3rd cycle is taken. The stress curves normalized on zero at the lowest points. Stress is the opposite of strain.
Sustainability 15 09227 g003
Figure 4. Square wave potential step measurements of Cell-CNT fibers (black line) and CNT fibers (red line) showing two subsequent cycles (3rd and 4th) at frequency 0.005 Hz of (a) stress σ and (b) strain ε against time t with potential E (dashed line). The stress σ is shown in (c) and the strain ε in (d) against charge density at negative charging Qneg.charg of Cell-CNT (--■) and CNT (--⬤) fibers.
Sustainability 15 09227 g004
Figure 5. Square wave potential steps at 0.05 Hz in long-term measurements in LiTFSI-PC showing in (a) Cell-CNT fiber and (b) CNT fiber of stress σ against time t. The stress σ of Cell-CNT (■) and CNT fiber () is presented in (c) and the charge density Qneg.charg. (negative charging) is shown in (d) against cycle number (120 cycles).
Sustainability 15 09227 g005
Figure 6. Chronopotentiogram of Cell-CNT fiber (black line) and CNT fiber (red line) at current ± 0.1 mA (dashed line) at frequency 0.005 Hz in LiTFSI-PC showing 2 subsequent cycles (3rd–4th) presented in (a) with stress σ time curves shown in (b). The specific capacitance Cs obtained from Equation (1) of CNT fiber (--⬤) with inset of Cell-CNT fiber (--■) against applied current densities i/m are presented in (c) and the retention of the specific capacitance Cs of Cell-CNT (■) and CNT () fibers after 5000 cycles at current 2 mA (frequency 0.1 Hz) are displayed in (d).
Sustainability 15 09227 g006
Table 1. Stiffness k and elastic modulus Y of Cell-CNT and CNT fibers before and after actuation.
Fibersk [mg μm−1]Y [kPa]
BeforeAfterBeforeAfter
Cell-CNT875 ± 42746 ± 31485 ± 28413 ± 26
CNT1 ± 0.14 ± 0.255.5 ± 3.2222 ± 13
Disclaimer/Publisher’s Note: The statements, opinions and data contained in all publications are solely those of the individual author(s) and contributor(s) and not of MDPI and/or the editor(s). MDPI and/or the editor(s) disclaim responsibility for any injury to people or property resulting from any ideas, methods, instructions or products referred to in the content.