Article

Optimization of Energy Allocation Strategies in Spanish Collective Self-Consumption Photovoltaic Systems

by
Ana Ogando-Martínez
1,
Xela García-Santiago
2,
Saúl Díaz García
2,
Fernando Echevarría Camarero
1,
Gonzalo Blázquez Gil
2 and
Pablo Carrasco Ortega
1,*
1
Energy Division, Galicia Institute of Technology (ITG), 15003 A Coruña, Spain
2
ICT Division, Galicia Institute of Technology (ITG), 15003 A Coruña, Spain
*
Author to whom correspondence should be addressed.
Sustainability 2023, 15(12), 9244; https://doi.org/10.3390/su15129244
Submission received: 4 May 2023 / Revised: 29 May 2023 / Accepted: 6 June 2023 / Published: 7 June 2023

Abstract

:
Collective self-consumption (CSC) systems offer a great opportunity to increase the viability of photovoltaic installations by reducing costs and increasing profitability for consumers. In addition, CSC systems increase self-sufficiency (SS) and self-consumption (SC). These systems require a proper energy allocation strategy (EAS) to define the energy distribution within the CSC. However, most EASs do not analyze the individual impact of the rules and mechanisms adopted. Therefore, six different EASs are proposed and evaluated in terms of both collective and individual cost, SC, and SS. The results show that the EASs based on minimizing collective costs are the most beneficial for the community, although they imply an unfair distribution of energy among users. On the other hand, the other EASs proposed stand out for reaching an equilibrium in terms of cost, SS, and SC, although the collective profitability is lower. The best results are achieved considering dynamic coefficients, which are preferred over static ones.

1. Introduction

Aligned with the Paris Agreement, the European Union (EU) has set a target to reduce greenhouse gas emissions to become climate neutral by 2050. To achieve this goal, the energy system needs a deep transformation towards a more sustainable model through strategies such as decentralization, large-scale renewable energy deployment, and electrification. Moreover, a smart and flexible system based on consumer engagement, interconnectivity, storage, and demand response, managed through digitization, will be essential for this transition process [1]. In this context, the EU must accelerate the widespread deployment of renewable energies in electricity generation, industry, buildings, and transportation. The EU needs to address challenges related to establishing sustainable supply chains for solar, wind, and heat pump technologies, as well as promoting the development of electricity storage capacities, hydrogen systems, and biomethane as alternatives to fossil fuels. Lastly, it is crucial to expedite permitting processes and make investments in interconnections and infrastructure [2].
In this transition context, different policies have been developed in the EU to encourage consumer participation in the energy system. The need to place consumers at the core of the energy transition was introduced in the Clean energy for all Europeans [3] package. This requires the development of more permissive regulation that empowers consumers to make their own decisions on how to produce, store, sell, or share their own energy. In addition, it requires the involvement of national transpositions to include legal measures on taxes, fees, and reduction of grid costs to increase profitability [4]. Following this line, Directive (EU) 2018/2001 [5] introduced the definitions of self-consumer of renewable energies and renewable energy community. These are consumers who individually or collectively generate renewable electricity for their own consumption and who can store or sell self-generated renewable electricity. In turn, Directive (EU) 2019/944 [6] introduced the figures of the active customer and the citizen energy community. These figures enable consumers to self-produce and share energy individually or jointly. Moreover, the acceleration of the transposition of this directive has been requested by the European Commission to the Member States through the EU REPowerEU Plan [2]. The aim is to enable consumers to participate in energy markets to produce, self-consume, sell, or share renewable energies. This participation can be individual, through energy communities, or through collective self-consumption (CSC) systems. Finally, it is worth mentioning the EU solar energy strategy, part of the REPowerEU plan, which will contribute to the deployment of solar energy in the countries of the European Union. Within this strategy, the European Solar Rooftops Initiative [7] aims to accelerate the deployment of solar energy on the roofs of buildings, for which the CSC and the energy communities will play an important role.
Real-world studies confirm that CSC brings multiple benefits to consumers, reducing costs and increasing self-consumption (SC) and self-sufficiency (SS) [8,9,10,11,12]. CSC projects involve multiple consumers, one or more generation systems, and even battery storage systems [13]. This is a challenge as achieving optimal CSC results requires a sustainable design [14] and proper energy planning [15]. At an aggregate level, CSC provides economic and energy returns. However, these benefits depend on multiple factors, such as consumption and generation profiles, the SC model, or the electricity tariffs of each user. Thus, it is also important to value the individual impact of participating in the CSC, not just the collective effect. In order for a user to be encouraged to participate in the CSC, there must also be some incentive at the individual level [16]. CSC is often the only feasible solution for prosumers, such as in community buildings with shared roofs where individual photovoltaic installations are not possible. But CSC can also emerge at the neighborhood level, where strategically located prosumers with their own generation systems join their resources to obtain more benefits. It is, therefore, interesting to analyze mechanisms to also make CSC profitable in these cases, where individual SC is also an available option.
In Spain, the Spanish National Energy and Climate Plan [17] establishes the path to convert Spain into a carbon-neutral country by 2050. This plan establishes a target of 42% of renewable energies over final energy and 74% of renewables in electricity generation by 2030. In the period 2020 to 2030, an increase of 62.3 GW in the installed capacity of electrical energy with renewables is expected, with a photovoltaic contribution of 30.1 GW, reaching 39.2 accumulated GW. In turn, the Spanish Self-consumption Roadmap [18] sets the goal of reaching 8.8 GW of photovoltaic power in 2030, which constitutes 22.4% of the total for this technology. As can be seen, the deployment of photovoltaic solar technology, and the contribution of self-consumption, will be key to achieving the ambitious decarbonization goals.
While in other European countries, such as France, Germany, the Netherlands, or the United Kingdom, the regulatory frameworks already encouraged shared self-consumption, 2018 marked a turning point in Spanish regulations [19]. The specific case of SC with photovoltaic energy experienced a major boost after the publication in 2018 of Royal Decree-Law 15/2018 [20]. This entailed the suppression of charges related to SC and the possibility of sharing SC by one or several consumers to take advantage of scale economies. Subsequently, Royal Decree 244/2019 [21] introduced the requirements for consumers for the collective use of energy. This regulation allows consumers to participate in CSC when they belong to a group of multiple consumers who, by mutual agreement, receive electricity from nearby generation facilities associated with their consumption sites. That is, CSC consists of one or several electricity generation installations and multiple consumers who are associated with them. Furthermore, it allows for the inclusion of blocks within the same building, as well as nearby buildings, regardless of their use (residential, commercial, industrial, etc.). This regulation also established the method of energy distribution for billing purposes within the CSC, allowing only the use of fixed allocation keys. This implies the distribution of a fixed proportion of the energy to each participant for all the hours of a billing period. In 2021, the publication of Order TED/1247/2021 [22] introduced the possibility of using hourly dynamic allocation keys, optimizing the way of distributing the energy generated to each of the self-consumers who share a generation facility. Recently, through the publication of Royal Decree-Law 18/2022 [23] and Royal Decree-Law 20/2022 [24], the maximum distance for CSC has been increased from 500 m to 2000 m. This represents a great opportunity for the increase of CSC among industrial, residential, and tertiary consumers.
As can be seen, CSC installations offer a great opportunity to increase the viability of photovoltaic installations. Through this mechanism, different consumers will be able to share ownership of a photovoltaic installation and distribute the generation of electricity. In many cases, the reference situation will be characterized by the use of fixed allocation keys with a value equal to each owner’s percentage of ownership. Thus, for each hour of the year, the generated energy will be allocated to each consumer proportionally to their ownership percentage. In this context, there is a need to investigate how to distribute resources satisfactorily for all participants of the CSC in order to improve the economic outcome in relation to the reference situation and, thus, optimize the profitability of the photovoltaic system.
The methods that can be found in the literature for modeling the distribution of energy and costs within the community are diverse. Many authors rely on optimization methods [25,26,27,28] and load scheduling, but simulation models [29] also have a presence in recent studies. Moreover, the dynamic allocation keys introduced under the new regulation open up a range of possibilities for a more efficient energy allocation. Several authors have conducted studies to analyze the effects on consumers of this type of allocation keys, especially in relation to static allocation [29,30,31,32,33]. The study conducted by Manso-Burgos [30] analyzes the impact of changes in Spanish regulation on self-consumption, concluding that the use of dynamic coefficients and tariffs with discriminatory pricing are very positive measures. Plaza et al. [31] introduce a blockchain-based solution to manage energy exchanges within the community using dynamic coefficients. Pedrero et al. [32] evaluate the profitability of shared SC in an industrial park, showing that dynamic allocation keys increase profitability. In addition, the use of dynamic allocation coefficients increases local electricity consumption, thereby promoting more efficient use of energy [29]. Dynamic allocation keys are also the gateway to more complex business models that encourage the development of energy communities and CSC, as evidenced in the study by Rocha et al. [33].
However, the studies mentioned above are focused on optimizing the allocation keys to obtain the maximum benefit for the CSC system as a whole, without taking into account the individual impact on the bill of each user in relation to a reference situation, where each participant acts as a hypothetical individual self-consumer, without sharing energy with the rest of the participants in the CSC system. Furthermore, these studies do not discuss the rules or mechanisms governing the sharing of energy within the CSC network taking into account specific tariffs and prices of each user. The distribution of renewable energy surpluses can be based on different criteria, such as electricity price or consumption of each participant, among others, which can affect each consumer in a different way.
This study evaluates various strategies for selecting energy allocation keys in shared ownership CSC photovoltaic systems. The study focuses on a use case that combines residential and commercial consumers with diverse consumption profiles, tariffs, and electricity prices. The first step involves calculating the reference baseline case for each consumer and the entire system, based on static allocation keys equal to each participant’s ownership percentage. The next step compares the impact of different energy allocation strategies (EASs) on each consumer’s bill with respect to the reference situation. The objective is to improve the reference situation for all consumers to obtain their acceptance for implementation. The evaluation includes both static and dynamic allocation keys, aiming to maximize the individual and collective benefit of all consumers. Additionally, the study assesses the impact on SS and SC for each consumer and the system as a whole.
The research’s primary contribution lies in evaluating the impact of various EASs on the electricity bills of CSC system owners, compared to the reference case within the Spanish regulatory framework. The study demonstrates that global optimization strategies, which minimize the total cost for system owners, may lead to a negative economic outcome for certain consumers. Thus, alternative local optimization strategies need to be assessed, which, while not providing the best overall result, can enhance the billing impact for all consumers compared to the reference case. Although the case study focuses on a rooftop CSC system, the proposed approach is applicable to any type of photovoltaic installation.

2. Materials and Methods

This section describes the six different EASs employed to calculate the set of allocation coefficients used to distribute the photovoltaic energy production among the CSC users. As described below, some of them consider only the exchanges with the grid, while others also take into account internal exchanges between the members of the CSC.
The reference strategy (EAS0) defined static coefficients for each user considering their percentage of ownership over the photovoltaic facility. These static coefficients (Cn) took the same value for each hour of the year, and their sum must add up to one. The hourly allocation energy for each user (PVn,h) was calculated as:
P V n ,   h = C n · P V h  
where PVh is the energy produced for the photovoltaic facility in each hour.
Then, the hourly excess of deficit of energy for each user (En,h) was calculated comparing the allocation energy with their hourly demand (Ecn,h) as:
E n ,   h = E c   n , h P V n , h  
Therefore, the electricity bought to the grid (Egrid n,h) was positive and corresponded with the maximum between zero and En,h, while the excess energy (Eexc n,h) was negative and was evaluated as the minimum between zero and En,h:
E g r i d   n ,   h = max ( 0 ,   E n , h )
E e x c   n ,   h = min ( 0 ,   E n , h )
Thus, the total energy balance (Equation (5)) was fulfilled for each hour of the year.
P V h + N E g r i d   n , h + N E e x c   n , h = N E c   n , h  
The monthly energy cost for each user (Cost m,N) was calculated following the equation:
C o s t   m ,   N = h E g r i d   n , h · P g r i d   n , h E e x c   n , h · P e x c   n , h  
where Pgrid n,h and Pexc n,h are the hourly prices of buying and selling energy to the grid for each user, respectively. If this monthly cost is lower than zero, a value of zero is considered (according to Royal Decree 244/2019 [21]).
The total cost for each user (Costn) was then evaluated as the sum of each month and the total cost for the CSC (Cost) as the sum of the cost of all users:
C o s t n = m C o s t m , n  
C o s t = N C o s t   n  
In the following strategies, EAS1 and EAS2, the set of allocation coefficients were optimized to reduce the total cost of the CSC)). A scheme for these strategies is shown in Figure 1. In both cases, the deficit and excess energy were bought or sold to the grid, respectively, without considering internal sharing between CSC members. The EAS1 strategy established that the set of coefficients was optimized every 4 months (according to Order TED/1247/2021 [22]), and fixed for each user during these 4 months. Therefore, 3 different sets of allocation keys were calculated for a year.
For each four-month period, the problem was formulated as:
min C C o s t = N h E g r i d   n , h · P g r i d   n , h E e x c   n , h · P e x c   n , h      
Restricted   to :   N C n = 1 ,   n = 1 ,   ,   N
C o s t j , n 0 ,   for   j = 1 ,   ,   m ;   n = 1 ,   ,   N
being Egrid n,h and Eexc n,h calculated according to Equations (1)–(5). m is the month and goes in this case from 1 to 4, and N the number of users of the CSC. The decision variables (Cn  C ) were the allocation keys for each user. The sequential least squares optimization method in Python was utilized for this optimization (package scipy.optimize).
On the other hand, EAS2 strategy considered variable coefficients, which took different values for each hour of the year (according to Order TED/1247/2021 [22]). The formulation of the problem was similar to the EAS1, although the decision variables (Cn,h  C ) and the restriction defined in Equation (10) were evaluated and applied for each hour of the year, respectively.
This second optimization was calculated monthly due to restriction (11). This formulation is equivalent to applying a series of rules for the distribution of energy. For each hour, the users were classified in descending order in function of their prices of buying and selling energy to the grid. Thus, the electricity was allocated to the user or users with the highest price. When their demand for energy was covered, the electricity was assigned to the user with the second higher price, and so on. Among users with the same price, the energy was allocated taking into account their percentage of ownership over the photovoltaic facility. If the next price was the price for selling a surplus of energy, the rest of the energy was allocated to this user or users as long as their monthly cost was still positive.
The EAS2 was calculated following these rules since the number of decision variables to solve the optimization problem was enormous (number of users × hours per day × days per month).
EAS3, EAS4, and EAS5 constituted another group of strategies with similar characteristics. The scheme for these strategies is presented in Figure 2. In these cases, the same static coefficients as in EAS0 were considered to allocate the energy among users, although the excess energy was first exchanged with other members of the CSC. That is, internal exchange was considered. When the demand of the consumers was completely covered, the surplus of each user was sold to the grid.
The differences between the three mechanisms are in the surplus allocation criteria. In the first case, EAS3, equal distribution was considered. This means that if there were several consumers with surpluses, they were shared equally. And if there were several members of the CSC who demanded energy, the excess energy was distributed in the same amount to each one.
The allocation criteria in EAS4 were defined as proportional. If there were several consumers with surpluses, they were shared proportionally to the excess energy of each one; and if there were several consumers who demanded energy, it was distributed proportionally to the energy demanded.
Finally, EAS5 looked for the maximum profit. Among consumers with surpluses, the cheapest was distributed first, and between energy consumers, the most expensive energy was allocated first.
In these strategies, the exchange price (Pexc ni, nj, h) among user ni and user nj for hour h was calculated as the average between the energy purchase price from the grid of the demanded user and the energy selling price to the grid of the selling member in that hour:
P e x c   n i ,   n j ,   h =   P g r i d   n i , h + P e x c   n j , h 2  
This exchange was carried out as long as this averaged price improved the grid price for both the purchasing consumer (ni) and the selling consumer (nj). When calculating the monthly costs for each user, the cost derived from exchanges with the grid had to be non-negative. The cost of internal exchanges was not included in this restriction.
These different strategies were evaluated and compared in terms of both individual cost for each user and total CSC cost. Table 1 shows a summary of the main characteristics of each strategy. Moreover, SC and SS were also considered in the analysis. The SC ratio was defined as the amount of energy consumed from the allocated renewable energy (Equation (13)), while the SS ratio was the part of the energy demand covered by the allocated photovoltaic energy production (Equation (14)).
S C = h min E P V , h · C N , h ,   E c o n s N , h h E P V , h · C N , h
S S = h min E P V , h · C N , h ,   E c o n s N , h h E c o n s N , h

3. Case Study

The allocation mechanisms developed and described in this paper are validated in a CSC system located in the north of Galicia, Spain. Thus, the methods can be compared, and the results can be analyzed. Based on the actual consumption data of 16 users, a hypothetical CSC system has been set up. This CSC comprises 11 residential consumers and five commercial consumers. The objective is to emulate a residential building with commercial stores on the ground floor and a generation system on the roof, which is a typical scenario in Spain but fairly complex due to the diversity of users’ electricity consumption and prices.
The CSC system includes a shared 100 kW photovoltaic facility installed on the roof of the building and property of all users. It is considered that each user has made an investment in the photovoltaic system proportional to their consumption. Table 2 shows the ownership percentages of each user. This parameter is used to set the generated energy that is allocated to each user in the reference scenario. Table 2 also shows an estimate of the energy generated annually by the photovoltaic system.
Electricity prices have been set based on the tariff and prices of each user. It should be noted that the tariff for residential consumers is the 2.0TD, segmented into three periods as indicated in Circular 3/2020 [34]. Therefore, the price of electricity varies depending on the time of day and the day of the week. However, commercial consumers are subject to the 3.0TD tariff, whereby electricity can be charged according to six different periods depending on the time of day, day of the week, and month of the year. Table 3 shows the electricity prices related to each period and consumer, as well as the price for surplus energy injected into the grid. The price of surplus energy has been set based on offers from different electricity provider companies. A price of 0.10 EUR/kWh was adopted for residential consumers and 0.15 EUR/kWh for commercial consumers.

4. Results and Discussion

The main findings of this research are presented and discussed in this section. Considering a CSC system that includes a shared photovoltaic generation facility, six different EASs are analyzed. These strategies are evaluated in terms of both collective and individual economic profitability. In addition, parameters related to the consumption and distribution of the photovoltaic energy produced within the CSC system are also studied.

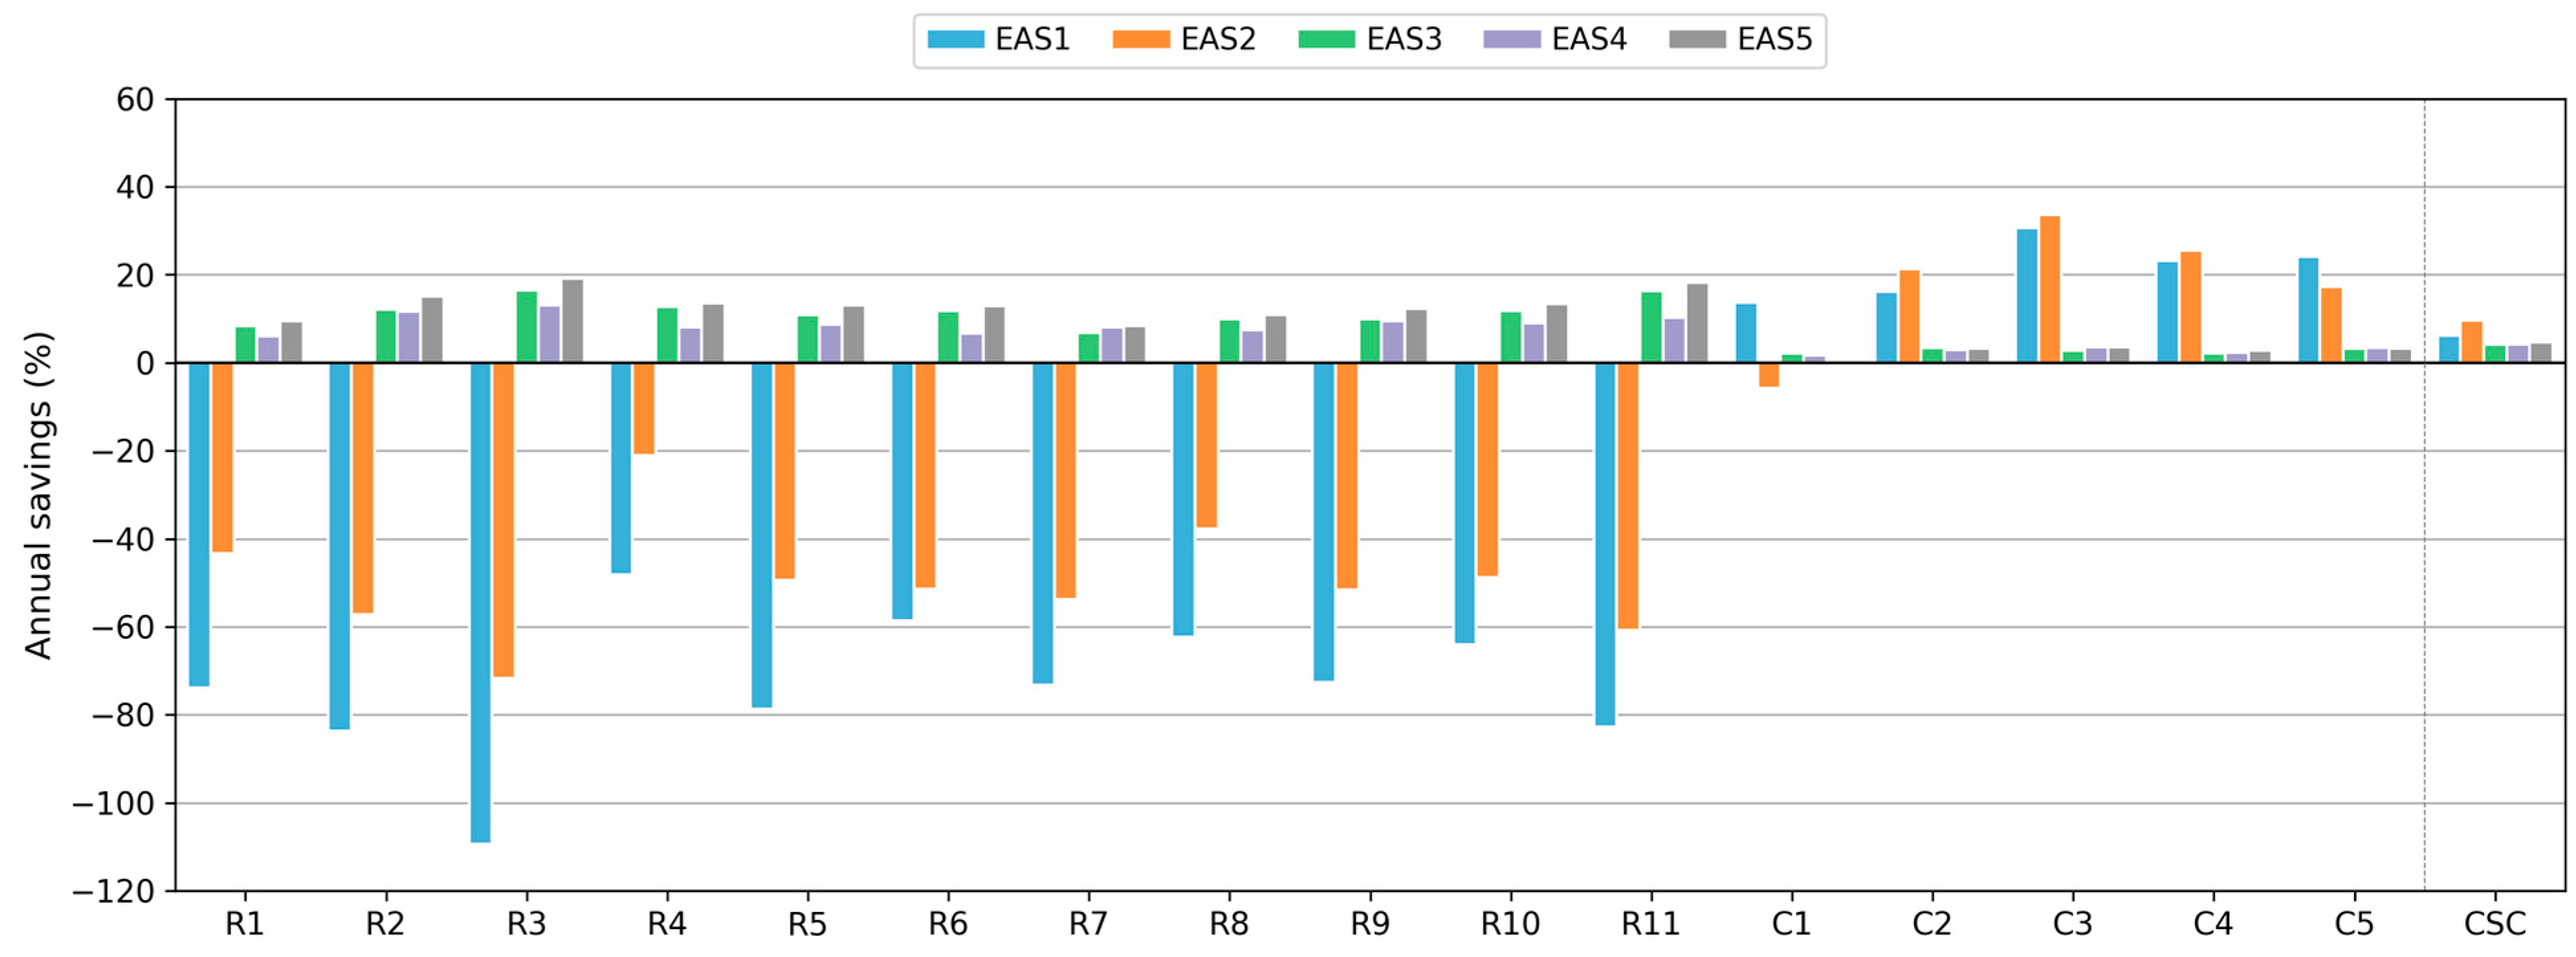
4.1. Economic Profitability

Regarding the reference allocation strategy (EAS0), the implementation of the alternative strategies developed and presented in this study can lead to a reduction in the costs related to energy consumption in the CSC. The annual costs associated with each strategy and their distribution among CSC members are detailed in Figure 3. This figure shows that the scenario with higher costs for the CSC community is the reference scenario. This is because the allocation mechanism used does not involve the use of optimization tools and is based just on the distribution of energy according to the financial contributions of the users. On the contrary, the lowest cost is provided by EAS2, showing that dynamic coefficients are a very useful instrument to optimize the distribution of energy within the CSC community. The next in cost is EAS1. Both strategies are the most beneficial because the objective function of the optimization is to minimize the collective cost of the CSC community without taking into account the individual savings of the users. The individual strategies (EAS3, EAS4, and EAS5) result in very similar costs to each other but lower than the reference scenario, so their implementation also results in significant savings.
The distribution of costs among consumers within the community shows that commercial users account for more than 60% of the cost due to their higher consumption. Figure 3 also reveals that the costs associated with commercial users are reduced by strategies that optimize collective costs. Therefore, in this case study, this type of strategy favors consumers with these characteristics.
Analyzing the economic savings from implementing these alternative strategies compared to the reference scenario is also interesting. This is detailed in Table 4, where the most profitable strategy for each user and for the community is highlighted in bold.
Figure 4 graphically illustrates the annual savings for each user and clearly reveals that the most profitable strategies at the collective level do not always benefit all users. EAS1 and EAS2 result in significant savings for commercial users but at the expense of increased costs for residential users. Therefore, although they are economically the most profitable, they imply an unfair distribution of energy among users, so that not all of them benefit from the change. In contrast, EAS3, EAS4, and EAS5 provide savings to all users in the CSC community. It is also true that the cost reductions achieved by commercial users under these strategies are less significant than those achieved in the residential sector. Among the three strategies that involve an internal exchange of energy within the community, the most economically beneficial is EAS5.

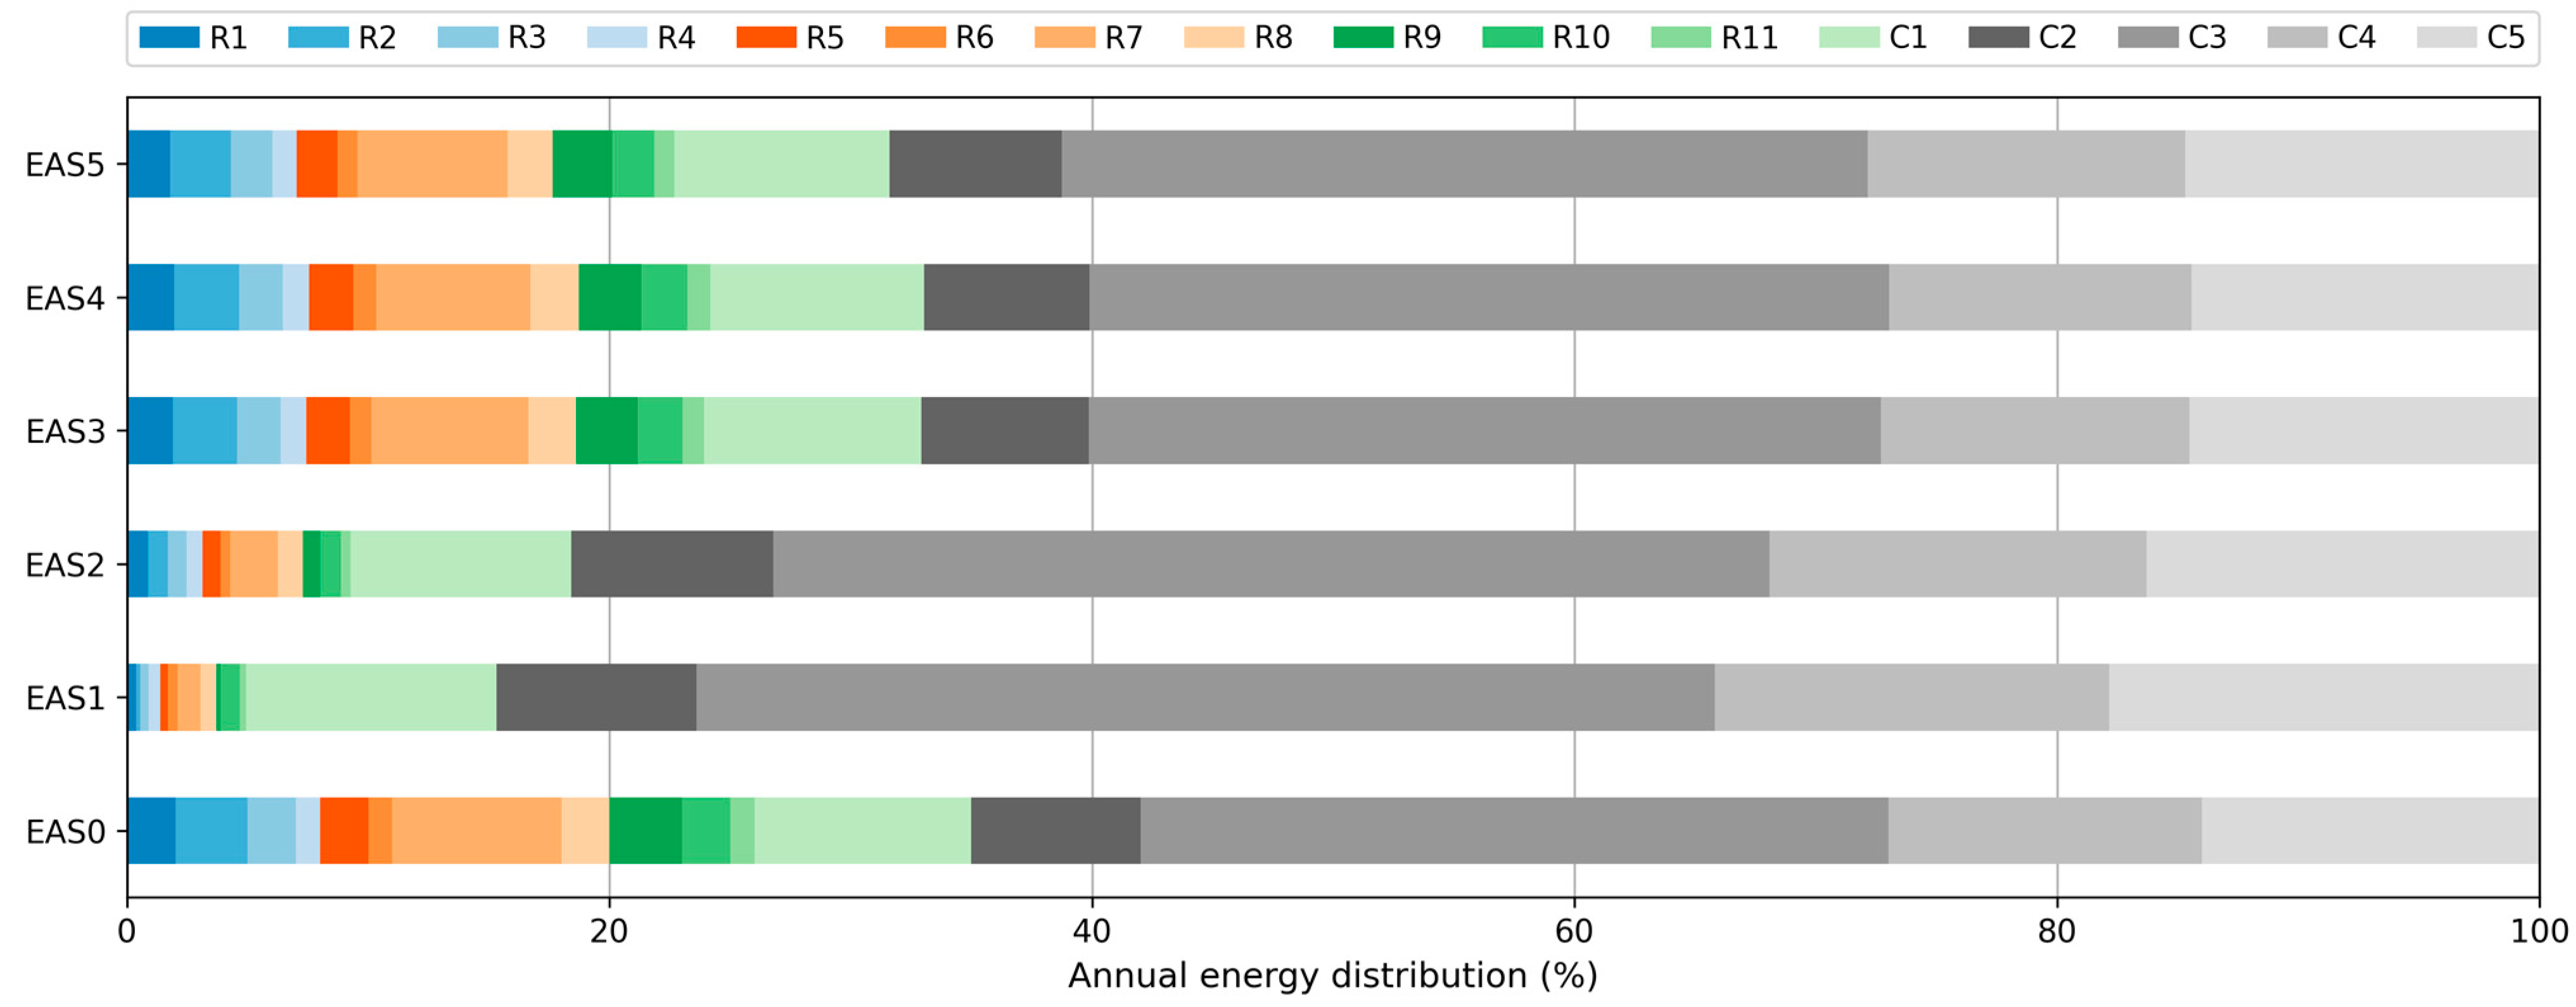
4.2. Energy Distribution

The energy cost distribution presented and discussed above is closely related to the distribution of the energy produced by the photovoltaic system among the users of the CSC community. Figure 5 represents the annual distribution of energy derived from the distribution coefficients calculated under each strategy. Collective optimization strategies (EAS1 and EAS2) allocate more generated energy to commercial users. This is because these kinds of users pay a higher price for energy from the grid and obtain higher compensation for surplus energy than the residential users in this case study, and also because they have a more similar consumption profile to the photovoltaic generation profile. Therefore, allocating a greater amount of energy to this group of users means an increase in savings for the CSC community as a whole. In EAS1, more than 95% of the production is allocated to commercial users, while in EAS2 it is around 90%, and in the other strategies it is less than 80%. With a share of about 26%, EAS0 allocates the largest amount of energy to residential users.

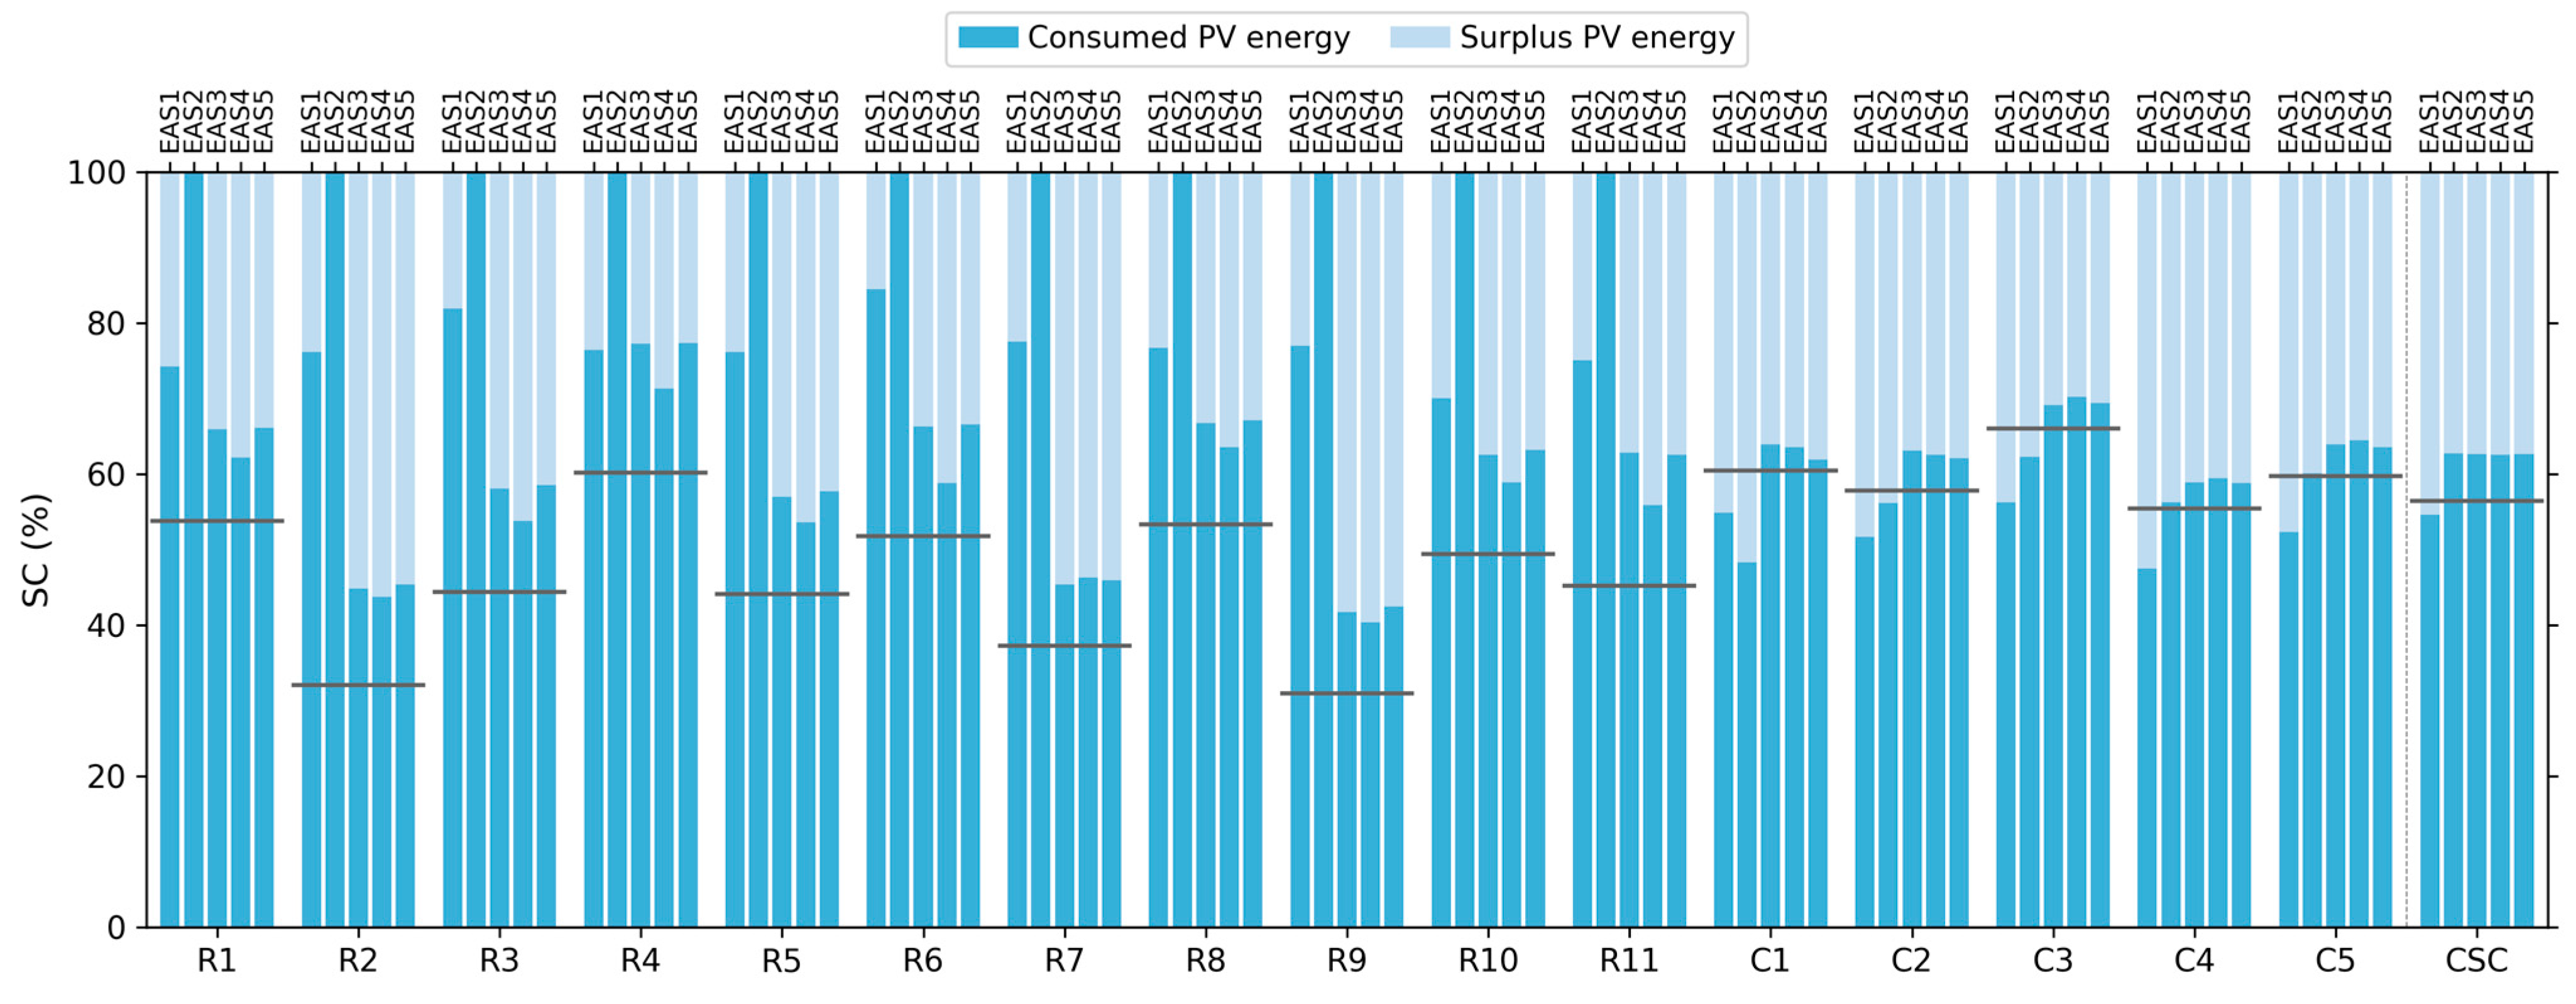
4.3. Self-Consumption

The SC ratio can be a very interesting source of information about the use of renewable energy produced in the community. This parameter represents the amount of energy that each user consumes from the allocated renewable energy. The remainder is surplus energy that users supply to the grid in exchange for financial compensation. Figure 6 shows the share of energy consumed and injected into the grid by each user. EAS2 stands out in this analysis. The use of dynamic allocation coefficients to minimize the total cost to the community allows photovoltaic energy to be allocated to the users who demand it at that moment. This prioritizes SC and benefits users with a consumption profile similar to the generation profile. For residential users, the SC ratio under this strategy is close to 100% due to a lower energy allocation than with the other strategies. For commercial users, this value decreases but is still higher than 45%. EAS1 also provides a high SC ratio, but lower than EAS2. The reduction in SC is due to the use of static allocation coefficients, which limit the optimization potential, even when only the collective cost is evaluated. The reference strategy is the worst from an SC point of view. This is a logical consequence of the fact that the allocation mechanism does not take into account the consumption profile of the users. EAS3, EAS4, and EAS5 provide similar SC rates, lower than the collective optimization scenarios for residential users but higher than the reference strategy. Compared to collective strategies, the SC is reduced because more energy share is allocated to residential users. However, at the CSC scale, EAS3, EAS4, and EAS5 are similar to EAS2 in terms of SC since those are the best strategies for the commercial sector, where most photovoltaic energy is distributed.

4.4. Self-Sufficiency

The SS ratio also provides valuable information about the distribution of energy in the CSC community. This parameter represents the share of consumption that is covered by the renewable energy produced. The additional energy comes from the grid. Figure 7 details the amount and source of energy used annually to satisfy the consumption of CSC users. As a result of the reduced allocation of energy to some consumers, the SS ratio in EAS1 and EAS2 is very low. It is less than 25% for residential users with EAS1 and less than 40% with EAS2. For both strategies, SS is increased for commercial sector users due to the higher allocation of produced energy. In turn, the individual optimization strategies (EAS3, EAS4, and EAS5) provide the highest share of SS for the residential sector, due to the higher allocation of energy to this type of consumer, while achieving similar results for the commercial sector. Thus, these strategies stand out for providing a more balanced SS ratio for all CSC users. In addition, EAS2, EAS3, EAS4, and EAS5 are the best strategies in terms of SS at the community scale.

4.5. Internal Energy Exchanges

The use of EAS3, EAS4, and EAS5 improves SS and SC through the internal exchange of energy between users within the CSC system. Figure 8 shows the amount of energy exchanged annually by each user. Negative amounts represent allocated energy that the user does not consume and, instead of injecting it into the grid as surplus energy, it is transferred to other users in exchange for financial compensation. Figure 8 also reveals that residential users give up a significant amount of energy to commercial users, probably because the consumption profile of commercial users is more similar to the generation profile, as well as because their consumption is higher.
The effect of using different criteria for internal energy allocation is also shown in Figure 8. EAS3 benefits users with lower consumption by allocating them a greater amount of energy in this internal energy market. However, with EAS5, there is a greater flow of energy from lower-consumption users to higher-consumption users. EAS4 produces an intermediate situation since the energy distribution is proportional to energy consumption. It can be seen that under this strategy, commercial users give up more energy than under the other two strategies.
Users benefit from sharing energy with other consumers since they obtain greater benefits than with their energy supplier companies. The distribution of energy costs on the annual bill for strategies EAS3, EAS4, and EAS5 is shown in Figure 9. The cost is disaggregated between the internal exchanges and the network. Negative flows represent economic benefits. Some users have benefited from the internal exchanges, while others incur costs. However, considering that purchasing energy within the CSC network is less expensive than from the grid in all instances, it results in a reduction of the annual bill.

4.6. Sensitivity Analysis

A sensitivity analysis was carried out to evaluate the effect of the different parameters on the optimal solution, analyzing the annual savings for each CSC user and the CSC as a whole. The different cases considered are shown in Table 5.

4.6.1. Cases 1 and 2

These cases imply a variation of 20% in the prices of buying and selling electricity for all users. The results for the annual savings are shown in Figure 10 and indicate that the change in the prices does not modify the behavior of the different strategies. EAS1 and EAS2 still increase costs for some users, while EAS3, EAS4, and EAS5 provide savings for all users. Total costs are higher for case 1 and lower for case 2; however, the percentages keep the same value. Moreover, SS and SC do not vary with this modification either.

4.6.2. Case 3

The prices considered in this analysis are 0.19 €/kWh for buying energy from the grid and 0.1 €/kWh for selling energy to the grid. The results are shown in Figure 11 and indicate that when there is no difference between prices, the energy is distributed more evenly between users, with lower variations with respect to the reference strategy. In this case, the users that are favored by EAS1 and EAS2 are those that have a more similar consumption profile to the photovoltaic generation profile. Moreover, the total cost for EAS2, EAS3, EAS4, and EAS5 are almost equivalent, with lower differences due to monthly net cost restrictions (Equation (11)) in EAS3, EAS4, and EAS5. Finally, there is greater homogeneity for SC and SS values between users.

4.6.3. Case 4

This modification implies setting the ownership, then the static allocation coefficient of EAS0, to 0.02 for residential users and 0.156 for commercial users. The very high and low values shown in Figure 12 for some of them are due to the low value of the reference cost (EAS0). This is the case for R4, R6, R11, and even C1 and C2. The change of the static coefficient values modifies the values of the annual savings and SC and SS, although it does not modify the uneven behavior for EAS1 and EAS2.

5. Conclusions

This study introduced and analyzed six different EASs that govern the distribution of renewable energy production between the users of a CSC. These strategies differ in the objective and mechanisms involved. EAS1 and EAS2 are based on minimizing the collective cost of a CSC, while EAS3, EAS4, and EAS5 rely on some rules that define the internal exchange of surpluses. They were evaluated not only in terms of both collective and individual economic profitability but also considering other parameters such as the SC and SS ratios.
The results show that the EASs based on minimizing the collective cost of the CSC community, EAS1, and EAS2, are the most beneficial in terms of collective profitability. However, the analysis of the individual benefits indicates that these strategies imply an unfair distribution of energy among users, with increasing costs for some members. In this case, these strategies favor those members who pay a higher price for energy from the grid and obtain higher compensation for a surplus. On the other hand, EAS3, EAS4, and EAS5 provide savings for all users, although the reduction in the total CSC cost is less significant. Sensitivity analysis shows that the benefit obtained by these three strategies increases when the price of energy is different for the participants and when the amount of surplus energy increases. Among these three strategies, EAS5 achieves the greatest benefit for the entire community as it allows maximizing the savings obtained by consumers through energy sharing in each hour. It prioritizes those with higher electricity purchase prices and those with lower surplus prices.
EAS3, EAS4, and EAS5 also improve both SC and SS ratios with respect to the reference strategy for all members of the community, while for EAS1 and especially EAS2, the behavior is disparate. In the latter strategies, there are members with very high values of SC and very low values for SS, indicating a reduced allocation of energy to these users and a bias in the energy distribution. Thus, the use of EAS3, EAS4, and EAS5 improves SC and SC through the internal exchange of energy between users within the CSC system.
The results also indicate that dynamic coefficients are preferred over static coefficients since they allow the allocation of renewable energy production to the users that demand it at each period of time.
Therefore, it is important to select an EAS that provides an unbiased distribution of the renewable energy produced and takes into account individual ratios to evaluate its performance. The results obtained indicate that the EASs based on the internal exchange of surpluses may be a good option. On the other hand, EASs built upon an optimization of a total variable, such as cost, generate preferences among the members of the community depending on their characteristics.

Author Contributions

Conceptualization, A.O.-M., X.G.-S., F.E.C., G.B.G. and P.C.O.; methodology, A.O.-M. and X.G.-S., software, X.G.-S. and S.D.G.; validation, A.O.-M., X.G.-S. and S.D.G.; formal analysis, A.O.-M., X.G.-S. and S.D.G.; investigation, A.O.-M., X.G.-S. and S.D.G.; resources, A.O.-M., X.G.-S. and S.D.G.; data curation, A.O.-M., X.G.-S. and S.D.G.; writing—original draft preparation, A.O.-M., X.G.-S., S.D.G., F.E.C., G.B.G. and P.C.O.; writing—review and editing, A.O.-M., X.G.-S., S.D.G., F.E.C., G.B.G. and P.C.O.; visualization, X.G.-S. and A.O.-M.; supervision, F.E.C., G.B.G. and P.C.O.; project administration, F.E.C. and P.C.O.; funding acquisition, F.E.C. and P.C.O. All authors have read and agreed to the published version of the manuscript.

Funding

This research was supported by CERVERA Research Program of CDTI, the Industrial and Technological Development Centre of Spain, through the Research Projects HySGrid+ (grant number CER-20191019) and CEL.IA (grant number CER-20211022).

Institutional Review Board Statement

Not applicable.

Informed Consent Statement

Not applicable.

Data Availability Statement

Not applicable.

Conflicts of Interest

The authors declare no conflict of interest.

References

  1. European Commission; Directorate-General for Climate Action. Going Climate-Neutral by 2050: A Strategic Long-Term Vision for a Prosperous, Modern, Competitive and Climate-Neutral EU Economy; Publications Office: Luxembourg, 2019. [Google Scholar]
  2. European Commission. Communication from the Commission to the European Parliament, the European Council, the Council, the European Economic and Social Committee and the Committee of the Regions. REPowerEU Plan; European Commission: Luxembourg, 2018. [Google Scholar]
  3. European Commission; Directorate-General for Energy. Clean Energy for All Europeans; Publications Office: Luxembourg, 2019. [Google Scholar]
  4. Cejka, S. Legal Measures to Aid Profitability for Energy Communities and Their Participants. In Proceedings of the 2020 Zooming Innovation in Consumer Technologies Conference, Novi Sad, Serbia, 26–27 May 2020; pp. 248–250. [Google Scholar] [CrossRef]
  5. European Union. Directive (EU) 2018/2001 of the European Parliament and of the Council of 11 December 2018 on the Promotion of the Use of Energy from Renewable Sources; European Union: Luxembourg, 2018; Volume 5. [Google Scholar]
  6. European Union. Directive (EU) 2019/944 of the European Parliament and of the Council of 5 June 2019 on Common Rules for the Internal Market for Electricity and Amending Directive 2012/27/EU (Text with EEA Relevance); European Union: Luxembourg, 2019; Volume PE/10/2019/REV/1. [Google Scholar]
  7. European Commission. Communication from the Commission to the European Parliament, the European Council, the Council, the European Economic and Social Committee and the Committee of the Regions. EU Solar Energy Strategy; European Commission: Luxembourg, 2022. [Google Scholar]
  8. Luthander, R.; Widén, J.; Nilsson, D.; Palm, J. Photovoltaic Self-Consumption in Buildings: A Review. Appl. Energy 2015, 142, 80–94. [Google Scholar] [CrossRef] [Green Version]
  9. Roberts, M.B.; Bruce, A.; MacGill, I. Impact of Shared Battery Energy Storage Systems on Photovoltaic Self-Consumption and Electricity Bills in Apartment Buildings. Appl. Energy 2019, 245, 78–95. [Google Scholar] [CrossRef]
  10. Schiera, D.S.; Minuto, F.D.; Bottaccioli, L.; Borchiellini, R.; Lanzini, A. Analysis of Rooftop Photovoltaics Diffusion in Energy Community Buildings by a Novel GIS- and Agent-Based Modeling Co-Simulation Platform. IEEE Access 2019, 7, 93404–93432. [Google Scholar] [CrossRef]
  11. Radl, J.; Fleischhacker, A.; Revheim, F.H.; Lettner, G.; Auer, H. Comparison of Profitability of PV Electricity Sharing in Renewable Energy Communities in Selected European Countries. Energies 2020, 13, 5007. [Google Scholar] [CrossRef]
  12. Syed, M.M.; Hansen, P.; Morrison, G.M. Performance of a Shared Solar and Battery Storage System in an Australian Apartment Building. Energy Build. 2020, 225, 110321. [Google Scholar] [CrossRef]
  13. Korjani, S.; Facchini, A.; Mureddu, M.; Rubino, A.; Damiano, A. Battery Management for Energy Communities—Economic Evaluation of an Artificial Intelligence-Led System. J. Clean. Prod. 2021, 314, 128017. [Google Scholar] [CrossRef]
  14. Cheng, L.; Bae, Y.; Horton, W.T. A System-Level Approach for Designing Multi-Family Sustainable and Energy-Efficient Housing Communities. Sustain. Cities Soc. 2019, 44, 183–194. [Google Scholar] [CrossRef]
  15. Karunathilake, H.; Hewage, K.; Mérida, W.; Sadiq, R. Renewable Energy Selection for Net-Zero Energy Communities: Life Cycle Based Decision Making under Uncertainty. Renew. Energy 2019, 130, 558–573. [Google Scholar] [CrossRef]
  16. Roberts, M.B.; Sharma, A.; MacGill, I. Efficient, Effective and Fair Allocation of Costs and Benefits in Residential Energy Communities Deploying Shared Photovoltaics. Appl. Energy 2022, 305, 117935. [Google Scholar] [CrossRef]
  17. Ministerio para la Transición Ecológica y el Reto Demográfico. Resolución de 25 de Marzo de 2021, Conjunta de La Dirección General de Política Energética y Minas y de La Oficina Española de Cambio Climático, Por La Que Se Publica El Acuerdo Del Consejo de Ministros de 16 de Marzo de 2021, Por El Que Se Adopta La Versión Final Del Plan Nacional Integrado de Energía y Clima 2021–2030; Boletín Oficial del Estado: Madrid, Spain, 2021.
  18. Ministerio para la Transición Ecológica y el Reto Demográfico. Hoja de Ruta Del Autoconsumo; Ministerio Para la Transición Ecológica y el Reto Demográfico: Madrid, Spain, 2021.
  19. Inês, C.; Guilherme, P.L.; Esther, M.G.; Swantje, G.; Stephen, H.; Lars, H. Regulatory Challenges and Opportunities for Collective Renewable Energy Prosumers in the EU. Energy Policy 2020, 138, 111212. [Google Scholar] [CrossRef]
  20. Jefatura del Estado. Real Decreto-Ley 15/2018, de 5 de Octubre, de Medidas Urgentes Para La Transición Energética y La Protección de Los Consumidores; Boletín Oficial del Estado: Madrid, Spain, 2018; Volume 242.
  21. Ministerio para la Transición Ecológica. Real Decreto 244/2019, de 5 de Abril, Por El Que Se Regulan Las Condiciones Administrativas, Técnicas y Económicas Del Autoconsumo de Energía Eléctrica; Boletín Oficial del Estado: Madrid, Spain, 2019; Volume 83.
  22. Ministerio para la Transición Ecológica y el Reto Demográfico. Orden TED/371/2021, de 19 de Abril, Por La Que Se Establecen Los Precios de Los Cargos Del Sistema Eléctrico y de Los Pagos Por Capacidad Que Resultan de Aplicación a Partir Del 1 de Junio de 2021; Boletín Oficial del Estado: Madrid, Spain, 2021.
  23. Jefatura del Estado. Real Decreto-Ley 18/2022, de 18 de Octubre, Por El Que Se Aprueban Medidas de Refuerzo de La Protección de Los Consumidores de Energía y de Contribución a La Reducción Del Consumo de Gas Natural En Aplicación Del “Plan + Seguridad Para Tu Energía (+SE)”, Así Como Medidas En Materia de Retribuciones Del Personal al Servicio Del Sector Público y de Protección de Las Personas Trabajadoras Agrarias Eventuales Afectadas Por La Sequía; Boletín Oficial del Estado: Madrid, Spain, 2022.
  24. Jefatura de Estado. Real Decreto-Ley 20/2022, de 27 de Diciembre, de Medidas de Respuesta a Las Consecuencias Económicas y Sociales de La Guerra de Ucrania y de Apoyo a La Reconstrucción de La Isla de La Palma y a Otras Situaciones de Vulnerabilidad; Boletín Oficial del Estado: Madrid, Spain, 2022.
  25. Wang, J.; Garifi, K.; Baker, K.; Zuo, W.; Zhang, Y.; Huang, S.; Vrabie, D. Optimal Renewable Resource Allocation and Load Scheduling of Resilient Communities. Energies 2020, 13, 5683. [Google Scholar] [CrossRef]
  26. De Villena, M.M.; Aittahar, S.; Mathieu, S.; Boukas, I.; Vermeulen, E.; Ernst, D.; Manuel De Villena, M. Allocation of Locally Generated Electricity in Renewable Energy Communities. arXiv 2020, arXiv:2009.05411. [Google Scholar]
  27. Reis, I.F.G.; Gonçalves, I.; Lopes, M.A.R.; Antunes, C.H. Collective Self-Consumption in Multi-Tenancy Buildings–To What Extent Do Consumers’ Goals Influence the Energy System’s Performance? Sustain. Cities Soc. 2022, 80, 103688. [Google Scholar] [CrossRef]
  28. Ye, G.; Li, G.; Wu, D.; Chen, X.; Zhou, Y. Towards Cost Minimization with Renewable Energy Sharing in Cooperative Residential Communities. IEEE Access 2017, 5, 11688–11699. [Google Scholar] [CrossRef]
  29. Fina, B.; Monsberger, C.; Auer, H. Simulation or Estimation?—Two Approaches to Calculate Financial Benefits of Energy Communities. J. Clean. Prod. 2022, 330, 129733. [Google Scholar] [CrossRef]
  30. Manso-Burgos, Á.; Ribó-Pérez, D.; Alcázar-Ortega, M.; Gómez-Navarro, T. Local Energy Communities in Spain: Economic Implications of the New Tariff and Variable Coefficients. Sustainability 2021, 13, 10555. [Google Scholar] [CrossRef]
  31. Plaza, C.; Gil, J.; De Chezelles, F.; Strang, K.A. Distributed Solar Self-Consumption and Blockchain Solar Energy Exchanges on the Public Grid within an Energy Community. In Proceedings of the 2018 IEEE International Conference on Environment and Electrical Engineering and 2018 IEEE Industrial and Commercial Power Systems Europe, EEEIC/I and CPS Europe 2018, Palermo, Italy, 12–15 June 2018. [Google Scholar] [CrossRef]
  32. Pedrero, J.; Hernández, P.; Martínez, Á. Economic Evaluation of PV Installations for Self-Consumption in Industrial Parks. Energies 2021, 14, 728. [Google Scholar] [CrossRef]
  33. Rocha, R.; Mello, J.; Villar, J.; Saraiva, J.T. Comparative Analysis of Self-Consumption and Energy Communities Regulation in the Iberian Peninsula. In Proceedings of the 2021 IEEE Madrid PowerTech, PowerTech 2021, Madrid, Spain, 28 June–2 July 2021. [Google Scholar] [CrossRef]
  34. Comisión Nacional de los Mercados y la Competencia. Circular 3/2020, de 15 de Enero, de La Comisión Nacional de Los Mercados y La Competencia, Por La Que Se Establece La Metodología Para El Cálculo de Los Peajes de Transporte y Distribución de Electricidad; Boletín Oficial del Estado: Madrid, Spain, 2020. [Google Scholar]
Figure 1. Scheme for strategies EAS1 and EAS2.
Sustainability 15 09244 g001
Figure 2. Scheme for strategies EAS3, EAS4, and EAS5.
Sustainability 15 09244 g002
Figure 3. Annual costs associated with the energy consumed by each CSC user and the CSC as a whole, based on the energy allocation strategy used. R1–R11 refer to residential users and C1–C5 to commercial users.
Sustainability 15 09244 g003
Figure 4. Annual savings of each strategy in comparison to the reference strategy for each CSC user and for the CSC as a whole.
Sustainability 15 09244 g004
Figure 5. Annual distribution of photovoltaic energy for each CSC user and for the CSC as a whole, based on the energy allocation strategy used.
Sustainability 15 09244 g005
Figure 6. Share of energy consumed and injected into the grid by each user and the CSC as a whole, based on the energy allocation strategy used. The reference strategy SC ratio is indicated by the horizontal lines drawn as a baseline for each user.
Sustainability 15 09244 g006
Figure 7. Share of consumption that is covered by the renewable energy produced and by the grid for each user and the CSC as a whole, based on the energy allocation strategy used. The reference strategy SC ratio is indicated by the horizontal lines drawn as a baseline for each user.
Sustainability 15 09244 g007
Figure 8. Amount of energy exchanged annually by each user into the CSC community using EAS3, EAS4, and EAS5 energy allocation strategies.
Sustainability 15 09244 g008
Figure 9. Distribution of energy costs on the annual bill between the grid and the CSC internal exchanges for each user using EAS3, EAS4, and EAS5 energy allocation strategies.
Sustainability 15 09244 g009
Figure 10. Annual savings of each strategy in comparison to the reference strategy for each CSC user and for the CSC as a whole for cases 1 and 2 of the sensitivity analysis.
Sustainability 15 09244 g010
Figure 11. Annual savings of each strategy in comparison to the reference strategy for each CSC user and for the CSC as a whole for case 3 of the sensitivity analysis.
Sustainability 15 09244 g011
Figure 12. Annual savings of each strategy in comparison to the reference strategy for each CSC user and for the CSC as a whole for case 4 of the sensitivity analysis.
Sustainability 15 09244 g012
Table 1. Summary of the main characteristics of each strategy.
EASCoefficientsMethodInternal Exchange
EAS0StaticAllocation rules (ownership)No
EAS1Static (changing every 4 months)Optimization (minimizing total cost)No
EAS2VariableOptimization (minimizing total cost)No
EAS3VariableAllocation rules (equal distribution)Yes
EAS4VariableAllocation rules (proportional distribution)Yes
EAS5VariableAllocation rules (maximum profit)Yes
Table 2. Ownership percentages and annual photovoltaic generation of each user.
Type of UserUserAnnual Consumption (kWh)CSC System PropertyAnnual Photovoltaic Generation (kWh)
ResidentialR142312%2239
R257963%3158
R334972%2139
R420041%1252
R538902%2108
R618121%1043
R713,9847%7811
R838882%2333
R961303%3057
R1034772%2202
R1117491%1041
CommercialC117,8059%11,142
C213,9747%8934
C364,16531%41,787
C425,22913%16,463
C527,57714%18,386
Table 3. Electricity prices per period and consumer.
UserTariffElectricity Price per Period (EUR/kWh)Surplus Energy Price (EUR/kWh)
P1P2P3P4P5P6
R12.0TD0.1677970.1677970.167797---0.10
R22.0TD0.1635000.1635000.163500---0.10
R32.0TD0.2205000.1677000.127800---0.10
R42.0TD0.1899990.1899990.189999---0.10
R52.0TD0.1736000.1736000.173600---0.10
R62.0TD0.1953000.1953000.195300---0.10
R72.0TD0.2093570.1727640.161018---0.10
R82.0TD0.2399990.1899990.169999---0.10
R92.0TD0.1699350.1699350.169935---0.10
R102.0TD0.1990000.1990000.199000---0.10
R112.0TD0.2268800.1742320.152188---0.10
C13.0TD0.3037840.3090060.2412860.2319100.2352750.2274070.15
C23.0TD0.3257210.2985380.2736520.2447060.2278300.2341870.15
C33.0TD0.3189100.3249400.2491550.2404980.2541780.2373390.15
C43.0TD0.3420000.3120000.2790000.2560000.2340000.2240000.15
C53.0TD0.3103010.2924790.2664640.2809490.2511090.2519090.15
Table 4. Economic savings of each strategy in comparison to the reference strategy (EAS0) for each CSC user and for the CSC as a whole. The most profitable strategy for each user and for the CSC community is highlighted in bold. The negative values indicate that the considered strategy entails a higher annual cost than EAS0.
Annual Savings (%)
R1R2R3R4R5R6R7R8R9R10R11C1C2C3C4C5CSC
EAS1−73.9−83.8−109.4−48.2−78.7−58.6−73.3−62.4−72.6−64.0−82.813.716.230.623.324.16.3
EAS2−43.4−57.3−71.7−21.0−49.4−51.4−53.9−37.7−51.6−48.8−60.8−5.821.433.725.517.39.6
EAS38.412.116.412.810.811.86.99.99.911.716.32.23.32.82.13.24.1
EAS46.011.613.18.18.76.68.07.49.69.010.21.72.93.52.33.44.1
EAS59.515.119.113.513.013.08.510.912.313.418.20.73.33.62.83.34.7
Table 5. Description of the different cases included in the sensitivity analysis.
CaseDescription
Case 1Prices +20%, both purchase and surplus
Case 2Prices −20%, both purchase and surplus
Case 3Same price of purchasing and selling for all users
Case 4Different ownership coefficients
Disclaimer/Publisher’s Note: The statements, opinions and data contained in all publications are solely those of the individual author(s) and contributor(s) and not of MDPI and/or the editor(s). MDPI and/or the editor(s) disclaim responsibility for any injury to people or property resulting from any ideas, methods, instructions or products referred to in the content.

