Article

Synthesis and Characterization of Zinc-Lead-Phosphate Glasses Doped with Europium for Radiation Shielding

by
Ahmed M. El-Khayatt
1,2,*,
Heba A. Saudi
3 and
Norah H. AlRowis
1
1
Department of Physics, College of Science, Imam Mohammad Ibn Saud Islamic University (IMSIU), Riyadh 11623, Saudi Arabia
2
Reactor Physics Department, Nuclear Research Centre, Atomic Energy Authority, Cairo 13759, Egypt
3
Physics Department, Faculty of Science (Girls Branch), Al-Azhar University, Cairo 11754, Egypt
*
Author to whom correspondence should be addressed.
Sustainability 2023, 15(12), 9245; https://doi.org/10.3390/su15129245
Submission received: 15 May 2023 / Revised: 1 June 2023 / Accepted: 5 June 2023 / Published: 7 June 2023

Abstract

:
Appropriate glass systems can provide efficient transparent radiation shielding. The current study involved the preparation of the glass system with a composition of xEu2O3-(15-x)ZnO-10CaO-35PbO-40P2O5 (where x = 0, 1, 2, 3, and 4 wt.% Eu2O3). The formation of the glass phase was confirmed using X-ray diffraction (XRD). The study analyzed physical and structural parameters, such as optical conductivity (σopt), refractive index (n), and optical band gap (Eg), with the amount of Eu2O3. The findings indicate that the optical band gap increased as the Eu2O3 content increased. Additionally, a decrease in Urbach energy (EU) was observed, suggesting an improvement in the orderliness of the glass. The study also determined various parameters for gamma-ray shielding, including mass attenuation coefficient (μm), effective atomic number (Zeff), and kerma coefficient (k). For neutron shielding characteristics, the macroscopic effective removal cross-section (ΣR) of fast neutrons was calculated.

1. Introduction

Phosphate glass networks offer several advantages compared to traditional silicate or borate glasses due to their excellent physical characteristics, including low melting, high coefficients of thermal expansion, and excellent UV transmission [1].
These features make them suitable for use as fast ion-conducting materials [2], biocompatible substance [3], laser host [4], glass-to-metal sealing, and waste immobilization [5]. Additionally, phosphate glasses are significant materials among oxide glasses due to their structural flexibility and adaptability to accept many exchanges of cations and/or anions [6]. These properties enable glass formulations to be re-engineered to optimize processing conditions and upgrade physical properties.
Lead oxide (PbO) plays a significant structural role in many types of glass as it can function as both a network modulator and a network former, with a formal oxidation state of +2. The precise role of PbO is determined by the type of lead-oxide bond. PbO is commonly used as a component in many phosphate and borate glasses to achieve desirable properties. It is characterized by favored values for density, refractive index, infrared transmission, and non-linear optical susceptibility, among other features [7]. For instance, the high polarizability of lead glass makes it suited to the requirements of optically non-linear devices. Additionally, Pb-containing glasses have a low melting point and are excellent for durable sealing [8]. Additionally, the creation of P–O–Pb bonds improves the chemical durability of phosphate glasses [9] and also increases their resistance to crystallization [10].
Lead-zinc-phosphate glasses serve as an efficient storage material for nuclear waste [11]. Studies have shown that adding PbO to zinc phosphate glass systems can affect their elastic behavior [12]. Adding ZnO to the glass matrix can enhance transparency [13]. Trivalent Eu oxide (Eu2O3) is a rare-earth metal oxide that is utilized to produce red or blue phosphorescence through the luminescence of the Eu3+ ion [14]. The europium-lead-lead dioxide glass system is useful for photonics and solid-state laser applications [15]. Incorporating Eu3+ ions into a glass network can also aid in scintillating glass applications [16] and in radiation shielding and dosimetry [17].
Regarding radiation protection, a variety of materials are available, i.e., refs. [18,19,20,21,22,23], including lead, concrete, borated polyethylene, and other glass systems. Lead-zinc-phosphate (LZP) glasses doped with Europium ions are also a viable option for radiation shielding [17]. These glasses have a relatively high density, which effectively reduces ionizing radiation. Compared to concrete, LZP glasses have an even higher density, providing better radiation shielding. Additionally, they avoid drawbacks such as the degradation of shielding ability due to continuous exposure to radiation and the absorption of radiation energy, which makes concrete hot and causes it to lose water [24]. Borated polyethylene is another material commonly used for radiation shielding. It is a lightweight material that can effectively attenuate neutron radiation. However, it is not effective in attenuating gamma rays. Although tellurite glass is another option for radiation shielding, the structural stability of pure TeO2-PbO glass is poor [25], limiting its usefulness compared to other glass systems such as zinc-lead-phosphate glasses.
A literature survey revealed studies on doping LZP glasses with various rare-earth elements, such as Dy3+ [26], Tb3+ [27], and Sm3+ [28]. Nonetheless, there have been only a few reports on Eu3+ ion incorporation in zinc phosphate glass [29,30], and studies on Eu-doped LZP systems are unusual. Therefore, Eu has been chosen as a rare-earth dopant in the LZP system for this study in order to investigate its effects on the optical, structural, and shielding properties.
The authors aimed to establish a relationship between the Eu2O3 content in the LZP glass system and the changes in the physical, optical, and shielding properties of the prepared glasses. They measured the UV-vis spectra of the samples and used the results to estimate various optical characteristics, such as the optical band gap (Eg), refractive index (n), and Urbach energy (EU). In addition, they measured the XRD pattern and FTIR absorption spectra. For gamma-ray shielding performance, the relevant attenuation radiation parameters, such as mass attenuation coefficient (μm), effective atomic number (Zeff), effective electron density (Neff), and kerma coefficient (k), were measured and compared with calculated values over a wide range of gamma-ray energies (0.080–2.614 MeV). The authors also discussed the neutron attenuation capacity in terms of the macroscopic removal cross-section of fast neutrons (ΣR, cm−1).

2. Materials and Methods

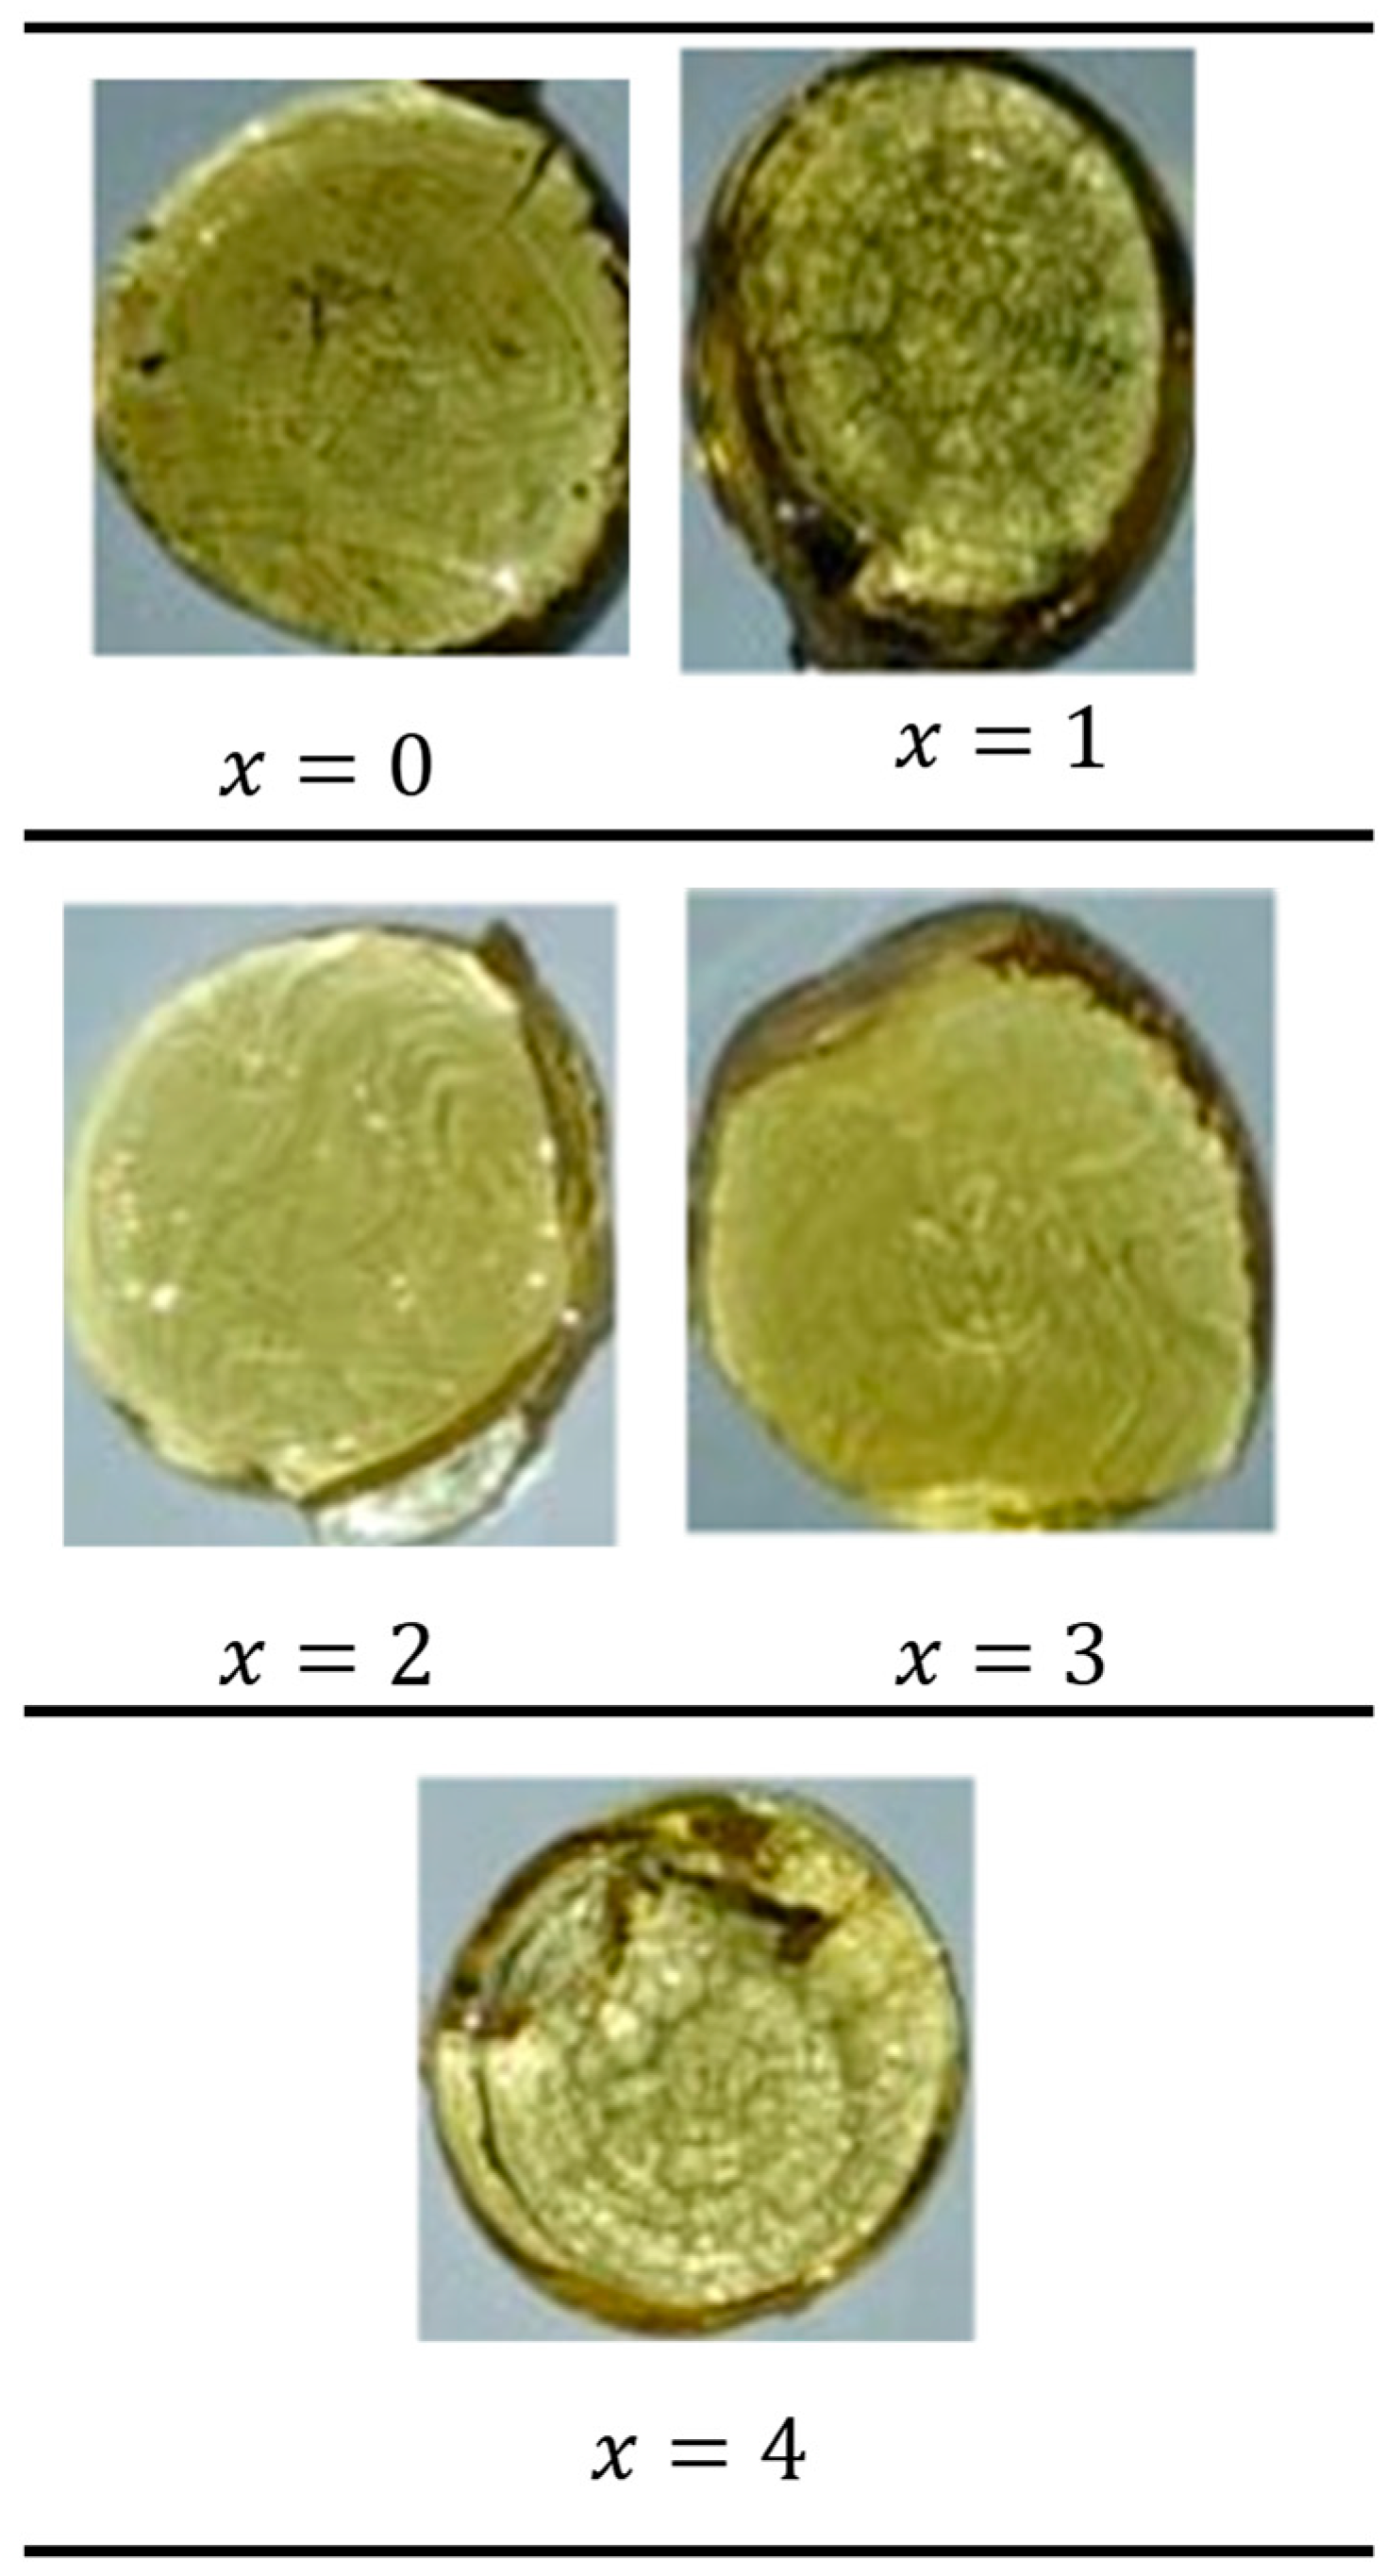
2.1. Sample Preparation

Lead-calcium-zinc-phosphate glasses doped with europium oxide (Eu2O3) were produced using the following percent composition formula: xEu2O3-(15-x)ZnO-10CaO-35PbO-40P2O5, where x = 0, 1, 2, 3, and 4 wt.% Eu2O3. The glasses were fabricated using the melt quenching method followed by heat treatment under suitable conditions. To investigate the influence of europium incorporation rate into the xEu2O3-(15-x)ZnO-10CaO-35PbO-40P2O5 glass system, five glass networks (S, S1, S2, S3, and S4), with increasing europium ratio (0, 1, 2, 3, and 4 wt.%, respectively), were synthesized. The raw materials for obtaining the glass systems were CaO, Pb3O4, ZnO, NH4H2PO4, and Eu2O3 of analytical reagent grade purity.
The glass samples were prepared by weighing the component powders in the appropriate amounts and ratios. To obtain the samples, the mixtures were kept in the oven at 300 °C for two hours in the porcelain crucibles. After that, the mixtures were melted at 1200 °C for two hours. The molten material was transferred to steel circular molds with a diameter of 2 cm and immediately annealed at 350 °C until the samples cooled to room temperature at a very low cooling rate. The samples were obtained in a circular shape with a radius of 2.5 cm, as shown in Figure 1. Table 1 displays the chemical compositions of the glass samples.
It is important to note that when the red lead (Pb3O4) is heated, it becomes thermally unstable and decomposes into lead (II) oxide and oxygen (2PbO2 → 2PbO + O2). However, heating PbO to around 450–480 °C leads to the production of red lead, according to the balanced equation 6PbO + O2 → 2Pb3O4. If the temperature exceeds 480 °C, the reverse reaction takes place via the balanced equation 2Pb3O4 → 6PbO + O2. The conclusion drawn is that when red lead is heated above 480 °C, it produces lead (II) oxide. As a result, to determine the elemental composition, the contribution of PbO must be taken into account. Two moles of Pb3O4 produce six moles of PbO. Table 2 shows the weight and mole fractions of the glass obtained after factoring in the contribution of PbO.

2.2. Density and Oxygen Packing Density, Molar Volume, and Oxygen Volume Measurements

The glass density ( ρ ) was determined using the Archimedes method in water as the buoyant liquid at room temperature. For each composition, the density values were calculated as the average of five measurements, and the estimated density error (Δρ) is ±0.02 g cm−3.
The mass density can be used to calculate various structural parameters, such as the molar volume, V M = M / ρ , oxygen molar volume ( V O = V M / n ) , and oxygen packing density ( OPD = 1000   ρ n / M ) , where M is the molecular mass of the glass and n refers to the number of oxygen atoms per glass unit formula.

2.3. Measuring Infrared Absorption

An FTIR (Fourier Transform Infrared) spectrometer of Bruker type, VERTEX 70, was used to measure the infrared absorption spectra in the 400–4000 cm−1 range at room temperature.

2.4. Optical Transmission Measurements

Glass samples, well-polished to a thickness of 0.15 cm, were prepared for optical UV-vis transmission measurements. They were measured using a Shimadzu UV-3100 spectrophotometer with a resolution limit of 0.5 nm and a transmittance accuracy of ±0.002 within the 400–800 nm range. Optical transmission studies can provide valuable information on the band structure and energy gap of amorphous materials [31].

2.5. Gamma-ray Transmission Measurement

Gamma-ray attenuation measurements occurred via the narrow beam transmission technique. The experimental set-up for mass attenuation coefficient μ m determination has been described elsewhere [32] and is presented in Figure 2. The detection system comprises a NaI (TI) scintillation crystal of size (2″ × 2″), which has an energy resolution of 12.5% at 662 keV and is connected to a multi-channel analyzer. The samples were mounted at a distance of 10 cm from the radiation source, while the source-to-detector distance was maintained at 19 cm.
The linear attenuation coefficient, µ, of the prepared glass was determined across gamma-ray energies ranging from 80 to 2614 keV. These energies were emitted by point sources of 31Ba, 137Cs, 60Co, and 232Th and were also used for energy and efficiency calibrations of the detection system. The incident photon intensity, I0, and transmitted photon intensity, I, were recorded, and the linear attenuation coefficient, µ, was then determined using the Beer–Lambert law:
μ = 1 t ln T
In this equation, t represents the thickness (in cm), and T (where T = I / I 0 ) refers to transmittance. Each measurement was repeated thrice, and the average value was reported.
The linear attenuation coefficient, when normalized to the sample density, is referred to as the mass attenuation coefficient, which is calculated as μ m = μ / ρ . Since μ m is not dependent on material density, it is preferred in shielding analysis.
For each gamma-ray energy, we plot ln ( T ) against glass thickness. The experimental mass attenuation coefficients ( μ m ) E x p can be estimated accurately from the gradient of the resulting graphs. In total, we constructed 35 graphs to determine the μ values for all glass compositions at varying photon energies. Figure 3 illustrates one such graph for determining the μ value of the S1 glass sample at 2.614 MeV. The figure shows that the transmission factor decreases linearly with increasing sample thickness, and μ and μ m are 0.2028 cm−1 and 0.0401 cm2/g, respectively.
The standard error in the experimental mass attenuation coefficient, Δ μ m , was estimated using the propagation of uncertainty formula given below:
Δ μ m = 1 t Δ I 0 I 0 2 + Δ I I 2 + ln I 0 I 2 Δ ρ ρ 2 + Δ t t 2 .
Here, Δ I 0 , ΔI, Δ t , and Δ ρ represent errors in I 0 , I , t, and ρ , respectively. The statistical error of the experimental measurement was kept below 3%.
We used the WinXCom program to calculate the theoretical values of mass attenuation coefficients ( μ m ) T h e o for all glasses in the energy range of 1 keV–100 GeV. The software is based on the applicability of the mixture rule at different photon energies [33]. The μ m values were then converted to effective atomic number, Zeff, effective electron density, Neff (electron/kg or electron/m3), and gamma-ray kerma coefficient, k.

2.6. Theoretical Background of γ-ray Shielding

Photon attenuation primarily depends on the atomic number. As a result, the concept of the effective atomic number, Z eff , for compounds or mixtures was developed. Two approaches are used for calculating Z eff : the first is a simple model that provides a single approximate value, while the second provides a more accurate determination of the effective atomic number, which is energy dependent. The use of a single-valued Z eff is often oversimplified for many purposes, and it is presented here for quick comparison. Procedures for calculating Zeff, Neff, and γ-ray are described.

2.6.1. Single-Valued Zeff and Neff

Many expressions for determining a single-valued Zeff can be found in the literature. For instance, Murty (1965) calculates Zeff using the weight fractions of the elements [34]:
Z eff = i w i Z i 3.1 1 / 3.1 .
where Z is the elemental atomic number.
Furthermore, Zeff can be calculated using another simple power law that involves utilizing the electronic content fraction, a i e , of each element, as the following:
Z eff = i a i e Z i m 1 / m .
The exponent m ranges from 2.94 to 3.5, and Maynard (1937) used the lower value of m (2.94) [35], while Sellakumar et al. (2007) favored the upper value 3.5 [36]. Hine (1965) suggested 3.1 [37], and Tsaï and Cho employed m = 3.4 [38].
The accompanying single-valued electron density (Neff) is also related to the electronic fraction via the following equation [36]:
N eff = N A i a i e Z i / A i .
Here, NA and A denote the atomic mass and Avogadro’s number, respectively. The atomic mass of an atom is denoted by the letter A. On the other hand, many researchers have considered the proportion of atoms,   α i a t , instead of the fractional electronic contribution, where:
α i a t = w i / A i i w i / A i
Based on α i a t , Puumalainen et al. (1977) [39] and Manninen and Koikkalainen (1984) [40] proposed Equations (7) and (8), respectively, for the determination of Zeff:
Z eff = i α i a t Z i 3 i α i a t Z i 1 / 2
Z eff = i α i a t Z i

2.6.2. Energy-Dependent Zeff (E) and Neff (E)

The equations that give the effective atomic number and the corresponding effective electron density as a function of photon energy are [41]
Z eff E = i f i A i ( μ m ) i i f i A i Z i ( μ m ) i
N eff E = N A Z eff A
Here, f i refers to the atomic fractional abundance of the element i , and A = i f i A i , which denotes the molecular weight of the sample.

2.7. Gamma-ray Kerma Coefficient Calculations

In many applications, it is necessary to accurately determine the kerma coefficient, k, especially when nuclear heating is a significant factor. The author used the same procedure as El-Khayatt [42] for converting mass attenuation coefficients into k-values, as follows:
k = C i w i [ ( μ / ρ ) τ , i E + f - C ( μ / ρ ) C , i E + ( μ / ρ ) κ , i E 1.022 ] .
Here, C is an energy conversion coefficient applied to obtain k-values in (Gy·cm2), and σ τ , i , σ κ , i , and σ C , i are the photoelectric, pair production, and Compton mass absorption cross-sections of element i at energy (E), respectively.

3. Results

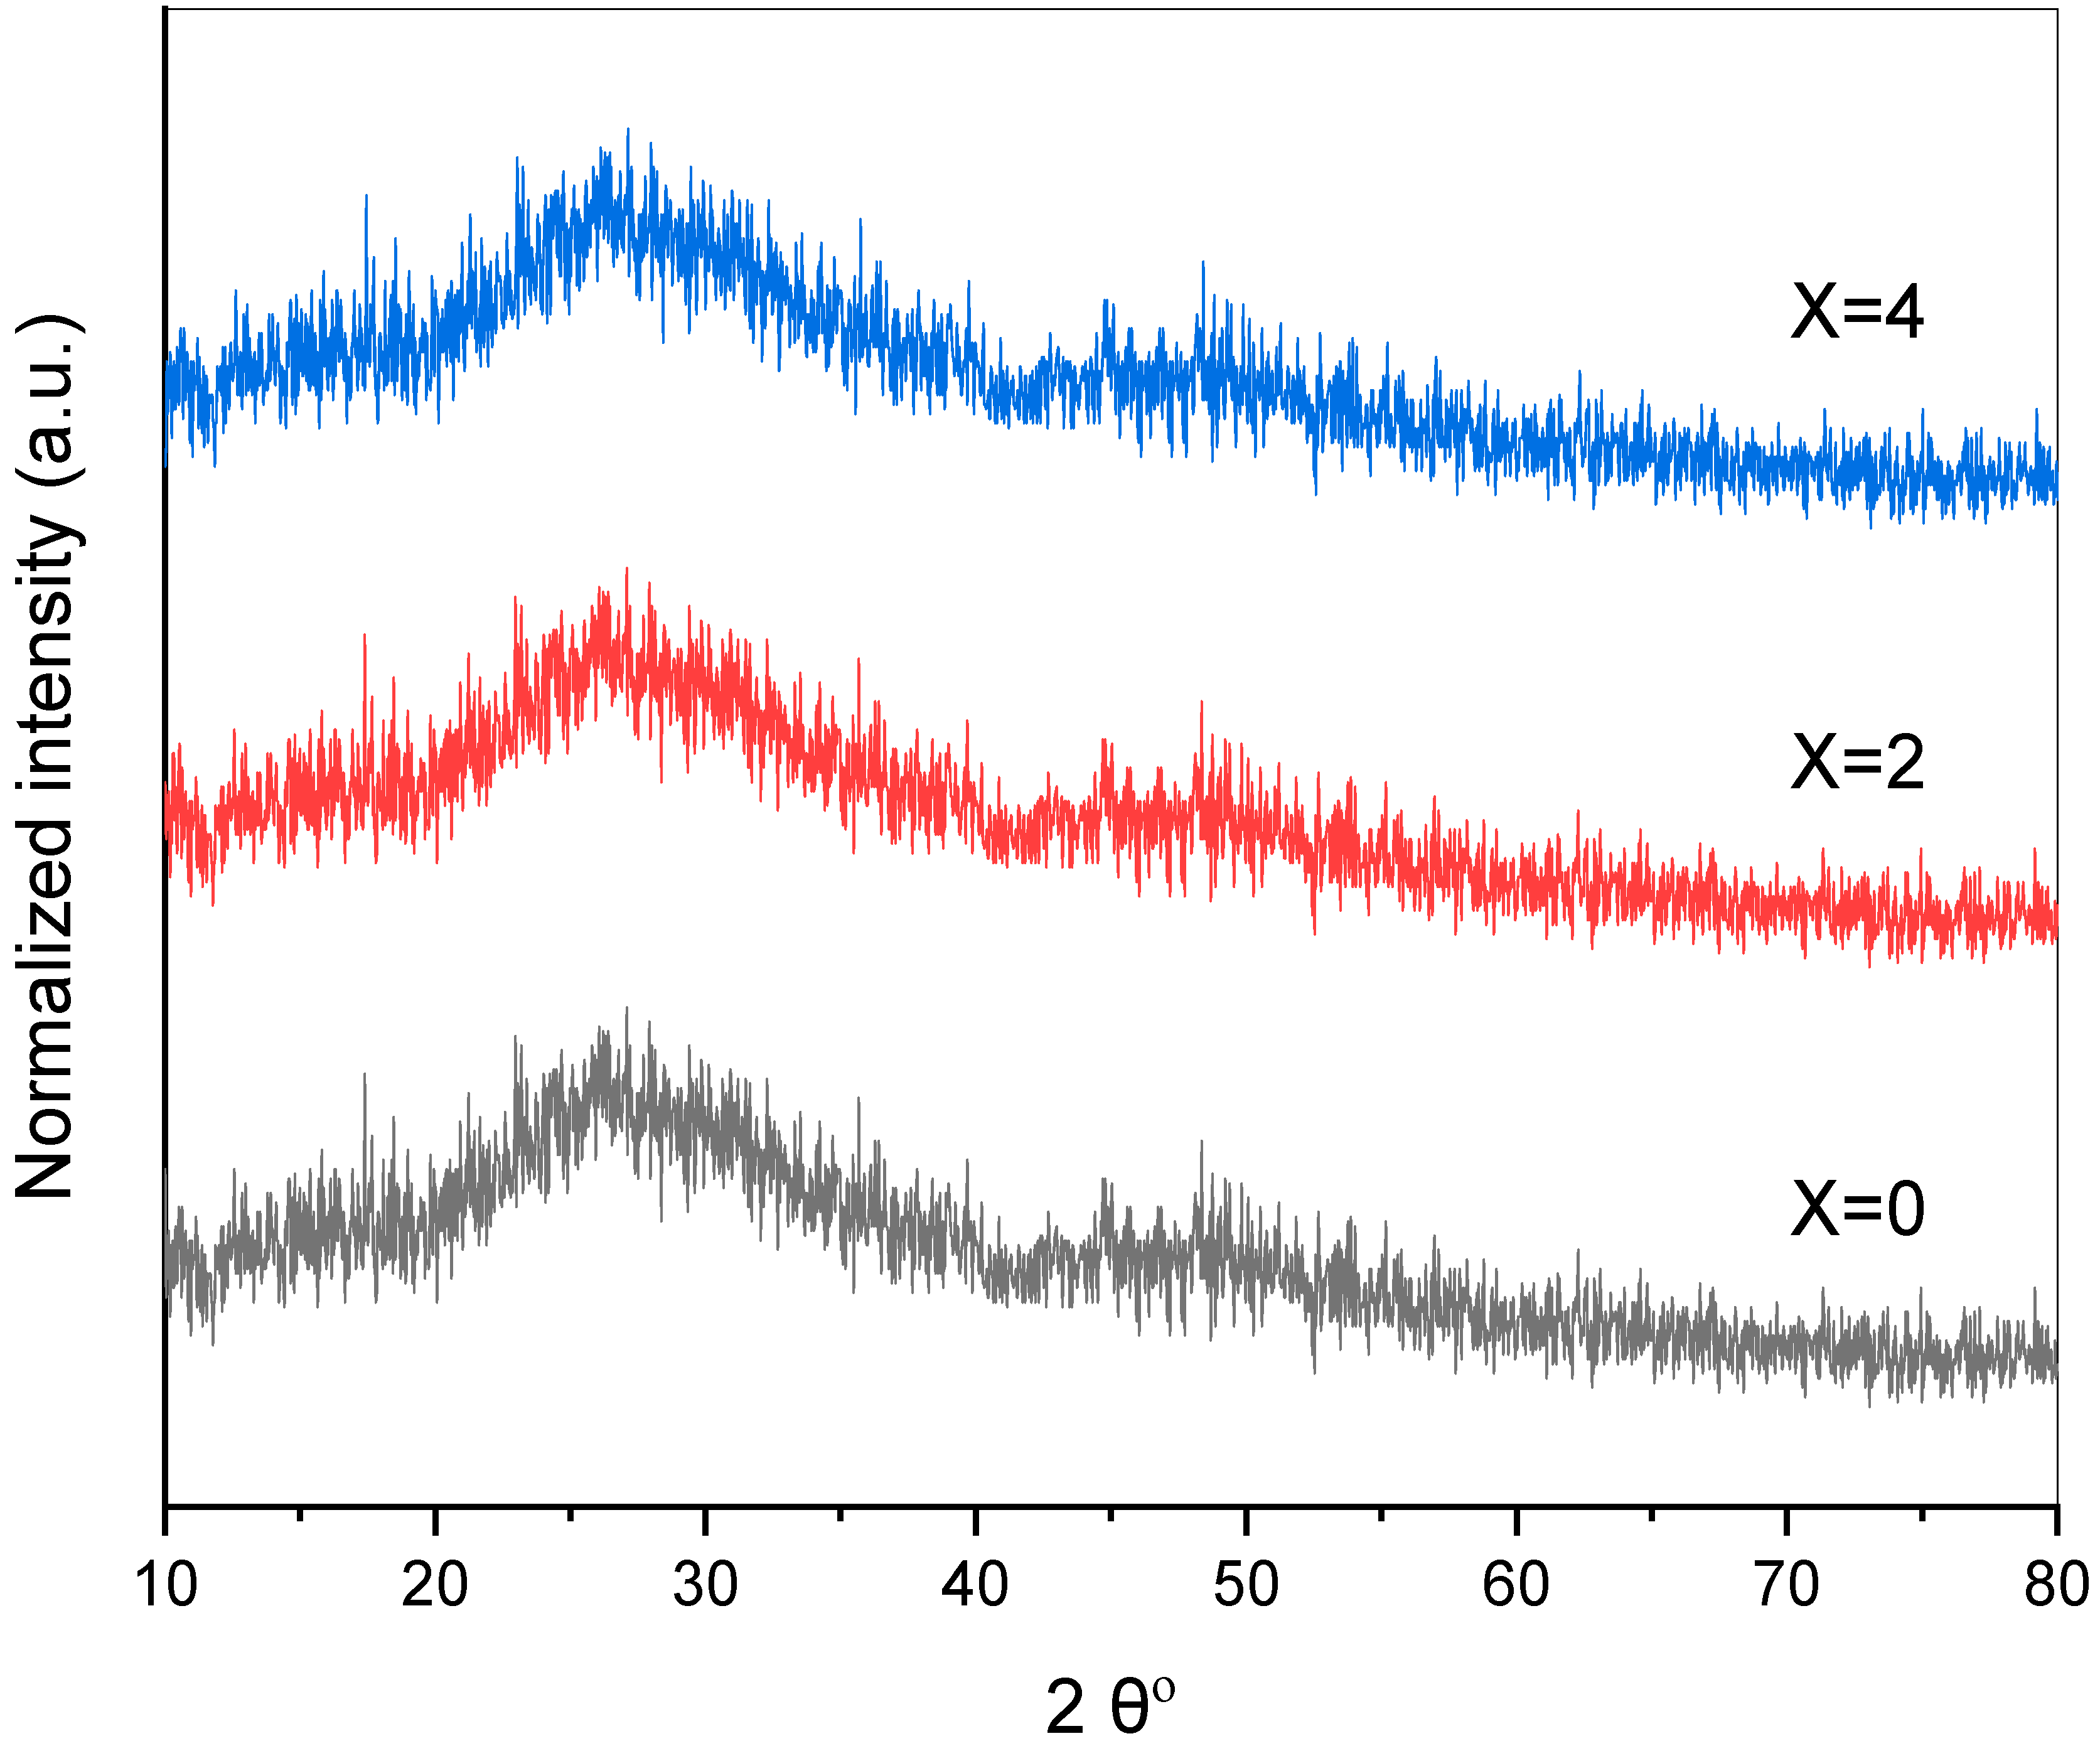
3.1. Structural and Physical Characteristics

Figure 4 shows the XRD patterns of all samples, which do not exhibit sharply separated peaks but instead display broad humps, indicating the amorphous nature of the samples. However, the samples exhibit wide diffusion at lower scattering angles, which is typical and represents the structural disorder in the samples. This provides information about the amorphous behavior of the obtained glass samples [43]. Only three samples are presented in the figure to provide greater simplicity and clarity.
Variations in the physical structure properties of the prepared glass based on the Eu2O3 content are studied by measuring the density and estimating OPD, VM, and VO values. The results are listed in Table 2. The glass densities (in g/cm3) rose from 5.04 to 5.112 with increasing Eu2O3 content. This result is expected because Eu2O3 has a higher specific density (7.4 g/cm3) than ZnO (5.61 g/cm3). Thus, the glass system’s unit weight increases due to increasing the Eu2O3 percentage.
The VM values ranged from 63.04 to 63.90 cm3/mol with Eu2O3 content up to 1.50 mol%. This finding may be attributed to the larger ionic radii and bond lengths of Eu2O3 compared to ZnO, resulting in a significant increase in molar size with increasing (x) value, implying a modification of the glasses towards an extra open structure [44].
The VO values decreased from 26.12 to 25.04 cm3/mol, while the OPD values increased from 79.95 to 80.00 mol/cm3 due to the increased Eu2O3 content in the glass system. This can be attributed to the replacement of lower field intensity Zn2+ ion (0.0740 nm) with higher field intensity Eu3+ ion (0.1087 nm). As a result, the oxygen molar volume decreases while the oxygen packing density increases, leading to an improvement in the xEu2O3-(15-x)ZnO-10CaO-35PbO-40P2O5 glasses. The increase in OPD values with increasing Eu2O3 content can also be explained by the increase in atomic oxygen abundance per unit of glass composition with a ratio of 3:1.

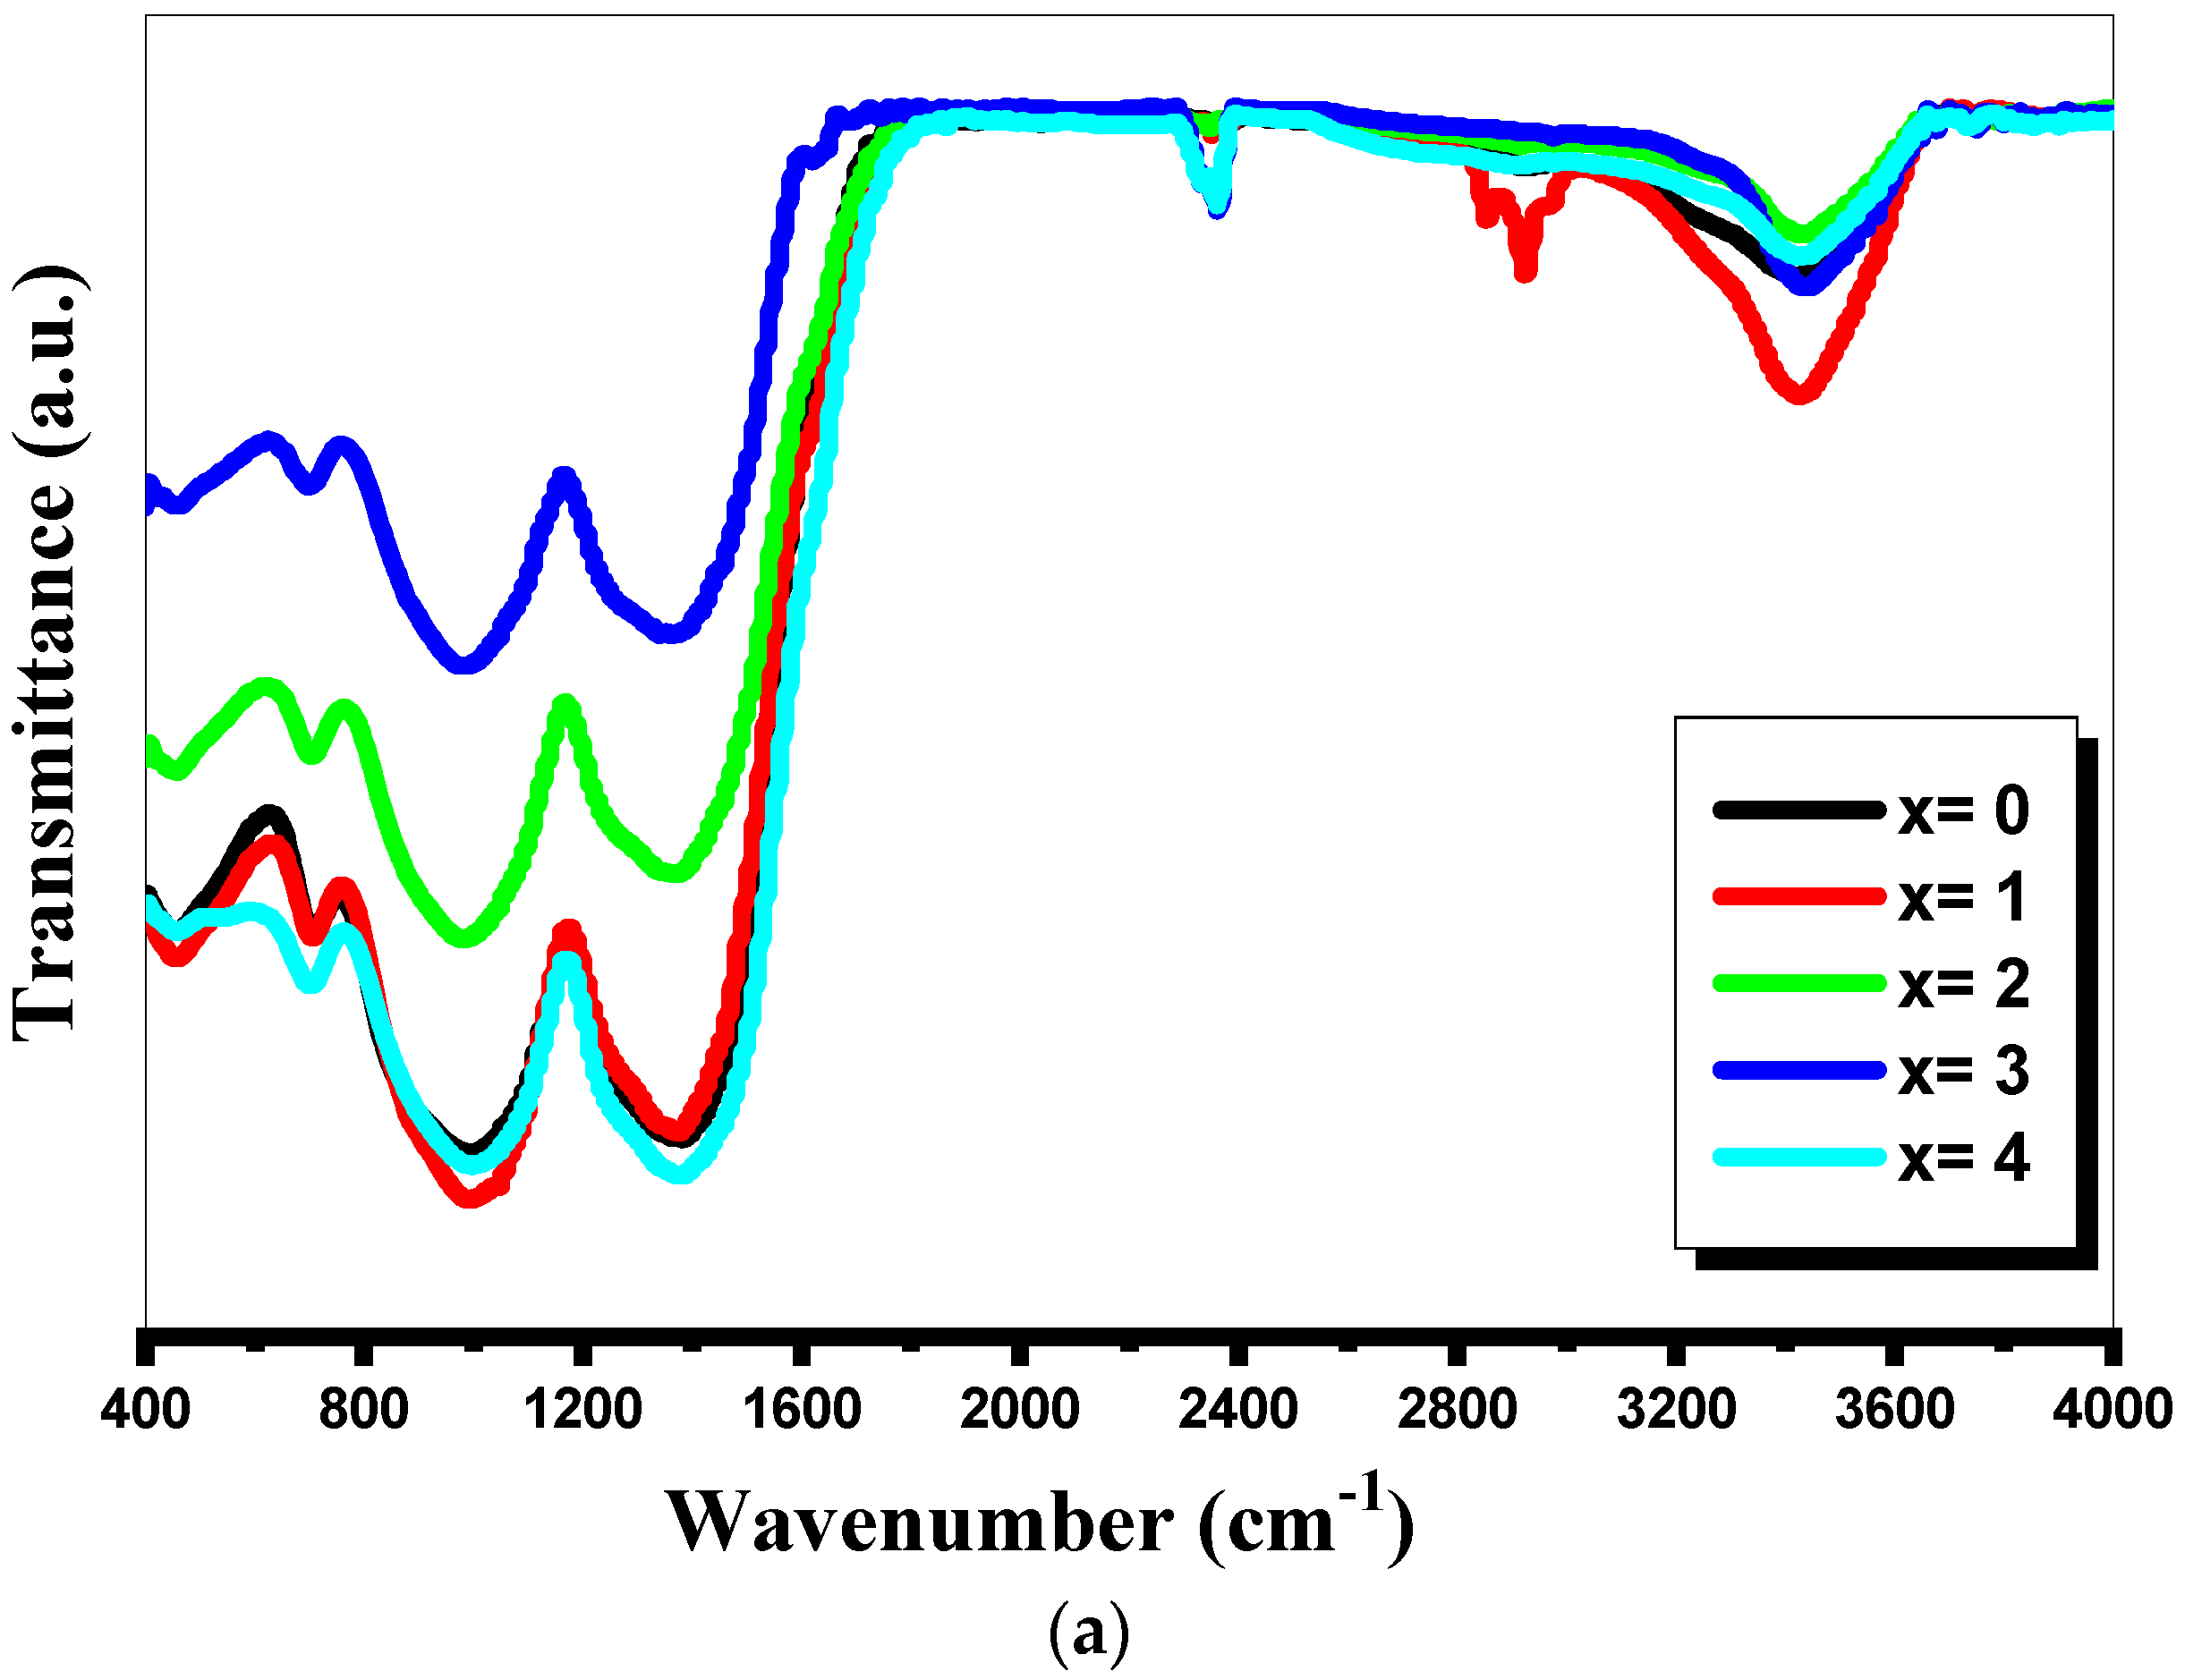
3.2. FTIR Absorption Spectra

Infrared (IR) spectroscopy is a useful technique for studying the absorption of infrared radiation in glass. Therefore, this technique was utilized to study the current glass system over the wave number range 400–4000 cm−1. Figure 5a displays the plots of the infrared spectra of the present samples, in which several absorption bands are observed, each containing more than one peak indicating a fixed type of vibration that characterizes a specific building unit. These spectral regions undergo broadening due to the interference between phosphate and lead spectra that often occurs over the same spectral region. Thus, a suitable deconvolution technique is required to break down overlapping bands to facilitate their mapping. By assuming that the spectrum is a Gaussian shape, the deconvolution process has been carefully applied to all obtained spectra. The results of the deconvolution process for the control glass (free of Eu2O3) are shown in Figure 5b.
Figure 5a shows prominent IR bands in the current glass. The phosphate glass, which contains relatively small amounts of Eu2O3, exhibits weak bands near 3450 cm−1 and 1640 cm−1, as well as very weak and broad bands in the regions of 2700–2900 cm−1 and 2200–2400 cm−1, which in line with the previous work [45]. The detailed assignments of the infrared absorption spectral results are given in the following.
The two broad bands at 3160 and 3423 cm−1 belong to O–H stretching (symmetric and antisymmetric) modes. To differentiate between the O–H and water H–(OH) bands, we researched the scissoring mode of OH2, which requires three atoms. Therefore, if the absorption band for the deformation mode at about 1640 cm−1 is present, it confirms that the observed OH bands are likely attributed to water. This band was indeed detected. Moreover, the presence of a slight hump in this band among all samples suggests that water has a limited effect on their structure and properties [15]. The 3160–3423 bands can be explained by the different roles that H2O molecules play in the structure. Even though the sample being studied does not contain water as a network unit, it readily absorbs moisture from the surrounding atmosphere [46].
In addition, the relatively weak bands in the range 2700–2900 cm−1 are arise from the stretching vibrations of the P–O–H group at different structural positions [45,46,47]. This group creates the strongest hydrogen bond with the non-bridging oxygens (NBOs) [46]. The IR bands at about 2400 cm−1 may be related to P–O–H or water [47]. Additionally, Zánšik and Jamnicky (1992) [45] stated that the broad bands in the regions of 2800–3000 cm−1 and 2200–2400 cm−1 can be assigned to (P)–O–H vibration stretching modes. Therefore, the presence of the broad bands between 2200–2400 cm−1 may be used to confirm that these bands correspond to (P)–O–H stretching modes. IR spectrum showed both of these broad bands.
The strong band observed at 1340 cm−1 is assigned to the harmonics of asymmetric stretching of the doubly bonded oxygen vibration of the O–P–O bond, ν a s P = O [46], while the band at 466 cm−1 is related to the bending vibration of O–P–O units,   δ PO 2 modes of PO 3 n chain groups [45].
The shoulder at approximately 1280 cm−1 corresponding to the asymmetric stretching vibration of O P O groups, ν a s O P O . Meanwhile, the band at 1111 cm−1 is associated with the symmetric stretching vibration of those groups, ν s O P O [48].
The sharp peak at 887 cm−1 is characterized by the asymmetric stretching vibration (P–O–P) of the oxygen bridging, ν a s P O P modes linked with linear metaphosphate groups (chain, rings, and/or terminal groups) [10], while 887 cm−1 is assigned to   ν s P O P modes of PO 3 n chain groups [45]. The 1100 cm−1 band is associated with the asymmetric vibration ( ν a s ) of pyrophosphate units (PO3). Previous studies [49] have shown that the network structure of phosphate glass consists of a polymeric arrangement of PO4 tetrahedral groups. The addition of oxide modifiers (alkaline earth oxide, calcium oxide) to phosphate glass changes the linear phosphate chain by cleaving the P–O–P bonds and forming unannealed oxygen. PbO participates in the lattice structure in the formation of PbO4 or P–O–Pb bonds or is sheltered as a modifier ion [2,3].
Noticeable changes in the intensity of the glassy peaks are observed. Such changes may be related to the weakening of the network structure or changes in bond angles or lengths of bonds between structural units. It can also be seen from Figure 5 that the observed variability in the glass containing 4% Eu2O3, where displacement occurs at 720 cm−1, is probably attributed to the overlapping of P–O–P with Eu–O stretching. This can be explained by accepting the assumption that with 4 wt.% Eu2O3, a new Eu–O–Eu bridging bond is formed due to the polarizability of Eu ions. The relative area of P–O–P bonds decreases in the sample containing 4% Eu2O3. This decrease may be due to the modifier role of PbO in the glass. If Pb ions act as glass former, they may break up P–O–P bonds and form P–O–Pb bonds, thereby entering the glass lattice, according to references [2,3].
The broadness of the bands appears to indicate the structural disorder of the various phosphate structural groups, as opposed to the sharp bands seen in crystalline analogs. The infrared spectral curves are almost the same for free Eu2O3 and Eu2O3 containing base glass, with slight changes due to the participation of Eu2O3 ions such as Eu–O–P or Eu–O–Eu [4]. The slight effect observed in the samples doped with Eu2O3 could be attributed to the presence of Eu2O3 ions at low concentrations, which may result in only minor changes in the structural lattice. The concentration of Eu2O3 ions in the samples is approximately 4% by weight. Furthermore, the presence of Eu2O3 ions in doping levels is not seen, and the formation of these ions in association with the phosphate network is possible.

3.3. Optical Characterization

Figure 6 displays the optical absorption spectra of the glass sample that contains the three metal oxides: ZnO, Eu2O3, or PbO. The spectrophotometric results show that replacing the ZnO with Eu2O3 significantly narrows the band between 400 to about 500 nm, while other changes are also observed. The incorporation of Eu2O3 reveals a peak at 425 nm, which exhibits highly intense absorption. The optical spectral curves of the samples run parallel to one another, and higher absorption was recorded for higher europium content. The addition of Eu2O3 promotes a minor increase in the entire spectrum, consistently displaying the same absorption peak. Assessing the fundamental absorption edge in the ultraviolet domain is crucial when studying the optical transition and electronic band structure of glass. Photoexcitation that can occur at the core absorption edge involves the interaction of electromagnetic waves with electrons in the valence band. These electrons are lifted across the core gap into the conduction band [50].
The UV-Vis optical absorption spectra of the samples were measured at room temperature, as shown in Figure 6. According to Beer–Lambert’s law (see Equation (1)), the optical absorption coefficient, α ν in cm−1, can be determined from the incident and transmitted photon intensities by
α ν = 1 t ln ( 1 / T )
Here, t is the sample thickness, ν is the frequency, and T is the transmittance. The transmittance was measured in the wavelength range of 400–800 nm. Figure 6 displays the transmission spectra measured for all glass systems under investigation. As depicted in the figure, the percentage transmittance increases with an increase in the Eu2O3 content. All samples exhibit a significant improvement in transparency with the addition of Eu2O3.
A common technique for studying optically induced electronic transitions involves measuring the α ν around the principal absorption edge. The relationship between α ν and the optical band gap, E g , of direct and indirect allowed transitions is given by Equation (13) [31]:
α h ν = [ B h ν E g ] r
Here, r = 1 / 2 and 2 are used for the direct and indirect allowed transitions, respectively. B is the constant band-tail parameter that is independent of photon energy ().
The Tauc plot, which is the variation of the quantity ( α h ν ) 1 / 2 as a function of photon energy, has been created for all glasses, as shown in Figure 7. Extrapolating the linear portion of the plots to meet the horizontal axis yields the E g values. The Urbach energy ( E U ), which is the reciprocal of the slope of the linear component, can be determined through the empirical relationship for low-energy regions (linear region), as shown in Equation (14) [31]:
α ν = B   exp h ν E U
The Urbach energies and the indirect band gap values as a function of Eu2O3 loading are illustrated in Figure 8. It shows that as the amount of Eu2O3 increases, the Eg increases linearly from 1.90 to 2.30 eV. A reversal in the trend of the values for the optical band gap and Urbach energy can be observed upon the incorporation of Eu rate. These findings are in agreement with those reported by Monisha et al. (2023) [51]. Urbach energy is a measure of material disorder. Decreasing it with an increasing Eu2O3 ratio suggests a decrease in the disorder of the studied glasses. This decrease is due to polymerization, which likely reduces the density of localized states and their tails in the energy gap. The extent of this reduction depends on the amount of Eu2O3.
The glass refractive index (n), which is a dimensionless number that determines the amount of light path bending or refraction in the glass, can be calculated based on the optical band difference. Many authors, such as Abul-Magd et al. [52], have used the Dimitrov and Sakka relation [7] to calculate the refractive index as follows:
n 2 1 n 2 + 2 = 1 E g 20
We have simplified this relationship to become:
n = 1 + 2 x 1 x
where x = 1 E g 20 .
As shown in Figure 9, the refractive index exceeds unity and rises monotonically between 1.84 and 2.02 due to the addition of Eu2O3. The refractive index is determined by the interaction of light with the electronic clouds of atoms and ions of glass constituents. An increase in the electron density or the ionic polarizability increases the refractive index, as observed in the current glass. Incorporating Eu2O3 at the expense of ZnO in the glass network increases the number of non-bridging oxygen atoms (NBOs) that are more polarizable than bridging oxygen atoms (BOs) in the vitreous structure. The claim of improving the effective electron density (Neff) of the investigated glasses by increasing the Eu2O3 content will be confirmed by calculation, as mentioned in the next section. Therefore, light will be spread across the phosphate network to a greater degree, resulting in an increase in the refractive index [1].
Optical conductivity ( σ opt ) measures the change in conductivity in response to illumination. σ opt represents the relationship between the induced current and the electric field of incident electromagnetic waves at an arbitrary frequency, as shown in Equation (17):
σ opt = n   c α 4 π ,
where c is the vacuum light speed, and n is the refractive index.
Figure 9 displays the measured optical conductivity values. The increase in σ opt may be attributed to the creation of new levels in the band gap, which make it easier for electrons to move from the valence band through these new levels to the conduction band. The high optical conductivity values indicate the potential applications of zinc and lead in phosphate glass doped with Eu2O3 in photoelectric devices [53].

3.4. Gamma-ray Attenuation Characteristics

Initially, we tested the impact of glass composition on the glass’s shielding ability using simple calculations for the mean atomic weight ˂A˃, mean atomic number ˂Z˃, mean electron density ˂N˃ (electron/kg), and single-valued Zeff (electron/atom) of all glasses. The single-valued effective atomic numbers are given by six empirical relations (Equations (3)–(8)). Table 3 demonstrates that varying formulations of Zeff result in distinct values. However, all computed parameters systematically increased as the Eu2O3 content increased, except for ˂N˃, which, in the present case, is approximately 3 × 10 26 = ½ N A . The ˂A˃, ˂Z˃, and Zeff parameters indicate increased values in response to Eu2O3 content, with the maximum values recorded for the S4 sample. Therefore, the Eu2O3 content positively impacts the shielding ability of the current glass system against γ-ray radiation.

3.4.1. Mass Attenuation Coefficients

The experimental results of the mass attenuation coefficients of the investigated samples were obtained for the photon energy range of 0.08–2.614 MeV, and they were also theoretically computed using the well-known WinXCom program [33]. The weight fractions of the individual constituents (Table 1) were inputted into the WinXCom program to calculate the attenuation coefficients. For all glasses, the mass attenuation coefficients decreased as photon energy increased, but they showed a significant increase with the increase in the amount of Eu2O3 (Table 4). S4 had the highest values of μ m , while the reference glass sample (S) had the lowest values. The glass containing 4 wt.% Eu2O3 showed an increase of 14% and 2.7% in μ m at 0.08 and 0.238 MeV, respectively (Table 4). However, it was observed that the mass attenuation coefficient was identical for all samples over energies ranging from 0.662 to 2.614 MeV, where the Compton process was dominant. Furthermore, there was an excellent agreement between the experimental and calculated results, as shown in Table 4.
Comparing the γ-ray transmittance (T) of the reference sample S with those of S4, the glass with the highest Eu2O3 content, is another way of evaluating the effect of Eu2O3 addition on γ-ray shielding. The transmissions of the S and S4 samples as a function of their thickness are graphed in Figure 10a,b. This figure indicates that glass with higher Eu2O3 content has lower T values, and vice versa. As transmittance is inversely proportional to the shielding ability of a material, the shield thickness decreases when using glass with lower T. Additionally, it is clear from Figure 10a,b that the T values of S and S4 samples are only slightly different in the intermediate energies (Figure 10b), and the differences become notable at lower photon energies (Figure 10a). Another feature observed in Figure 10 is that the correlation of T with the sample thickness is dependent on the photon energy. Unlike relatively low-energy photons (80 keV), the correlation is linear at intermediate energy (2.614 MeV). The energy behavior of T mirrors the dominance of the photoelectric and Compton interactions at low and intermediate photon energies, respectively. The photon interaction probability in the intermediate energy region is linearly dependent on the <Z> of the substance. However, for the low-energy region, the probability depends on the (Zeff)3−4. As Zeff is a weighted average, elements with high atomic numbers have greater weights. Thus, the contribution of Eu (Z = 63) to photon interactions at low energies is more than its contribution at the intermediate energy region. As a result, the differences in T become more apparent at lower photon energies.

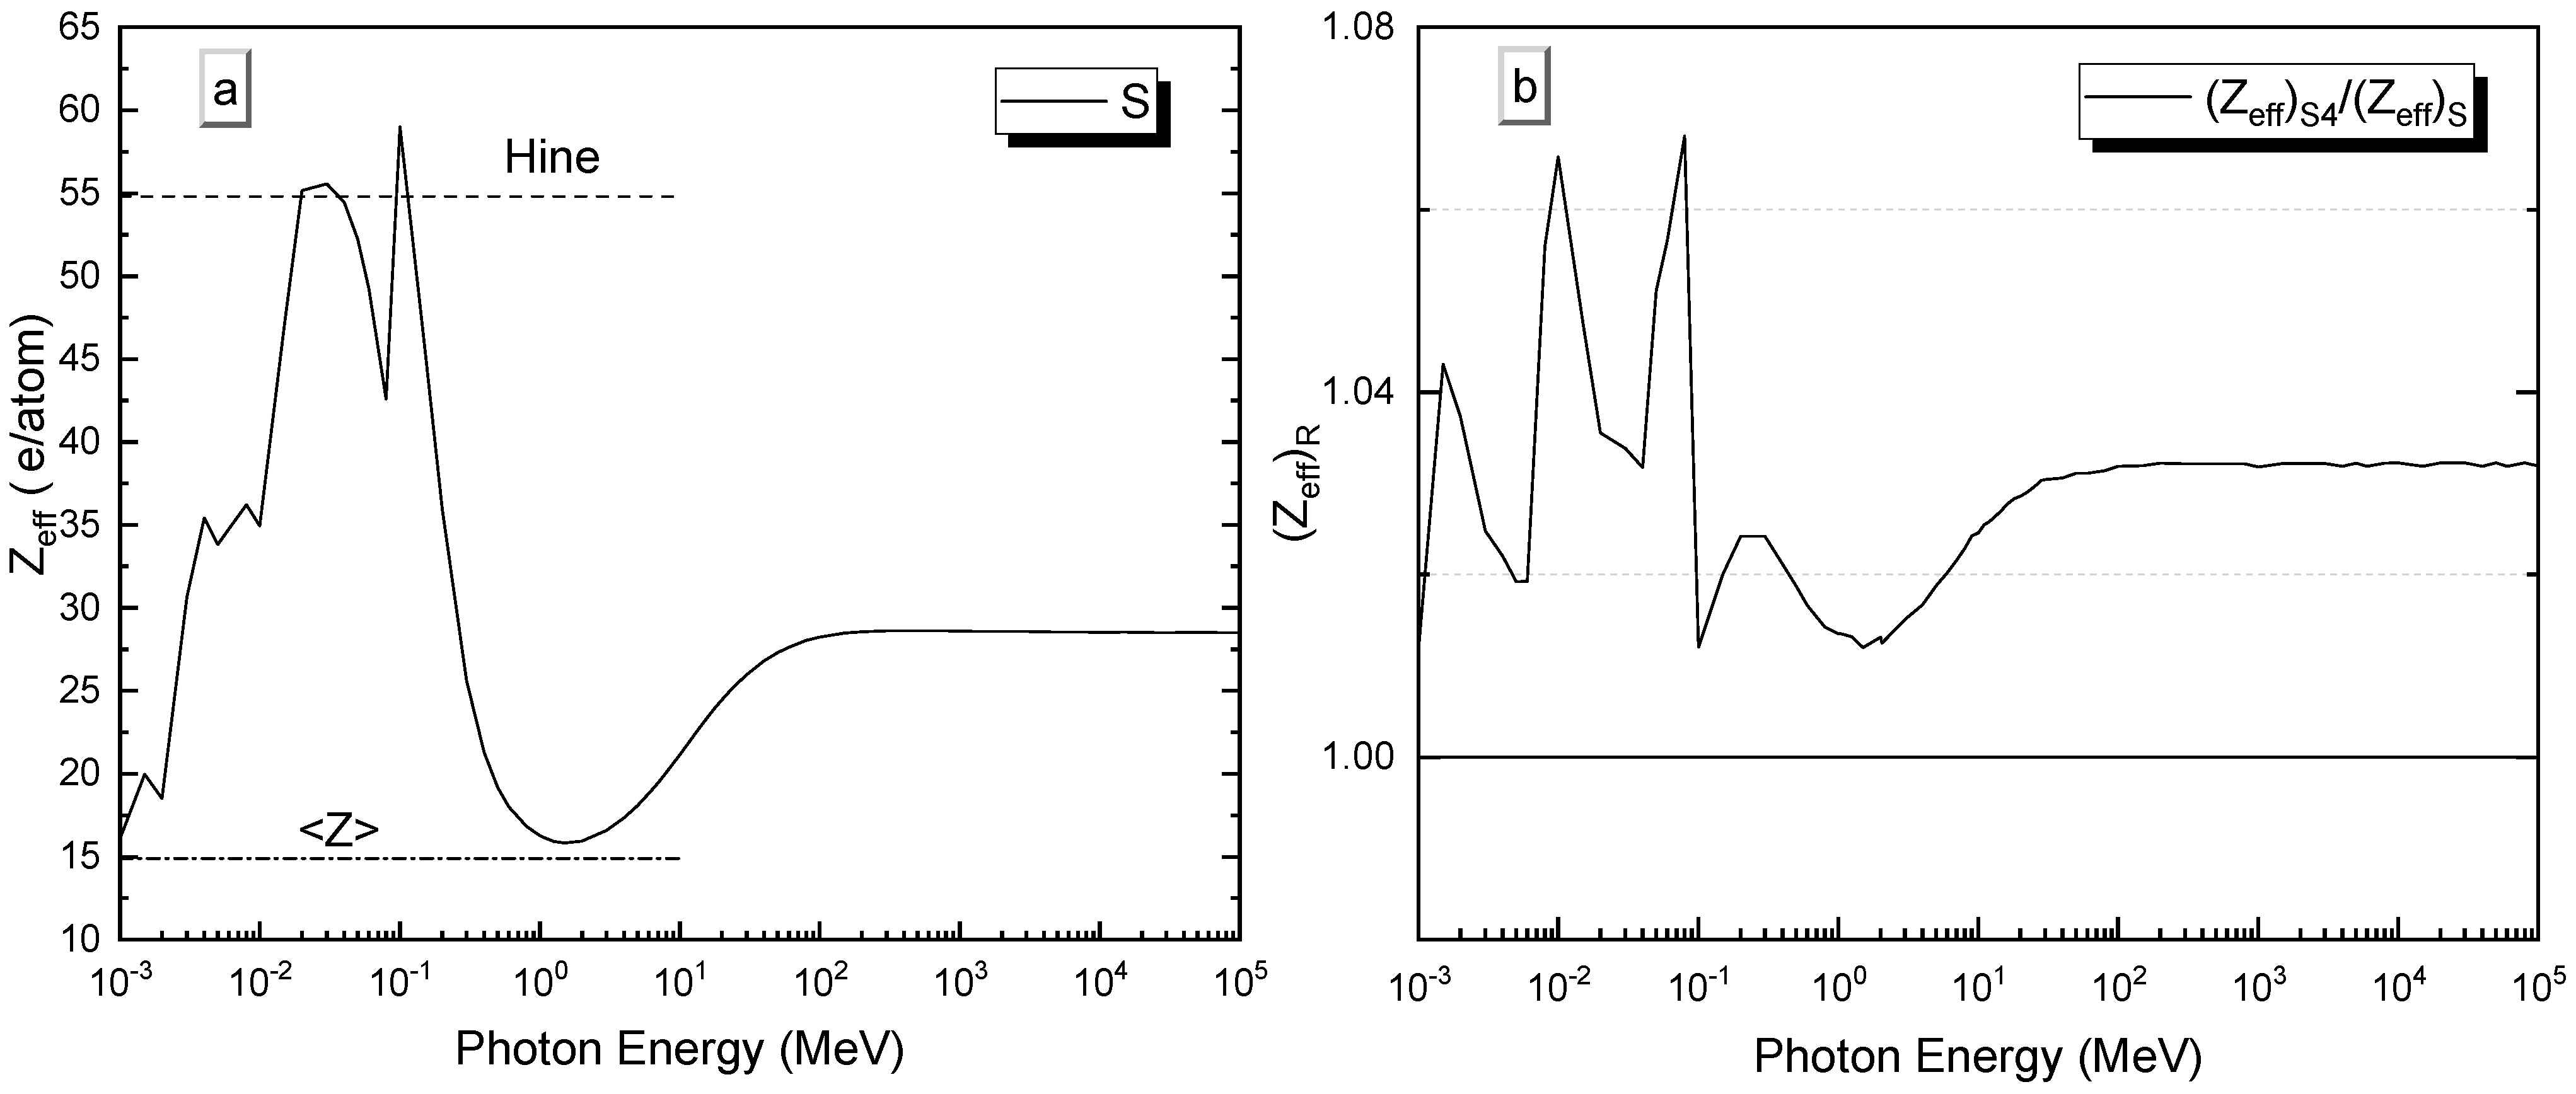
3.4.2. Effective Atomic Numbers and Effective Electron Densities

For many applications, a single value of Zeff is overly simplistic. Therefore, determination of the rigorous, energy-dependent Zeff is often required. Figure 11 illustrates Zeff as a function of energy, with maximum and minimum values noticed at lower and intermediate photon energies, respectively. Figure 11b presents the ratios of effective atomic numbers of S4 and S, with the ratio exceeding unity, especially at lower and higher energy regions due to predominant photoelectric and pair production interactions. The noticed peaks at low-energy regions arise from absorption edges of glass constituents.
The effective electron density is not an independent parameter in shielding analysis but has a close relationship with the effective atomic number (Equation (10)). Therefore, the energy dependence of Neff is like that of Zeff, as shown in Figure 12. It is worth noting that the various single-valued expressions (Equations (3)–(8)) for Zeff provide a unique number, which is a rough estimate for the effective atomic number at low energies, where photoelectric absorption is the dominant process. Therefore, Zeff is comparable to the maximum value of Zeff, as shown in Figure 11a. The Zeff calculated by Hine [37] was selected to represent the class of atomic numbers based on the single-valued approach. Despite the simplicity of single-valued Zeff determinations, the obtained values should be treated with some caution.

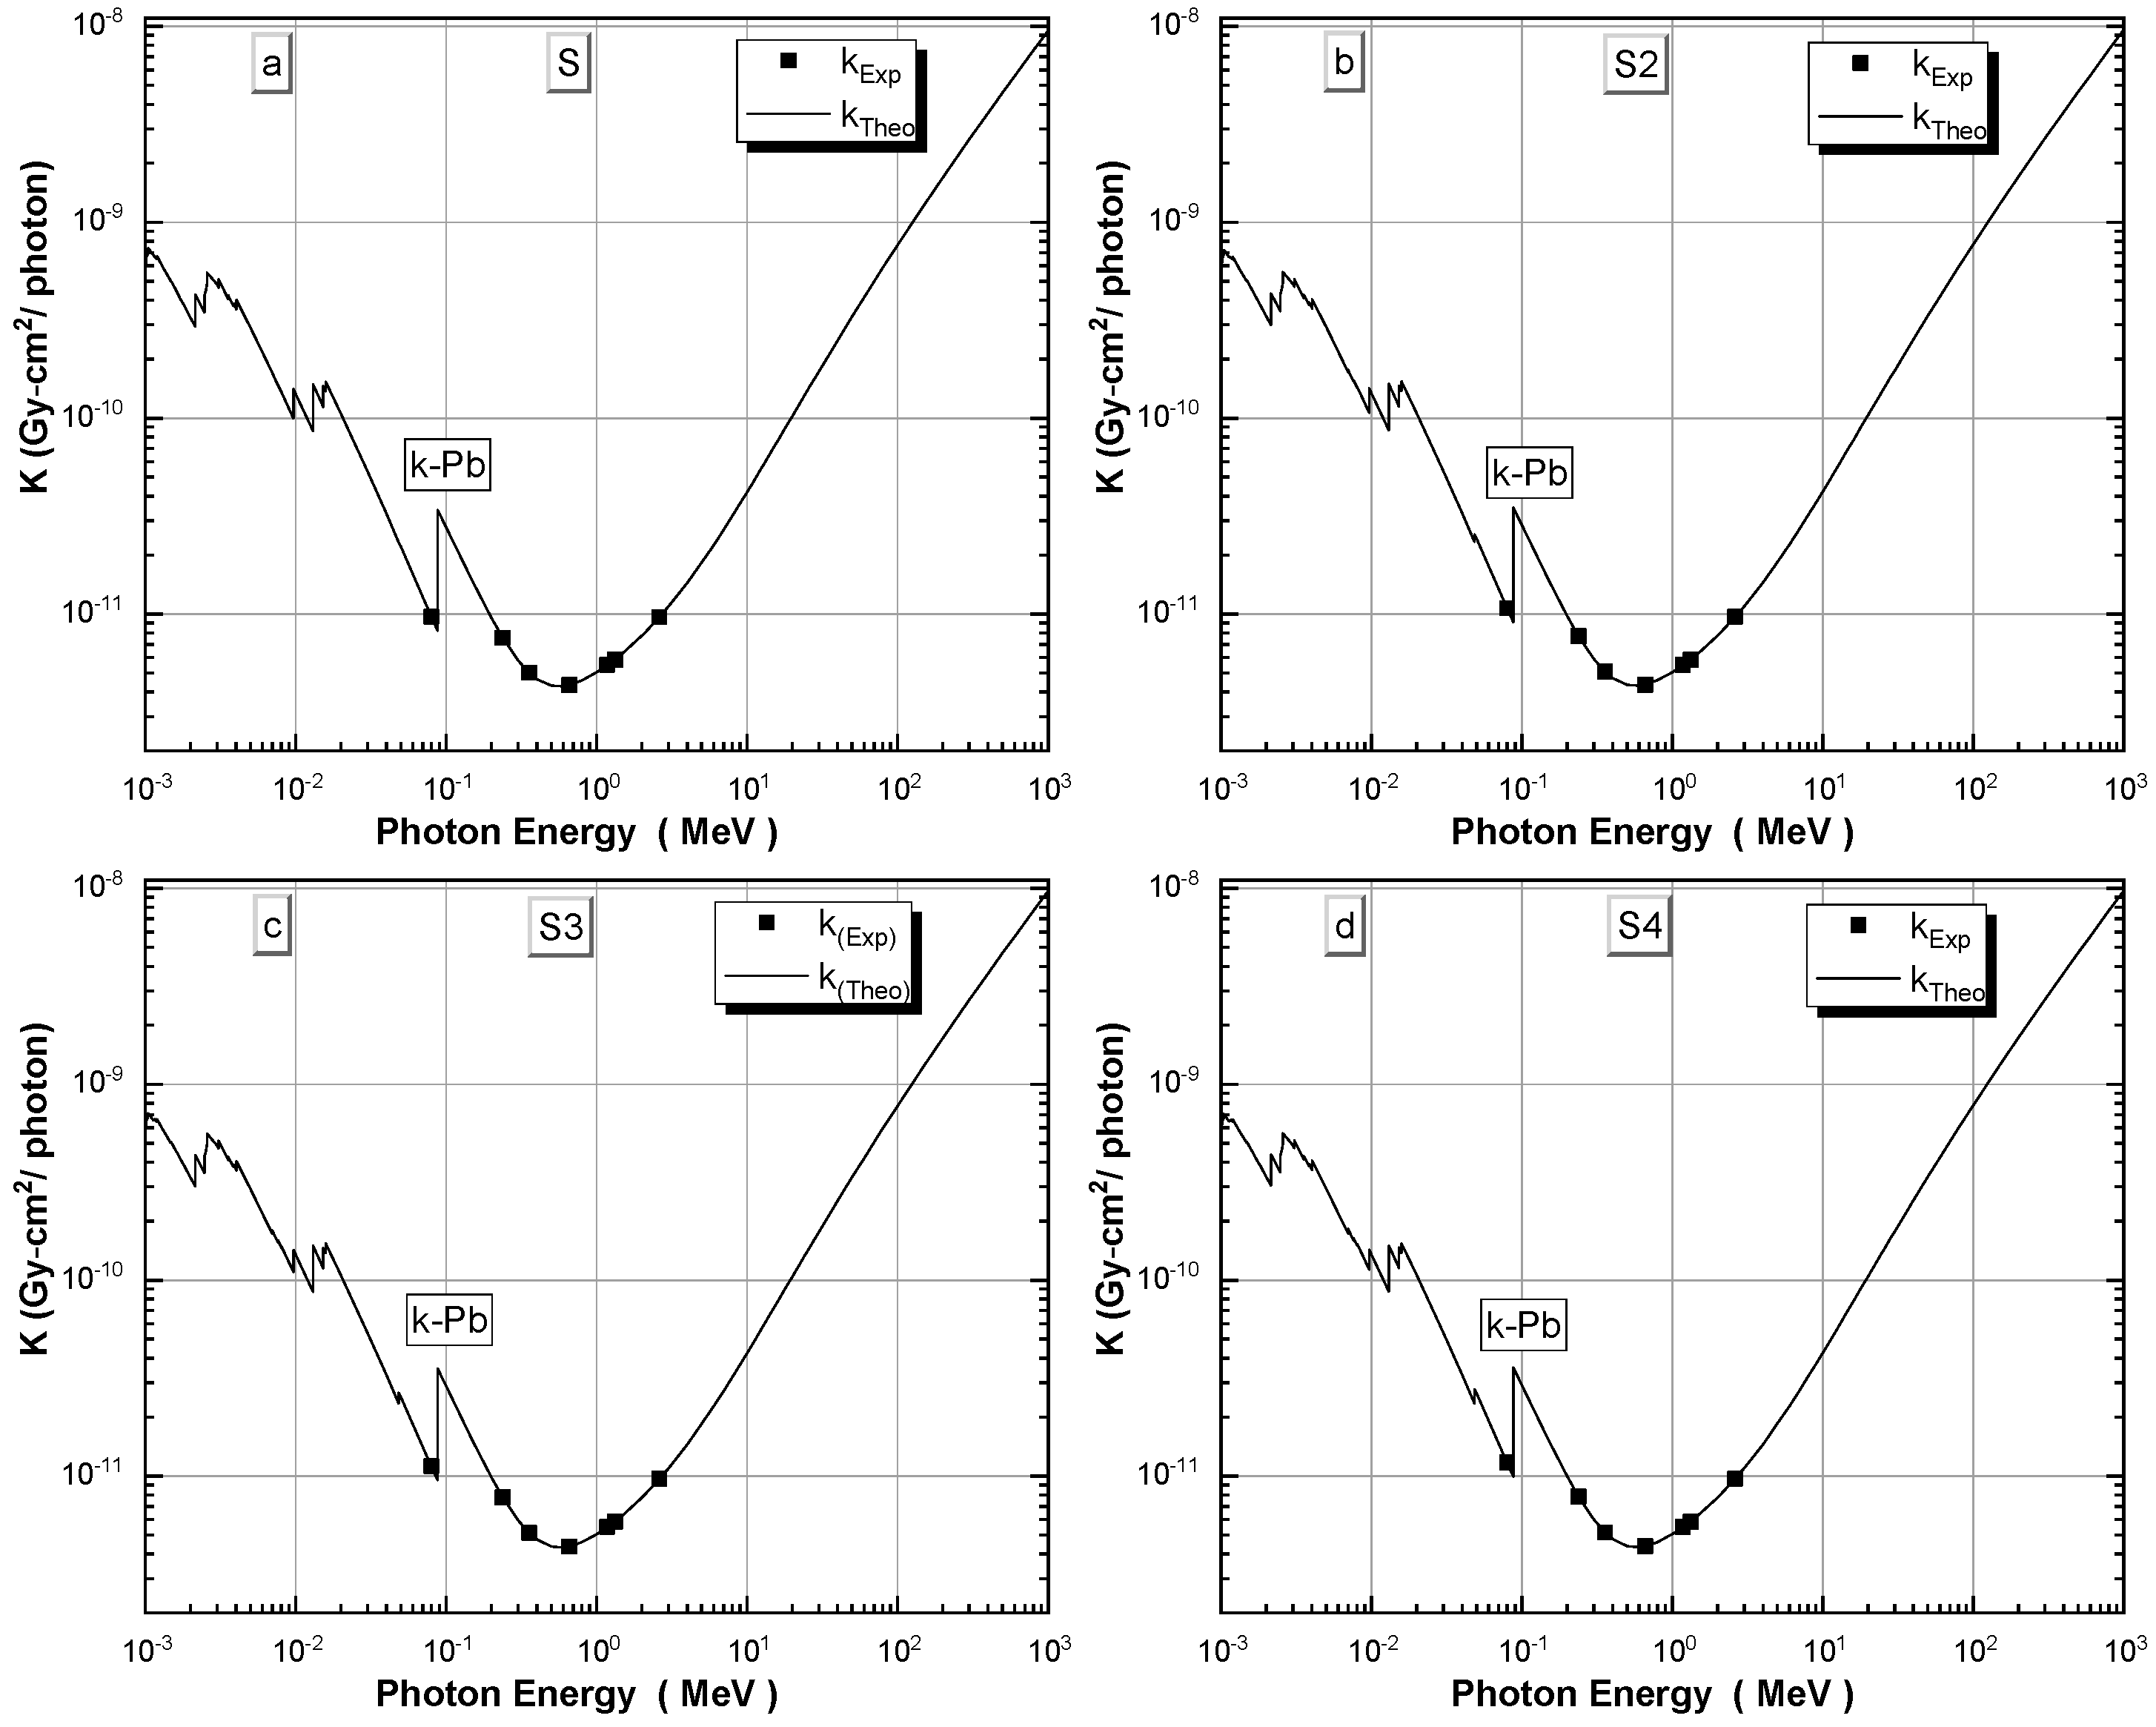
3.5. Experimental and Theoretical Kerma Coefficients of γ-ray

Experimental and theoretical γ-ray kerma coefficients were estimated based on empirical and theoretical mass attenuation coefficients. The results are illustrated in Figure 13a–d and listed in Table 5, showing excellent agreement between the experimental and theoretical data. The dominance regions of various partial photon interactions are reflected in the kerma curves, with higher values recorded at lower and higher energies where photoelectric effect and pair production processes predominate. The low-energy dependence of k is considerably complicated by the presence of absorption edges of constituents with intermediate and high atomic numbers.
A dip at 662 keV is observed in the results, which can be explained in terms of partial photon interaction probabilities. At 662 keV, these probabilities are 3%, 16%, and 81% for coherent scatter, photoelectric absorption, and incoherent scatter, respectively. Since coherent and incoherent scattering processes are two forms of photon interactions that occur with no and partial energy absorption, respectively, a low-energy fraction is available for deposition in the medium around this energy.

3.6. Fast Neutron Attenuation Characteristics

Fast neutron attenuation through matter occurs due to elastic and inelastic collisions with light and heavy nuclei, respectively. The macroscopic removal cross-section of fast neutron (ΣR cm−1) gives the probability of large angle scattering (elastic and inelastic), which removes the neutron from the penetrating neutron beam. The removal cross-section is closely related to the total attenuation coefficient Σt  Σ R 2 / 3 Σ t [54]. ΣR is computed by the elemental composition via the mixture rule, using the NXcom program [55]. Following this rule, the removal cross-section of a compound or homogenous mixture can be calculated using the following relation [54].
R = 1 n ρ i ( R / ρ ) i  
where ρ i is the partial density (the density the ith element as it appears in the glass system), and ( R / ρ ) i   is the mass removal cross-section of the element.
Although the NXcom program yields macroscopic removal cross-sections of 0.0227 cm−1 for ZnO, which are relatively higher than those of Eu2O3 (0.0159 cm−1), Table 6 indicates that the addition of Eu2O3 only marginally increases the neutron attenuation ability. This slight increase can be attributed to a small rise in the partial density of light constituents, such as oxygen and silicon. However, when compared to traditional neutron shielding materials such as dolomite–sand (DS), barite–barite (BB), magnetite–limonite (ML), and ilmenite–ilmenite (II) concrete samples [56], the current glass exhibits higher ΣR values than DS, BB, and ML concrete mixes, and it is comparable to II, as shown in Table 6.

4. Conclusions

In the current study, five glass networks were fabricated consisting of xEu2O3-(15-x) ZnO-10CaO-35PbO-40P2O5 where x = 0, 1, 2, 3, and 4 wt.% Eu2O3. The amorphous nature of the glass was confirmed by XRD results. The examination of the physical and structural characteristics revealed that replacing ZnO with Eu2O3 resulted in a linear increase in density and oxygen packing density, indicating a more compact packing of the glass system. The investigation of the optical properties in the visible and ultraviolet regions demonstrated that the glass system’s Eg and EU values were sensitive to the addition of Eu2O3, with variations indicating an improvement in the glass’s structural orderliness. Changes in the refractive index were explained by an increase in the continuity of the glassy matrix. This modification was further confirmed by changes in density and molar volume.
The replacement of ZnO with Eu2O3 improved the ability of prepared glasses to shield against gamma radiation, particularly at low and high photon energies. While using a single effective atomic number is acceptable, it is overly simplistic for many applications. Kerma curves indicated lower values at 662 keV photons, where the Compton scattering process accounts for at least 80%. The addition of europium did not result in a significant improvement against fast neutron shielding, but the current glass has a neutron shielding capacity greater than many radiation-shielding concrete mixes. The findings of this study demonstrate that Eu2O3 is a suitable replacement for Zn in enhancing the physical, structural, optical, and gamma-ray shielding capabilities.

Author Contributions

A.M.E.-K.: conceptualization, methodology, software, formal analysis, investigation, data curation, writing—original draft, supervision, funding acquisition; H.A.S.: experimental measurement formal analysis, investigation, editing and review; N.H.A.: software and data curation. All authors have read and agreed to the published version of the manuscript.

Funding

The authors extend their appreciation to the Deanship of Scientific Research at Imam Mohammad Ibn Saud Islamic University for funding this work through Research Group no. RG-21-09-43.

Institutional Review Board Statement

Not applicable.

Informed Consent Statement

Not applicable.

Data Availability Statement

The authors confirm that the data used to support the findings of this study are available within the article.

Conflicts of Interest

The authors declare no conflict of interest.

References

  1. Khor, S.; Talib, Z.; Yunus, W.M. Optical properties of ternary zinc magnesium phosphate glasses. Ceram. Int. 2012, 38, 935–940. [Google Scholar] [CrossRef]
  2. Das, S.; Srivastava, P.; Singh, N. Fast ion conducting phosphate glasses and glass ceramic composites: Promising materials for solid state batteries. J. Non-Cryst. Solids 2012, 358, 2841–2846. [Google Scholar] [CrossRef]
  3. Azizabadi, N.; Azar, P.A.; Tehrani, M.S.; Derakhshi, P. Synthesis and characteristics of gel-derived SiO2-CaO-P2O5-SrO-Ag2O-ZnO bioactive glass: Bioactivity, biocompatibility, and antibacterial properties. J. Non-Cryst. Solids 2021, 556, 120568. [Google Scholar] [CrossRef]
  4. Wahab, E.A.; El-Maaref, A.; Shaaban, K.; Börcsök, J.; Abdelawwad, M. Lithium cadmium phosphate glasses doped Sm3+ as a host material for near-IR laser applications. Opt. Mater. 2021, 111, 110638. [Google Scholar] [CrossRef]
  5. Li, X.; Xiao, Z.; Luo, M.; Dong, X.; Du, T.; Wang, Y. Low melting glasses in ZnO-Fe2O3-P2O5 system with high chemical durability and thermal stability for sealing or waste immobilization. J. Non-Cryst. Solids 2017, 469, 62–69. [Google Scholar] [CrossRef]
  6. Niraula, G.; Coaquira, J.A.; Aragon, F.H.; Villar, B.M.G.; Mello, A.; Garcia, F.; Muraca, D.; Zoppellaro, G.; Vargas, J.M.; Sharma, S.K. Tuning the shape, size, phase composition and stoichiometry of iron oxide nanoparticles: The role of phosphate anions. J. Alloys Compd. 2021, 856, 156940. [Google Scholar] [CrossRef]
  7. Dimitrov, V.; Sakka, S. Electronic oxide polarizability and optical basicity of simple oxides. I. J. Appl. Phys. 1996, 79, 1736–1740. [Google Scholar] [CrossRef]
  8. El-Egili, K.; Doweidar, H.; Moustafa, Y.; Abbas, I. Structure and some physical properties of PbO-P2O5 glasses. Phys. B Condens. Matter 2003, 339, 237–245. [Google Scholar] [CrossRef]
  9. Muñoz, F.; Rocherullé, J.; Ahmed, I.; Hu, L. Phosphate Glasses. In Springer Handbook of Glass; Musgraves, J.D., Hu, J., Calvez, L., Eds.; Springer: Cham, Switzerland, 2019; pp. 553–594. [Google Scholar] [CrossRef]
  10. Elalaily, N.A.; Zahran, A.H.; Sallam, O.I.; Eldin, F.M.E. Structure and electrical conductivity of ɤ-irradiated lead-phosphate glass containing MoO3. Appl. Phys. A 2019, 125, 128. [Google Scholar] [CrossRef]
  11. Chowdhury, S.; Mandal, P.; Ghosh, S. Structural properties of Er3+ doped lead zinc phosphate glasses. Mater. Sci. Eng. B 2019, 240, 116–120. [Google Scholar] [CrossRef]
  12. Sidek, H.; El-Mallawany, R.; Matori, K.; Halimah, M. Effect of PbO on the elastic behavior of ZnO-P2O5 glass systems. Results Phys. 2016, 6, 449–455. [Google Scholar] [CrossRef] [Green Version]
  13. Ali, A.A.; Shaaban, H.M.; Abdallah, A. Spectroscopic studies of ZnO borate-tellurite glass doped with Eu2O3. J. Mater. Res. Technol. 2018, 7, 240–247. [Google Scholar] [CrossRef]
  14. Chen, G.; Stump, N.; Haire, R.; Peterson, J. Study of the phase behavior of Eu2O3 under pressure via luminescence of Eu3+. J. Alloys Compd. 1992, 181, 503–509. [Google Scholar] [CrossRef]
  15. Zagrai, M.; Suciu, R.-C.; Rada, S.; Pică, M.; Pruneanu, S. Structural and optical properties of Eu3+ ions in lead glass for photonic applications. J. Non-Cryst. Solids 2021, 569, 120988. [Google Scholar] [CrossRef]
  16. Sharvani, K.N.; Ganesh, P.S.; Kaewkhao, J.; Intachai, N.; Kothan, S.; Rachniyom, W.; Pasha, A.; Rajaramakrishna, R. Optical and structural properties of Eu3+ doped MgO-Li2O-Na2O-BaO-B2O3 glasses for scintillating glass applications. Radiat. Phys. Chem. 2022, 199, 110295. [Google Scholar] [CrossRef]
  17. Teresa, P.E.; Naseer, K.; Piotrowski, T.; Marimuthu, K.; Aloraini, D.A.; Almuqrin, A.H.; Sayyed, M. Optical properties and radiation shielding studies of europium doped modifier reliant multi former glasses. Optik 2021, 247, 168005. [Google Scholar] [CrossRef]
  18. Esawii, H.A.; Salama, E.; El-Ahll, L.S.; Moustafa, M.; Saleh, H.M. High impact tungsten-doped borosilicate glass composite for gamma and neutron transparent radiation shielding. Prog. Nucl. Energy 2022, 150, 104321. [Google Scholar] [CrossRef]
  19. Ehab, M.; Salama, E.; Ashour, A.; Attallah, M.; Saleh, H.M. Optical Properties and Gamma Radiation Shielding Capability of Transparent Barium Borosilicate Glass Composite. Sustainability 2022, 14, 13298. [Google Scholar] [CrossRef]
  20. Saleh, H.M.; Bondouk, I.I.; Salama, E.; Esawii, H.A. Consistency and shielding efficiency of cement-bitumen composite for use as gamma-radiation shielding material. Prog. Nucl. Energy 2021, 137, 103764. [Google Scholar] [CrossRef]
  21. Eid, M.S.; Bondouk, I.; Saleh, H.M.; Omar, K.M.; Sayyed, M.; El-Khatib, A.M.; Elsafi, M. Implementation of waste silicate glass into composition of ordinary cement for radiation shielding applications. Nucl. Eng. Technol. 2022, 54, 1456–1463. [Google Scholar] [CrossRef]
  22. Reda, S.M.; Saleh, H.M. Calculation of the gamma radiation shielding efficiency of cement-bitumen portable container using MCNPX code. Prog. Nucl. Energy 2021, 142, 104012. [Google Scholar] [CrossRef]
  23. Bayoumi, T.; Reda, S.; Saleh, H. Assessment study for multi-barrier system used in radioactive borate waste isolation based on Monte Carlo simulations. Appl. Radiat. Isot. 2012, 70, 99–102. [Google Scholar] [CrossRef] [PubMed]
  24. Wagh, A.; Raviprakash, Y.; Kamath, S.D. Gamma rays interactions with Eu2O3 doped lead fluoroborate glasses. J. Alloys Compd. 2017, 695, 2781–2798. [Google Scholar] [CrossRef]
  25. Yin, S.; Wang, H.; Wang, S.; Zhang, J.; Zhu, Y. Effect of B2O3 on the Radiation Shielding Performance of Telluride Lead Glass System. Crystals 2022, 12, 178. [Google Scholar] [CrossRef]
  26. Amjad, R.J.; Sahar, M.; Ghoshal, S.; Dousti, M.R.; Arifin, R. Synthesis and characterization of Dy3+ doped zinc-lead-phosphate glass. Opt. Mater. 2013, 35, 1103–1108. [Google Scholar] [CrossRef]
  27. Dousti, M.R.; Amjad, R.J. Spectroscopic properties of Tb3+-doped lead zinc phosphate glass for green solid state laser. J. Non-Cryst. Solids 2015, 420, 21–25. [Google Scholar] [CrossRef]
  28. Dousti, M.R.; Ghoshal, S.; Amjad, R.J.; Sahar, M.; Nawaz, F.; Arifin, R. Structural and optical study of samarium doped lead zinc phosphate glasses. Opt. Commun. 2013, 300, 204–209. [Google Scholar] [CrossRef]
  29. Ma, C.; Jiang, S.; Zhou, X. Energy transfer from Ce3+ to Tb3+ and Eu3+ in zinc phosphate glasses. J. Rare Earths 2010, 28, 40–42. [Google Scholar] [CrossRef]
  30. Segawa, H.; Hirosaki, N.; Ohki, S.; Deguchi, K.; Shimizu, T. Exploration of zinc phosphate glasses dispersed with Eu-doped SiAlON for white LED applications. Opt. Mater. 2013, 35, 2677–2684. [Google Scholar] [CrossRef]
  31. Zakaly, H.M.; Rashad, M.; Tekin, H.; Saudi, H.; Issa, S.A.; Henaish, A. Synthesis, optical, structural and physical properties of newly developed dolomite reinforced borate glasses for nuclear radiation shielding utilizations: An experimental and simulation study. Opt. Mater. 2021, 114, 110942. [Google Scholar] [CrossRef]
  32. Sikora, P.; El-Khayatt, A.M.; Saudi, H.; Chung, S.-Y.; Stephan, D.; Elrahman, M.A. Evaluation of the effects of bismuth oxide (Bi2O3) micro and nanoparticles on the mechanical, microstructural and γ-ray/neutron shielding properties of Portland cement pastes. Constr. Build. Mater. 2021, 284, 122758. [Google Scholar] [CrossRef]
  33. Gerward, L.; Guilbert, N.; Jensen, K.B.; Levring, H. WinXCom—A program for calculating X-ray attenuation coefficients. Radiat. Phys. Chem. 2004, 71, 653–654. [Google Scholar] [CrossRef]
  34. Murty, R.C. Effective Atomic Numbers of Heterogeneous Materials. Nature 1965, 207, 398–399. [Google Scholar] [CrossRef]
  35. Mayneord, W.V. The significance of the röntgen. Acta Int. Union Against Cancer 1937, 3, 271–282. [Google Scholar]
  36. Sellakumar, P.; Samuel, E.J.J.; Supe, S.S. Water equivalence of polymer gel dosimeters. Radiat. Phys. Chem. 2007, 76, 1108–1115. [Google Scholar] [CrossRef]
  37. Hine, G.J. Secondary electron emission and effective atomic numbers. Nucleon. US Ceased Publ. 1952, 10, 1. [Google Scholar]
  38. Tsai, C.M.; Cho, Z.H. Physics of contrast mechanism and averaging effect of linear attenuation coefficients in a computerized transverse axial tomography (CTAT) transmission scanner. Phys. Med. Biol. 1976, 21, 544–559. [Google Scholar] [CrossRef]
  39. Puumalainen, P.; Olkkonen, H.; Sikanen, P. Assessment of fat content of liver by a photon scattering technique. Int. J. Appl. Radiat. Isot. 1977, 28, 785–787. [Google Scholar] [CrossRef]
  40. Manninen, S.; Koikkalainen, S. Determination of the effective atomic number using elastic and inelastic scattering of γ-rays. Int. J. Appl. Radiat. Isot. 1984, 35, 965–968. [Google Scholar] [CrossRef]
  41. Akkurt, I.; El-Khayatt, A. The effect of barite proportion on neutron and gamma-ray shielding. Ann. Nucl. Energy 2013, 51, 5–9. [Google Scholar] [CrossRef]
  42. El-Khayatt, A. Semi-empirical determination of gamma-ray kerma coefficients for materials of shielding and dosimetry from mass attenuation coefficients. Prog. Nucl. Energy 2017, 98, 277–284. [Google Scholar] [CrossRef]
  43. De, M.; Jana, S.; Mitra, S. Structural and spectroscopic characteristics of Eu3+ embedded titanium lead phosphate glasses for red luminescence. Solid State Sci. 2021, 114, 106560. [Google Scholar] [CrossRef]
  44. Saudi, H.A.; El-Kameesy, S.U. Investigation of modified zinc borate glasses doped with BaO as a nuclear radiation-shielding material. Radiat. Detect. Technol. Methods 2018, 2, 44. [Google Scholar] [CrossRef]
  45. Znášik, P.; Jamnick, M. Non-Crystalline Solids Preparation, infrared spectra and structure of glasses in the system CuC1-Cu2O-(P2O5 + MoO3). J. Non-Cryst. Solids 1992, 146, 74–80. [Google Scholar] [CrossRef]
  46. Abo-Naf, S.; El-Amiry, M.; Abdel-Khalek, A. FT-IR and UV-Vis optical absorption spectra of γ-irradiated calcium phosphate glasses doped with Cr2O3, V2O5 and Fe2O3. Opt. Mater. 2008, 30, 900–909. [Google Scholar] [CrossRef]
  47. ElBatal, F.H.; Ouis, M.A.; Morsi, R.M.M.; Marzouk, S.Y. Interaction of gamma rays with some sodium phosphate glasses containing cobalt. J. Non-Cryst. Solids 2010, 356, 46–55. [Google Scholar] [CrossRef]
  48. Abid, M.; Et-Tabirou, M.; Hafid, M. Glass forming region, ionic conductivity and infrared spectroscopy of vitreous sodium lead mixed phosphates. Mater. Res. Bull. 2001, 36, 407–421. [Google Scholar] [CrossRef]
  49. Fayad, A.M.; Ouis, M.A.; ElBatal, F.H.; ElBatal, H.A. Shielding Behavior of Gamma-Irradiated MoO3 or WO3-Doped Lead Phosphate Glasses Assessed by Optical and FT Infrared Absorption Spectral Measurements. Silicon 2017, 10, 1873–1879. [Google Scholar] [CrossRef]
  50. Maity, A.; Jana, S.; Ghosh, S.; Sharma, S. Spectroscopic investigation on Europium (Eu3+) doped strontium zinc lead phosphate glasses with varied ZnO and PbO compositions. J. Non-Cryst. Solids 2020, 550, 120322. [Google Scholar] [CrossRef]
  51. Monisha, M.; Sayyed, M.I.; Mazumder, N.; Arayro, J.; Kamath, S.D. Color tuneability behaviour and energy transfer analysis on Dy3+-Eu3+ co-doped glasses for NUV-WLEDs application. J. Mater. Sci. Mater. Electron. 2023, 34, 487. [Google Scholar] [CrossRef]
  52. Abul-Magd, A.A.; Abu-Khadra, A.S.; Taha, A.M.; Basry, A. Influence of La3+ ions on the structural, optical and dielectric properties and ligand field parameters of Fe3+ hybrid borate glasses. J. Non-Cryst. Solids 2023, 599, 121981. [Google Scholar] [CrossRef]
  53. Salem, S.M.; Abou-Elnasr, T.Z.; El-Gammal, W.A.; Mahmoud, A.S.; Saudi, H.A.; Mostafa, A.G. Optical Parameters and Electrical Transport Properties of Some Barium-Sodium-Borate Glasses Doped Bismuth Oxide. Am. J. Aerosp. Eng. 2018, 5, 1–8. [Google Scholar] [CrossRef] [Green Version]
  54. El-Samrah, M.; El-Mohandes, A.; El-Khayatt, A.; Chidiac, S. MRCsC: A user-friendly software for predicting shielding effectiveness against fast neutrons. Radiat. Phys. Chem. 2021, 182, 109356. [Google Scholar] [CrossRef]
  55. El-Khayatt, A. NXcom—A program for calculating attenuation coefficients of fast neutrons and gamma-rays. Ann. Nucl. Energy 2011, 38, 128–132. [Google Scholar] [CrossRef]
  56. Abdo, A.E.-S. Calculation of the cross-sections for fast neutrons and gamma-rays in concrete shields. Ann. Nucl. Energy 2002, 29, 1977–1988. [Google Scholar] [CrossRef]
Figure 1. The obtained glass samples.
Sustainability 15 09245 g001
Figure 2. The schematic arrangement of the experimental setup.
Sustainability 15 09245 g002
Figure 3. Graph ln (T) versus thickness for glass sample S1. Irradiated with 2.614 MeV photon energy. The linear attenuation coefficient equals the slope of the fitting line.
Sustainability 15 09245 g003
Figure 4. XRD pattern of three samples of prepared glasses as a function of Eu2O3 content.
Sustainability 15 09245 g004
Figure 5. (a) Infrared spectra of lead phosphate glass doped with different concentrations of Eu2O3. (b) Deconvoluted spectrum using Gaussian functions of lead phosphate glass without Eu2O3.
Sustainability 15 09245 g005aSustainability 15 09245 g005b
Figure 6. UV-Visible absorption spectra of (x) Eu2O3-(15-x) ZnO-10CaO-35Pb3O4-40P2O5 glasses.
Sustainability 15 09245 g006
Figure 7. Plot of (αhν)1/2 as a function of hν for xEu2O3-(15-x) ZnO-10CaO-35PbO-40P2O5 glasses.
Sustainability 15 09245 g007
Figure 8. Variation of the optical energy gap, Eg (eV) and EU (eV) with wt.% of Eu2O3.
Sustainability 15 09245 g008
Figure 9. Variation of refractive index, n, and optical conductivity ( σ opt ) (S cm−1) with wt.% of Eu2O3.
Sustainability 15 09245 g009
Figure 10. Transmittance (%) against the thickness of S and S4 samples at different energies: (a) 0.08 MeV, with transmission 0.1–13.4%, and (b) 2.614 MeV, with transmission 77.3–93%.
Sustainability 15 09245 g010
Figure 11. (a) Zeff of the S sample and (b) ( Z eff ) R ; the ratio of Z eff values of S4 glass with those of the S glass, as a function of energy. The upper and lower dashed lines indicate the Hine’s Zeff [37] and the mean atomic number, respectively.
Sustainability 15 09245 g011
Figure 12. (a) Neff of the S sample and (b) ( N eff ) R ; the ratio of N eff values of S4 glass with those of the S glass, as a function of energy. The lower dashed line indicates the mean electron density.
Sustainability 15 09245 g012
Figure 13. Experimental and theoretical kerma coefficients of glasses: (a) S, (b) S2, (c) S3, and (d) S4 as a function of photon energy. The squares are experimental data. The discontinuous jumps in the low-energy region correspond to photoelectric absorption edges.
Sustainability 15 09245 g013
Table 1. Chemical composition (mole% and wt.%) of the prepared glasses.
Constituent S x = 0 S 1 x = 1 S 2 x = 2 S 3 x = 3 S 4 x = 4
mole%wt.%mole%wt.%mole%wt.%mole%wt.%mole%wt.%
PbO19.2034.4619.4334.4619.6734.4619.9134.4620.1634.46
CaO22.3610.0822.6310.0822.9010.0823.1810.0823.4710.08
P2O535.3340.3335.7640.3336.1940.3336.6440.3337.0940.33
ZnO23.1015.1221.8214.1220.5113.1119.1612.1017.7811.09
Eu2O3 0.361.010.732.021.113.021.504.03
Table 2. The measured density, molar volume, oxygen molar volume, and oxygen packing density of the prepared glasses.
Glassρ aMVMVOOPD
g/cm3g/molecm3/molemole/cm3
S5.04152.1463.0426.1279.95
S15.058154.8663.5326.0779.61
S25.076157.5963.5425.6279.89
S35.094160.3263.7325.3479.93
S45.112163.0563.9025.0480.00
a The uncertainty in the density values was determined from five measurements for each composition and in the calculated VM, VO, and OPD values less than ±0.1%.
Table 3. Mean atomic mass, mean atomic number, mean electron density, and single-valued effective atomic numbers calculated by six different empirical formulas of the glass samples.
Sample˂A˃˂Z˃˂N˃ × 1026[34][35][36][37][38][40]
S32.3114.892.7857.553.754.857.256.345.5
S132.4214.932.7757.753.955.057.456.556.5
S232.5314.962.7757.854.155.257.656.646.1
S332.6415.002.7758.054.355.457.756.846.4
S432.7515.042.7758.254.555.657.957.046.6
Table 4. Experimental and calculated values of μm (cm2/g) for the prepared glass samples; the experimental error ≤ ±3%, and the deviation (Div.) is reported in %.
E(γ)
MeV
SS1S2S3S4
μmμmμmμmμm
Exp.Theo.Div.Exp.Theo.Div.Exp.Theo.Div.Exp.Theo.Div.Exp.Theo.Div.
0.080.9881.0051.71.0301.0461.51.0701.0861.51.1101.1261.51.1501.1671.5
0.2380.2940.2981.40.2960.3001.40.2980.3021.40.3000.3041.40.3020.3061.4
0.3560.1600.1610.60.1600.1621.10.1610.1620.90.1620.1630.70.1620.1641.1
0.6620.0870.0870.10.0870.0870.30.0870.0870.30.0870.0870.30.0870.0880.3
1.1730.0590.059−0.40.0590.059−0.20.0590.059−0.20.0590.059−0.20.0590.059−0.2
1.3250.0550.0550.50.0550.0550.30.0550.0550.40.0550.0550.50.0550.0550.5
2.6140.0400.0400.20.0400.0400.00.0400.0400.10.0400.0400.10.0400.0400.1
Table 5. Experimental and theoretical kerma coefficients (pGy-cm2/photon) of the prepared glasses.
EnergySS1S2S3S4
Theo.Exp.Theo.Exp.Theo.Theo.Exp.Theo.Exp.Theo.
0.0809.99.710.410.210.910.711.411.211.911.7
0.2387.77.67.87.77.97.77.97.88.07.9
0.3565.15.15.15.15.25.15.25.25.25.2
0.6624.44.44.44.44.44.44.44.44.44.4
1.1735.55.55.55.55.55.55.55.55.55.5
1.3255.95.85.95.95.95.95.95.95.95.9
2.6149.79.79.79.79.79.79.79.79.79.7
Table 6. Macroscopic effective removal cross-section (ΣR cm−1) of the studied samples based on the contribution of each element.
Elem.SS1S2S3S4
PDΣR ρ i ΣR ρ i ΣR ρ i ΣR ρ i ΣR
O1.6030.06491.6060.06501.6090.06511.6110.06531.6140.0654
Si0.8320.02450.8350.02460.8380.02470.8410.02480.8440.0249
Ca0.3600.00880.3610.00880.3630.00880.3640.00880.3650.0089
Zn0.6070.01110.5690.01040.5300.00970.4910.00900.4520.0083
Eu 0.0440.00050.0880.00110.1320.00160.1770.0021
Pb1.6380.01701.6430.01711.6490.01721.6550.01721.6610.0173
ΣR0.1264 0.1265 0.1266 0.1267 0.1268
ΣR [56] DS0.1011BB0.1253ML0.1260II0.1280
Disclaimer/Publisher’s Note: The statements, opinions and data contained in all publications are solely those of the individual author(s) and contributor(s) and not of MDPI and/or the editor(s). MDPI and/or the editor(s) disclaim responsibility for any injury to people or property resulting from any ideas, methods, instructions or products referred to in the content.

