
Exploring the Relationship between Land Use and Congestion Source in Xi’an: A Multisource Data Analysis Approach

Abstract
:1. Introduction
2. Literature Review
2.1. Tracing the Source of Congestion
2.2. Land Use
2.3. Research Gap and Potential Contributions
3. Data
3.1. Data Description
- (1)
- (2)
- The CSD are provided by “Smart Footprint” company, which is affiliated with China Unicom, one of the largest telecom operators in China. It records anonymous people’s travel trajectory in the way of road nodes. Data attributes include anonymous ID, monthly trip number, path ID, path node sequence, path node number, time passed by node pair, next path node number, and month (partition field) (Table 1).
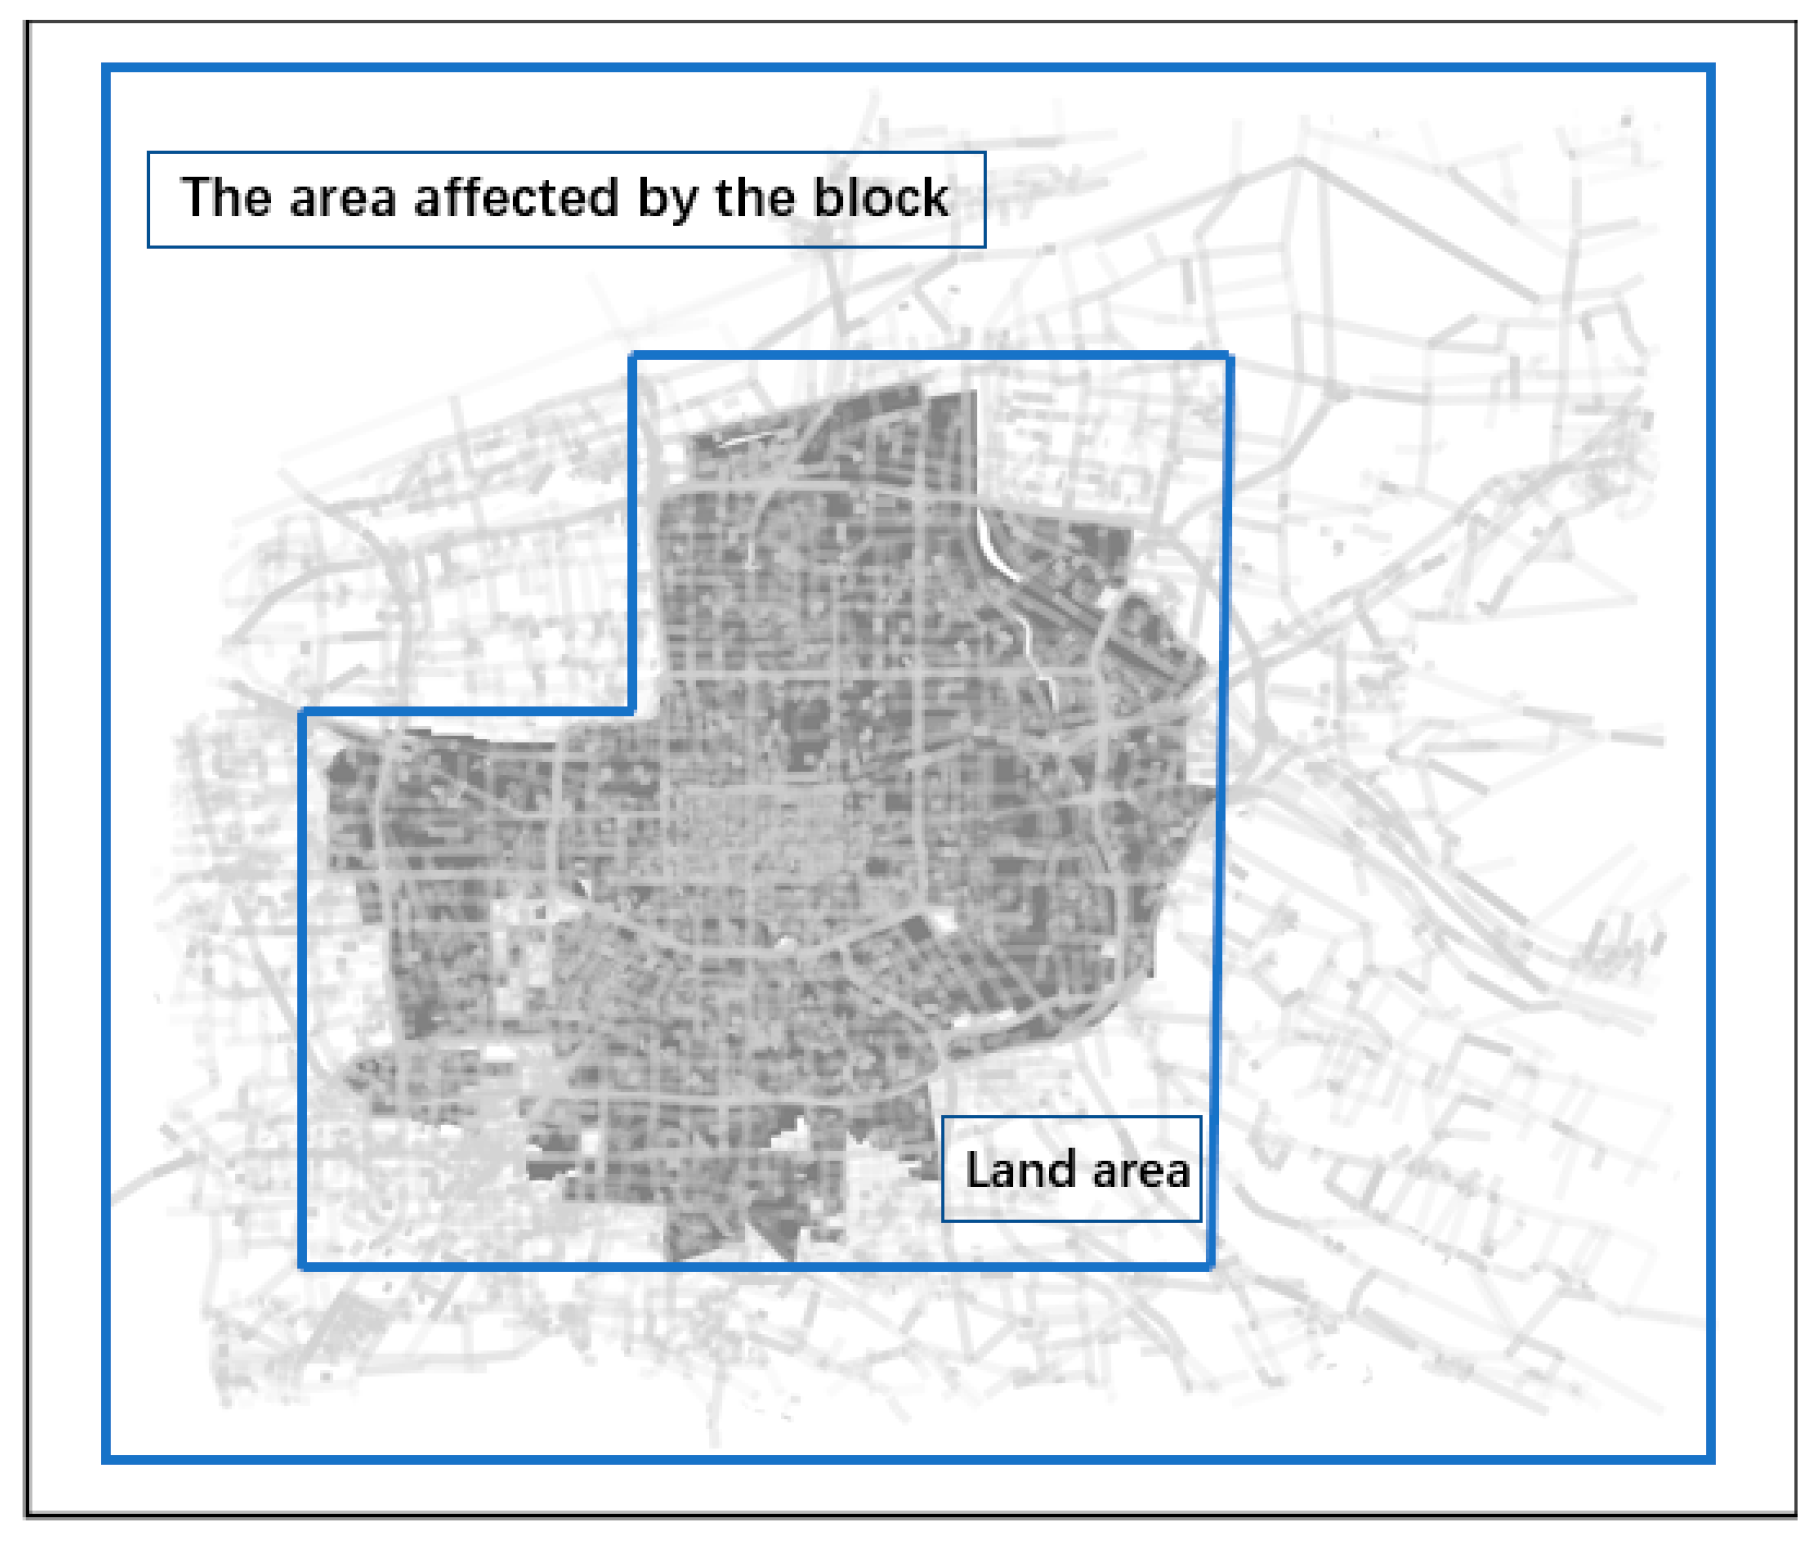
3.2. Case Selection
3.3. Data Preprocess
4. Source Tracing and Land-Use Analysis
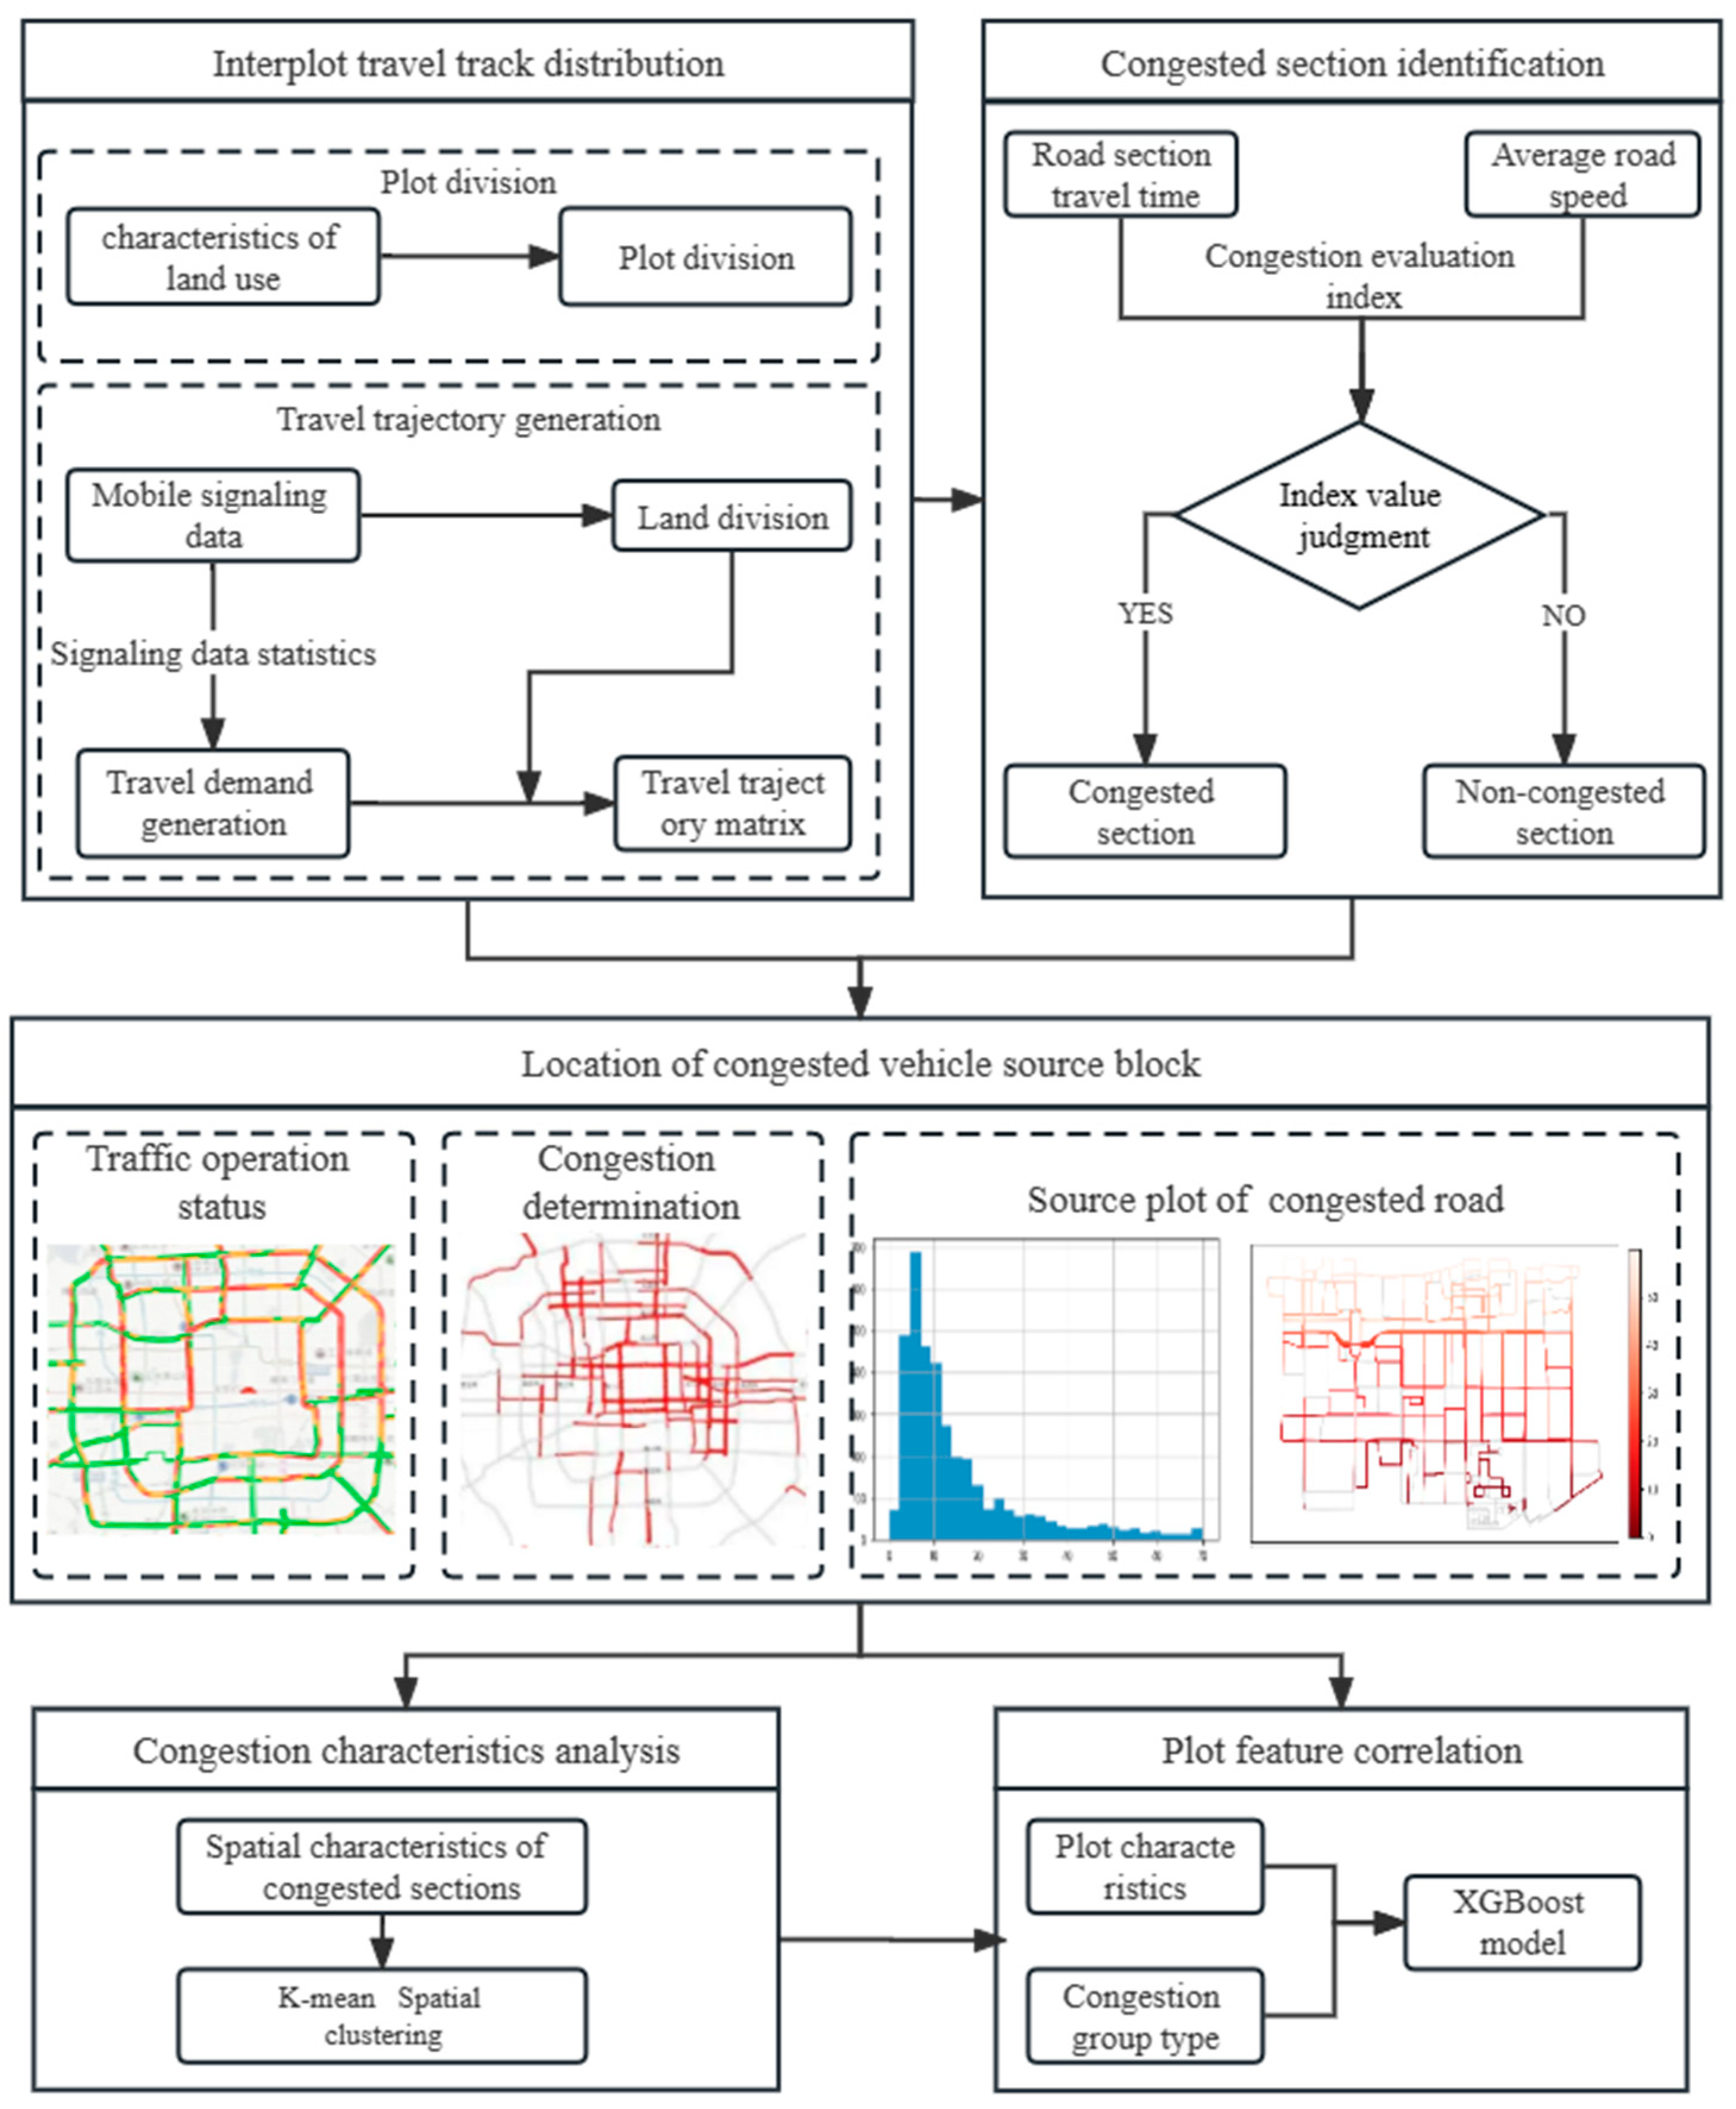
4.1. Methodology Framework
4.2. Congestion Traceability Method
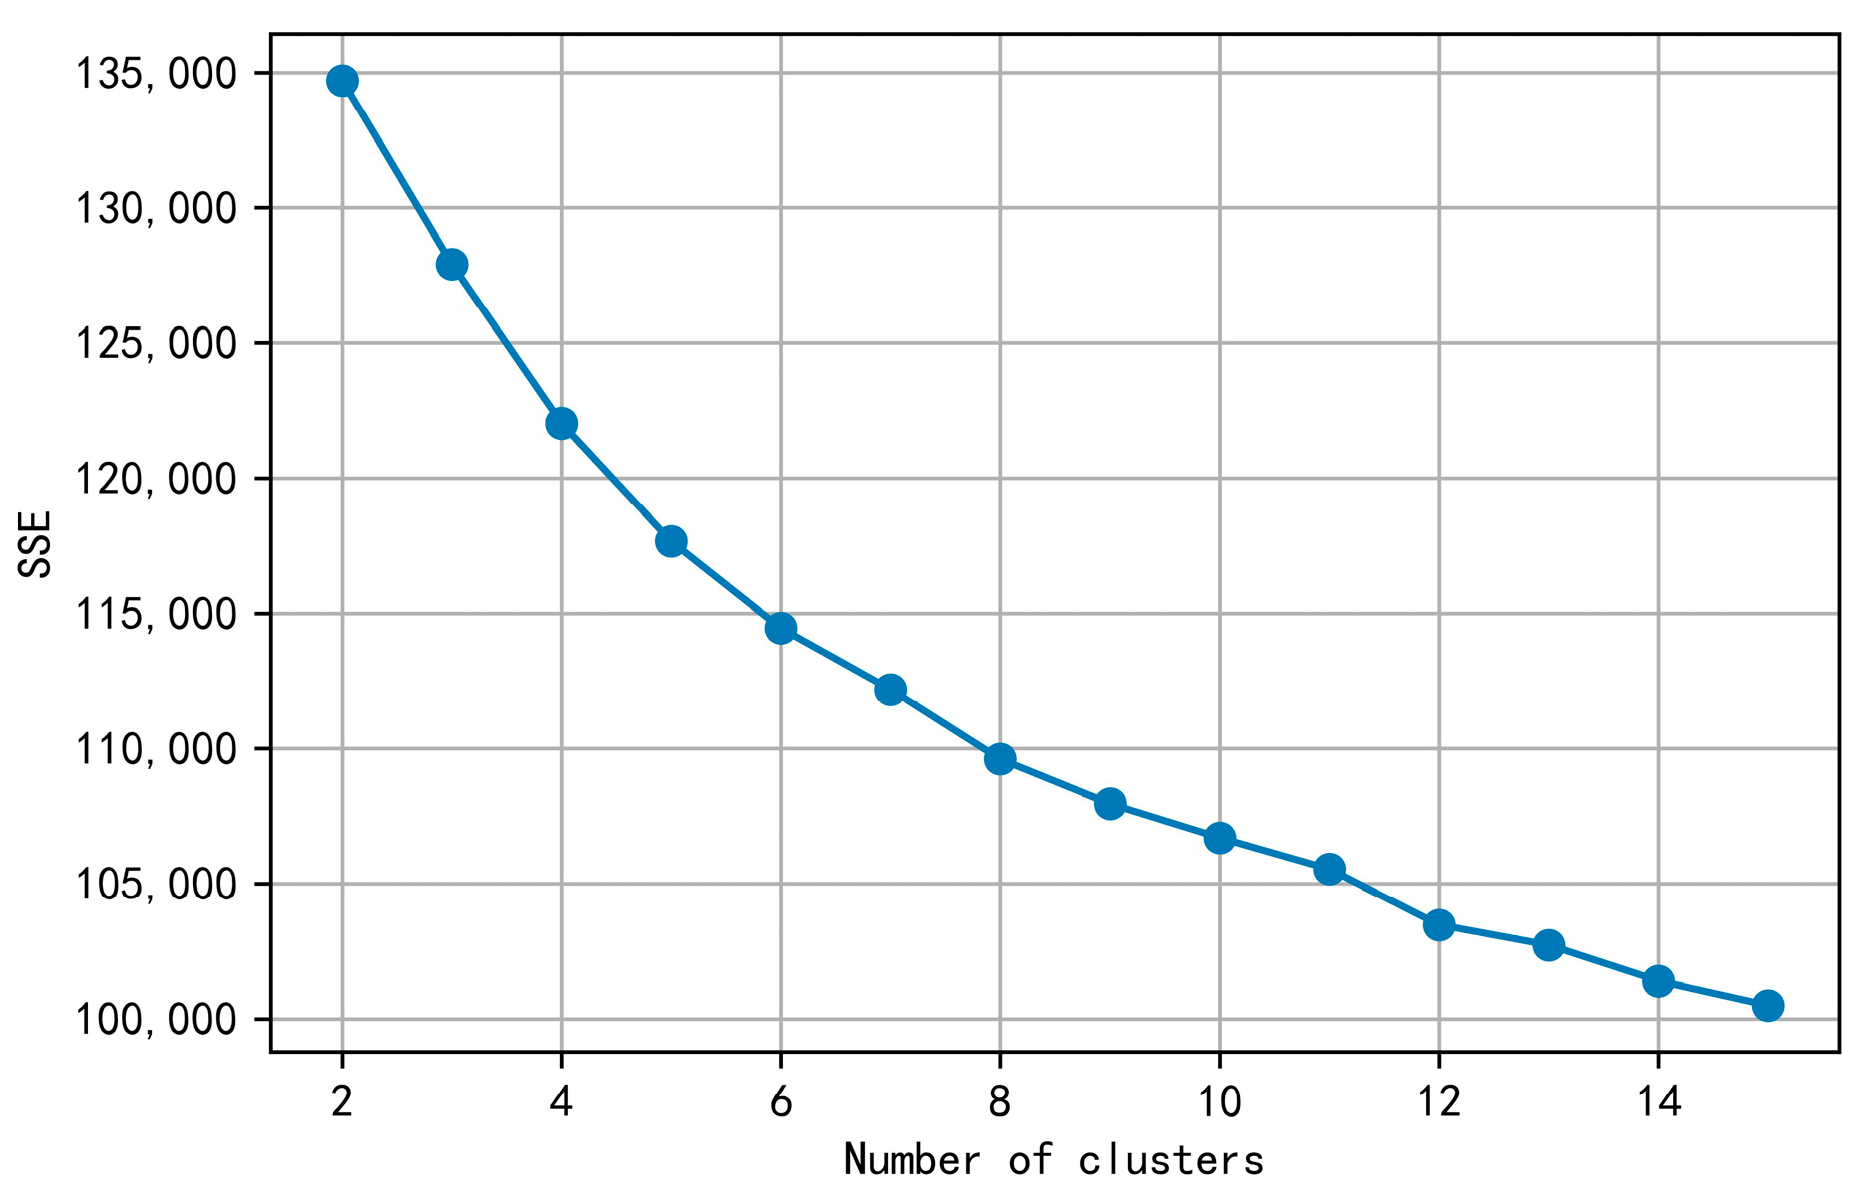
4.3. Clustering Method
4.4. XGBoost Methods
5. Case Study
5.1. Case Design
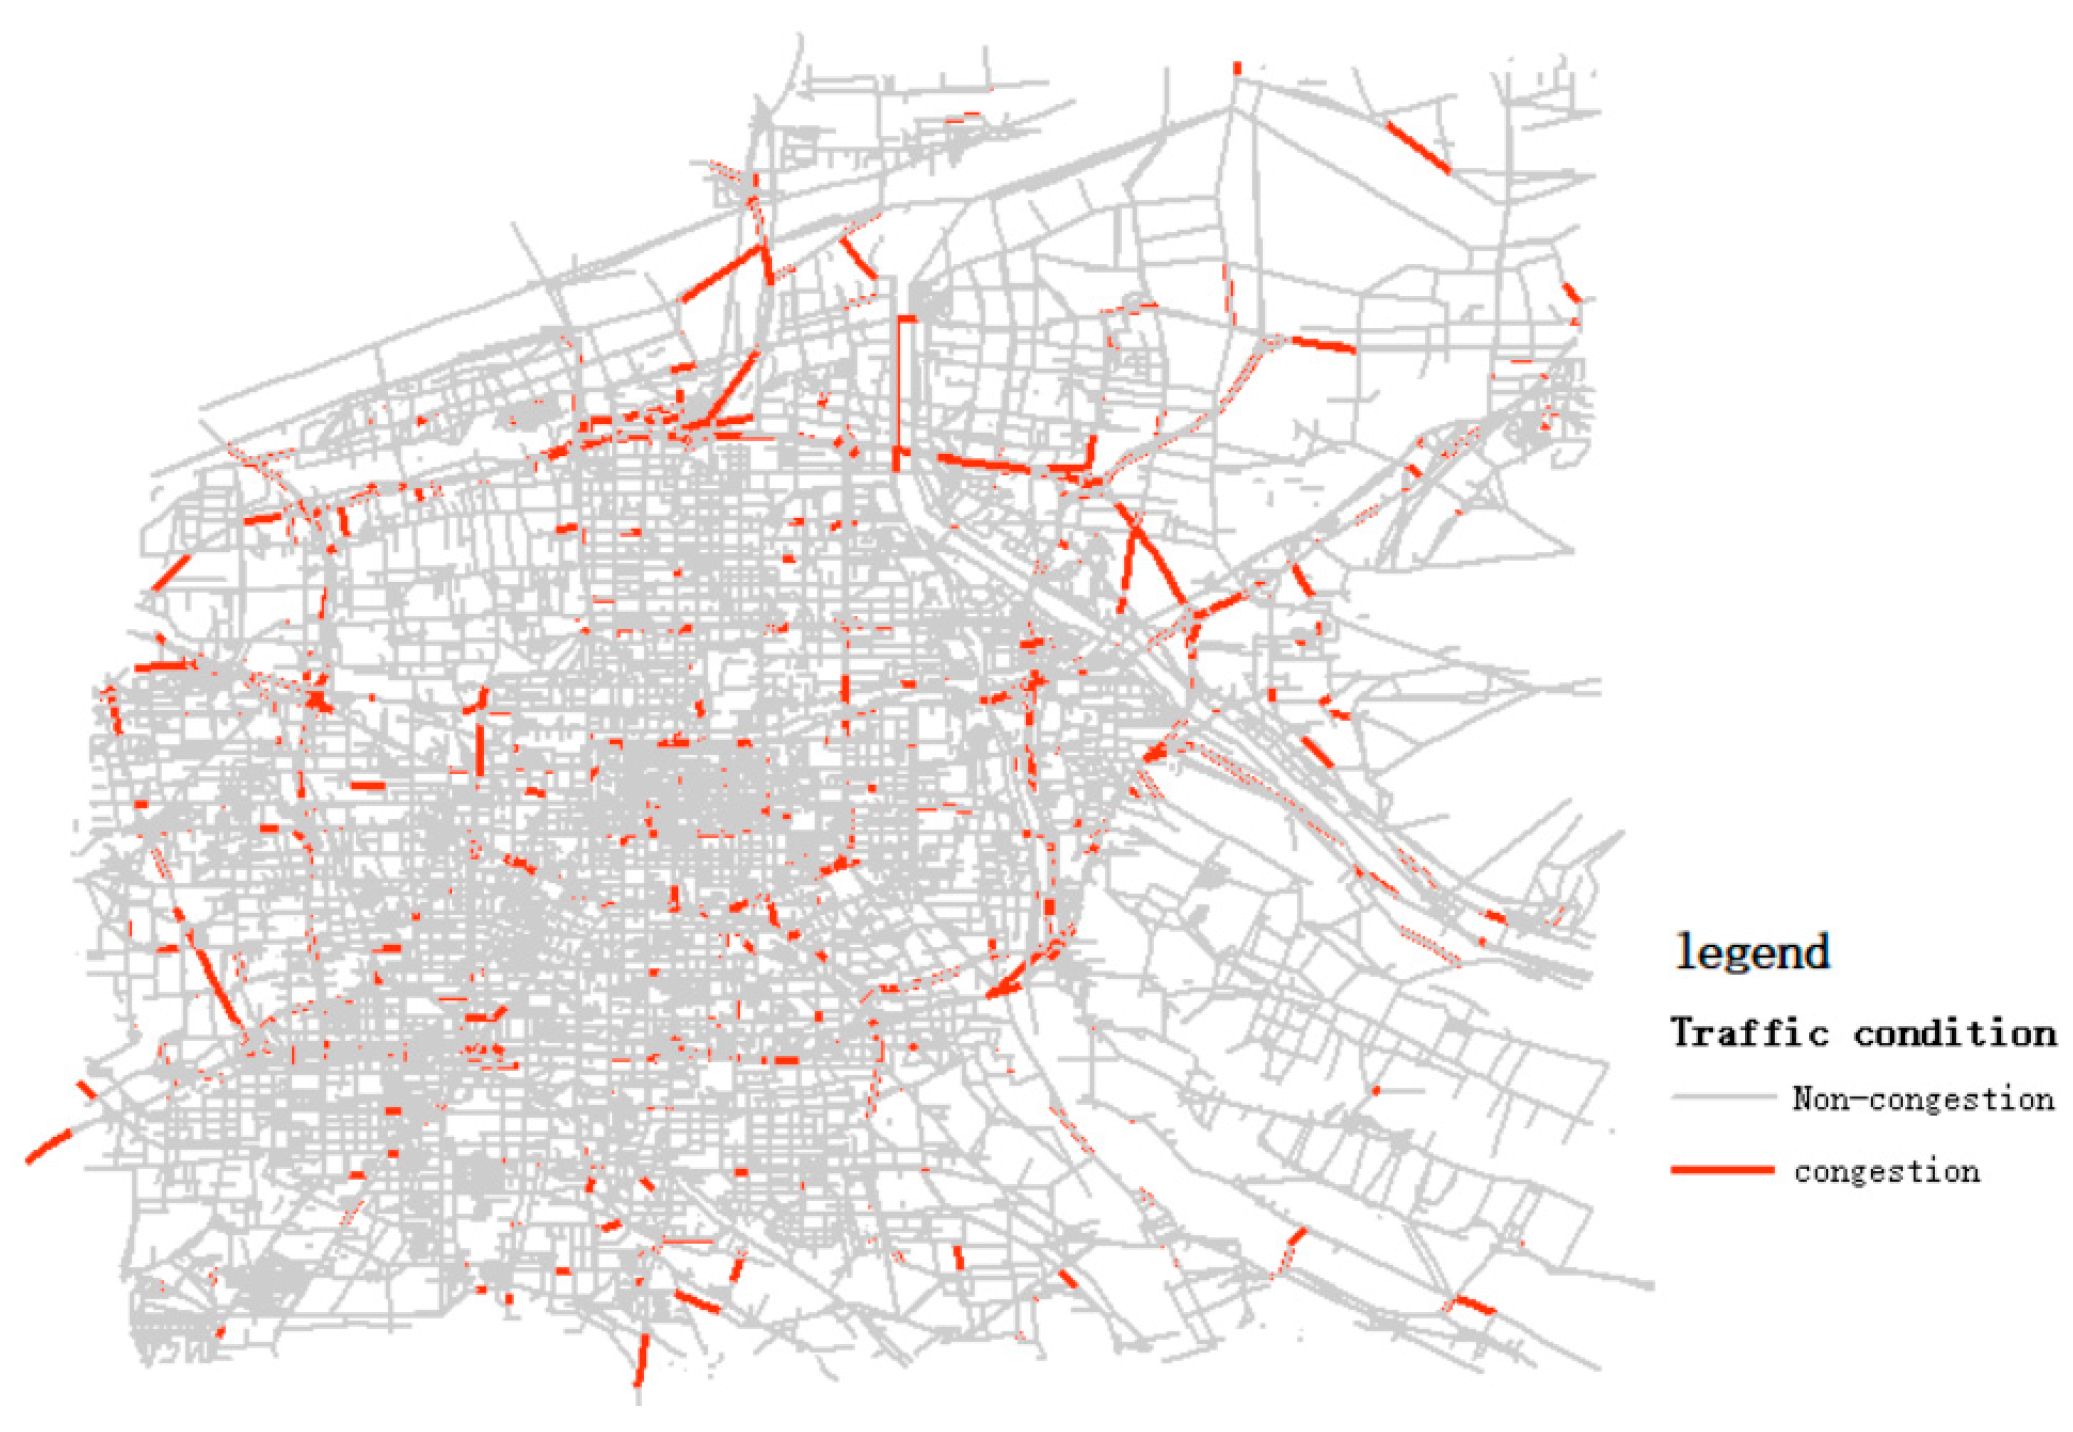
5.2. Case Result
5.3. Correlation between Land Use and Congestion Patterns
6. Conclusions
Author Contributions
Funding
Data Availability Statement
Conflicts of Interest
References
- Traffic Congestion Costs U.S. Cities Billions of Dollars Every Year [Infographic]. Available online: https://www.forbes.com/sites/niallmccarthy/2020/03/10/traffic-congestion-costs-us-cities-billions-of-dollars-every-year-infographic/?sh=420f07404ff8 (accessed on 5 June 2023).
- The Cities with the Biggest Traffic Jams in China. Available online: https://www.statista.com/chart/16998/the-cities-with-the-biggest-traffic-jams-in-china/ (accessed on 5 June 2023).
- Chang, Y.S.; Lee, Y.J.; Choi, S.S.B. Is there more traffic congestion in larger cities? -Scaling analysis of the 101 largest U.S. urban centers. Transp. Policy 2017, 59, 54–63. [Google Scholar] [CrossRef]
- Wang, P.; Hunter, T.; Bayen, A.M.; Schechtner, K.; Gonzalez, M.C. Understanding Road Usage Patterns in Urban Areas. Sci. Rep. 2012, 2, 1001. [Google Scholar] [CrossRef] [Green Version]
- Wang, C.C.; Xu, Z.Z.; Du, R.H.; Li, H.F.; Wang, P. A vehicle routing model based on large-scale radio frequency identification data. J. Intell. Transp. Syst. 2020, 24, 142–155. [Google Scholar] [CrossRef]
- Wang, P.; Wang, C.; Lai, J.; Huang, Z.; Ma, J.; Mao, Y. Traffic control approach based on multi-source data fusion. IET Intell. Transp. Syst. 2019, 13, 764–772. [Google Scholar] [CrossRef]
- Wang, C.; Wang, P. Data, Methods, and Applications of Traffic Source Prediction. In Transportation Analytics in the Era of Big Data; Ukkusuri, S.V., Yang, C., Eds.; Springer International Publishing: Cham, Switzerland, 2019; pp. 105–120. [Google Scholar]
- Wang, P.; Lu, H.; Tan, Q.; Xiong, Y.; Mao, Y.; Li, L. A data fusion approach for locating driver sources using mobile phone signaling data and taxi GPS data. J. Harbin Inst. Technol. 2018, 50, 96–100, 107. [Google Scholar]
- Wang, J.; Wei, D.; He, K.; Gong, H.; Wang, P. Encapsulating Urban Traffic Rhythms into Road Networks. Sci. Rep. 2014, 4, 4141. [Google Scholar] [CrossRef] [Green Version]
- He, K.; Xu, Z.Z.; Wang, P.; Deng, L.B.; Tu, L. Congestion Avoidance Routing Based on Large-Scale Social Signals. IEEE Trans. Intell. Transp. Syst. 2016, 17, 2613–2626. [Google Scholar] [CrossRef]
- Li, M.L.; Yang, H.; Guo, B.; Dai, J.J.; Wang, P. Driver Source-Based Traffic Control Approach for Mitigating Congestion in Freeway Bottlenecks. J. Adv. Transp. 2022, 2022, 3536979. [Google Scholar] [CrossRef]
- Yue, W.; Li, C.; Chen, Y.; Duan, P.; Mao, G. What Is the Root Cause of Congestion in Urban Traffic Networks: Road Infrastructure or Signal Control? IEEE Trans. Intell. Transp. Syst. 2021, 23, 8662–8679. [Google Scholar] [CrossRef]
- Wang, J.; Gu, Q.; Wu, J.; Liu, G.; Xiong, Z. Traffic Speed Prediction and Congestion Source Exploration: A Deep Learning Method. In Proceedings of the 16th IEEE International Conference on Data Mining (ICDM), Barcelona, Spain, 12–15 December 2016; pp. 499–508. [Google Scholar]
- Ma, X.; Zhang, J.; Ding, C.; Wang, Y. A geographically and temporally weighted regression model to explore the spatiotemporal influence of built environment on transit ridership. Comput. Environ. Urban Syst. 2018, 70, 113–124. [Google Scholar] [CrossRef]
- An, D.; Tong, X.; Liu, K.; Chan, E.H.W. Understanding the impact of built environment on metro ridership using open source in Shanghai. Cities 2019, 93, 177–187. [Google Scholar] [CrossRef]
- Guo, J.; Zhong, S.; Yang, F.; Zhang, J.; Ran, B. Spatial and Temporal Distribution Model for Travel Origin-Destination Based on Multi-Source Data. In Proceedings of the 19th COTA International Conference of Transportation Professionals (CICTP)—Transportation in China 2025, Nanjing, China, 6–8 July 2019; pp. 5280–5292. [Google Scholar]
- Li, S.; Lyu, D.; Huang, G.; Zhang, X.; Gao, F.; Chen, Y.; Liu, X. Spatially varying impacts of built environment factors on rail transit ridership at station level: A case study in Guangzhou, China. J. Transp. Geogr. 2020, 82, 102631. [Google Scholar] [CrossRef]
- Shao, Q.; Zhang, W.; Cao, X.; Yang, J.; Yin, J. Threshold and moderating effects of land use on metro ridership in Shenzhen: Implications for TOD planning. J. Transp. Geogr. 2020, 89, 102878. [Google Scholar] [CrossRef]
- Nasri, A.; Zhang, L. Impact of Metropolitan-Level Built Environment on Travel Behavior. Transp. Res. Rec. 2012, 2323, 75–79. [Google Scholar] [CrossRef] [Green Version]
- Chen, P.; Shen, Q.; Childress, S. A GPS data-based analysis of built environment influences on bicyclist route preferences. Int. J. Sustain. Transp. 2018, 12, 218–231. [Google Scholar] [CrossRef]
- Zhang, T.; Sun, L.; Yao, L.; Rong, J. Impact Analysis of Land Use on Traffic Congestion Using Real-Time Traffic and POI. J. Adv. Transp. 2017, 2017, 7164790. [Google Scholar] [CrossRef] [Green Version]
- Qin, K.; Xu, Y.; Kang, C.; Kwan, M.-P. A graph convolutional network model for evaluating potential congestion spots based on local urban built environments. Trans. Gis 2020, 24, 1382–1401. [Google Scholar] [CrossRef]
- Bao, Z.; Ng, S.T.; Yu, G.; Zhang, X.; Ou, Y. The effect of the built environment on spatial-temporal pattern of traffic congestion in a satellite city in emerging economies. Dev. Built Environ. 2023, 14, 100173. [Google Scholar] [CrossRef]
- Shen, T.; Hong, Y.; Thompson, M.M.; Liu, J.; Huo, X.; Wu, L. How does parking availability interplay with the land use and affect traffic congestion in urban areas? The case study of Xi’an, China. Sustain. Cities Soc. 2020, 57, 102126. [Google Scholar] [CrossRef]
- Schoeman, C.B.; Schoeman, I.M. Land use, traffic generation and emissions in formulating a simplified approach in assessing development impacts in residential areas. Int. J. Transp. Dev. Integr. 2019, 3, 166–178. [Google Scholar] [CrossRef] [Green Version]
- Yap, J.Y.L.; Omar, N.; Ismail, I. A Study of Traffic Congestion Influenced by the Pattern of Land Use. IOP Conf. Ser. Earth Environ. Sci. 2022, 1022, 012035. [Google Scholar] [CrossRef]
- Rahman, M.M.; Najaf, P.; Fields, M.G.; Thill, J.-C. Traffic congestion and its urban scale factors: Empirical evidence from American urban areas. Int. J. Sustain. Transp. 2021, 16, 406–421. [Google Scholar] [CrossRef]
- Open Street Map (OSM). Available online: https://www.openstreetmap.org/ (accessed on 5 June 2023).
- Autonavi Development Platforms. Available online: https://lbs.amap.com/ (accessed on 5 June 2023).


| Notion | Description | Example |
|---|---|---|
| Uid | Anonymous ID | *** 92 |
| moi_id | Month trip number | 1 |
| route_id | Route ID | 1 |
| rn_seq | Route node sequence | 16 |
| rn_id | Route node ID | 35,857,550 |
| time | Time taken to pass through the node pair | 650 |
| is_end | Is the end point? | N |
| mode | Mode of transportation (1—road, 2—railway, 3—airplane, 4—metro, 0—other) | 1 |
| next_rn_id | Next route node ID | 35,858,257 |
| Variable | Description | Ratio/Average |
|---|---|---|
| Road density | Continuous (m/1000 m2) | 11.68 |
| Working population density | Continuous (people/km2) | 7.50 |
| Residential population density | Continuous (people/1000 m2) | 13.57 |
| Office area density | Continuous (units/km2) | 99.53 |
| Density of science areas | Continuous (units/1000 m2) | 36.96 |
| Main land-use nature | Discrete | (see Figure 8) |
| Characteristic | Weight |
|---|---|
| Nature of the land (residential land) | 0.141731 |
| Residential population density | 0.134664 |
| Number of science and education areas | 0.114573 |
| Working population density | 0.101248 |
| Nature of land (transportation land) | 0.097864 |
| Office space density | 0.086793 |
| Road density | 0.077864 |
| Nature of land (industrial land) | 0.070127 |
| Nature of land (public administration land) | 0.067659 |
| Nature of land (commercial land) | 0.066427 |
Disclaimer/Publisher’s Note: The statements, opinions and data contained in all publications are solely those of the individual author(s) and contributor(s) and not of MDPI and/or the editor(s). MDPI and/or the editor(s) disclaim responsibility for any injury to people or property resulting from any ideas, methods, instructions or products referred to in the content. |
© 2023 by the authors. Licensee MDPI, Basel, Switzerland. This article is an open access article distributed under the terms and conditions of the Creative Commons Attribution (CC BY) license (https://creativecommons.org/licenses/by/4.0/).
Share and Cite
Wang, D.; Chen, H.; Li, C.; Liu, E. Exploring the Relationship between Land Use and Congestion Source in Xi’an: A Multisource Data Analysis Approach. Sustainability 2023, 15, 9328. https://doi.org/10.3390/su15129328
Wang D, Chen H, Li C, Liu E. Exploring the Relationship between Land Use and Congestion Source in Xi’an: A Multisource Data Analysis Approach. Sustainability. 2023; 15(12):9328. https://doi.org/10.3390/su15129328
Chicago/Turabian StyleWang, Duo, Hong Chen, Chenguang Li, and Enze Liu. 2023. "Exploring the Relationship between Land Use and Congestion Source in Xi’an: A Multisource Data Analysis Approach" Sustainability 15, no. 12: 9328. https://doi.org/10.3390/su15129328