Abstract
The advent of the Fourth Industrial Revolution and the spread of infectious diseases have increased people’s reliance on information and communication technology (ICT). However, older adults are the most marginalized group affected by ICT, and their activities and daily life have become more difficult than ever during the pandemic. Based on the theory of the TAM, this study analyzed the effect of ICT use on life satisfaction among older adults during the pandemic, and examined the mediating role of social capital. The partial least squares structural equation modeling (PLS-SEM) was applied to test the relationships among ICT use, social capital, and life satisfaction, and the Sobel test was used to test the mediating effect and statistical significance of social capital. The results of the analysis confirmed the positive effects of technology’s perceived usefulness and self-efficacy on attitudes and ICT use among older adults. ICT use had a positive effect on life satisfaction. In addition, it was found that social capital had a mediating effect on the relationship between ICT use and life satisfaction. During the pandemic, ICT use not only had a direct effect on life satisfaction but also had an indirect effect through social capital among older adults. The results of this study have implications for research on ICT use and life satisfaction among older adults, and have implications for formulating public policies for active aging. The results of this study can facilitate a comprehensive understanding of the antecedents and consequential factors of the use of digital information among older adults, which not only complements previous studies but also provides a theoretical basis for systematic research on digital literacy and well-being in older adults.
1. Introduction
The lockdowns and quarantines imposed in response to epidemics of infectious diseases have resulted in more people becoming more dependent on information and communication technology (ICT) than ever before [1,2]. During the pandemic, people used ICT to communicate, find and share information, to work and study remotely, and effectively maintain their daily lives.
Older adults are less likely to use the internet and digital technologies than younger adults because they have higher rates of digital illiteracy [3], as well as limited access to digital devices and the internet [4]. With little motivation to accept technology, they are reluctant to adopt new technology [5] and are ultimately unable to enjoy the benefits of ICT, reducing their personal quality of life [6]. Park and Lee [7] showed that social distancing caused by the novel coronavirus aggravated the difficulties of elderly people living alone, who already experienced social isolation. The inequality caused by COVID-19 worsened the living conditions of the elderly living alone, and the social distancing measures implemented to prevent infectious diseases limited their physical activities, resulting in further isolation [8].
During the pandemic, ICT acted as a medium for people to connect with others and maintain relationships, counteracting the pandemic-related social constraints [9] and impacting older adults’ mental health and life satisfaction [1,10,11]. Cotton et al. [12] noted that the use of the internet by older adults not only broadened their channels of communication with others and helped them to establish new social relationships, but also enhanced their subjective well-being. Zhu et al. [13] pointed out that the social capital formed by older adults through the internet positively influenced their physical and mental health, and they argued that internet use is necessary for the formation of social capital among older adults.
According to a study analyzing the digital divide, the elderly constitute the largest of five major vulnerable groups in South Korea: the disabled, the elderly, low-income earners, farmers, and fishers [14]. The unresolved digital divide resulting from COVID-19, which made offline face-to-face contact difficult, further reinforced the social isolation of older adults, which negatively affected their physical and mental health [15,16]. Therefore, examining ICT use among older adults during the pandemic, and determining whether it affected psychological variables such as perceived life satisfaction, is an important research topic with social implications.
According to previous studies, internet use has an impact on the accumulation of social capital [17,18,19], and social capital can affect life satisfaction [20,21,22]. In addition, WeChat use positively affects online and offline social capital and life satisfaction [23]. College students’ social capital, gained from SNS, positively affected their life satisfaction [24]. Young people’s scale of internet addiction had a negative impact on happiness and life satisfaction during the COVID-19 lockdown [25]. However, few studies have examined the relationship between the impact of social capital on ICT use and perceived life satisfaction among older adults. In particular, it remains to be tested whether (and to what extent) the social capital formed online under the influence of COVID-19 mediates the relationship between ICT use and older adults’ perceived life satisfaction.
Therefore, this study used primary data on older adults from the Digital Information Divide Survey 2021 conducted by the Korea National Information Society Agency (NIA). Based on the technology acceptance model (TAM), the effect of ICT use on perceived life satisfaction during the pandemic was verified in the Korean population aged 65 and older, as was the mediating role of social capital in the relationship between the two variables. The results of this study provide insights for research on the relationship between ICT use and perceived life satisfaction among older adults, alongside solutions for effective improvement in perceived life satisfaction among them.
The structure of the rest of the article is as follows. In the following section, we discuss our theoretical model and develop our hypotheses. In Section 3, we present the empirical analysis. Section 4 reports the discussion. Section 5 presents a summary of the research results. Finally, the limitations of this study, and some suggestions for future research, are presented in Section 6.
2. Literature Review and Development of Hypotheses
2.1. The Relationship between Technology Acceptance Model (TAM) and ICT Use in Older Adults
Davis [26] proposed the technology acceptance model, in which the components are the core variables (perceived usefulness, perceived ease of use, and attitudes toward technology) and outcome variables (behavioral intentions and actual use) [27]. Currently, TAM is considered one of the most influential models to explain people’s information technology (IT) usage [28,29,30], and TAM has also been used as a common model to investigate ICT use and acceptance among older adults [31,32,33].
Acceptance of technology considers the user as the subject of the use of technology [34]. Perceived usefulness and perceived ease of use have been verified as key variables that directly affect attitudes toward technology and usage behavior [21]. Perceived usefulness is the extent to which technology is believed to improve performance, and perceived ease of use is the extent to which technology is perceived as requiring no effort [26]. Self-efficacy is a judgment about confidence in performing a particular task [13]. The perceived ease-of-use scale of Davis [26] is similar to the technological self-efficacy items of Taylor and Todd [35], regarding the ease of learning and using information technology and how well it is used. Therefore, this study used technological self-efficacy as a proxy variable for perceived ease of use.
Self-efficacy has been frequently studied as a major factor influencing the acceptance of technology [36,37,38]. Considering the characteristics of older adults, technological self-efficacy has the potential to influence their psychological and emotional well-being. Studies have found that older adults’ internet self-efficacy affects their use of ICT [39,40]. Therefore, it was identified as the main variable influencing the attitudes of older adults towards ICT.
An attitude is someone’s personal evaluation of the use of technology [41], i.e., an individual’s good or bad reactions to specific behaviors [42]. Attitude has been premised as the most important preceding variable affecting behavior [43]. Behavioral intentions are behaviors that are intended only, whereas use of technology is a behavior that can be observed [27]. This study focused on the actual use of ICT by older adults in order to predict subjective well-being, so the actual use of technology was the variable chosen.
On the basis of the descriptions above, the following research hypotheses were proposed.
Hypothesis 1.1.
The perceived usefulness of ICT has a positive impact on attitudes toward ICT.
Hypothesis 1.2.
The perceived usefulness of ICT has a positive impact on ICT use.
Hypothesis 2.1.
Self-efficacy regarding ICT has a positive impact on attitudes toward ICT.
Hypothesis 2.2.
Self-efficacy regarding ICT has a positive impact on ICT use.
Hypothesis 3.
Self-efficacy regarding ICT has a positive impact on perceived usefulness.
Hypothesis 4.
Attitudes toward ICT have a positive impact on ICT use.
2.2. The Relationship between ICT Use and Perceived Life Satisfaction in Older Adults
Life satisfaction refers to a person’s perception or subjective evaluation of his or her overall life, similar to the meanings of happiness and quality of life [44,45]. Life satisfaction refers to the degree to which one can accept one’s life as meaningful, adapt efficiently to the surrounding environment, and properly satisfy individual needs without emotional and social difficulties [46]. Perceived life satisfaction is strongly influenced by psychological and environmental factors that negatively affect the lives of middle-aged and older adults as they go through the aging process and major life experiences, such as retirement, declining health, or loss of a spouse [47]. Increased aging and social isolation make daily life difficult for older adults because they are unable to solve the various problems that may arise in their daily lives [48]. Lee et al. [10] found that the use of digital technology by older adults reduced the symptoms of depression caused by fewer social interactions, and they emphasized that enhanced digital access might have improved the mental health of older adults during the pandemic. In critical situations, people often rely on online services to obtain medical-related information and answers [49]. Therefore, the application of communication technology can affect every aspect of the daily life of the elderly.
The emergence of the epidemic became a barrier between the elderly and modern society. Before the emergence of the epidemic, the elderly could communicate with family and friends face-to-face, but with the emergence of the epidemic, more and more people were inclined to use the internet to communicate. Meetings, classes, daily gatherings, and the transmission of information related to infectious diseases, were carried out online, so the population most affected by digital technology was older adults, which undoubtedly posed a significant risk to their quality of life. According to previous studies, middle-aged and older adults who actively use the internet and other digital technologies are more likely to alleviate social isolation and lead active daily lives [50]. Specifically, Szabo et al. [51] confirmed that middle-aged and older adults who actively engage in social activities via the internet felt decreased loneliness and increased well-being with increased participation in activities. Nam [52] suggested that older adults’ use of social media has a direct impact on their quality of life and indirectly affects their quality of life through social support. In addition, Nimrod [1] confirmed that older adults communicated online during COVID-19, lowering the stress caused by it, and recommended that people use the internet to communicate with each other and find emotional support, which may be one strategy to effectively cope with stress during a pandemic. In summary, active internet use during a pandemic can alleviate social isolation and improve psychological well-being and perceived life satisfaction among older adults. Therefore, the following hypothesis was proposed:
Hypothesis 5.
ICT use among older adults has a positive effect on perceived life satisfaction.
2.3. The Role of Social Capital on the Relationship between ICT Use and Perceived Life Satisfaction
Social capital is the potential benefits and resources that individuals or groups can obtain through interconnectedness [53,54], and the core elements of this concept are interpersonal relationships and reciprocal values [55]. Social capital theory emphasizes the ability of communities to provide opportunities for their members to increase personal and family resources [56]. Putnam [53] defined social capital as the trust, norms, and networks that promote mutually beneficial cooperation and reflect the availability and accessibility of resources (material, informational, or emotional) through social relationships, groups, and organizations [57]. As one of the frequently used concepts in various academic fields, social capital has been successfully extended to the online space to highlight the positive impact of various online communication tools [58]. Social capital is an important factor of living in old age, and the importance of social capital as a major alternative resource has been strongly emphasized [59].
Traditionally, based on two basic elements (the strength of relationships and the form of the resources provided), social capital can be subdivided into bonding social capital and bridging social capital [60]. Bonding social capital refers to the emotional or substantive support-based resources between strongly connected people (e.g., family and close friends), whereas bridging social capital involves information-based benefits between weakly connected people in heterogeneous networks (e.g., colleagues, acquaintances, and friends in general) [60]. Thus, the benefits of bonding relate to the depth of the relationships, whereas the benefits of bridging relate to the breadth of the relationships [54].
A series of empirical studies confirmed the effect of social capital in online environments, where the more one uses social media, the more likely one is to gain an awareness of bonding and bridging social capital [61]. The accumulation of social capital promoted by the online space can also have an impact on users’ psychological well-being [54]. Studies have shown the relationship between social capital and perceived life satisfaction. People with higher social capital have higher levels of life satisfaction [62,63]. Moreover, social capital is a mediating variable that affects happiness or life satisfaction, such as that obtained from social media use [64,65].
In an era of rapidly increasing digital information use, social capital plays an important role in older adults’ access to and use of new information technology [66]. Social capital can alleviate the emotional anxiety of middle-aged and older adults who have lost their social roles due to retirement and the reduced economic capital and relationships associated with this. A study by Lee [67] confirmed that social capital had a positive effect on life satisfaction for the elderly. Kim and Shen [68] found that older users could gain social capital by engaging in different online activities, positively influencing their life satisfaction, but the effect was lower than in younger users. Zhao et al. [69] found that social media use by so-called “trailing parents” indirectly influenced their life satisfaction through the chain-mediating effect of social capital and social integration. During the pandemic, ICT provided opportunities, via communication and recreation, to help older adults always stay in touch with family and friends, make new friends, gain emotional and material support, alleviate their loneliness and anxiety, and achieve greater life satisfaction. Therefore, the following hypothesis was proposed.
Hypothesis 6.
Social capital mediates the relationship between ICT use and perceived life satisfaction.
Based on the theoretical assumptions discussed above, a structural equation model of ICT use and perceived life satisfaction among older people was constructed (Figure 1).
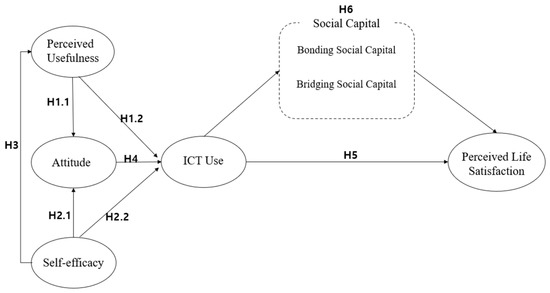
Figure 1.
Research model.
3. Materials and Methods
3.1. Data
This study relied on a cross-sectional dataset from the 2021 Digital Divide Survey conducted by the NIA [70] from September to December in 2021. The South Korean government had been conducting this survey since 2002 to measure digital usage and the digital divide among diverse populations. These data include the general demographics, physical condition, ability to use computers and the internet, actual use, and the psychological aspects of 15,000 people, including healthy individuals, people with disabilities, and older adults, residing in 16 cities in Korea. The survey uses the square root proportional allocation method based on sociodemographic characteristics (e.g., gender, age, and place of residence) collected via multistage stratified sampling. Thus, the data are appropriate for this study, which looked at 1190 individuals aged 65 years and older. Table 1 illustrates the basic characteristics of the people in the sample. In general, the sample covered people of different ages, education levels, and monthly income levels (KRW), indicating that the sample of this study is representative.

Table 1.
Demographics of the sample of this study.
3.2. Measures
This study used perceived usefulness, self-efficacy, attitudes, and actual use as the underlying variables [16,26,29,35].
Perceived usefulness was measured via the following statements: (1) “Digital technology is useful”, (2) “Digital technology makes my life convenient”, and (3) “Digital technology is good for me”. A four-point Likert scale was used, ranging from 1 (strongly disagree) to 4 (strongly agree).
Self-efficacy was measured via the following statements: (1) “I feel confident learning to use digital devices”, (2) “I feel confident using digital devices”, (3) “I can figure out how to use new digital devices quickly”, and (4) “I want to use digital devices more”. The same four-point Likert scale was used, ranging 1 (strongly disagree) to 4 (strongly agree).
Attitudes in older adults, specifically toward ICT [2], were tested through three statements: (1) “The internet and mobile technologies have become more important in our lives than before”, (2) “Lacking the ability to use the internet and mobile technologies will leave people behind in society”, and (3) “I hope for more opportunities to learn about the internet and mobile technologies”. A five-point Likert scale that ranged from 1 (strongly disagree) to 5 (strongly agree) was utilized.
ICT use among older adults [2] looked at changes in six types of digital services. They were as follows: (1) search, email, and content services (e.g., information, news, media, and education); (2) social networking services (e.g., SNS, messaging, personal blogs, and online communities); (3) daily services (e.g., weather forecasts, public transportation, navigation, E-commerce, internet banking, and E-government); (4) the creation and exchange of information (e.g., creating and editing online content, uploading internet content, and sharing links); (5) online social participation (e.g., comments on social issues, filing complaints, participating in online surveys regarding public policies, and online donations); and (6) non-face-to-face digital consumption,(e.g., using the internet/mobile phones for purchasing daily necessities, ordering food, and enjoying cultural activities). Participants were asked for a response on a five-point Likert scale (1 = greatly decreasing and 5 = greatly increasing).
The measures of social capital (bonding and bridging) were developed from the original scales of Ellison et al. [55] and Williams [54], respectively. The statements for bonding social capital were as follows: (1) “There is a special person whom I trust to help solve my problems”, (2) “There is someone I can turn to for advice about making very important decisions”, (3) “I feel comfortable talking to someone about personal matters”, (4) “I can delegate important work to someone”, and (5) “I have someone who will help me fight injustice”. The statements for bridging social capital were as follows: (1) “Interacting with people makes me feel connected to the larger world”, (2) “Interacting with people reminds me that everyone in the world is connected”, (3) “I am willing to spend time participating in community activities”, (4) “Interacting with people gives me new people to talk to”, and (5) “Interacting makes me contact new people all the time”. A four-point Likert scale was utilized for both types, ranging from 1 (strongly disagree) to 4 (strongly agree).
Perceived life satisfaction was assessed with the life satisfaction scale [44] via the following statements: (1) “In most ways, my life is close to my ideal”, (2) “My living conditions are excellent”, (3) “I am satisfied with my life”, (4) “So far, I have gotten the important things I wanted in life”, and (5) “If I could live my life over, I would change almost nothing”. These five items were ranked on a four-point Likert scale (1 = strongly disagree, 4 = strongly agree).
Previous studies have shown that the impact of internet use on perceived life satisfaction among older adults is influenced by gender, age, and socioeconomic status (education level and income) [71,72]. Therefore, this study used gender, age, education level, and income as control variables.
3.3. Analysis and Model Testing
Structural equation models have two approaches: covariance-based structural equation modeling (CB-SEM) and partial-least-squares-based structural equation modeling (PLS-SEM). CB-SEM is mainly used to confirm theories, and PLS-SEM is mainly used to develop theories in exploratory research [73]. For the analysis of a causal model between latent variables in particular, this is better than the general linear structural relationship model [74,75]. This study was based on the TAM to explore the impact of ICT usage by the elderly on perceived life satisfaction. The purpose of the study was to explore and develop a theory; therefore, the most suitable method was PLS-SEM. The data were analyzed using SPSS 24.0 and Smart PLS 4. Smart PLS 4 is currently the latest version of Smart PLS software, with more features and better performance, especially in terms of fitting models and computing speed. When conducting an analysis using smart-PLS, it is first necessary to measure the validity and reliability of the model before conducting a structural analysis. Finally, the mediating relationship of social capital on ICT use and perceived life satisfaction was tested by regression analysis and the Sobel test [76].
In survey-based research, it is necessary to consider common method bias (CMB) when both the independent variable and the dependent variable data are obtained from the same respondents [77]. To examine CMB, this study employed two methods, the Harman single-factor test and the correlation matrix approach, to assess CMB [78,79]. The total variance explained by a single factor was 37.25%, which is less than 50%, confirming the absence of CMB. Furthermore, this study evaluated CMB using the correlation matrix procedure. Bagozzi et al. [80] suggested that correlations exceeding 0.9 indicate the presence of CMB. According to the table values (refer to Appendix A), all values were below 0.9. Therefore, it is confirmed that there is no CMB.
In this study, the PLS-SEM empirical analysis utilized a database consisting of 1190 observations. The dataset was collected from diverse regions across South Korea, ensuring the representation of various population groups. It encompasses multiple research projects that specifically aimed to investigate the factors and outcomes related to the usage of ICT technology among elderly individuals in South Korea. According to Cohen’s [81] recommendations, a sample size of 106 or 130 observations is required for multiple OLS regression analysis to detect an R-squared value of approximately 0.10, assuming significance levels of 10% or 5% and a statistical power of 80%. Nitzl [82] suggests that, to detect a medium effect size of 0.15 while maintaining the same significance and power levels, a sample size of 98 or 135 observations is needed. Another approach is to use GPower [83], a widely used statistical testing and analysis software in social and behavioral research, which would require 43 observations with the same statistical power, effect size, and α significance level. Increasing the sample size is known to enhance the statistical power in PLS-SEM [84]. Therefore, considering the sample size used in our statistical analysis, it appears that the inclusion of 1190 observations is sufficient for detecting model effects.
3.4. Measurement Model
Structural equation modeling first tests the measurement model, evaluates the fit between the theoretical model and the collected data, and then tests the relationship between the constructs of the structural model. The criteria for evaluating the measurement model are broadly classified into internal consistency reliability, convergent validity, and discriminant validity [85,86]. The measurement indicators include the individual items’ reliability and internal consistency [87]. The measures of internal consistency reliability included Cronbach’s alpha, Dijkstra–Henseler’s rho a(pa), and CR [88]. Table 2 shows that all values are greater than the standard value of 0.7. Although the CR values of some structures exceeded the 0.9 level, they were still acceptable because they were below the recommended threshold of 0.95 [89,90,91,92]. In Table 2, the highest CR value is 0.939, which is below 0.95. This meets the acceptance criterion for internal consistency reliability recommended by Hair [91].
Table 2.
Validity and reliability of the constructs.
The analysis of the model’s validity mainly considered the convergent validity and discriminant validity. The convergent validity was determined by the average variance extracted (AVE) and the composite reliability. As shown in Table 2, the AVE values of each variable were greater than 0.5, indicating that the model had good convergent validity. The discriminant validity was determined by comparing whether the square root of the AVE was greater than its correlation coefficient [93]. As shown in Table 3, the correlation coefficients among the latent variables were smaller than the square root of the AVE values (diagonal values). According to Wijaya’s study, as well as considering the Fornell–Larcker test, Hair et al. [94] also proposed observing the value of HTMT in order to specifically analyze discriminant validity [95]. In this approach, the discriminant validity is considered to be good when the HTMT value does not exceed the threshold of 0.85 [96]. As determined by using Smart-PLS (Table 4), the highest HTMT value was 0.742, proving that the discriminant validity among the latent variables was good. Therefore, the model has high discriminant validity.
Table 3.
Correlations among constructs.
Table 4.
HTMT values (heterotrait–monotrait ratio of the correlations).
3.5. Hypothesis Testing
Before we estimated the path coefficients, the collinearity and significance of the indicators of the model needed to be evaluated. The variance inflation factor (VIF) of the model was used to test for multicollinearity [97]. The results in Table 2 showed that the VIF values of each predictor were less than 5, indicating there was no collinearity in the measurement items. The standardized root mean square residual (SRMR) and NFI indices were used to assess the overall technical adequacy. The SRMR value ranges from 0 to 1, and values of <1.00 indicate a model with good fit [98]. In this study, the observed SRMR value of 0.055 indicated the good fit of the model. A NFI value above 0.9 is considered to show good fit and better performance [98]. Although the NFI value in this study was 0.852 (i.e., <0.9), it was still within the acceptable range [99]. According to Henseler [100], the differences between indicators (SRMR, unweighted least squares difference (dULS), and geodesic difference (dG)) do not exceed the 95% (HI95) or 99% (HI99) percentiles based on bootstrapping [101]. The model fit results, presented in Table 5, confirm that all three tests exhibited values below HI95 and HI99, indicating the favorable fit of the model. The explainable variation (R2) was used for further analysis. In a PLS-SEM study, an R2 of 0.25 for the endogenous latent variables indicates a weak value [102]. According to Falk and Miller, an R2 of more than 10% means that the model’s interpretability is acceptable, that is, one latent variable is an influencing factor that causes another to change [103]. The explanatory power of the perceived usefulness and self-efficacy on attitudes to ICT among older adults was strong, with R2 values of 0.453 and 0.395, respectively. However, the explanatory power of the perceived usefulness, self-efficacy, and attitudes for actual ICT usage was only 0.115, while the explanatory power of ICT usage for perceived life satisfaction was 0.156, indicating insufficient explanatory power and the need for further improvement. These results suggested that the perceived usefulness, self-efficacy, and attitudes of older adults had some impact on actual ICT usage, and ICT usage had some impact on perceived life satisfaction, but these factors were not the main influencing factors. Therefore, future research on actual ICT usage among older adults needs to consider other influencing factors. Additionally, while ICT usage had some impact on older adults’ perceived life satisfaction, it was not a major influencing factor. Q2 is obtained by blindfolding, and a model has predictive relevance when Q2 ≥ 0, where a larger Q2 indicates stronger predictive relevance [104]. The results showed Q2 (0.081) > 0, indicating that ICT use among older adults has a predictive correlation with perceived life satisfaction. The results are shown in Table 5.
Table 5.
Model fit.
Finally, the T-statistics, path coefficients, p-values, and hypothesis tests for the relationships among the variables were obtained by using bootstrapping in Smart PLS. The beta coefficient indicates the strength and direction of the relationships among variables, and a beta coefficient less than 0.2 means that the relationship between a pair of variables is weak. The path coefficients were validated for significance by the T-value, p-value, or bootstrapped confidence interval (CI) [73,105]. In the path analysis of this study, the T-value was used to judge whether a hypothesis was true. When T > 1.96, this meant that the significant level was 0.05 (indicated by *). When T > 2.58, this meant that the significance level was 0.01 (indicated by **). When T > 3.29, this meant that the significance level was 0.001 (indicated by ***). The results are shown in Table 6 and Figure 2. Therefore, Hypotheses 1.1, 1.2, 2.1, 2.2, 3, 4, and 5 in this study were valid. The effects of the control variables on the dependent variable of perceived life satisfaction were as follows: age (β = −0.171, t = 2.427), education (β = 0.265, t = 6.350), and monthly income (β = 0.224, t = 5.930) had a significant impact on perceived life satisfaction, but gender (β = −0.113, t = 1.931) had no significant effect on perceived life satisfaction.
Table 6.
Hypothesis tests.
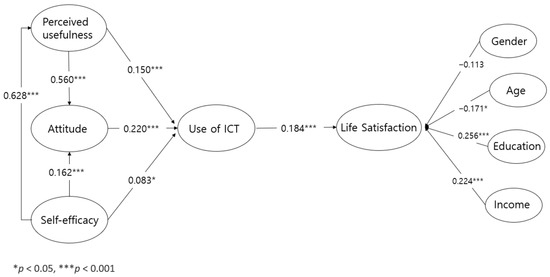
Figure 2.
Results of the structural model test.
The results of the analysis of the mediating effect of social capital on ICT use and perceived life satisfaction, based on Baron and Kenny [76], are shown in Table 7 and Figure 3. In the first step, ICT use (the independent variable) positively affected social capital (the mediating variable) (β = 0.191, p < 0.001; β = 0.209, p < 0.001), indicating that older adults using ICT are more likely to gain social capital. In the second step, the effect of ICT use on perceived life satisfaction (the dependent variable) was statistically significant (β = 0.157, p < 0.001). In the third step, the effect of social capital on perceived life satisfaction was significant (β = 0.321, p < 0.001; β = 0.291, p < 0.001). Compared with the second regression equation (β = 0.157, p < 0.001), the effect of ICT use on perceived life satisfaction was significantly reduced in the third regression equation (β = 0.096, p < 0.005; β = 0.097, p < 0.005). Therefore, social capital had a partially mediating effect on the relationship between ICT use and perceived life satisfaction.
Table 7.
Effects of social capital’s effect on the relationship between ICT use and perceived life satisfaction.
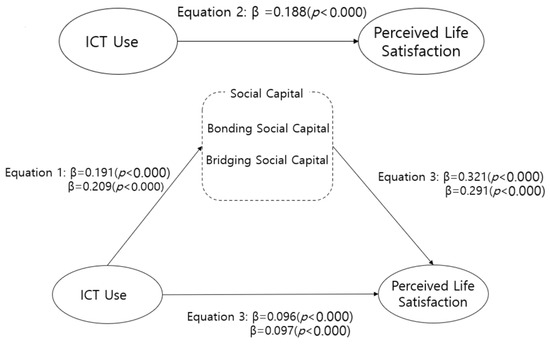
Figure 3.
Mediating effect of social capital on the relationship between ICT use and perceived life satisfaction.
Additionally, ICT use had a very low explanatory variance for perceived life satisfaction (0.36%; F = 45.023, p < 0.001; 0.43%; F = 54.071, p < 0.001) but, with the inclusion of social capital, the explanatory variance increased considerably (12.3%, F = 84.172, p < 0.001; 10.4%, F = 70.078, p < 0.001). The Z scores of the Sobel test were 5.807 (p < 0.001) and 5.961 (p < 0.001), which indicated that the mediating effect was statistically significant (Table 8). The results of the Sobel test for the mediating effect of social capital on the relationship between ICT use and perceived life satisfaction are shown in Table 6.
Table 8.
Results of the Sobel test.
4. Discussion
This study examined the relationships among perceived usefulness, self-efficacy, attitudes, actual ICT use, and perceived life satisfaction among Korean adults aged 65 years and older, identifying the mediating effect of social capital. Firstly, the results of the data analysis confirmed that the perceived usefulness of technology and self-efficacy in older adults had a positive effect on attitudes toward ICT and actual ICT use, while self-efficacy had a positive effect on perceived usefulness. Therefore, it can be inferred that older adults who are confident in using ICT will be more willing to use ICT and will think it helpful in their daily lives. Moreover, the perceived usefulness of technology and self-efficacy determined attitudes toward ICT and, thus, if older adults have a positive attitude toward using ICT, they will be more willing to use ICT. These findings are consistent with those of Davis [26] and subsequent studies [106,107].
Secondly, this study examined the relationship between ICT use and perceived life satisfaction among older adults in detail. The results showed that ICT use had a positive impact on perceived life satisfaction. This result is consistent with those of previous studies [1,10,49]. Mobile social media has functions such as communication, interaction, information search, gaming, and entertainment, which can allow older adults to stay in touch with distant family and friends, expand their social circles, and enrich their daily lives [68]. Currently, the internet not only provides a non-face-to-face safe environment for interacting with people, but also provides various ways to complete necessary tasks, making it a useful tool in daily life for education, shopping, and caregiving. Thus, more active use of the internet by older adults during a pandemic could serve as a protective factor through which quality of life can be maintained and improved, offsetting the direct and indirect negative effects of epidemics and pandemics on the daily lives of older adults, increasing their perceived life satisfaction.
Thirdly, social capital was found to mediate the relationship between ICT use and perceived life satisfaction among older adults. The results showed that ICT use among older adults not only had a direct effect on perceived life satisfaction, but also enhanced perceived life satisfaction through social capital. Specifically, the social activities of older adults tend to decrease due to the physical and environmental issues associated with aging. Therefore, there is growing interest in using the internet to enhance social capital and improve the quality of life for older adults. Internet-based communication provides emotional support for older adults, which, in turn, affects their perceived life satisfaction. This is consistent with the findings of several previous studies showing that internet use helps increase social capital [17,19], and that the greater the social capital of older adults, the higher their perceived life satisfaction [108]. Within the specific subcategories of social capital, the impact of bonding social capital was greater than that of bridging social capital. This may be due to the fact that aging in place after retirement directly reduces the social resources available to older adults as their social roles change and the scope of their social interaction shrinks. However, support and companionship from close relationships (family, relatives, and friends) can prevent older adults from falling into difficult life situations and can combat loneliness and loss, helping them maintain a good physical and mental state, increasing their perceived life satisfaction [93,94]. During the pandemic’s prohibitions on social activity, more support and help from close relationships promoted the formation of social capital in older adults and influenced their perceived life satisfaction.
Finally, gender, age, education level, and income were added as control variables in the structural equation model. The results showed that age had a negative effect on perceived life satisfaction for older adults (the younger the age, the higher the perceived life satisfaction); as age increases, older adults may become less mobile and need more care, so their perceived life satisfaction may decrease. There was a positive association for both education level and income level with perceived life satisfaction. Older adults with higher levels of education and higher incomes are more likely to own and use digital devices such as personal computers and mobile devices, and thus enjoy the benefits of daily life that can be gained from the appropriate use of digital devices, thereby increasing their perceived life satisfaction. Unlike other research findings, this study found that gender had no significant effect on perceived life satisfaction among older adults. That is, the statistical analysis based on this sample could not prove that gender had a significant impact on the relationship between ICT use and perceived life satisfaction.
5. Conclusions
With the impact of the digital divide, and the acceleration of digitalization in various fields due to the COVID-19 pandemic, social media and communication systems are also affected in extraordinary ways [109]. Online social networks have evolved as a communication tool, and social networks play a vital role in modern times [110]. There is an increasing demand for research on the impact of digitalization on the lives of older adults [12,15]. This study used data from the “2021 Digital Divide Survey” to determine the relationships among self-efficacy, perceived usefulness of technology, actual ICT use, and perceived life satisfaction in the digitally disadvantaged elderly, and it investigated the mediating effect of social capital on the relationship between ICT use and perceived life satisfaction among the elderly. The results of the analysis showed that self-efficacy and perceived usefulness had a positive impact on attitudes to ICT and actual ICT use, which, in turn, had a positive impact on perceived life satisfaction. In addition, the study found that the use of ICT not only had a direct impact on life satisfaction but also had an indirect impact through the social capital of the elderly. Therefore, the results of this study have helped to reveal the problems and challenges that the elderly face in the process of digitalization, and may provide guidance for improving their daily lives. As the digital information gap and the epidemic accelerated the process of digitalization in various areas, the demand for related research has been increasing, and older adults are more vulnerable to the impact. The results of this study will contribute to a comprehensive understanding of the antecedents and consequential factors of the use of digital information among older adults, not only supplementing previous research but also providing a theoretical basis for systematic research on digital literacy and well-being in older adults.
This study proposes the following practical implications. Firstly, it is necessary to increase internet use among older adults and to increase their confidence in using technology. Compared with young people, older adults generally perceive internet technology to be complex, difficult to understand, and not easy to operate. Lacking self-efficacy, they are more likely to feel resistant when using internet services. Therefore, it is necessary to actively encourage and support older adults to use internet technology, to gain confidence in using internet services, and to improve their self-efficacy. The perceived usefulness of technology can also effectively motivate older adults to use internet services. Older adults with relatively little internet experience have lower positive awareness of the use of digital technology itself because they have had fewer opportunities to directly experience the benefits of the internet, and thus miss out on technology-based opportunities regarding health, leisure, well-being, etc. Therefore, it is important to teach older adults the practical benefits of IT and internet services, because face-to-face services for shopping, finance, and public services are gradually decreasing. Secondly, IT actively contributes to the formation of social capital. The use of internet technology helps enhance the social capital and perceived life satisfaction for older adults. Extensive online socialization can give older adults increased opportunities for recreation and communication, access to more benefits and resources, and an increased sense of perceived connection and interpersonal trust. During the pandemic, older adults used the internet to socialize online more frequently, and social connections with relatives and friends could alleviate their anxiety and loneliness, significantly increasing their well-being.
6. Limitations and Future Research
This study used secondary data for the cross-sectional analysis. Composite reliability values exceeding 0.9 or 0.95 were considered undesirable for determining the internal consistency reliability of the measurement model [73]. Such values indicated that the questionnaire measures the same phenomenon or uses redundant and synonymous items, which may have negatively impacted the validity of the measurement. This suggests that there were shortcomings in the development of the questionnaire. Therefore, in order to improve the reliability of the measurements for future investigations and research, the questionnaire’s design should account for certain issues. For example, the measurement items should be clearly and precisely written to eliminate ambiguity. The reliability usually increases as the number of measurement items increases. Therefore, future research should use measurement tools or items that have already been validated in other studies. In addition, the empirical results were different due to the limitations of the data. For example, the subjects for this study were people 65 years of age or older, so the study mainly considered age, educational background, income, and other issues, and, relatively, ignored the health of the elderly. This may have affected the results of the study. Therefore, relevant factors such as health will be taken into account in future studies. In this study, a research survey was conducted on the elderly in Korea, which is different from other Asian countries. In other words, there is a limit to generalizing the findings. In future studies, it would be meaningful to carry out a comparative analysis including samples from other countries. This study also focused on online social capital, and it did not explore the effect of offline social capital on older adults’ perceived life satisfaction. Therefore, it will be necessary to examine the variables of social capital, other factors affecting older adults’ perceived life satisfaction, and many other factors that influence the elderly’s use of ICT.
Author Contributions
Conceptualization, H.K.; methodology and analysis, H.K. and H.L.; writing—original draft preparation, H.K.; writing—review and editing, H.L. All authors have read and agreed to the published version of the manuscript.
Funding
This research received no external funding.
Institutional Review Board Statement
Not applicable.
Informed Consent Statement
Not applicable.
Data Availability Statement
Not applicable.
Conflicts of Interest
The authors declare no conflict of interest.
Appendix A. Correlation Matrix
| Correlation Matrix | |||||||
|---|---|---|---|---|---|---|---|
| BondingSocial Capital | Bridging Social Capital | Perceived Usefulness | Self-Efficacy | Perceived Life Satisfaction | ICT Use | Attitude | |
| Bonding social capital | 1 | ||||||
| Bridging social capital | 0.531 | 1 | |||||
| Perceived usefulness | 0.305 | 0.501 | 1 | ||||
| Self-efficacy | 0.215 | 0.457 | 0.622 | 1 | |||
| Perceived lifesatisfaction | 0.340 | 0.311 | 0.209 | 0.313 | 1 | ||
| ICT use | 0.191 | 0.209 | 0.278 | 0.232 | 0.158 | 1 | |
| Attitude | 0.240 | 0.452 | 0.659 | 0.504 | 0.184 | 0.300 | 1 |
References
- Nimrod, G. Changes in internet use when coping with stress: Older adults during the COVID-19 pandemic. Am. J. Geriatr. Psychiatry 2020, 28, 1020–1024. [Google Scholar] [CrossRef]
- Cho, M.; Kim, K.M. Effect of digital divide on people with disabilities during the COVID-19 pandemic. Dis. Health J. 2022, 15, 101214. [Google Scholar] [CrossRef]
- D’cruz, M.; Banerjee, D. ‘An invisible human rights crisis’: The marginalization of older adults during the COVID-19 pandemic–An advocacy review. Psychiatry Res. 2020, 292, 113369. [Google Scholar] [CrossRef] [PubMed]
- Yu, R.P.; Ellison, N.B.; McCammon, R.J.; Langa, K.M. Mapping the two levels of digital divide: Internet access and social network site adoption among older adults in the USA. Inf. Commun. Soc. 2016, 19, 1445–1464. [Google Scholar] [CrossRef]
- Neves, B.B.; Waycott, J.; Malta, S. Old and afraid of new communication technologies? Reconceptualising and contesting the ‘age-based digital divide’. J. Soc. 2018, 54, 236–248. [Google Scholar] [CrossRef]
- Selwyn, N.; Gorard, S.; Furlong, J.; Madden, L. Older adults’ use of information and communications technology in everyday life. Ageing Soc. 2003, 23, 561–582. [Google Scholar] [CrossRef]
- Park, J.; Lee, M.H. A study on the experience of COVID-19 on the life change of the elderly living alone. J. Korean Gov. Soc. 2021, 28, 221–243. [Google Scholar]
- Kim, Y.R.; Oh, S.M. The impact of COVID-19 on cognitive function in older adults: Focusing on the comparison between the older adults living alone and the non-living alone. Korean J. Ger. Soc. Welf. 2022, 77, 75–100. [Google Scholar]
- Wallinheimo, A.S.; Evans, S.L. More frequent internet use during the COVID-19 pandemic associates with enhanced quality of life and lower depression scores in middle-aged and older adults. Healthcare 2021, 9, 393. [Google Scholar] [CrossRef]
- Lee, M.A.; Ferraro, K.F.; Kim, G. Digital technology use and depressive symptoms among older adults in Korea: Beneficial for those who have fewer social interactions? Aging Ment. Health 2021, 25, 1839–1847. [Google Scholar] [CrossRef]
- Gaia, A.; Sala, E.; Cerati, G. Social networking sites use and life satisfaction. A quantitative study on older people living in Europe. Eur. Soc. 2021, 23, 98–118. [Google Scholar] [CrossRef]
- Cotton, S.R.; Ford, G.; Ford, S.; Hale, T.M. Internet use and depression among retired older adults in the United States: A longitudinal analysis. J. Gerontol. B 2014, 69, 763–771. [Google Scholar] [CrossRef] [PubMed]
- Zhu, Y.; Zhou, Y.; Long, C.; Yi, C. The relationship between internet use and health among older adults in China: The mediating role of social capital. Healthcare 2021, 9, 559. [Google Scholar] [CrossRef]
- Jun, W. A study on cause analysis of digital divide among older people in Korea. Int. J. Environ. Res. Public Health 2021, 18, 8586. [Google Scholar] [CrossRef]
- Siegmund, L.A.; Distelhorst, K.S.; Bena, J.F.; Morrison, S.L. Relationships between physical activity, social isolation, and depression among older adults during COVID-19: A path analysis. Geriatr. Nurs. 2021, 42, 1240–1244. [Google Scholar] [CrossRef]
- Soares, B.C.; Costa, D.A.; de Faria Xavier, J.; de Viveiro, L.A.P.; Antunes, T.P.C.; Mendes, F.G.; Pompeu, J.E. Social isolation due to COVID-19: Impact on loneliness, sedentary behavior, and falls in older adults. Aging Ment. Health 2021, 26, 2120–2127. [Google Scholar] [CrossRef]
- Bosancianu, C.M.; Powell, S.; Bratović, E. Social capital and pro-social behavior online and offline. Int. J. Int. Sci. 2013, 8, 9–68. [Google Scholar]
- Choi, N.G.; Di Nitto, D.M. Internet use among older adults: Association with health needs, psychological capital, and social capital. J. Med. Int. Res. 2013, 15, e2333. [Google Scholar] [CrossRef] [PubMed]
- Neves, B.B.; Fonseca, J.R.; Amaro, F.; Pasqualotti, A. Social capital and Internet use in an age-comparative perspective with a focus on later life. PLoS ONE 2018, 13, e0192119. [Google Scholar]
- Helliwell, J.F.; Putnam, R.D. The social context of well–being. Philos. Trans. R. Soc. Lond. Ser. B Biol. Sci. 2004, 359, 1435–1446. [Google Scholar] [CrossRef]
- Ko, H.C.; Kuo, F.Y. Can blogging enhance subjective well-being through self-disclosure? CyberPsychol. Behav. 2009, 12, 75–79. [Google Scholar] [CrossRef] [PubMed]
- Bano, S.; Cisheng, W.; Khan, A.N.; Khan, N.A. What’s App use and student’s psychological well-being: Role of social capital and social integration. Child. Youth Serv. Rev. 2019, 103, 200–208. [Google Scholar] [CrossRef]
- Huang, L.; Zheng, D.; Fan, W. Do social networking sites promote life satisfaction? The explanation from an online and offline social capital transformation. Inf. Technol. People 2021, 35, 703–722. [Google Scholar] [CrossRef]
- Pang, H. How does time spent on WeChat bolster subjective well-being through social integration and social capital? Telemat. Inform. 2018, 35, 2147–2156. [Google Scholar] [CrossRef]
- Evli, M.; Şimşek, N. The effect of COVID-19 uncertainty on internet addiction, happiness and life satisfaction in adolescents. Arch. Psychiatr. Nurs. 2022, 41, 20–26. [Google Scholar] [CrossRef] [PubMed]
- Davis, F.D. Perceived usefulness, perceived ease of use, and user acceptance of information technology. MIS Q. 1989, 13, 319–340. [Google Scholar] [CrossRef]
- Scherer, R.; Siddiq, F.; Tondeur, J. The technology acceptance model (TAM): A meta-analytic structural equation modeling approach to explaining teachers’ adoption of digital technology in education. Comput. Educ. 2019, 128, 13–35. [Google Scholar] [CrossRef]
- Gefen, D.; Karahanna, E.; Straub, D.W. Trust and TAM in online shopping: An integrated model. MIS Q. 2003, 27, 51–90. [Google Scholar] [CrossRef]
- Venkatesh, V.A.; Davis, F.D. A theoretical extension of the technology acceptance model: Four Longitudinal Field Studies. Manag. Sci. 2000, 46, 186–204. [Google Scholar] [CrossRef]
- Wang, Y.S.; Wang, Y.M.; Lin, H.H.; Tang, T.I. Determinants of user acceptance of internet banking: An empirical study. Int. J. Ser. Ind. Manag. 2003, 14, 501–519. [Google Scholar] [CrossRef]
- Wong, C.K.; Yeung, D.Y.; Ho, H.C.; Tse, K.P.; Lam, C.Y. Chinese older adults’ internet use for health information. J. Appl. Gerontol. 2014, 33, 316–335. [Google Scholar] [CrossRef] [PubMed]
- Smith, E.N.; Romero, C.; Donovan, B.; Herter, R.; Paunesku, D.; Cohen, G.L.; Dweck, C.S.; Gross, J.J. Emotion theories and adolescent well-being: Results of an online intervention. Emotion 2017, 18, 781–788. [Google Scholar] [CrossRef]
- Walker, C.; Peterson, C.L. Where does value lie in peer support? An exploratory discussion of the theories and methods underpinning effective research in peer support. Q. Health Res. 2021, 31, 218–227. [Google Scholar] [CrossRef] [PubMed]
- Chung, A.K.; Hong, Y.N.; Kang, J.J. The analysis of structural relationships among self-efficacy, perceived usefulness, supervisor and peer support, satisfaction, and transfer intentions in corporate mobile-learning. J. Inst. Internet Broadcast. Commun. 2016, 16, 189–196. [Google Scholar] [CrossRef]
- Taylor, S.; Todd, P. Understanding information technology usage: A test of competing models. Inform. Syst. Res. 1995, 6, 144–176. [Google Scholar] [CrossRef]
- Compeau, D.; Higgins, C. Computer self-efficacy, development of a measure and initial test. MIS Q. 1995, 19, 189–211. [Google Scholar] [CrossRef]
- Chung, J.E.; Park, N.; Wang, H.; Fulk, J.; McLaughlin, M. Age differences in perceptions of online community participation among non-users: An extension of the Technology Acceptance Model. Comput. Hum. Behav. 2010, 26, 1674–1684. [Google Scholar] [CrossRef]
- Gatti, F.M.; Brivio, E.; Galimberti, C. The future is ours too: A training process to enable the learning perception and increase self-efficacy in the use of tablets in the elderly. Educ. Gerontol. 2017, 43, 209–224. [Google Scholar] [CrossRef]
- Lam, J.Y.; Lee, M.K.O. Digital inclusiveness-longitudinal study of internet adoption by older adults. J. Manag. Inf. Syst. 2006, 22, 177–206. [Google Scholar] [CrossRef]
- Agarwal, R.; Karahanna, E. Time flies when you’re having fun: Cognitive absorption and beliefs about information technology usage. MIS Q. 2000, 24, 665–694. [Google Scholar] [CrossRef]
- Lee, D.Y.; Lehto, M.R. User acceptance of Youtube for procedural learning: An extension of the technology acceptance model. Comput. Educ. 2013, 61, 193–208. [Google Scholar] [CrossRef]
- Ajzen, I.; Fishbein, M.; Lohmann, S.; Albarracín, D. The influence of attitudes on behavior. In The Handbook of Attitudes; Taylor & Francis Group: Abingdon, UK, 2018; Volume 1, pp. 197–255. [Google Scholar]
- Allport, G.W. Attitudes. In Handbook of Social Psychology; Murchison, C., Ed.; Clark University Press: Worcester, MA, USA, 1935. [Google Scholar]
- Neto, F.; Fonseca, A.C.M. The satisfaction with migration life scale. Int. J. Int. Relat. 2016, 54, 47–54. [Google Scholar] [CrossRef]
- Shan, H.; Ishak, Z.; Fan, L. The higher the life satisfaction, the better the psychological capital? Life satisfaction and psychological capital: A moderated mediation model. Front. Psychol. 2022, 12, 772129. [Google Scholar] [CrossRef] [PubMed]
- Song, M.Y. A Comparative analysis on daily life satisfaction of the elderly with disability by gender difference. J. Korean Gerontol. Soc. 2011, 21, 143–155. [Google Scholar]
- Chen, C. Aging and life satisfaction. Soc. Indic. Res. 2001, 54, 57–79. [Google Scholar] [CrossRef]
- Ishikawa, M.; Takemi, Y.; Yokoyama, T.; Kusama, K.; Fukuda, Y.; Nakaya, T.; Murayama, N. “Eating together” is associated with food behaviors and demographic factors of older Japanese people who live alone. J. Nutr. Health Aging 2017, 21, 662–672. [Google Scholar] [CrossRef]
- Fedushko, S.; Syerov, Y. Classification of Medical Online Helpdesk Users. In Proceedings of the 2nd IEEE International Rural and Elderly Health Informatics Conference, Cotonou, Benin, 3–4 December 2018; pp. 1–8. [Google Scholar]
- Viklund, E.W.; Forsman, A.K. Exploring the nuanced links between internet use and subjective well-being among older adults: A nordic population-based study. Front. Psychol. 2022, 12, 797269. [Google Scholar] [CrossRef]
- Szabo, A.; Allen, J.; Stephens, C.; Alpass, F. Longitudinal analysis of the relationship between purposes of internet use and well-being among older adults. Gerontologist 2019, 59, 58–68. [Google Scholar] [CrossRef]
- Nam, S.J. Mediating effect of social support on the relationship between older adults’ use of social media and their quality-of-life. Curr. Psychol. 2021, 40, 4590–4598. [Google Scholar] [CrossRef]
- Putnam, R.D. Tuning in, tuning out: The strange disappearance of social capital in America. PS Political Sci. Politics 1995, 28, 664–683. [Google Scholar] [CrossRef]
- Williams, D. On and off the ‘net: Scales for social capital in an online era. J. Comput. Mediat. Commun. 2006, 11, 593–628. [Google Scholar] [CrossRef]
- Ellison, N.B.; Steinfeld, C.; Lampe, C. The benefits of Facebook “friends” social capital and college students’ use of online social network sites. J. Comput. Mediat. Commun. 2007, 12, 1143–1168. [Google Scholar] [CrossRef]
- Coleman, J.S. Social capital in the creation of human capital. Am. J. Soc. 1988, 94, 95–120. [Google Scholar] [CrossRef]
- Lin, N. Social Capital: A Theory of Social Structure and Action; Cambridge University Press: Cambridge, UK, 2001. [Google Scholar]
- Petersen, C.; Johnston, K.A. The impact of social media usage on the cognitive social capital of university students. Inform. Sci. Int. J. Emerg. Trans. 2015, 18, 1–31. [Google Scholar]
- Kim, J.H.; Kang, W.M.; Mun, S.Y. The analysis of the relation between baby boomers’ social capital recognition and social capital formation: Focusing on the volunteering & giving activity. Soc. Welf. Policy 2013, 40, 25–50. [Google Scholar]
- Putnam, R. Social capital: Measurement and consequences. Can. J. Policy Res. 2001, 2, 41–51. [Google Scholar]
- Liu, H.; Shi, J.; Liu, Y.; Sheng, Z. The moderating role of attachment anxiety on social network site use intensity and social capital. Psychol. Rep. 2013, 112, 252–265. [Google Scholar] [CrossRef]
- Guo, Y.; Li, Y.; Ito, N. Exploring the predicted effect of social networking site use on perceived social capital and psychological well-being of Chinese international students in Japan. CyberPsychol. Behav. Soc. Netw. 2014, 17, 52–58. [Google Scholar] [CrossRef]
- Ishii, K. Online communication with strong ties and subjective well-being in Japan. Comput. Hum. Behav. 2017, 66, 129–137. [Google Scholar] [CrossRef]
- Magsamen-Conrad, K.; Billotte-Verhoff, C.; Greene, K. Technology addiction’s contribution to mental wellbeing: The positive effect of online social capital. Comput. Hum. Behav. 2014, 40, 23–30. [Google Scholar] [CrossRef]
- Chen, H.T.; Li, X.Q. The contribution of mobile social media to social capital and psychological well-being: Examining the role of communicative use, friending and self-disclosure. Comput. Hum. Behav. 2017, 75, 958–965. [Google Scholar] [CrossRef]
- Sinclair, T.J.; Grieve, R. Facebook as a source of social connectedness in older adults. Comput. Hum. Behav. 2016, 66, 363–369. [Google Scholar] [CrossRef]
- Lee, Y.A. The effect on human capital and social capital on labor force participation and quality of life among the elderly. Consum. Policy Educ. Rev. 2016, 12, 177–202. [Google Scholar] [CrossRef]
- Kim, C.; Shen, C. Connecting activities on social network sites and life satisfaction: A comparison of older and younger users. Comput. Hum. Behav. 2020, 105, 106–222. [Google Scholar] [CrossRef]
- Zhao, L.; Liang, C.; Gu, D. Mobile social media use and trailing parents’ life satisfaction: Social capital and social integration perspective. Int. J. Aging Hum. Dev. 2021, 92, 383–405. [Google Scholar] [CrossRef] [PubMed]
- National Information Society Agency (NIA). The Report on the Digital Divide of 2021; National Information Society Agency: Seoul, Republic of Korea, 2022. [Google Scholar]
- Valkenburg, P.M.; Peter, J.; Schouten, A.P. Friend networking sites and their relationship to adolescents’ well-being and social self-esteem. CyberPsychol. Behav. 2006, 9, 584–590. [Google Scholar] [CrossRef]
- Boes, S.; Winkelmann, R. The effect of income on general life satisfaction and dissatisfaction. Soc. Indic. Res. 2010, 95, 111–128. [Google Scholar] [CrossRef]
- Hair, J.F., Jr.; Matthews, L.M.; Matthews, R.L.; Sarstedt, M. PLS-SEM or CB-SEM: Updated guidelines on which method to use. Int. J. Multivar. Data Anal. 2017, 1, 107–123. [Google Scholar] [CrossRef]
- Pavlou, P.A.; Fygenson, M. Understanding and predicting electronic commerce adoption: An extension of the theory of planned behavior. MIS Q. 2006, 30, 115–143. [Google Scholar] [CrossRef]
- Melchor, M.Q.; Julián, C.P. The impact of the human element in the information systems quality for decision making and user satisfaction. J. Comput. Inf. Syst. 2008, 4, 44–52. [Google Scholar]
- Baron, R.M.; Kenny, D.A. The moderator-mediator variable distinction in social psychological research: Conceptual, strategic, and statistical considerations. J. Personal. Soc. Psychol. 1986, 51, 1173–1182. [Google Scholar] [CrossRef] [PubMed]
- Podsakoff, P.M.; MacKenzie, S.B.; Lee, J.Y.; Podsakoff, N.P. Common method biases in behavioral research: A critical review of the literature and recommended remedies. J. Appl. Psychol. 2003, 88, 879. [Google Scholar] [CrossRef] [PubMed]
- Kock, N. Common method bias in PLS-SEM: A full collinearity assessment approach. Int. J. e-Collab. 2015, 11, 1–10. [Google Scholar] [CrossRef]
- Li, C.; Zhang, Y.; Xu, Y. Factors influencing the adoption of blockchain in the construction industry: A hybrid approach using PLS-SEM and fsQCA. Building 2022, 12, 1349. [Google Scholar] [CrossRef]
- Bagozzi, R.P.; Yi, Y.; Phillips, L.W. Assessing construct validity in organizational research. In Administrative Science Quarterly; Sage Publications: London, UK, 1991; pp. 421–458. [Google Scholar]
- Cohen, J. A Power Primer. Pychol. Bull. 1992, 112, 155–159. [Google Scholar] [CrossRef]
- Nitzl, C. The use of partial least squares structural equation modelling (PLS-SEM) in management accounting research: Directions for future theory development. J. Account. Lit. 2016, 37, 19–35. [Google Scholar] [CrossRef]
- Faul, F.; Erdfelder, E.; Buchner, A.; Lang, A.G. Statistical power analyses using g*power 3.1: Tests for correlation and regression analyses. Behav. Res. Methods 2009, 41, 1149–1160. [Google Scholar] [CrossRef]
- Ramayah, T.J.F.H.; Cheah, J.; Chuah, F.; Ting, H.; Memon, M.A. Partial Least Squares Structural Equation Modeling (PLS-SEM) Using smartPLS 3.0.: An Updated Guide and Practical Guide to Statistical Analysis; Pearson Malaysia Sdn Bhd: Kuala Lumpur, Malaysia, 2018. [Google Scholar]
- Cheng, K.H.; Tsai, C.C. Students’ motivational beliefs and strategies, perceived immersion and attitudes towards science learning with immersive virtual reality: A partial least squares analysis. Br. J. Educ. Technol. 2020, 51, 2140–2159. [Google Scholar] [CrossRef]
- Habibi, A.; Yusop, F.D.; Razak, R.A. The role of TPACK in affecting pre-service language teachers’ ICT integration during teaching practices: Indonesian context. Educ. Inf. Technol. 2020, 25, 1929–1949. [Google Scholar] [CrossRef]
- Hair, J.F.; Black, W.C.; Babin, B.J.; Anderson, R.E.; Tatham, R.L. Multivariate Data Analysis; Prentice Hall: Upper Saddle River, NJ, USA, 1998; pp. 207–219. [Google Scholar]
- Dijkstra, T.K.; Henseler, J. Consistent partial least squares path modeling. MIS Q. 2015, 39, 297–316. [Google Scholar] [CrossRef]
- Dolinting, P.P.; Pang, V. Assessing the validity and reliability of adapted classroom climates instrument for malaysian rural schools using PLS-SEM. Int. J. Educ. Psychol. Couns. 2022, 7, 383–401. [Google Scholar] [CrossRef]
- Mohd Dzin, N.H.; Lay, Y.F. Validity and reliability of adapted self-efficacy scales in malaysian context using PLS-SEM approach. Educ. Sci. 2021, 11, 676. [Google Scholar] [CrossRef]
- Hair, J.F.; Risher, J.J.; Sarstedt, M.; Ringle, C.M. When to use and how to report the results of PLS-SEM. Eur. Bus. Rev. 2019, 31, 2–24. [Google Scholar] [CrossRef]
- Diamantopoulos, A.; Sarstedt, M.; Fuchs, C.; Wilczynski, P.; Kaiser, S. Guidelines for choosing between multi-item and single-item scales for construct measurement: A predictive validity perspective. J. Acad. Mark. Sci. 2012, 40, 434–449. [Google Scholar] [CrossRef]
- Fornell, C.; Larcker, D. Evaluating structural equation models with unobservable variables and measurement error. J. Mark. Res. 1981, 18, 39–50. [Google Scholar] [CrossRef]
- Hair, J.; Black, B.; Babin, B.; Anderson, R.E.; Tatham, R.L. Multivariate Data Analysis, 6th ed.; Prentice Hall: New York, NY, USA, 2006. [Google Scholar]
- Wijaya, T.T.; Cao, Y.; Bernard, M.; Rahmadi, I.F.; Lavicza, Z.; Surjono, H.D. Factors influencing microgame adoption among secondary school mathematics teachers supported by structural equation modelling-based research. Front. Psychol. 2022, 13, 952549. [Google Scholar] [CrossRef]
- Kline, R.B. Principles and Practice of Structural Equation Modeling; Guilford Press: New York, NY, USA, 2011. [Google Scholar]
- Petter, S.; Straub, D.; Rai, A. Specifying formative constructs in information systems research. MIS Q. 2007, 31, 623–656. [Google Scholar] [CrossRef]
- Hu, L.T.; Bentler, P.M. Fit indices in covariance structure modeling: Sensitivity to underparameterized model misspecification. Psychol. Methods 1998, 3, 424–453. [Google Scholar] [CrossRef]
- Huang, C.H. Using pls-sem model to explore the influencing factors of learning satisfaction in blended learning. Educ. Sci. 2021, 11, 249. [Google Scholar] [CrossRef]
- Henseler, J. Bridging design and behavioral research with variance-based structural equation modeling. J. Advert. 2017, 46, 178–192. [Google Scholar] [CrossRef]
- Albort-Morant, G.; Henseler, J.; Cepeda-Carrión, G.; Leal-Rodríguez, A.L. Potential and realized absorptive capacity as complementary drivers of green product and process innovation performance. Sustainability 2018, 10, 381. [Google Scholar] [CrossRef]
- Hair, J.F.; Ringle, C.M.; Sarstedt, M. PLS-SEM: Iindeed a silver bullet. J. Mark. Theory Pract. 2011, 19, 139–152. [Google Scholar] [CrossRef]
- Falk, R.F.; Miller, N.B. A Primer for Soft Modeling; University of Akron Press: Akron, OH, USA, 1992. [Google Scholar]
- Hair Jr, J.F.; Sarstedt, M.; Hopkins, L.; Kuppelwieser, V.G. Partial least squares structural equation modeling (PLS-SEM): An emerging tool in business research. Eur. Bus. Rev. 2014, 26, 106–121. [Google Scholar] [CrossRef]
- Huber, F.; Herrmann, A.; Meyer, F.; Vogel, J.; Vollhardt, K. Kausalmodellierung Mit Partial Least Squares: Eine Anwendungsorientierte Einführung; Springer: Wiesbaden, Germany, 2008. [Google Scholar]
- Venkatesh, V.; Bala, H. Technology acceptance model 3 and a research agenda on interventions. Decis. Sci. 2008, 39, 273–315. [Google Scholar] [CrossRef]
- Park, J.; Han, S.H.; Kim, H.K.; Cho, Y.; Park, W. Developing elements of user experience for mobile phones and services: Survey, interview, and observation approaches. Hum. Factors Ergon. Manuf. Serv. Ind. 2013, 23, 279–293. [Google Scholar] [CrossRef]
- Hair, J.F.; Black, W.C.; Babin, B.J.; Anderson, R.E. Multivariate Data Analysis, 7th ed.; Prentice-Hall: Hoboken, NJ, USA, 2009. [Google Scholar]
- Khanday, A.M.U.D.; Rabani, S.T.; Khan, Q.R.; Malik, S.H. Detecting twitter hate speech in COVID-19 era using machine learning and ensemble learning techniques. Int. J. Inf. Manag. Data Insights 2022, 2, 100120. [Google Scholar] [CrossRef]
- Khanday, A.M.U.D.; Bhushan, B.; Jhaveri, R.H.; Khan, Q.R.; Raut, R.; Rabani, S.T. NNPCov19: Artificial neural network-based propaganda identification on social media in COVID-19 Era. Mob. Inf. Syst. 2022, 2022, 3412992. [Google Scholar] [CrossRef]


Disclaimer/Publisher’s Note: The statements, opinions and data contained in all publications are solely those of the individual author(s) and contributor(s) and not of MDPI and/or the editor(s). MDPI and/or the editor(s) disclaim responsibility for any injury to people or property resulting from any ideas, methods, instructions or products referred to in the content. |
© 2023 by the authors. Licensee MDPI, Basel, Switzerland. This article is an open access article distributed under the terms and conditions of the Creative Commons Attribution (CC BY) license (https://creativecommons.org/licenses/by/4.0/).