Article

Decoupling Relationship between Resource Environment and High-Quality Economic Development in the Yellow River Basin

1
Business School and MBA Education Center, Henan University of Science and Technology, Luoyang 471023, China
2
Institute of Resources, Environment and Ecology, Tianjin Academy of Social Sciences, Tianjin 300191, China
*
Author to whom correspondence should be addressed.
Sustainability 2023, 15(12), 9385; https://doi.org/10.3390/su15129385
Submission received: 15 May 2023 / Revised: 1 June 2023 / Accepted: 8 June 2023 / Published: 10 June 2023
(This article belongs to the Section Environmental Sustainability and Applications)

Abstract

:
Economic development highly depends on resources and the environment, especially in the Yellow River Basin (YRB), a crucial ecological protection and high-quality development pilot zone in China. Thus, evaluating high-quality economic development (HQED) and its decoupling relationship with the resource environment is conducive to planning future regional development. First, this paper used the two-stage entropy method to measure the high-quality economic development of cities in the YRB from 2010 to 2019. Then, the comprehensive decoupling analysis of the resource environment and high-quality economic development was carried out based on the Tapio decoupling model. The results showed that: (1) The high-quality economic development level improved slowly in the YRB. Nevertheless, the resource and environmental pressure gradually decreased. (2) Compared with the resource decoupling index, the environmental decoupling index had a greater impact on the comprehensive decoupling index in the YRB. The strong decoupling displayed a spatial diffusion trend from point to surface. (3) Despite the decoupling types having a positive transfer trend in the YRB, the decoupling states of cities fluctuated considerably, and the phenomenon of recoupling occurred frequently. According to the above findings, this study put forward some policy recommendations for achieving strong decoupling in the YRB.

1. Introduction

Over the last decades, the development of humanity has led to increasingly unfavorable climate change and negative environmental impacts [1]. Against this background, achieving sustainable development requires socio-economic development in line with ecological constraints [1,2]. The Yellow River, the second-longest river in China, is also known as the cradle of Chinese civilization [3]. As one of the most representative basin spaces [4], the Yellow River runs through nine provinces and autonomous regions in China, traversing several development gradients in the eastern, central, and western areas. The annual coal output, grain–meat output, and the gross domestic product of the YRB accounted for 70%, 1/3, and more than 1/4 of the total national output, respectively. Thus, it is not only an essential economic zone and energy basin [5,6,7] but also a major agricultural product-producing area in China [8]. In other words, it takes an essential strategic position in Chinese economic development [9]. In 2019, China promoted ecological protection and high-quality development in the YRB as a major national strategy and actively explored new paths to achieve high-quality economic development with regional characteristics.
However, the ecological environment in the YRB was sensitive and fragile and has long been affected by climate change and large-scale, high-intensity human development and construction activities. Resource and environmental problems have become increasingly severe [10,11,12]. As a fundamental water source in northern China, the YRB, which accounts for 2.75% of the country’s total water resources, supports 12% of the population’s water needs with its limited water resources, and the per capita water resources are only 1/4 of the national average [13,14,15]. The utilization rate of surface water resources in the basin reached 86%, far exceeding the carrying capacity of the water resources in the YRB [16,17].
In addition, wastewater discharges in the basin reached 4.4 billion cubic meters, and the chemical oxygen demand (COD) emissions from water-consuming industries accounted for more than 80% of industrial emissions [18,19]. In 2022, out of the 20 cities with the worst air quality in China, there were 16 cities located in the YRB [20]. The overload of resources and environment has become a critical situation in the YRB [21]. Therefore, reducing the high dependence of economic activities on the resource environment while achieving high-quality economic development is a challenge in the YRB [22,23].
The relationship between the resource environment and economic development has become a hot topic worldwide [24,25,26,27]. At the beginning of the 20th century, the concept of decoupling began to emerge in environmental research [28,29,30]. Decoupling, a concept to elucidate the dependence of economic growth on resource consumption or environmental pollution [31,32], means the gradual weakening and detachment of the relationship between resource consumption or environmental pollution and economic growth [30,31,33,34,35]. In 2002, the Organization for Economic Cooperation and Development (OECD) first proposed a decoupling index to describe the relationship between economic growth and resource consumption or environmental pollution [36]. By selecting a certain year as a fixed base, the OECD divided the decoupling index into three types [37]. In addition, the OECD decoupling approach is only related to the decline of emission intensity, which can not apply to expanding and recessive economics [38,39]. Compared with the OECD decoupling index, the Tapio decoupling index (2005) divided the decoupling relationship between economic growth and traffic volume into eight decoupling states [40] and avoided the influence of base period selection on decoupling states [37,41,42]. Therefore, it was widely used to describe the asynchronous relationship between economic growth and resource consumption or environmental pollution [32,43,44,45,46].
As for the Yellow River Basin, existing studies mainly focused on the decoupling analysis of the water footprint, ecological footprint, CO2 emissions, and economic growth. For example, some scholars investigated the extent to which the water footprint deviated from economic growth in the YRB. It was found that the water footprint was weakly decoupled from economic growth in the YRB but shifted to strong decoupling after 2016 [47,48]. Based on the Tapio decoupling model, relevant research found that the relationship between water resources utilization efficiency and social–economic development in the YRB showed obvious stage characteristics and regional differences, with five provinces, Qinghai, Sichuan, Ningxia, Shaanxi, and Henan, still not achieving a benign decoupling [49]. From 2005 to 2017, the decoupling relationship between CO2 emissions and economic growth in most provinces of the YRB transferred from weak decoupling to strong decoupling, which indicated that the dependence of economic growth on fossil energy gradually decreased [50]. However, at the city level, 91.2% of cities in the YRB were in a weak decoupling state between CO2 emissions and economic growth [51]. Based on Tapio decoupling analysis, it was found that strong decoupling between the ecological footprint and economic growth occurred 60 times in 43 cities along the Yellow River from 2007 to 2017, indicating that the YRB still faced the dual tasks of maintaining growth and promoting decoupling [23].
Previous studies investigated the decoupling relationship between the resource environment and economic development in the YRB. However, some limitations still existed: (1) previous research widely used GDP as a measure of economic growth. However, the connotation of high-quality economic development is rich and needs a comprehensive index system to reflect it. (2) The previous literature quantified the decoupling relationship between a single resource and environmental factors such as water footprint, ecological footprint, CO2 emissions, and economic growth in the YRB. However, to our knowledge, no systematic study evaluated the comprehensive decoupling state between the resource environment and high-quality economic development in the YRB. (3) From the perspective of spatial distribution, previous studies focused on the decoupling between resource consumption or environmental pollution and economic development in different provinces, cities, and upstream, middle, and downstream regions of the YRB. However, the dynamic evolution of the decoupling states was rarely explored.
In light of this, the rest of the paper is structured as follows. According to the connotation of high-quality development, in Section 2, an evaluation index system is constructed from the dimensions of economic growth: driving forces, economic growth structure, and economic growth performance. Then, Section 3 constructs a comprehensive decoupling index to comprehensively and systematically evaluate the decoupling states between the resource environment and economic development in the YRB. Furthermore, using the Markov chain, an approach for calculating the probability distribution and variation of decoupling types, this paper explores the dynamic evolution characteristics of the comprehensive decoupling index, which is illustrated in Section 4. Section 5 offers the conclusions and relevant recommendations. Finally, Section 6 proposes the limitations of the study.

2. HQED Evaluation Index System

HQED is the concentrated manifestation and high summary of the five concepts of innovation, coordination, green, openness, and sharing [52]. Wang and Che (2022) took the green total factor productivity as a proxy indicator for high-quality economic development [53]. However, high-quality economic development is a complex system [54] involving multiple aspects of the economy [55]. Thus, a single indicator could not accurately reflect the level of high-quality economic development. More and more studies considered it a new development concept that highly integrates the ideas of innovation, coordination, green, openness, and sharing [56,57], and established an evaluation system for high-quality economic development in the YRB [58,59,60,61].
It should be noted that the index system should embody the core concept of high-quality development, but also cover relevant indicators of economic growth quality. Innovation plays a fundamental role in providing economic development momentum [52,62,63]. Green development is a common form of high-quality economic development [24]. Furthermore, development combining innovation and green as the momentums of economic growth is an advanced form of high-quality economic development [64]. Coordinated development aims to address the issue of imbalanced development; openness development focuses on solving the problem of internal and external linkage in development; shared development focuses on addressing issues of social fairness and justice [52,65]. Therefore, based on the existing literature [55,66,67,68,69,70], this paper incorporated the five concepts of innovation, coordination, green, openness, and sharing into the evaluation system of economic growth quality. According to the previous literature [71], this study developed a conceptual framework related to the HQED evaluation index system, as shown in Figure 1. Fifteen indicators were selected from three dimensions of economic growth driving forces, economic growth structure, and performance.
In Figure 1, the five colors, namely, yellow, light blue, green, orange, and red, denote the five development concepts of innovation, coordination, green, openness, and sharing. Specifically, the economic growth driving forces included indicators of capital productivity, labor productivity, fiscal expenditure on science and technology, scientific and technological personnel (expressed by the number of employees in the information technology industry), number of patents granted, urban green coverage percentage in built-up areas, and the comprehensive utilization rate of industrial solid waste, which reflected the development concepts of coordination, innovation, and green development. Economic growth structure covered the four indicators of urbanization rate, industrial structure (expressed by the proportion of tertiary industry output in GDP), degree of dependence on foreign trade, and tourism income, reflecting the concepts of coordination and openness. The economic growth performance dimension selected four indicators, namely urban unemployment rate, medical security (expressed by beds of medical institutions per 10,000 population), internet penetration rate, and urban public green space per capita, which reflected the concept of shared development.

3. Methods and Data

3.1. Comprehensive Decoupling Index

According to Tapio’s decoupling theory [40], an elasticity method dynamically reflecting the decoupling relationship [72], the decoupling index between resource consumption or environmental pollution indicators and the level of high-quality economic development in the YRB is expressed as follows:
ε i = Δ R R Δ E E
Among them, Δ R denotes the change in the consumption of a certain resource or an environmental pollution indicator in the period i , and R is the indicator value at the beginning of the period i . Δ E represents the change in the high-quality economic development level, and E is the high-quality economic development level in the starting year of the period i .
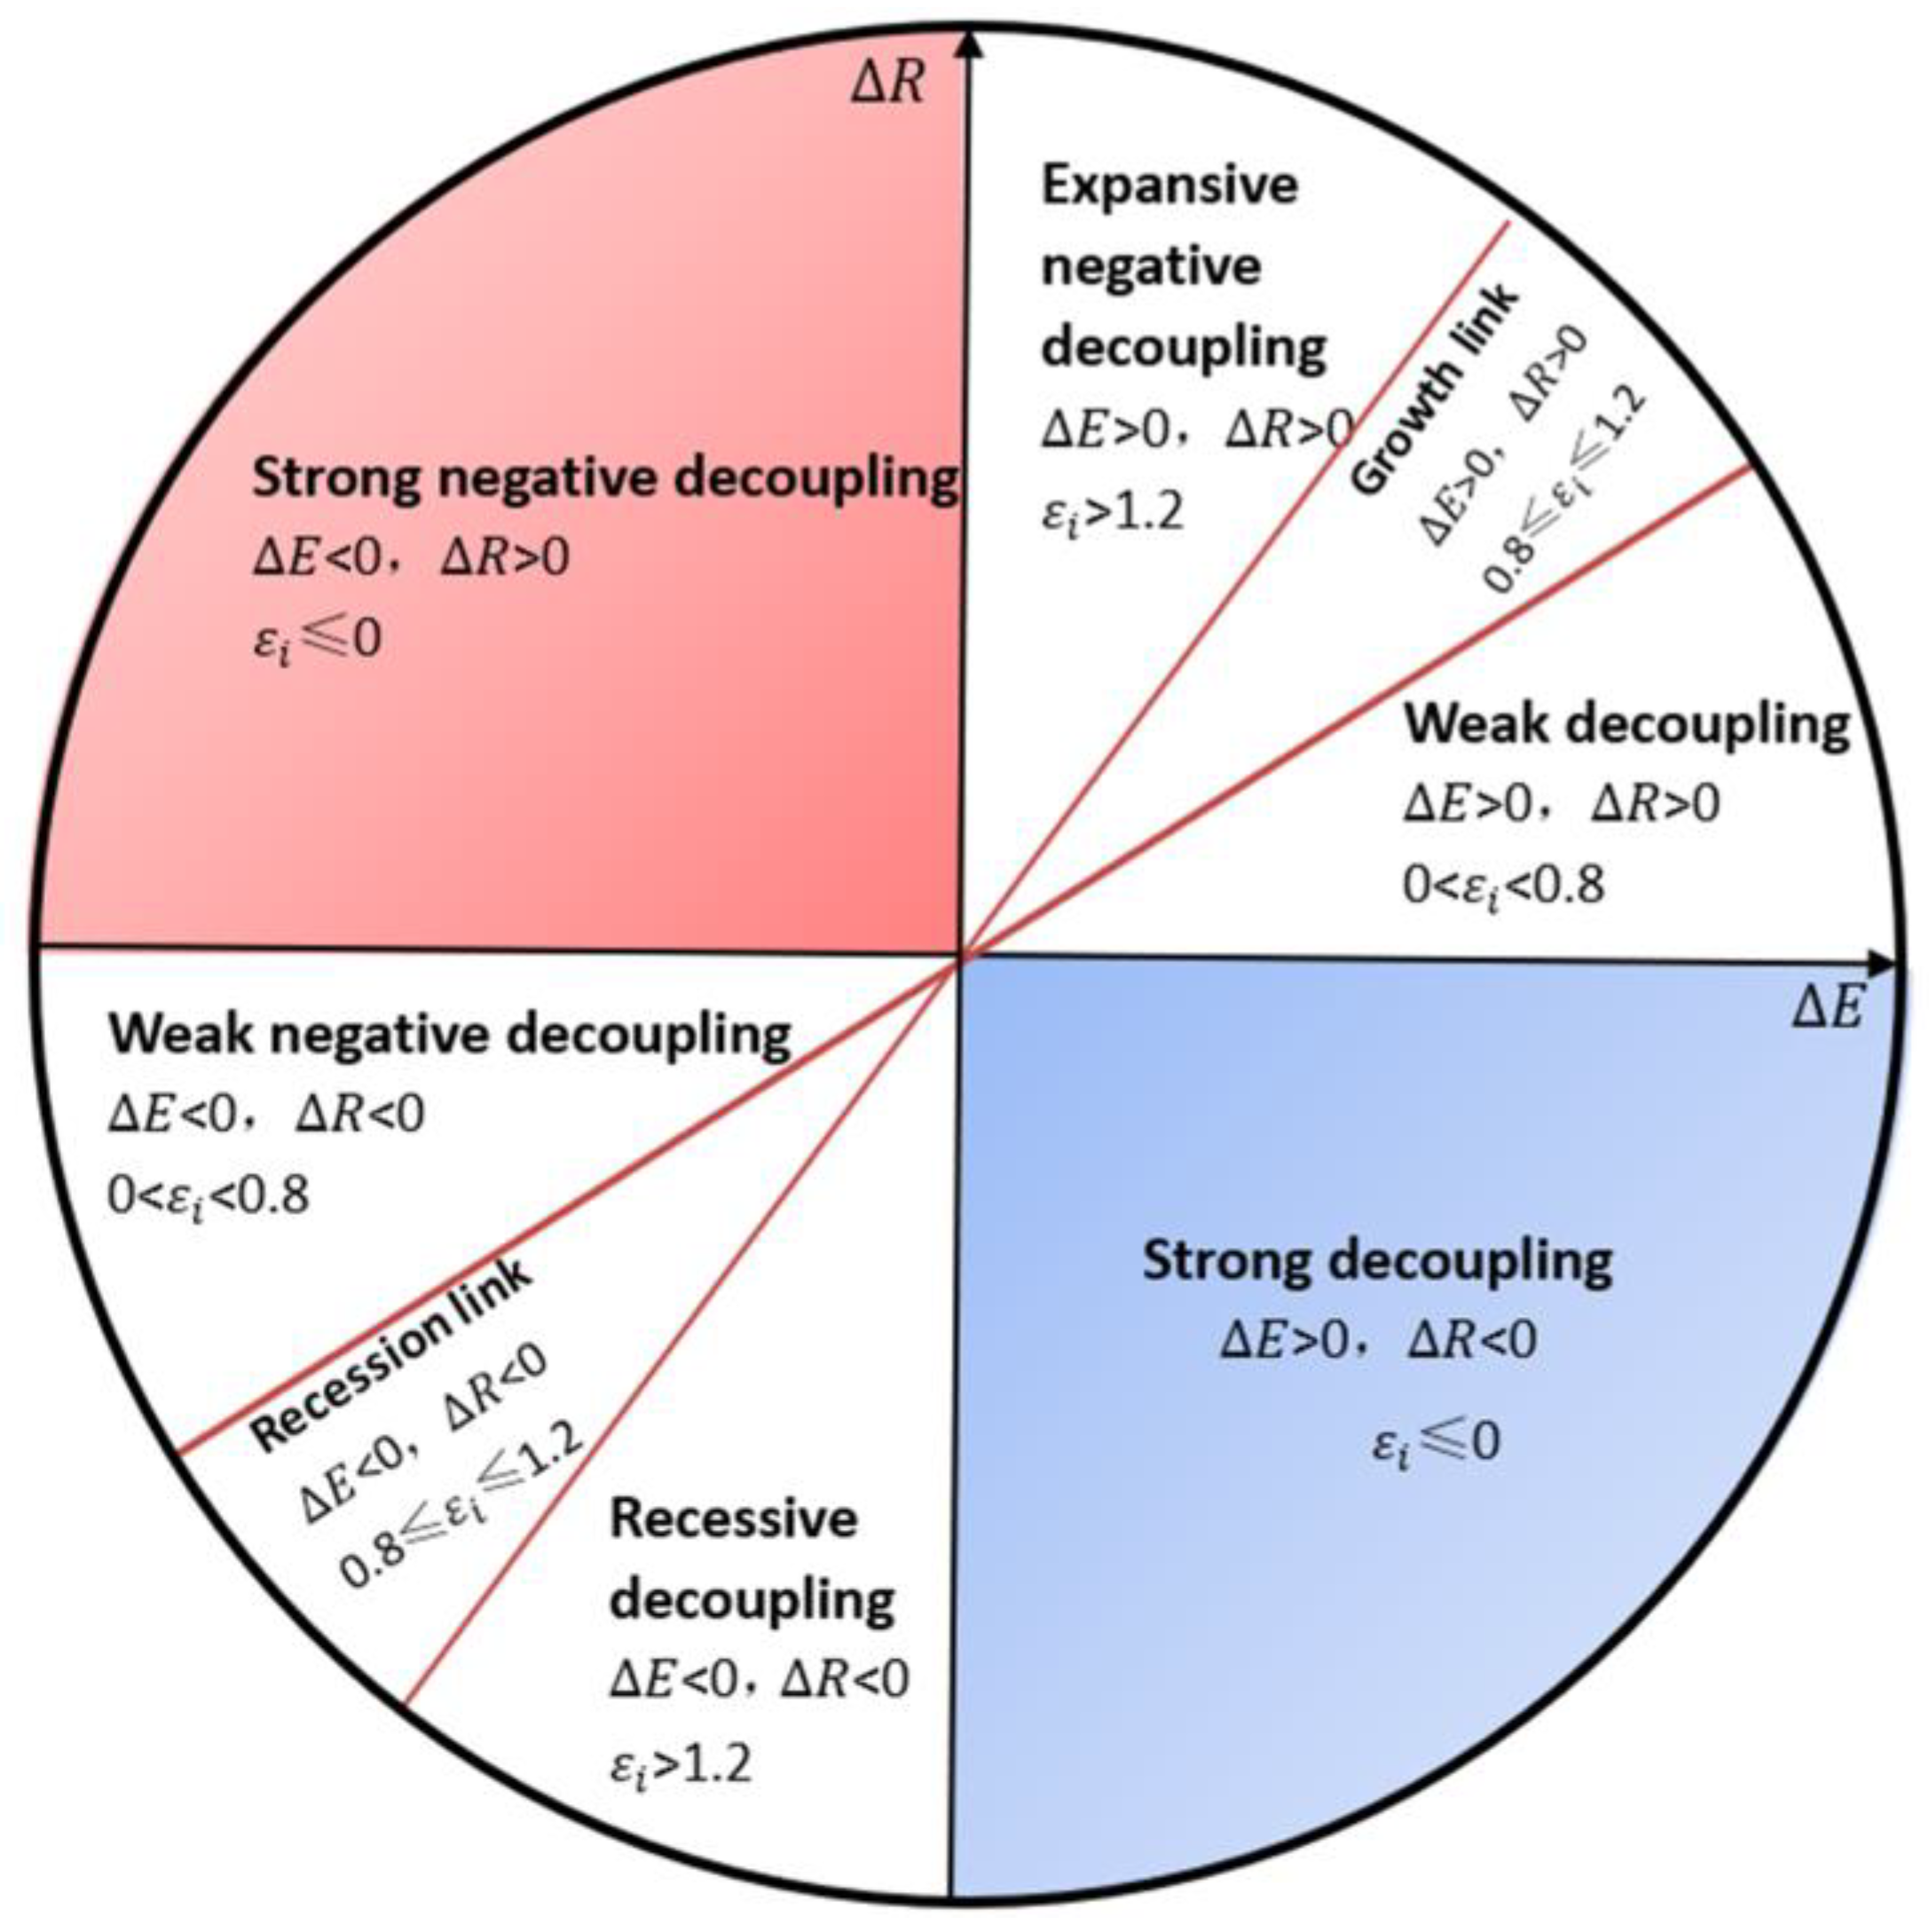
According to the values of Δ R , Δ E , and the decoupling index, the decoupling relationship can be classified into eight states: weak decoupling, strong decoupling, recessive decoupling, expansive negative decoupling, strong negative decoupling, weak negative decoupling, recession link, and growth link using 0, 0.8, and 1.2 as boundaries, as shown in Figure 2.
According to the processing method in previous studies [73,74], this paper constructed a comprehensive decoupling index of the resource environment. It selected cultivated land area and water resource consumption as two resource consumption indicators and chose industrial wastewater discharge, industrial sulfur dioxide emissions, and industrial soot emissions as the three environmental pollution indicators. The comprehensive decoupling index is calculated in Equation (2).
T A i = [ α = 1 2 R A i α 2 + β = 1 3 R B i β 3 ]
Among them, T A i represents the comprehensive decoupling index of the resource environment in the period i . R A i α is the decoupling index of a certain resource indicator α in the period i ; R B i β denotes the decoupling index of a specific environmental pollution indicator β in the period i .

3.2. Markov Chain Model

A Markov chain is a Markov process with both time and state being discrete [75,76,77], which is widely used to describe the evolution of a random variable over time [78]. Given this, this study used the Markov chain model to analyze the evolution of the comprehensive decoupling types of resource environment in the YRB.
Considering the computability and verifiability of indices in the Markov chain [34], eight decoupling states were grouped into three types: negative decoupling type (including strong negative decoupling, weak negative decoupling, and expansive negative decoupling), link type (growth link and recession link), and decoupling type (strong decoupling, weak decoupling, and recessive decoupling). Then, the transition of comprehensive decoupling types in the YRB is depicted in a Markov transition probability matrix:
M p q = n p q n p
where M p q denotes the probability that a city with decoupling type p at year t changed to type q at year t + d . n p q denotes the number of cities that transitioned from type p at year t to type q at year t + d . n p indicates the number of cities with the decoupling type p during the study period. M p q satisfies the following conditions:
{ 0 M p q 1 q = 1 n M p q = 1

3.3. Two-Stage Entropy Method

Given the multi-dimensional and multi-layer characteristics of the multi-index evaluation system, the two-stage entropy method [79,80] was adopted to measure the level of high-quality economic development of cities in the YRB.
Firstly, the proportion of the n th indicator of city m in the k th dimension is as follows:
p m n k = y m n k m = 1 60 y m n k
where y m n k represents the normalized value of the n th indicator of city m in the k th dimension of the evaluation index system ( k = 1, 2, 3; m = 1, 2, …, 60; n = 1, 2, …, r ). Then, the information entropy value of the n th indicator in the k th dimension is shown in Equation (6).
e n k = 1 ln m m = 1 60 p m n k ln p m n k
In Formula (7), the sum of all the indicators in the k th dimension can be carried out:
Y m k = n = 1 r 1 e n k n = 1 r ( 1 e n k ) p m n k
The proportion of all the indicators in the k th dimension of city m can be calculated by Equation (8).
g m k = n = 1 r 1 e n k n = 1 r ( 1 e n k ) p m n k m = 1 60 n = 1 r 1 e n k n = 1 r ( 1 e n k ) p m n k
The information entropy of the k th dimension is as follows:
e k = 1 ln m m = 1 60 g m k ln g m k
The weight of the k th dimension can be expressed in Equation (10).
w k = ( 1 e k ) k = 1 3 ( 1 e k )
The high-quality economic development level of city m can be expressed as follows:
U m = k = 1 3 w k Y m k

3.4. Study Area and Data Sources

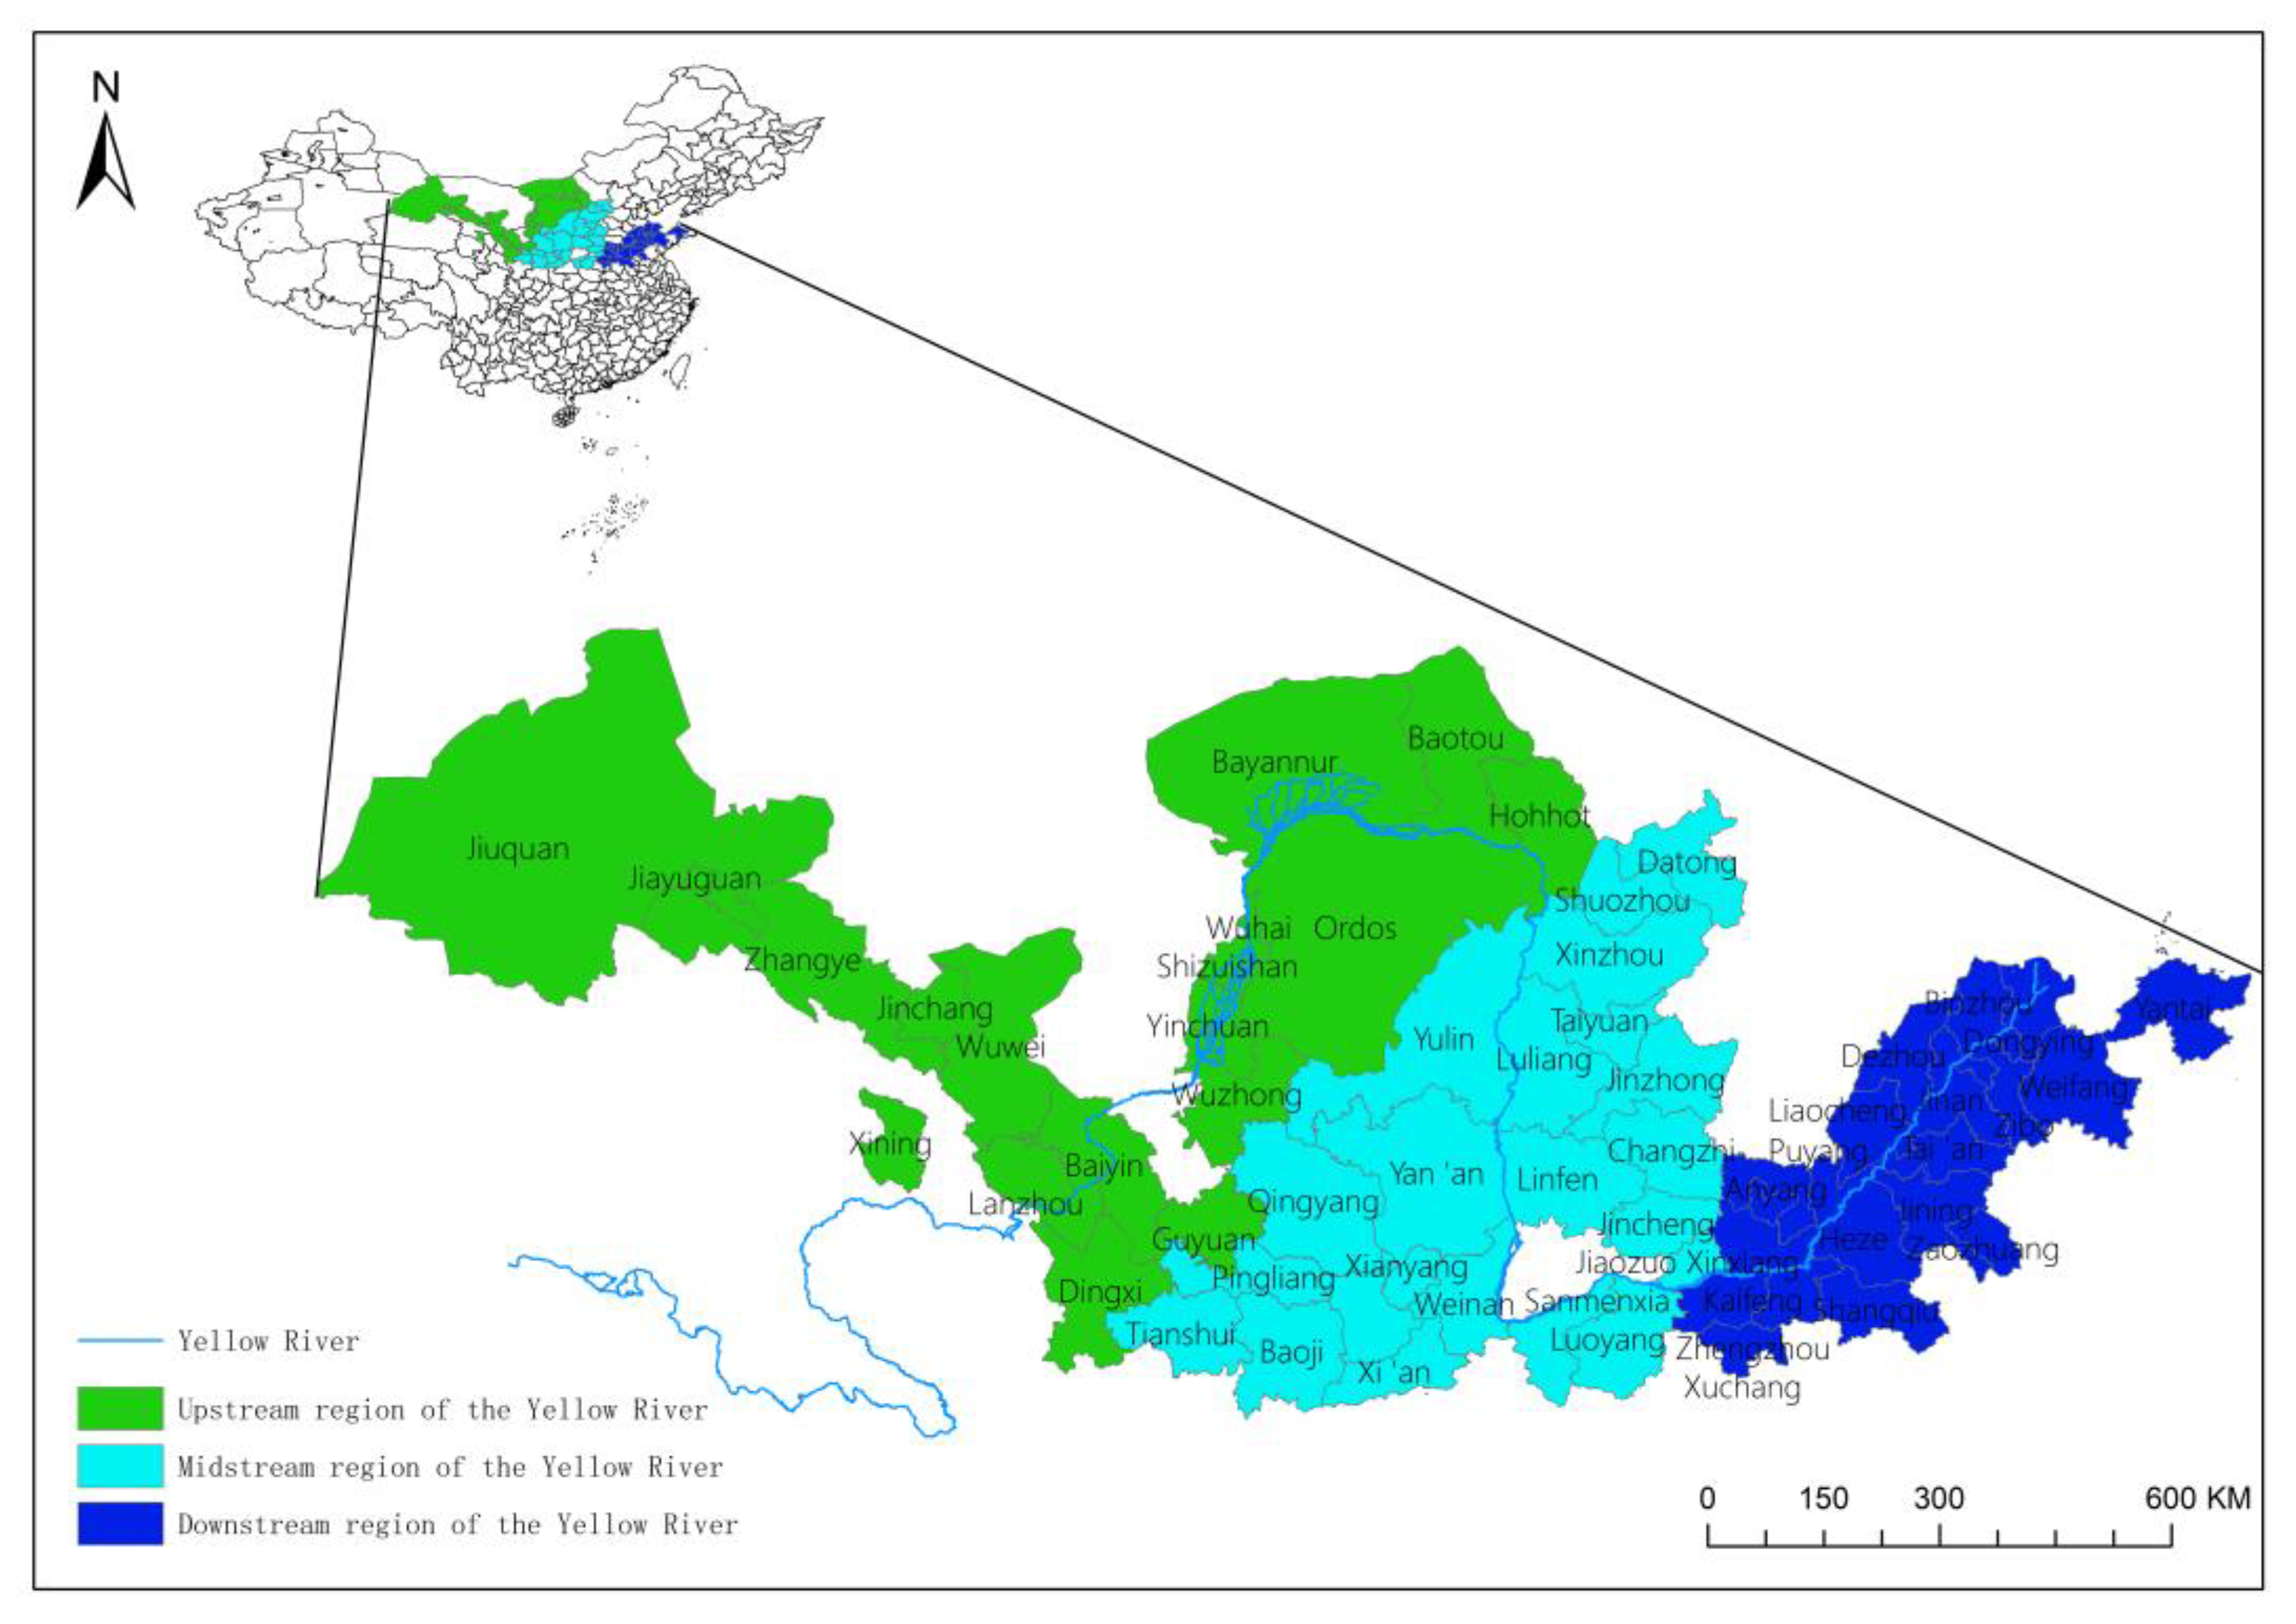
According to the Ecological Protection and High-quality Development Plan in the Yellow River Basin, this study selected 60 prefecture-level cities available in data as the study area, including 18 cities in the upper reaches, 22 cities in the middle reaches, and 20 cities in the lower reaches, as shown in Figure 3.
The period of this study was from 2010 to 2019. The data on high-quality economic development indicators, cultivated land area, industrial wastewater discharge, industrial sulfur dioxide emissions, and industrial soot emissions were extracted from the Urban Statistical Yearbook in China and the National Economic and Social Development Statistical Communiques. The water resources consumption data came from water resources bulletins of provinces and cities. Individual missing data in cultivated land area and water resources consumption were supplemented by the interpolation method, which made the data entire and coherent. In addition, the data related to amounts were adjusted to the 2010 constant price to eliminate the influence of price.

4. Results and Discussion

4.1. The HQED Level and Resource and Environmental Pressure in the YRB

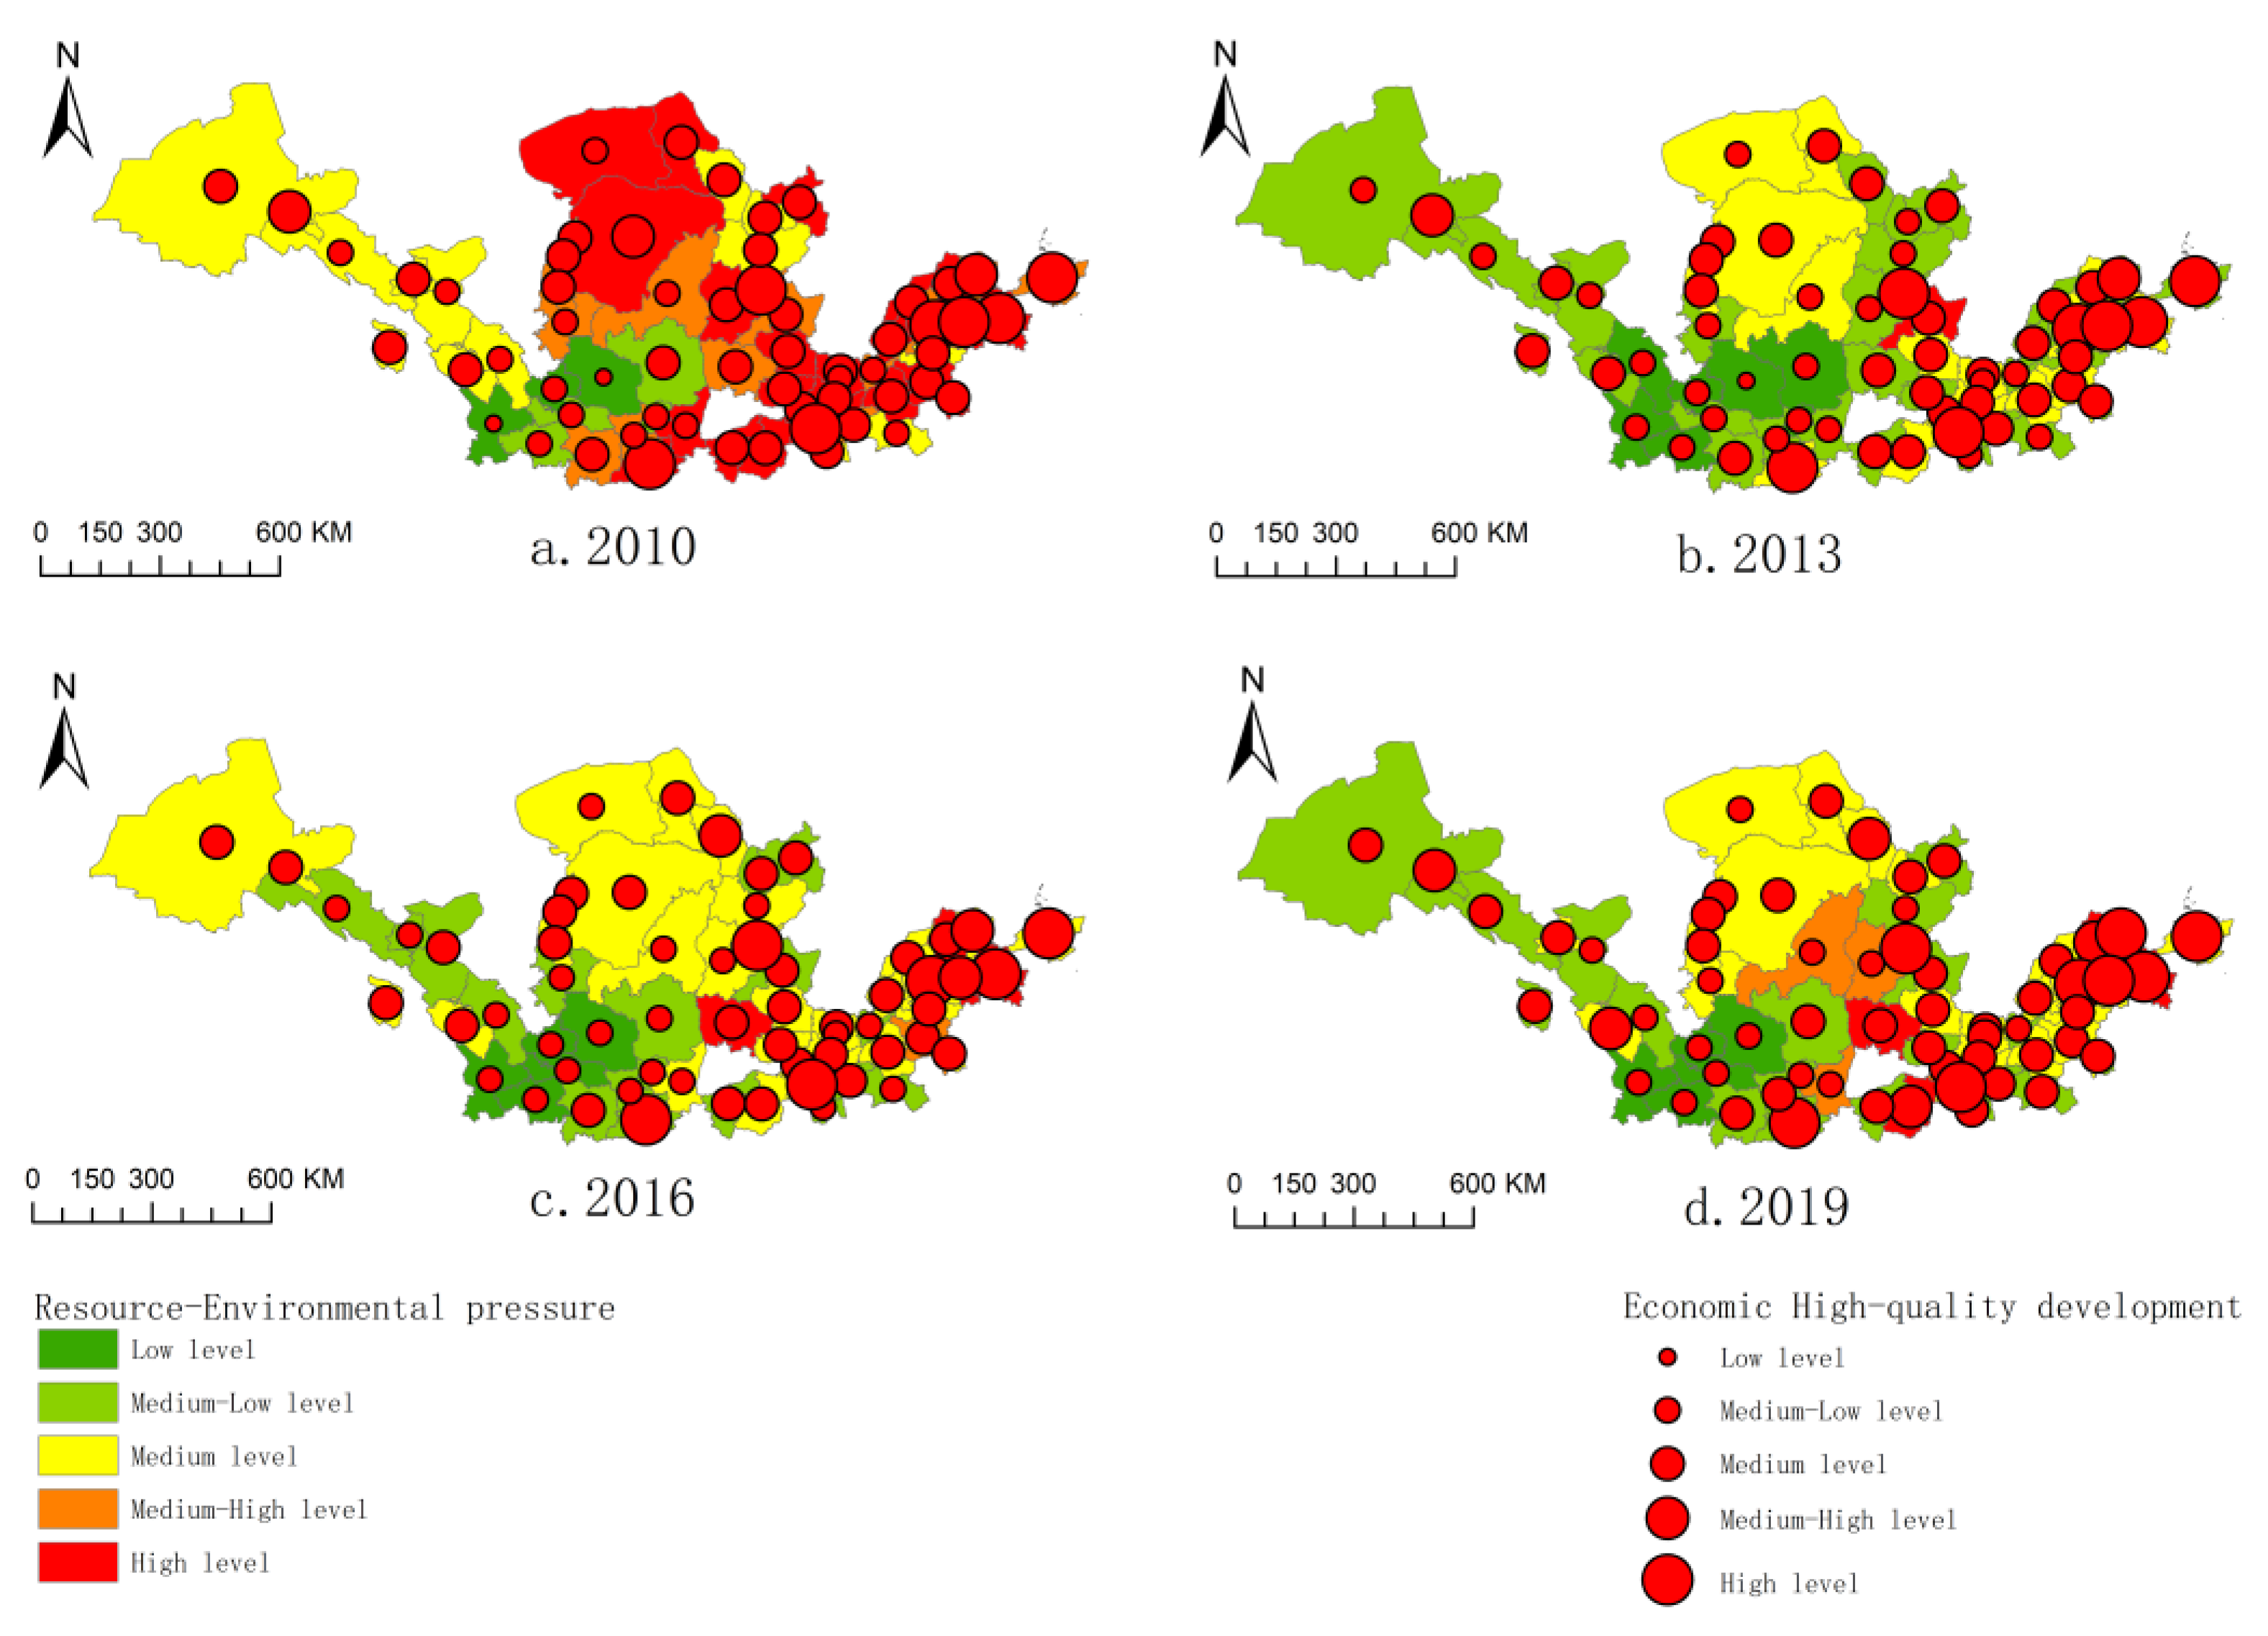
The study classified the HQED and resource environmental pressure into five levels using the mean–standard deviation approach, and the spatial–temporal distributions of the two in the YRB were shown in Figure 4.
Figure 4 revealed that the HQED gradually improved from 2010 to 2019 in the YRB. Since 2013, the number of cities at the medium level, medium-high level, and high level increased steadily, except for the cities at the medium-low level, which experienced an evident downward trend. In 2019, only 13% of the cities were at the high level, while 9% of the cities were at the medium-high level, 25% of the cities reached the medium-low level, and 53% of the cities reached the medium level. Notably, since 2016, the number of cities at a low level was always 0 in the YRB.
In spatial distribution, it demonstrated that cities at a higher-high-quality economic development level were concentrated in the southeast while cities at a lower level were gathered in the northwest of the YRB. In terms of distribution in the basin, 80% of the cities at medium-high and high levels were in the middle and lower reaches, while the remaining 20% were in the upper reaches, which was consistent with the previous literature measuring the HQED from the dimensions of economic development inputs, processes, and outputs [81].
In terms of the resource environment, the resource and environmental pressure of most cities in the YRB was alleviated during the period 2010–2019, which was consistent with the conclusions of the relevant research [82]. More specifically, the proportion of cities with high and medium-high levels of resource and environmental pressure decreased from 60% to 15% in 2010–2019. In contrast, cities with low and medium-low levels increased from 12% to 43%. Meanwhile, the number of cities with a medium level of resource and environmental pressure fluctuated significantly but still declined.
In spatial distribution, cities in the bend of the YRB faced more serious pressure on the resource environment, which could be attributed to their high dependence on energy and heavy industry [65]. For example, there was an apparent rebound phenomenon of the resource environmental pressure of some cities in Shandong and Shanxi (such as the resource-based cities Jinzhong and Linfen), mainly due to the rising water resources consumption, sulfur dioxide emissions, and industrial soot emissions.
As for the superposition relationship of resource environmental pressure and the HQED, in the upstream cities, their resource environmental pressure was relatively low, but the HQED levels of those cities were also at a lower level due to a small-scale population and the important role in ecological conservation. In the middle reaches, a large number of industrial pollutant emissions in resource-based cities resulted in heavy pressure on resources and the environment. Although the downstream cities had a relatively higher HQED level, the increased population density and rapid economic growth posed growing pressure on resources and the environment.

4.2. Comprehensive Decoupling Analysis in the YRB

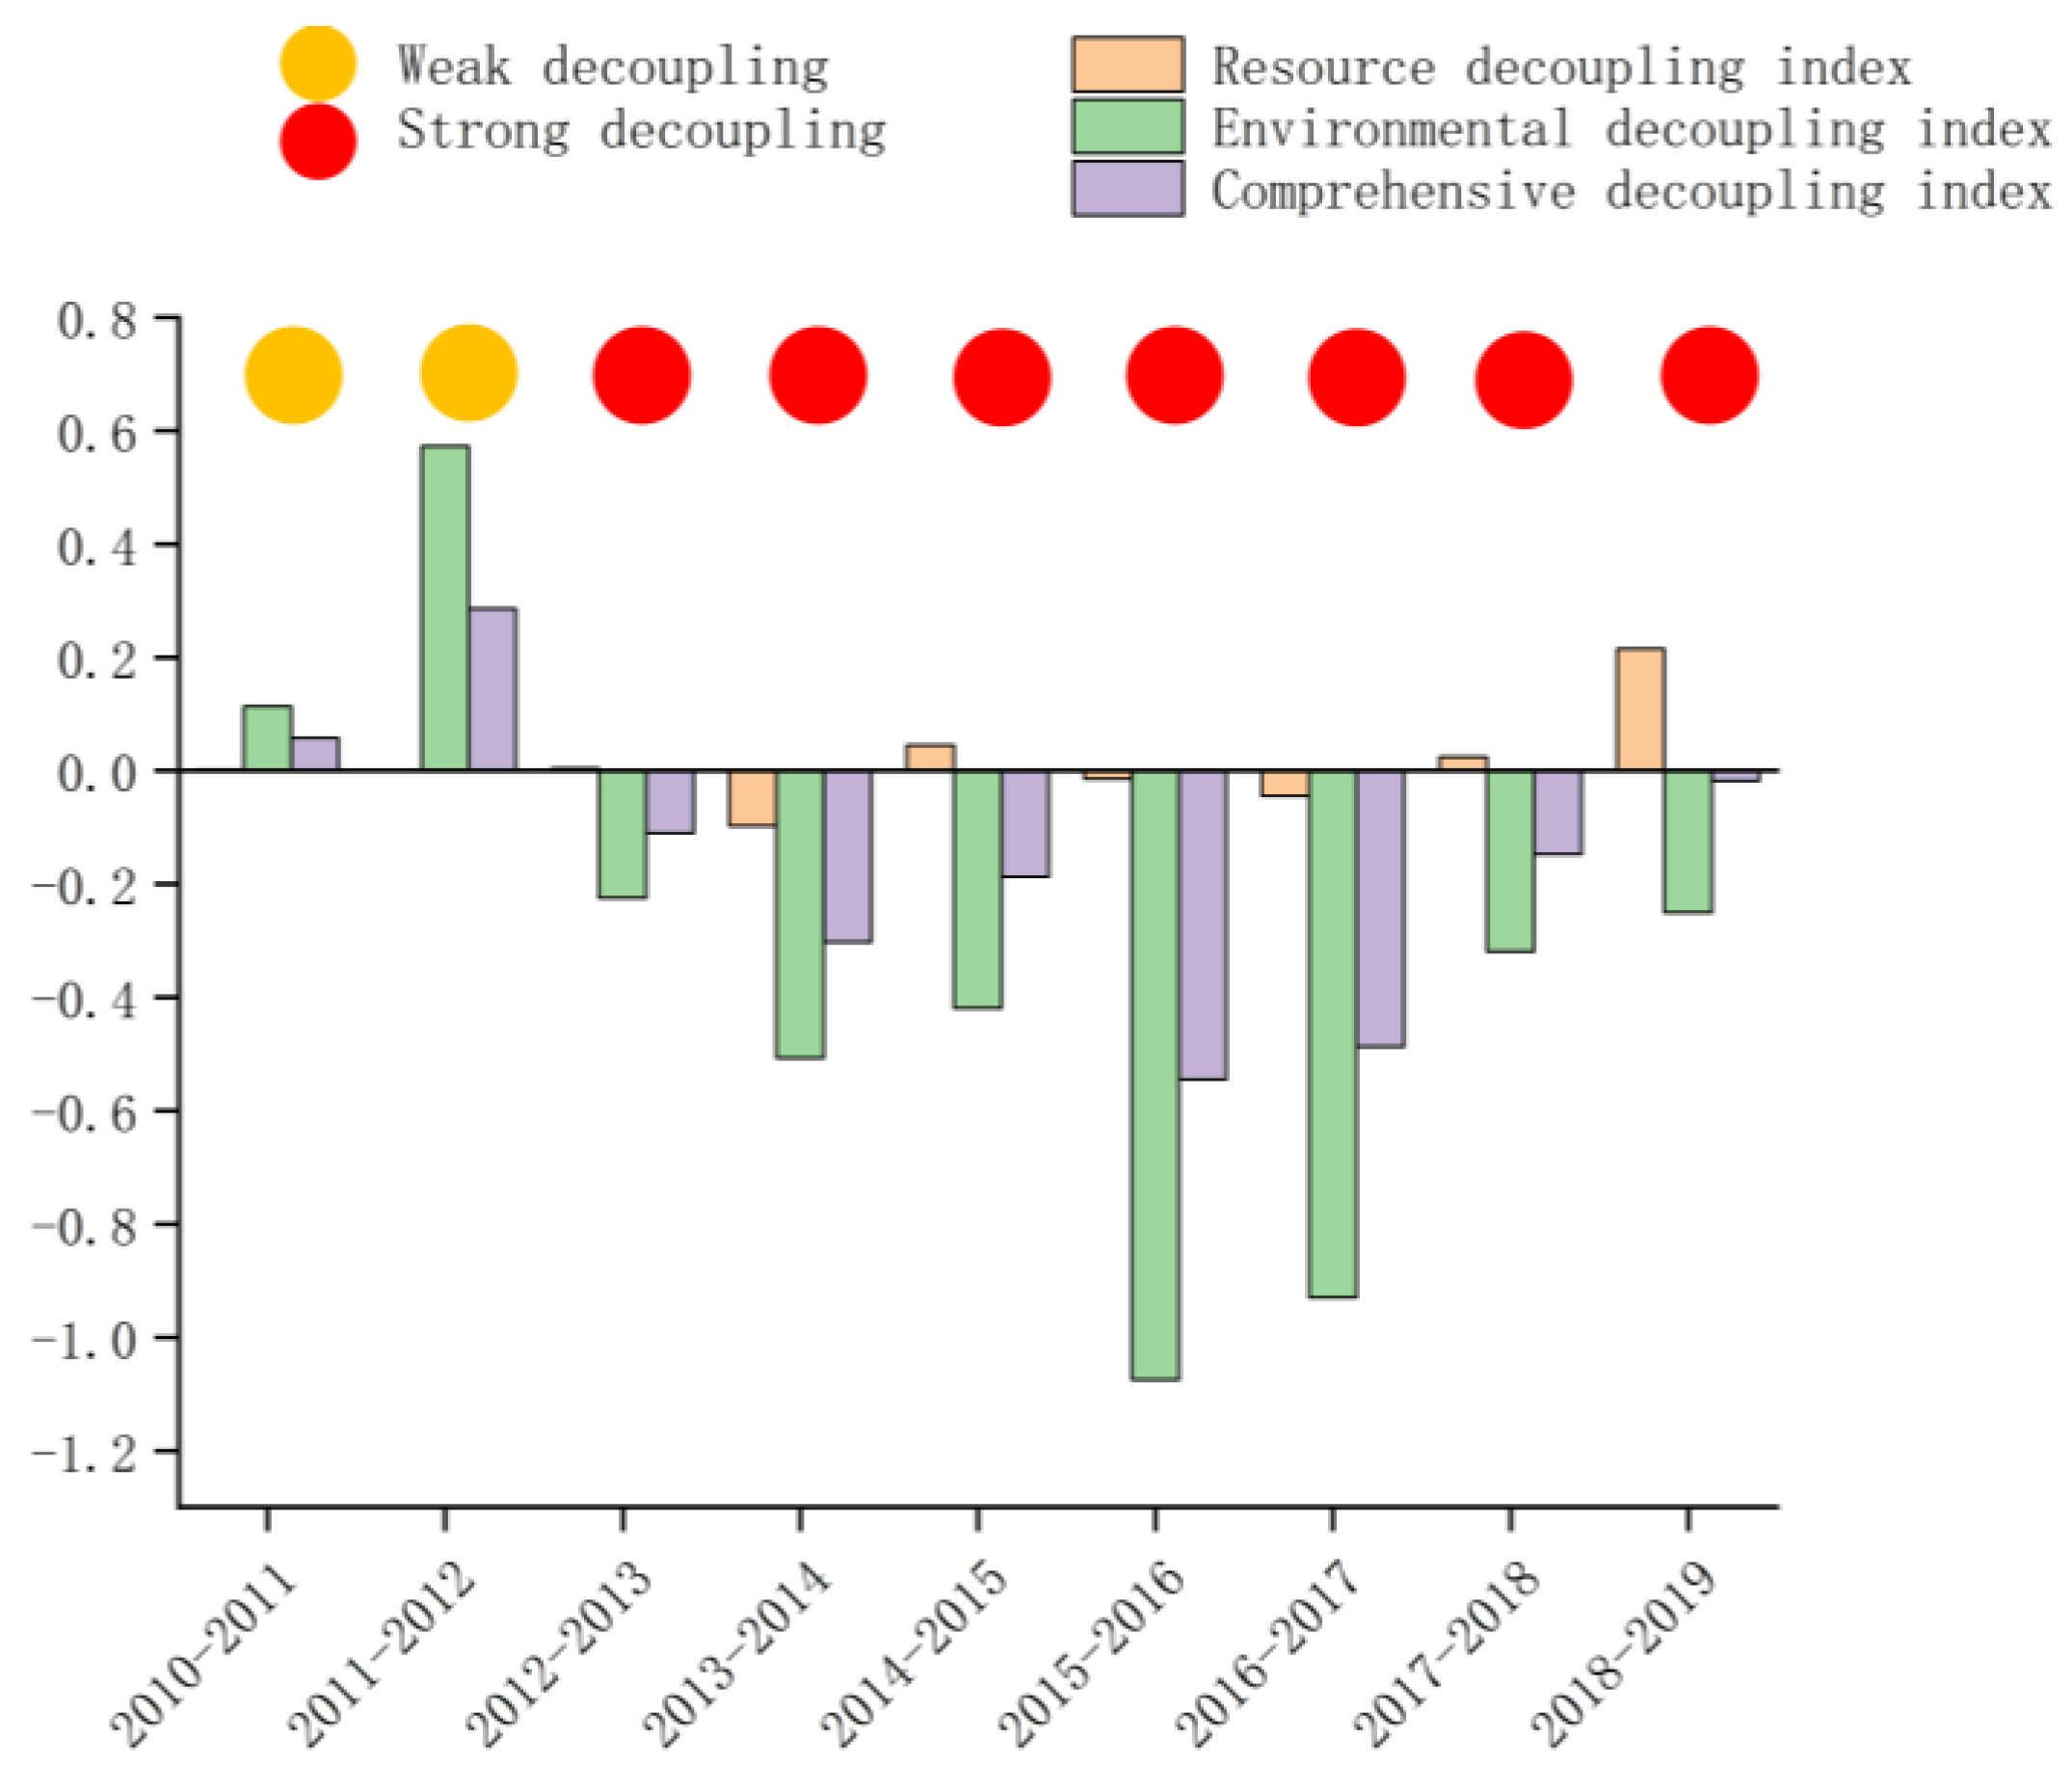
For the sake of analyzing the extent of the high-quality economic development affected by resources consumption and the environment in the YRB, this paper calculated the resource decoupling index, environmental decoupling index, and comprehensive decoupling index referring to Equations (1) and (2), as shown in Figure 5.
As depicted in Figure 5, from 2010 to 2019, the resource decoupling index fluctuated between −0.1 and 0.21, with an alternating pattern between strong and weak decoupling. Notably, in 2014–2015, 2017–2018, and 2018–2019, the water resources consumption in the YRB increased significantly, causing the resource decoupling index to change from negative to positive. In contrast, the environmental decoupling index experienced the greatest fluctuation, ranging from −1.1 to 0.57, and had a greater impact on the comprehensive decoupling index. In terms of comprehensive decoupling, it was weak decoupling in 2010–2011 and 2011–2012, while in other periods, it was strong decoupling.
As a major turning point of ecological development, the 18th National Congress of the Communist Party of China proposed to place the construction of ecological civilization in a prominent position [24]. Against this background, the coordinated development of the resource environment and economic growth attracted unprecedented attention. Through industrial restructuring, by 2014, the proportion of the secondary industry in the YRB accounted for less than 50% for the first time. In 2015, China first proposed promoting green development and took it as an essential way to solve the resource environment problems in China. It could be seen that, from 2015 to 2016, the comprehensive and environmental decoupling indexes in the YRB reached their lowest values, indicating that while the economy was rapidly developing, resource consumption and environmental pollution were gradually decreasing. Then, the comprehensive decoupling index in the YRB was negative, whereas its absolute value gradually decreased after 2016.

4.2.1. Spatial Distribution of City-Level Comprehensive Decoupling Status

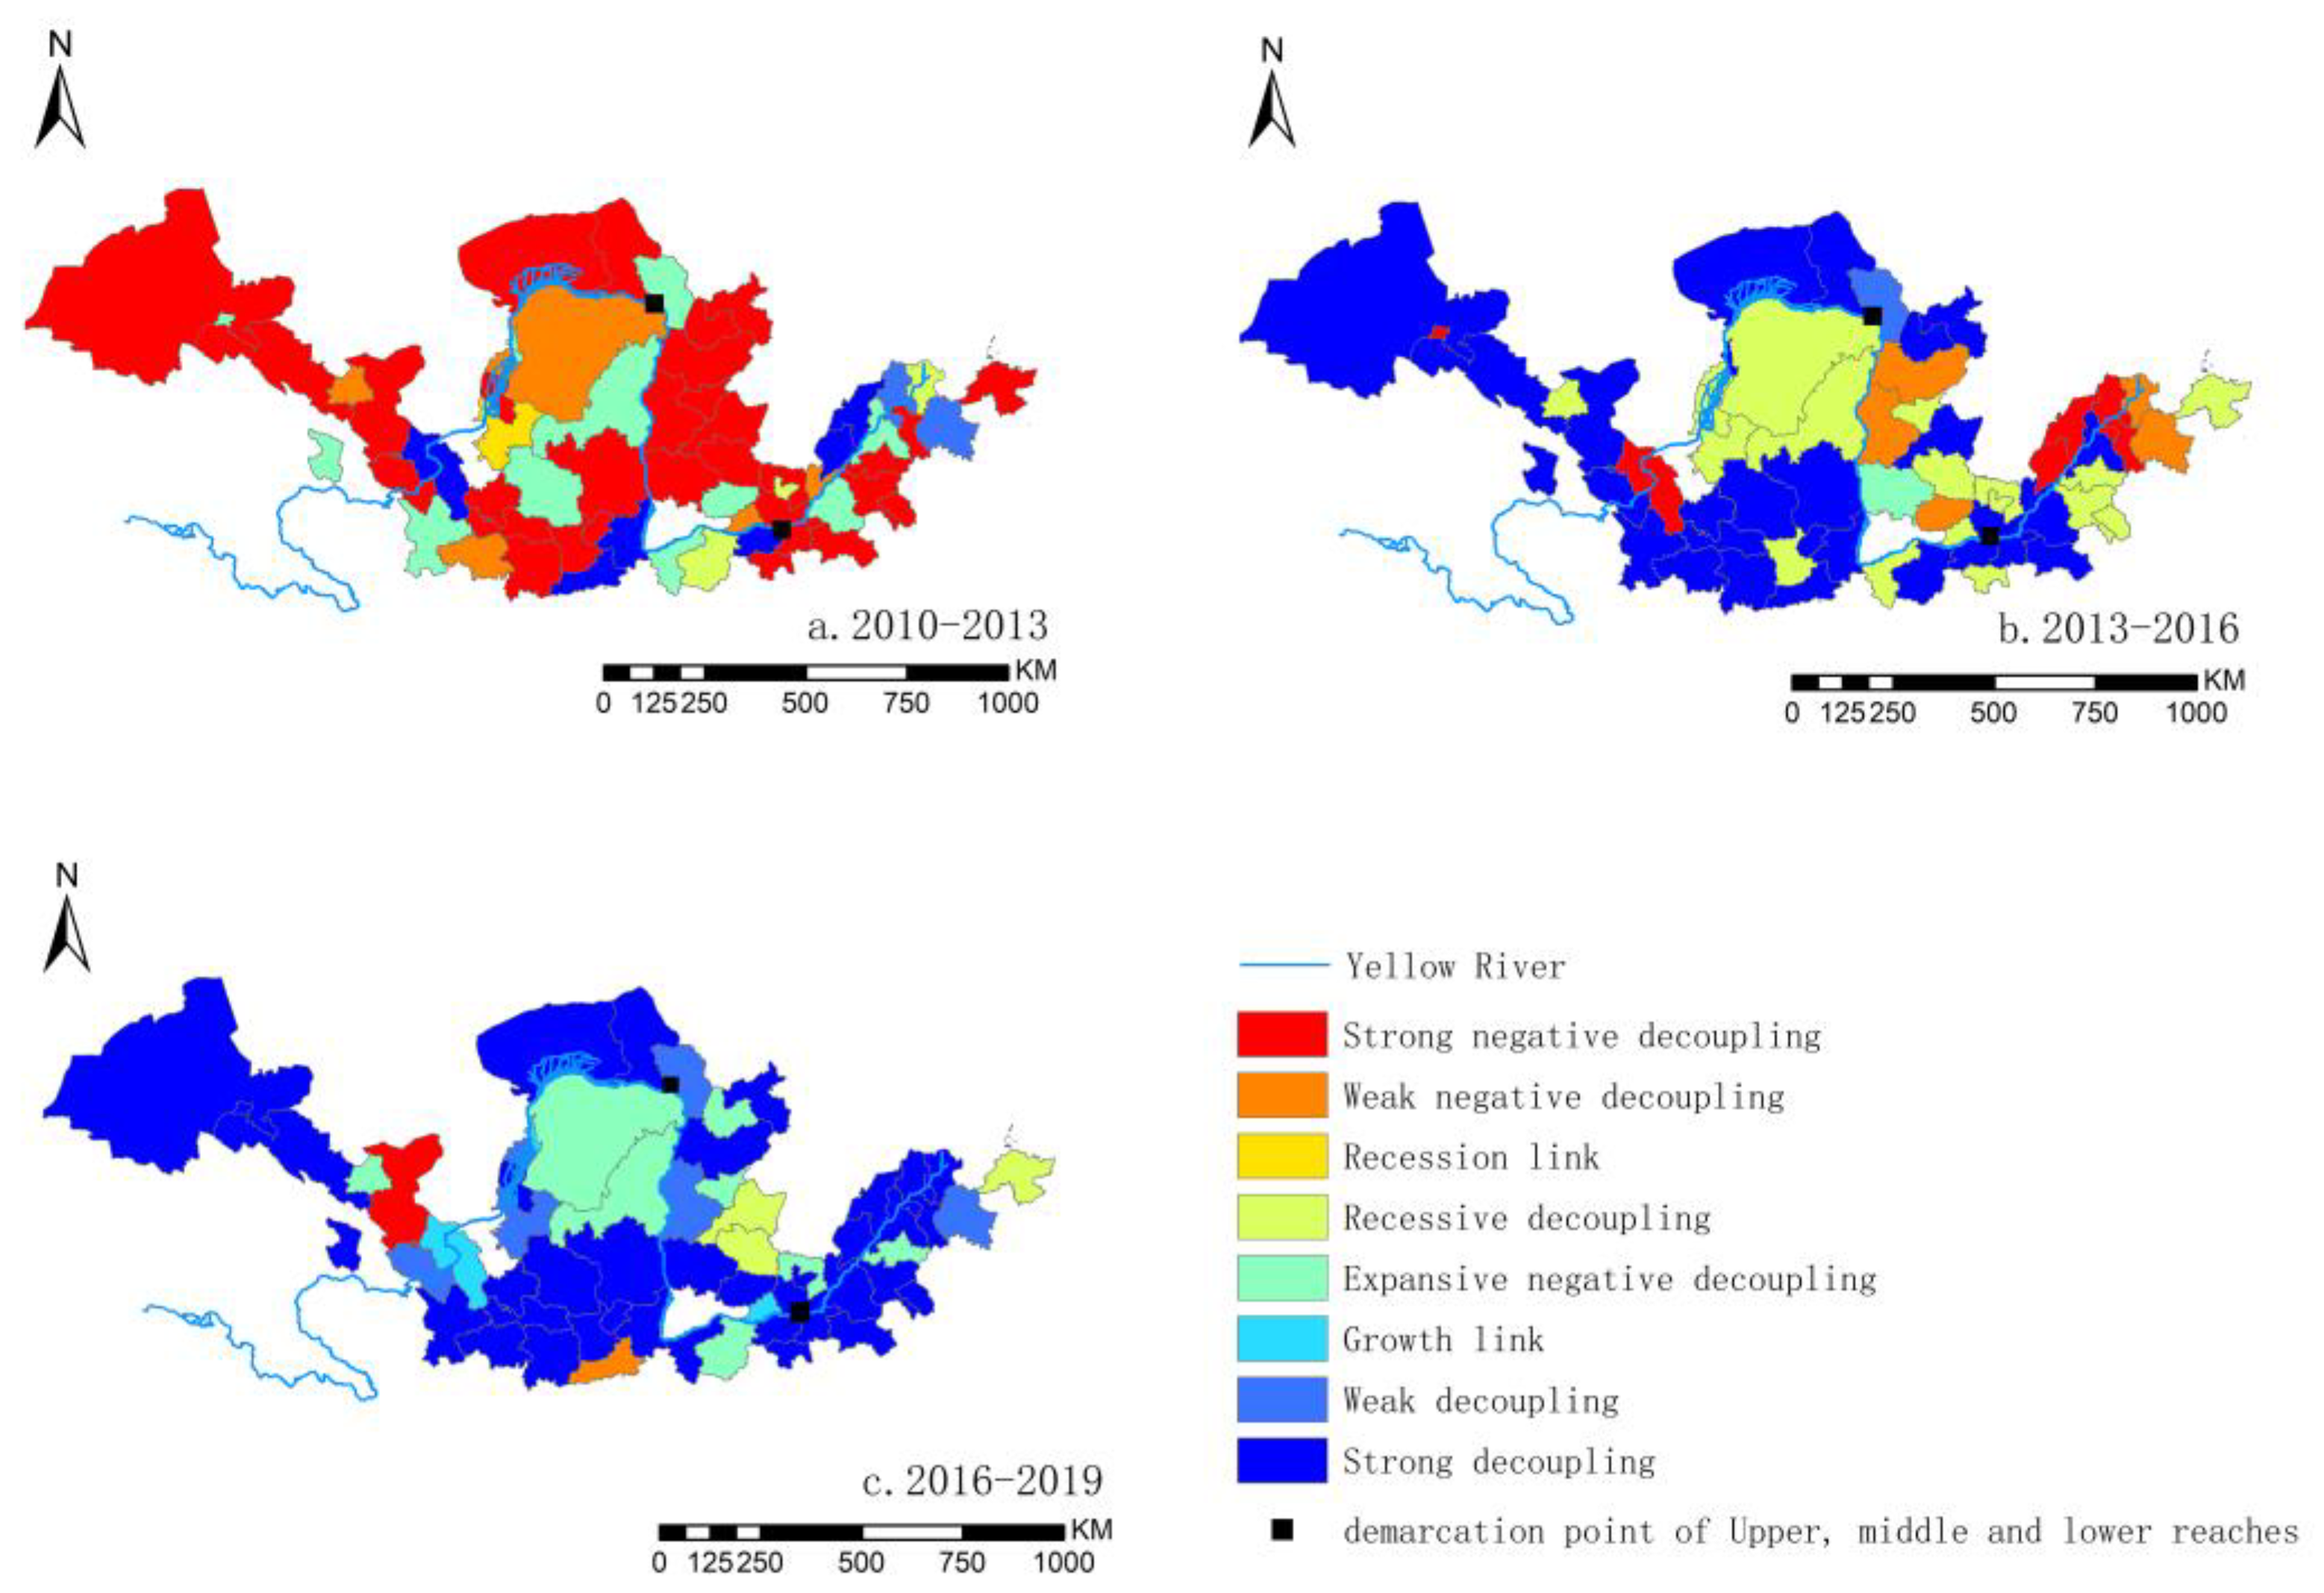
Figure 6 presents the city-level comprehensive decoupling states in the YRB in 2010–2013, 2013–2016, and 2016–2019, respectively.
At the city level, the comprehensive decoupling states continuously improved from 2010 to 2019 (Figure 6). Specifically, the number of cities in the negative decoupling type (strong negative decoupling, weak negative decoupling, and expansive negative decoupling) decreased from 49 to 10, while the number of cities in the decoupling type (strong, weak, and recessive decoupling) increased from 10 to 47. The number of cities in the link type (growth and recession link) increased from one (Wuzhong in the recession link) to three (Wuhai, Jiaozuo, and Baiyin in the growth link). In terms of spatial distribution, strong decoupling presented a diffusion trend from point to surface. By 2019, of all the cities, 63.33% were in a state of strong decoupling, while the number of cities in expansive negative decoupling and weak decoupling accounted for 13% and 10%, respectively. Thus, economic development’s negative impact on the resource environment could not be ignored.
In the upper reaches, other than Baiyin and Wuzhong, which showed strong decoupling and recession link, the other cities had strong negative decoupling, weak negative decoupling, and expansive negative decoupling from 2010 to 2013. From 2013 to 2016, the number of cities with strong decoupling in the upstream reached ten, with five cities including Yinchuan, Shizuishan, Wuzhong, Jinchang, and Ordos in recessive decoupling, and Jiayuguan and Baiyin in strong negative decoupling. From 2016 to 2019, the number of cities with strong decoupling in the upstream was nine. Wuwei presented strong negative decoupling. Meanwhile, Jinchang and Ordos showed expansive negative decoupling. Wuhai and Baiyin were growth link. Shizuishan, Wuzhong, Lanzhou, and Hohhot presented weak decoupling.
Overall, in the three stages of 2010–2013, 2013–2016, and 2016–2019, cities upstream of the YRB experienced a fluctuation in decoupling states. For example, Wuwei experienced the fluctuation of strong negative decoupling, strong decoupling, and strong negative decoupling, while Baiyin experienced a transition from strong decoupling to strong negative decoupling and then to growth link. Wuzhong experienced a change from recession link to recessive decoupling and then to strong decoupling. Jinchang and Ordos experienced a state change of weak negative decoupling, recessive decoupling, and expansive negative decoupling.
In terms of the middle reaches, except for Xi’an and Weinan, which had strong decoupling from 2010 to 2013, the other cities had strong negative decoupling, weak negative decoupling, and expansive negative decoupling. From 2013 to 2016, the number of cities achieving strong decoupling in the middle reaches reached 12, while the others presented recessive decoupling, weak negative decoupling, and expansive negative decoupling. In this period, the decline speed of Yulin’s HQED level was lower than that of its resource and environmental pressure. Due to the decline of capital productivity, innovation input, and openness degree, Jincheng shifted from expansive negative decoupling to weak negative decoupling, implying a faster decline in HQED level than that of resource and environmental pressure.
From 2016 to 2019, the number of cities achieving strong decoupling in the middle reaches reached 13. The others showed recessive decoupling, weak negative decoupling, weak decoupling, growth link, and expansion negative decoupling. Due to the insufficient driving forces for economic growth, Xi’an and Jinzhong experienced varying degrees of decline in HQED levels from 2016 to 2019. Thus, their decoupling relationship reverted from a strong decoupling state to a weak negative and recessive decoupling state.
In the lower reaches of the YRB, from 2010 to 2013, the number of cities with a strong negative decoupling state reached ten. Zhengzhou, Dezhou, and Liaocheng achieved a strong decoupling state, while the other cities showed weak decoupling, recessive decoupling, weak negative decoupling, strong negative decoupling, and expansive negative decoupling. From 2013 to 2016, the number of cities with a strong decoupling state increased from three to seven, while the number of cities with strong negative decoupling decreased from ten to four, the number of cities in recessive decoupling rose from four to seven, the number of cities in weak negative decoupling increased from one to two.
Notably, Weifang and Dongying changed back to weak negative decoupling, mainly due to the decline of HQED level induced by the decrease of three indicators, including capital productivity, degree of dependence on foreign trade, and the urban green coverage percentage in built-up areas. From 2016 to 2019, the number of cities achieving strong decoupling states in the downstream increased to 16. Overall, in the three periods of 2010–2013, 2013–2016, and 2016–2019, Weifang experienced a fluctuation of weak decoupling, weak negative decoupling, and weak decoupling. Meanwhile, Taian and Anyang improved from strong negative decoupling to recessive decoupling to expansive negative decoupling. In addition, Zhengzhou showed strong decoupling throughout the three periods.

4.2.2. The Evolution of City-Level Comprehensive Decoupling Status

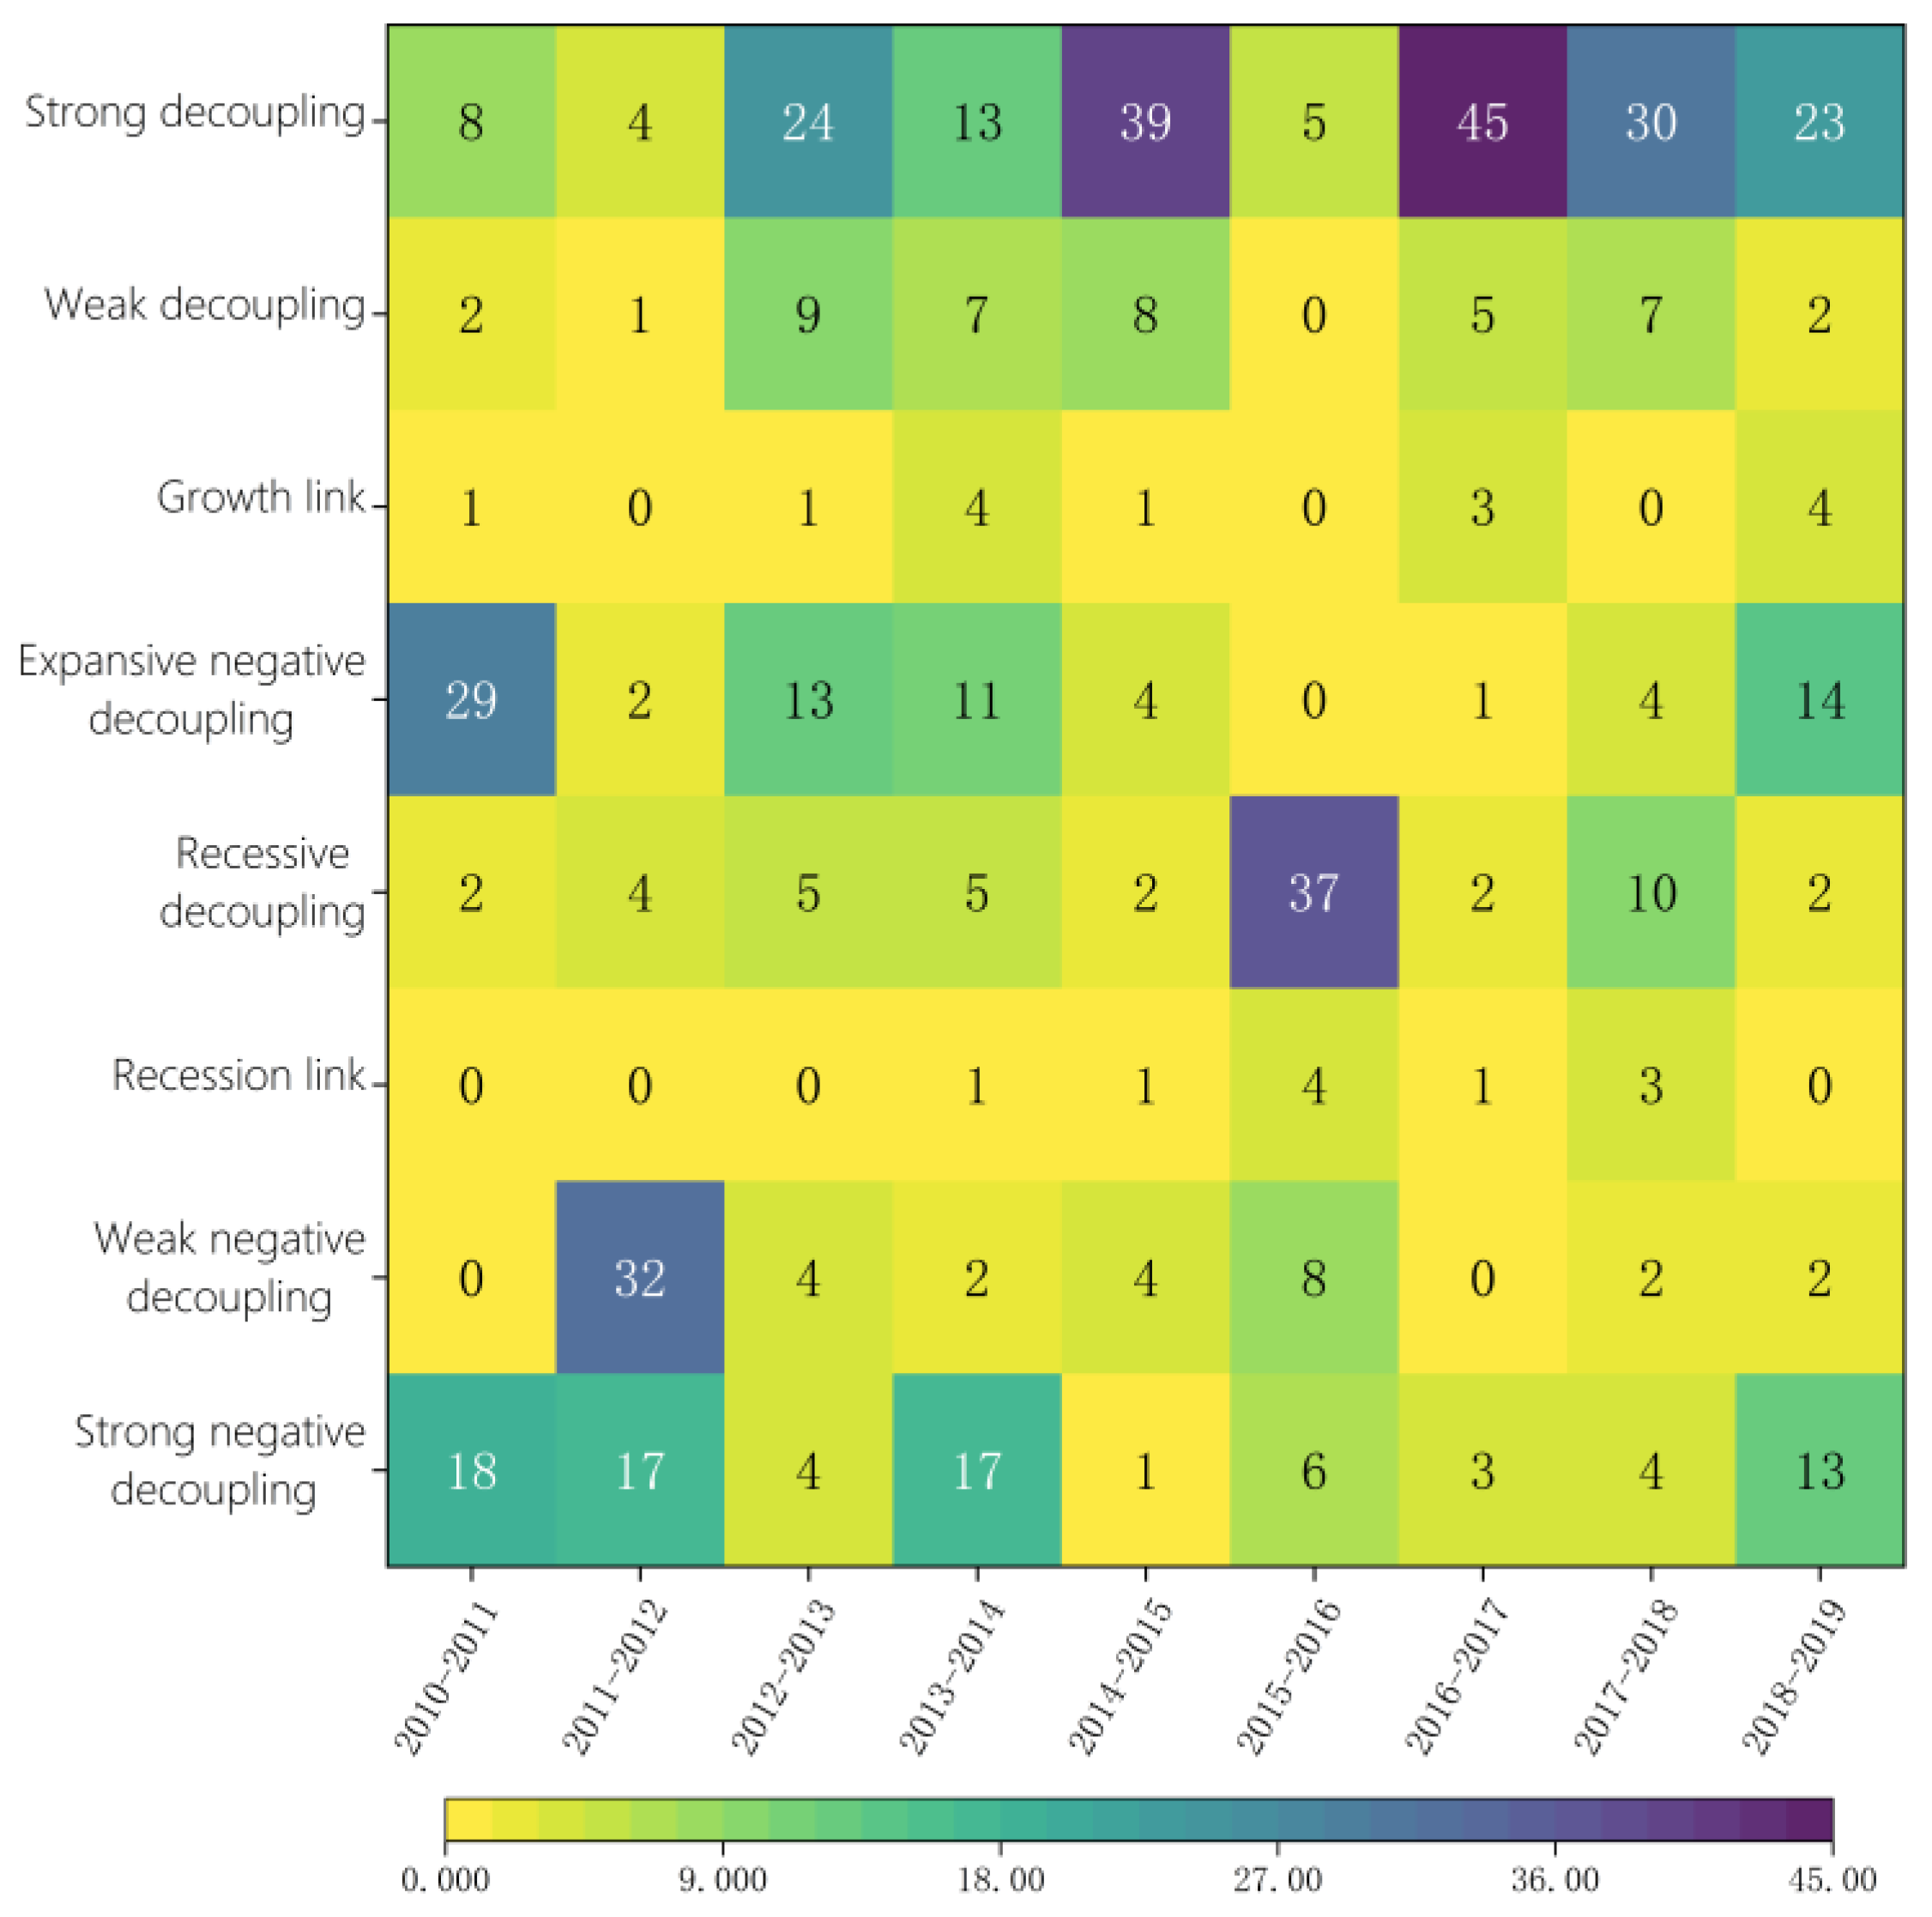
Due to different stages and modes of economic development, cities in the YRB showed various decoupling states, mainly including strong decoupling, strong negative decoupling, expansive negative decoupling, and recessive decoupling. Among them, strong decoupling accounted for 35%, strong negative decoupling accounted for 15%, expansive negative decoupling accounted for 14%, and recessive decoupling accounted for 13%. Weak negative decoupling, link, and weak decoupling accounted for 23%.
Figure 7 indicated that in 2010–2011 the cities in the YRB mainly experienced expansive negative decoupling and strong negative decoupling. In 2011–2012, weak negative decoupling and strong negative decoupling were the main decoupling states. There was a clear decrease in resource environmental pressure and a downward trend in the HQED level. In 2012–2013, strong decoupling, weak decoupling, and expansive negative decoupling dominated.
In 2013–2014, there was a prominent phenomenon of recoupling where more cities were experiencing expansive negative decoupling and growth link, while fewer cities were experiencing strong decoupling. In 2014–2015, strong decoupling and weak decoupling were the primary states of decoupling in the YRB, and the number of cities with expansive negative decoupling and strong negative decoupling significantly decreased. From 2015 to 2016, most cities experienced recessive decoupling due to the decrease in the growth rate of high-quality economic development.
In 2016–2017, the HQED level was significantly enhanced, and strong decoupling once again dominated. In 2017–2018, the number of cities with recessive decoupling increased again. Due to the increase in resource and environmental pressure, strong decoupling, expansive negative decoupling, and recessive decoupling were the main decoupling states in the YRB from 2018 to 2019.
The decoupling states of the cities in the YRB were not stable, with decoupling and recoupling occurring frequently. Despite the high-quality economic development level improving, the pressure on the resource environment has still existed. In other words, the high-quality economic development and resource environment in the YRB did not reach a win–win situation, which was consistent with the conclusions of existing studies [22]. To further clarify the evolutionary trend of the decoupling types at the city level in the YRB, Markov transition probability matrices with time spans of 1 year, 2 years, and 3 years were constructed, respectively, as shown in Figure 8.
According to Figure 8, the changes in the decoupling types of cities had the following characteristics: firstly, the transition of decoupling types of cities in the YRB was mainly towards the decoupling type, followed by the negative decoupling. In contrast, the transition probability to the link type was relatively small. Secondly, the probability of transition from the initial type of decoupling to decoupling was greater than the probability of transition to the negative decoupling and link type, indicating that the cities in the YRB tended to maintain stability after achieving decoupling. Unlike the decoupling type, the probability values on the diagonal of other types were not significantly higher than those on the non-diagonal, indicating that other decoupling types were not stable, and their mobility gradually increased with a relatively small probability of maintaining the initial type. Thirdly, with the increase in the time span, the probability of cross-level transition from negative decoupling to decoupling gradually increased. The probability of a step-by-step transition from link to decoupling increased first and then decreased. However, the probability of cross-level transition from negative decoupling to decoupling and the transition from link to decoupling was greater than the probability of transition to other types, indicating that the decoupling types of cities in the YRB tend to move upwards.

5. Conclusions and Recommendations

5.1. Conclusions

Under the dual tasks of maintaining growth and improving the ecological environment, decoupling the relationship between the resource environment and high-quality economic development is the fundamental requirement of ecological protection and high-quality development in the Yellow River Basin. Based on the Tapio decoupling model, this paper analyzed the decoupling states of high-quality economic development and resource environment and the evolution trend of the comprehensive decoupling status in 60 prefecture-level cities in the YRB. The main conclusions were as follows:
(1) From 2010 to 2019, the level of high-quality economic development of cities in the YRB improved but the growth rate was still low, and the driving forces of high-quality economic development were insufficient. In spatial distribution, the cities with a higher HQED level were concentrated in the southeast of the YRB, while those with a lower HQED level gathered in the northwest. The resources and environmental pressure gradually decreased, but in some cities of Shandong and Shanxi, it presented a rebound phenomenon. The resources and environmental pressure of cities in the middle and lower reaches of the Yellow River were higher than that in the upper reaches. Especially, the cities in the Ji-shaped bend of the Yellow River always faced greater resource and environmental pressure. The high-value areas of HQED level and resource and environmental pressure were basically consistent in space.
(2) The impact of HQED on the resource environment could not be ignored in the YRB. From 2010 to 2019, compared with the resource decoupling index, the environmental decoupling index fluctuated greatly and had a greater impact on the comprehensive decoupling index. At the city level, the comprehensive decoupling states of cities in the YRB gradually improved, and the number of cities with strong decoupling increased from 6 to 38 in 2010–2019, showing a spatial diffusion trend from point to surface in the YRB. However, the phenomenon of recoupling after decoupling occurred repeatedly in the YRB, and there were different decoupling obstacles in the upstream, middle, and downstream cities.
(3) The evolution of the three types of decoupling indicated that the transition of decoupling types tended towards the decoupling type. Negative decoupling and link types were unstable, with a small probability of maintaining their initial state. With the increase in time span, the probability of cities in the YRB transitioning from negative decoupling type to decoupling type and from link type to decoupling type was greater than the probability of the transition to other types, indicating that the decoupling types of cities in the YRB had a trend of upward transition.

5.2. Recommendations

Achieving strong decoupling between the resource environment and high-quality economic development is vital in the Yellow River Basin. Based on the above conclusions, the following policy recommendations were proposed:
(1) Given the insufficient driving forces for high-quality economic development in the YRB, it is necessary to enhance capital productivity. Cities in the middle and lower reaches of the YRB should focus on industrial structure adjustment, the development of a circular economy, and an increase in fiscal expenditure on science and technology. When promoting high-quality economic development, it is also necessary to improve the utilization efficiency of water resources and reduce the emissions of industrial sulfur dioxide and industrial soot. For resource-based cities that are highly dependent on energy and heavy industry, alleviating resource and environmental pressure is a long-term process. This calls for an increase in investment in green technology innovation to avoid the rebound of resource and environmental pressure.
(2) The environmental decoupling index of the YRB dominated the change in the comprehensive decoupling index. Strengthening environmental pollution control and reducing the discharges of industrial wastewater, sulfur dioxide, and industrial soot within the basin can be helpful in reversing the downward trend of the comprehensive decoupling index. Differentiated development strategies should be formulated according to the different decoupling obstacles in the upstream, middle, and downstream cities. Specifically, upstream cities should increase fiscal expenditure on science and technology, enhance foreign trade dependence, and improve the comprehensive utilization rate of industrial solid waste. Midstream cities should focus on adjusting the industrial structure, increasing fiscal expenditure on science and technology, reducing industrial pollutant emissions, and improving the urban green coverage percentage in built-up areas. Downstream cities should focus on improving the comprehensive utilization rate of industrial solid waste, the urban green coverage percentage in built-up areas, and foreign trade dependence.
(3) The decoupling of cities between economic development and resources and the environment was unstable in the YRB. Thus, a sharing platform for environmental governance and pollution reduction technologies should be established to promote the exertion of the radiation effect of cities with the strong decoupling state in the basin. In addition, it can be helpful to reduce the phenomenon of recoupling by the improvement of the utilization efficiency of water resources and industrial pollutant emission reduction and injecting new growth impetus into economic development.

6. Limitations of the Study

A full discussion of the decoupling relationship between the resource environment and HQED in the YRB was undertaken in this study. Still, this study had some limitations. For instance, the study relied on data from 2010 to 2019, and the decoupling index from 2020 to 2022 was not included due to the unavailability of data, which resulted in the inability of this study to capture the recent changes in the decoupling index in the YRB.
Moreover, although this study meticulously combed the relevant literature and then strictly screened the HQED evaluation indicators according to the actual regional situation, there may still be some indicators that have not been incorporated. Hence, in the future, indicators should be further screened according to the actual situation in the study area.

Author Contributions

X.Z.: Conceptualization, Methodology, Writing—review and editing, Supervision. X.L.: Conceptualization, Investigation, Formal analysis. G.D.: Software, Data curation, Formal analysis. Y.X.: Visualization, Validation. All authors have read and agreed to the published version of the manuscript.

Funding

This research was funded by the Project of Humanities and Social Science of Henan Province (grant number 2022-ZZJH-037); Soft Science Research Planning Project of Henan Province (grant number 232400410114).

Institutional Review Board Statement

Not applicable.

Informed Consent Statement

Not applicable.

Data Availability Statement

Data will be made available on request.

Conflicts of Interest

The authors declare that they have no known competing financial interest or personal relationship that could have appeared to influence the work reported in this paper.

References

  1. Tomislav, K. The concept of sustainable development: From its beginning to the contemporary issues. Zagreb Int. Rev. Econ. Bus. 2018, 21, 67–94. [Google Scholar]
  2. Manioudis, M.; Meramveliotakis, G. Broad strokes towards a grand theory in the analysis of sustainable development: A return to the classical political economy. New Political Econ. 2022, 27, 866–878. [Google Scholar] [CrossRef]
  3. Gao, Y.; Xu, Z. Beyond drainage economics: The model and path for high-quality development of the real economy in the Yellow River Basin. Econ. Probl. 2020, 10, 1–9. [Google Scholar]
  4. Li, Q. A study on the spatial relationship of the urban carbon dioxide emission in the Yellow River Basin. J. Grad. Sch. Chin. Acad. Soc. Sci. 2021, 3, 71–79. [Google Scholar]
  5. Xu, H.; Wang, Y.; Zhang, Z.; Gao, Y.; Zhang, D. Coupling mechnaism of water-energy-food and spatiotemporal evolution of coordinated development in the Yellow River Basin. Resour. Sci. 2021, 43, 2526–2537. [Google Scholar]
  6. Wei, W.; Jin, C.; Han, Y.; Huang, Z.; Niu, T.; Li, J. The Coordinated development and regulation research on public health, ecological environment and economic development: Evidence from the Yellow River Basin of China. Int. J. Environ. Res. Public Health 2022, 19, 6927. [Google Scholar] [CrossRef]
  7. Lu, D.; Sun, D. Development and management tasks of the Yellow River Basin: A preliminary understanding and suggestion. Acta Geogr. Sin. 2019, 74, 2431–2436. [Google Scholar]
  8. Yao, S.; Liu, P.; Wei, H. Research on coupling coordinated development and its driving mechanism of agricultural ecological-economic system in the Yellow River Basin under the perspective of food security. Chin. J. Agric. Resour. Reg. Plan. 2023. Available online: https://kns.cnki.net/kcms/detail//11.3513.S.20230117.0909.004 (accessed on 7 June 2023).
  9. Li, X.; Xu, J.; Ren, X.; Li, L. Man-land relationship and development in the regions along Yellow River. Hum. Geogr. 2012, 27, 1–5. [Google Scholar]
  10. Liu, K.; Qiao, Y.; Shi, T.; Zhou, Q. Study on coupling coordination and spatiotemporal heterogeneity between economic development and ecological environment of cities along the Yellow River Basin. Environ. Sci. Pollut. Res. 2021, 28, 6898–6912. [Google Scholar] [CrossRef]
  11. Li, D.; Lin, L.; Lin, Z.; Zhang, S.; An, L. EKC test of ecological protection and high-quality development in the Yellow River Basin. Acta Ecol. Sin. 2021, 41, 3965–3974. [Google Scholar]
  12. Chen, S.; Zhang, H.; Qi, Y.; Liu, Y. Spatial spillover effect and influencing factors of haze pollution in the Yellow River Basin. Econ. Geogr. 2020, 40, 40–48. [Google Scholar]
  13. Sun, C.; Jin, C.; Hao, S. Study on water-energy-food nexus relationship of the Yellow River Basin. Yellow River 2020, 42, 101–106. [Google Scholar]
  14. Xu, R.; Liu, W. Relationship between agricultural grey water footprint and economic growth in the Yellow River. Chin. J. Agric. Resour. Reg. Plan. 2022. Available online: https://kns.cnki.net/kcms/detail//11.3513.S.20221207.1631.009.html (accessed on 7 June 2023).
  15. Sun, S.; Tang, Q. Spatiotemporal patterns and driving factors of water resources use in the Yellow River Basin. Resour. Sci. 2020, 42, 2261–2273. [Google Scholar] [CrossRef]
  16. Jiang, C.; Sheng, C.; Zhang, Y. Research on industrial transformation and upgrading and green development in the Yellow River Basin. Academics 2019, 11, 68–82. [Google Scholar]
  17. Liu, C.; Liu, X.; Tian, W.; Xie, J. Ecological protection and high-quality development of the Yellow River Basin urgently need to solve the water shortage problem. Yellow River 2020, 42, 6–9. [Google Scholar]
  18. Cai, Z. Increasing the utilization of sewage resources to promote the high-quality development of the Yellow River Basin. China Environ. News 2022. Available online: https://baijiahao.baidu.com/s?id=1736390704407310879&wfr=spider&for=pc (accessed on 7 June 2023).
  19. Xue, D.; Xu, G. Analysis of the path to build coordinated environmental governance in the Yellow River Basin. J. Henan Univ. Technol. Soc. Sci. 2022, 38, 48–56. [Google Scholar]
  20. Ministry of Ecology and Environment. National Air Quality Status; Ministry of Ecology and Environment: Beijing, china, 2023.
  21. Zhou, Q.; He, A. Can environmental regulation promote the high-quality development of the Yellow River Basin. Financ. Econ. 2020, 6, 89–104. [Google Scholar]
  22. Ren, B.; Du, Y. Coupling coordination of economic growth, industrial development and ecology in the Yellow River Basin. China Popul. Resour. Environ. 2021, 31, 119–129. [Google Scholar]
  23. Li, R.; Liu, T. Analysis of the decoupling relationship between ecological footprint and economic growth of cities along the Yellow River Basin and influencing factors. J. Guizhou Univ. Financ. Econ. 2021, 39, 103–111. [Google Scholar]
  24. Liu, H.; Shao, M.; Sun, D. The practical and major achievements of China’s green development in the new era: Based on the coordination of resource, environment and economy. Inq. Econ. Issues 2022, 9, 133–147. [Google Scholar]
  25. Baloch, M.A.; Mahmood, N.; Zhang, J.W. Effect of natural resources, renewable energy and economic development on CO2 emissions in BRICS countries. Sci. Total Environ. 2019, 678, 632–638. [Google Scholar]
  26. Dogan, E.; Inglesi-Lotz, R. The impact of economic structure to the environmental Kuznets curve (EKC) hypothesis: Evidence from European countries. Environ. Sci. Pollut. Res. 2020, 27, 12717–12724. [Google Scholar] [CrossRef] [PubMed]
  27. Sarkodie, S.A.; Strezov, V. Effect of foreign direct investments, economic development and energy consumption on greenhouse gas emissions in developing countries. Sci. Total Environ. 2019, 646, 862–871. [Google Scholar] [CrossRef] [PubMed]
  28. Zhang, Z. Decoupling China’s carbon emissions increase from economic growth: An economic analysis and policy implications. World Dev. 2000, 28, 739–752. [Google Scholar] [CrossRef]
  29. Camara, M. Determinants of production-based and consumption-based CO2 emissions: A comparative analysis. Int. J. Environ. Pollut. 2020, 67, 22–47. [Google Scholar] [CrossRef]
  30. De Freitas, L.C.; Kaneko, S. Decomposing the decoupling of CO2 emissions and economic growth in Brazil. Ecol. Econ. 2011, 70, 1459–1469. [Google Scholar] [CrossRef]
  31. Song, Y.; Sun, J.; Zhang, M.; Su, B. Using the Tapio-Z decoupling model to evaluate the decoupling status of China’s CO2 emissions at provincial level and its dynamic trend. Struct. Change Econ. Dyn. 2020, 52, 120–129. [Google Scholar] [CrossRef]
  32. Li, L.; Shan, Y.; Lei, Y.; Wu, S.; Yu, X.; Lin, X.; Chen, Y. Decoupling of economic growth and emissions in China’s cities: A case study of the Central Plains urban agglomeration. Appl. Energy 2019, 244, 36–45. [Google Scholar] [CrossRef] [Green Version]
  33. Dong, F.; Li, J.; Zhang, X.; Zhu, J. Decoupling relationship between haze pollution and economic growth: A new decoupling index. Ecol. Indic. 2021, 129, 107859. [Google Scholar] [CrossRef]
  34. Zhang, H.; Huang, Y.; Wang, R.; Zhang, J.; Peng, J. Decoupling and spatiotemporal change of carbon emissions at the county level in China. Resour. Sci. 2022, 44, 744–755. [Google Scholar] [CrossRef]
  35. Wang, X.; Xu, Z.; Li, Y. A rough estimate of water footprint of Gansu Province in 2003. J. Nat. Resour. 2005, 20, 909–915. [Google Scholar]
  36. OECD. Indicators to Measure Decoupling of Environmental Pressure from Economic Growth; OECD: Paris, France, 2002. [Google Scholar]
  37. Wang, L. Study on the interaction effect between economic growth and eco-environment in tianjin by dematerialization analysis. Reform. Strategy 2012, 28, 143–146. [Google Scholar]
  38. Grand, M.C. Carbon emission targets and decoupling indicators. Ecol. Indic. 2016, 67, 649–656. [Google Scholar] [CrossRef]
  39. Li, K.; Zhou, Y.; Xiao, H.; Li, Z.; Shan, Y. Decoupling of economic growth from CO2 emissions in Yangtze River economic belt cities. Sci. Total Environ. 2021, 775, 145927. [Google Scholar] [CrossRef]
  40. Tapio, P. Towards a theory of decoupling: Degrees of decoupling in the EU and the case of road traffic in Finland between 1970 and 2001. Transp. Policy 2005, 12, 137–151. [Google Scholar] [CrossRef] [Green Version]
  41. Cohen, G.; Jalles, J.T.; Loungani, P.; Marto, R.; Wang, G. Decoupling of emissions and GDP: Evidence from aggregate and provincial Chinese data. Energy Econ. 2019, 77, 105–118. [Google Scholar] [CrossRef] [Green Version]
  42. Mikayilov, J.I.; Hasanov, F.J.; Galeotti, M. Decoupling of CO2 emissions and GDP: A time-varying cointegration approach. Ecol. Indic. 2018, 95, 615–628. [Google Scholar] [CrossRef]
  43. Li, Y.; Zhang, Y.; Yang, L.; Du, F.; Sai, L.; Zhang, B. Decoupling analysis of China’s mining industrial development and water usage: Based on production-based and consumption-based perspectives. J. Clean. Prod. 2023, 385, 135668. [Google Scholar] [CrossRef]
  44. Raza, M.Y.; Wu, R.; Lin, B. A decoupling process of Pakistan’s agriculture sector: Insights from energy and economic perspectives. Energy 2023, 263, 125658. [Google Scholar] [CrossRef]
  45. Xie, P.; Gong, N.; Sun, F.; Li, P.; Pan, X. What factors contribute to the extent of decoupling economic growth and energy carbon emissions in China? Energy Policy 2023, 173, 113416. [Google Scholar] [CrossRef]
  46. Wang, Q.; Zhang, F. The effects of trade openness on decoupling carbon emissions from economic growth–evidence from 182 countries. J. Clean. Prod. 2021, 279, 123838. [Google Scholar] [CrossRef]
  47. Gao, M.; Lu, Q. Decoupling relationship between water resources utilization and economic development in Yellow River Basin. Environ. Sci. Technol. 2021, 44, 198–206. [Google Scholar]
  48. Li, R.; Bai, Y.; Zhou, Y.; Huang, S.; Yan, Z.; Li, Y.; Zhao, H. Decoupling and decomposition of driving factors of water resources utilization and economic growth in the Yellow River Basin. Sci. Geogr. Sin. 2023, 43, 110–118. [Google Scholar]
  49. Zuo, Q.; Zhang, Z.; Ma, J. Relationship between water resource utilization level and socio-economic development in the Yellow River Basin. China Popul. Resour. Environ. 2021, 31, 29–38. [Google Scholar]
  50. Zhang, Y.; Yu, Z.; Zhang, J. Spatiotemporal evolution characteristics and dynamic efficiency decomposition of carbon emission efficiency in the Yellow River Basin. PLoS ONE 2022, 17, e0264274. [Google Scholar] [CrossRef]
  51. Zhang, H.; Yuan, P.; Zhu, Z. Decoupling effects of carbon emissions and reduction path in the Yellow River Basin. Resour. Sci. 2022, 44, 59–69. [Google Scholar] [CrossRef]
  52. Zhong, Z.; Chen, Z. Business environment, technological innovation and government intervention: Influences on high-quality economic development. Manag. Decis. 2023. ahead of print. [Google Scholar] [CrossRef]
  53. Wang, J.; Che, S. The impact of digital economy on high-quality development in the Yellow River Basin: Empirical evidence from urban heterogeneity. Resour. Sci. 2022, 44, 780–795. [Google Scholar] [CrossRef]
  54. Sun, C.; Tong, Y.; Zou, W. The evolution and a temporal-spatial difference analysis of green development in China. Sustain. Cities Soc. 2018, 41, 52–61. [Google Scholar] [CrossRef]
  55. Wang, B.; Yan, L. Decoupling effects of water footprint and high-quality economic development in Yangtze River economic belt. J. Econ. Water Resour. 2022, 40, 6–12. [Google Scholar]
  56. Tian, Q. Theoretical connotation and practical requirements for high-quality development. J. Shandong Univ. Philos. Soc. Sci. 2018, 6, 1–8. [Google Scholar]
  57. Li, J.; Shi, L.; Xu, A. Probe into the assessment indicator system on high-quality development. Stat. Res. 2019, 36, 4–14. [Google Scholar]
  58. Liu, L.; Liang, L.; Gao, P.; Fan, C.; Wang, H.; Wang, H. Coupling relationship and interactive response between ecological protection and high-quality development in the Yellow River Basin. J. Nat. Resour. 2021, 36, 176–195. [Google Scholar] [CrossRef]
  59. Ren, B.; Fu, Y.; Yang, Y. Measurement and improvement path of high quality development level in Yellow River Basin. J. Stat. Inf. 2022, 37, 89–99. [Google Scholar]
  60. Lv, D.; Wang, J.; Cheng, Z. Spatio temporal coupling and driving factors of digital economy, ecological protection and high-quality development in the Yellow River Basin. Inq. Econ. Issues 2022, 15, 135–148. [Google Scholar]
  61. Zhang, Z.; Xu, J.; Gao, Q.; Liu, W. Analysis on the difference of economic high-quality development level in the Yellow River Basin. Sci. Manag. Res. 2022, 40, 100–109. [Google Scholar]
  62. Sun, H.; Gui, H.; Yang, D. Measurement and evaluation of the high-quality of China provincial economic development. Zhejiang Soc. Sci 2020, 8, 4–14. [Google Scholar]
  63. Zhan, X.; Cui, P. Estimation and evaluation of China’s provincial quality of economic growth—Empirical analysis based on “five development concepts”. Public Financ. Res. 2016, 8, 42–54. [Google Scholar]
  64. Yu, Y.; Hu, S. The connotation, predicament and basic path of China’s economy of high-quality development: A literature review. J. Macro-Qual. Res. 2018, 6, 1–17. [Google Scholar]
  65. Sun, J.; Cui, Y.; Zhang, H. Spatio-temporal pattern and mechanism analysis of coupling between ecological protection and ecomomic development of urban agglomerations in the Yellow River Basin. J. Nat. Resour. 2022, 37, 1673–1690. [Google Scholar] [CrossRef]
  66. Ren, B. Theoretical interpretation and practical orientation of China’s Economy from high speed growth to high quality development in new era. Acad. Mon. 2018, 50, 66–74. [Google Scholar]
  67. Wang, L. The poverty theory of marxist political economy and its exploration and development in China. Shanghai J. Econ. 2018, 9, 31–34. [Google Scholar]
  68. Chen, Z.; Zheng, J. Can green technology innovation promote high-quality regional economic development? Mod. Econ. Sci. 2022, 44, 43–58. [Google Scholar]
  69. Hong, S.; Guo, Q.; Li, D. Spatiotemporal dynamics of ecological supply and demand based on ecological footprint theory. Resour. Sci. 2020, 42, 980–990. [Google Scholar] [CrossRef]
  70. Yu, F.; Fang, L. Issues regarding the ecological protection and high-quality development of Yellow River Basin. China Soft Sci. 2020, 6, 85–95. [Google Scholar]
  71. Jiang, L.; Zuo, Q.; Ma, J.; Zhang, Z. Evaluation and prediction of the level of high-quality development: A case study of the Yellow River Basin, China. Ecol. Indic. 2021, 129, 107994. [Google Scholar] [CrossRef]
  72. Liu, Y.; Feng, C. What drives the decoupling between economic growth and energy-related CO2 emissions in China’s agricultural sector? Environ. Sci. Pollut. Res. 2021, 28, 44165–44182. [Google Scholar] [CrossRef]
  73. Luo, H.; Li, L.; Lei, Y.; Wu, S.; Yan, D.; Fu, X.; Luo, X.; Wu, L. Decoupling analysis between economic growth and resources environment in Central Plains Urban Agglomeration. Sci. Total Environ. 2021, 752, 142284. [Google Scholar] [CrossRef]
  74. He, Y.; Cai, M. Decoupling relationship between economic growth and resource environment in Beijing-Tianjin-Hebei Region. J. Beijing Inst. Technol. Soc. Sci. Ed. 2016, 18, 33–41. [Google Scholar]
  75. Frodyma, K.; Papież, M.; Śmiech, S. Decoupling economic growth from fossil fuel use—Evidence from 141 countries in the 25-year perspective. Energies 2020, 13, 6671. [Google Scholar] [CrossRef]
  76. Liu, H.; Qiao, L.; Sun, S. Spatial distribution and dynamic change of water use efficiency in the Yellow River Basin. Resour. Sci. 2020, 42, 57–68. [Google Scholar] [CrossRef]
  77. Shi, B.; He, L.; Zhang, W. Dynamic evolution and trend prediction of high-quality urban economic development in the Yellow River Basin. Econ. Probl. 2021, 1, 1–8. [Google Scholar]
  78. Hu, S.; Jiao, S.; Zhang, X. Spatio-temporal evolution and influencing factors of China’s tourism development: Based on the non-static spatial Markov chain model. J. Nat. Resour. 2021, 36, 854–865. [Google Scholar] [CrossRef]
  79. Cui, R.; Li, G. Regional differences and distributional dynamics of internet level in China: 2006–2018. J. Quant. Tech. Econ. 2021, 38, 3–20. [Google Scholar]
  80. Chen, Z.; Chen, J.; Du, J. Study on coupling coordination development between logistics industry and national economy in China. China Bus. Mark. 2020, 34, 9–20. [Google Scholar]
  81. Huang, D.; Lin, X.; He, Z. Research on the decoupling relationship between high-quality economic development and water resources consumption in the Yellow River Basin. Rev. Econ. Manag. 2022, 38, 25–37. [Google Scholar] [CrossRef]
  82. Guo, F.; Tong, L.; Qiu, F.; Li, Y. Spatio-temporal differentiation characteristics and influencing factors of green development in the eco-economic corridor of the Yellow River Basin. Acta Geogr. Sin. 2021, 76, 726–739. [Google Scholar]
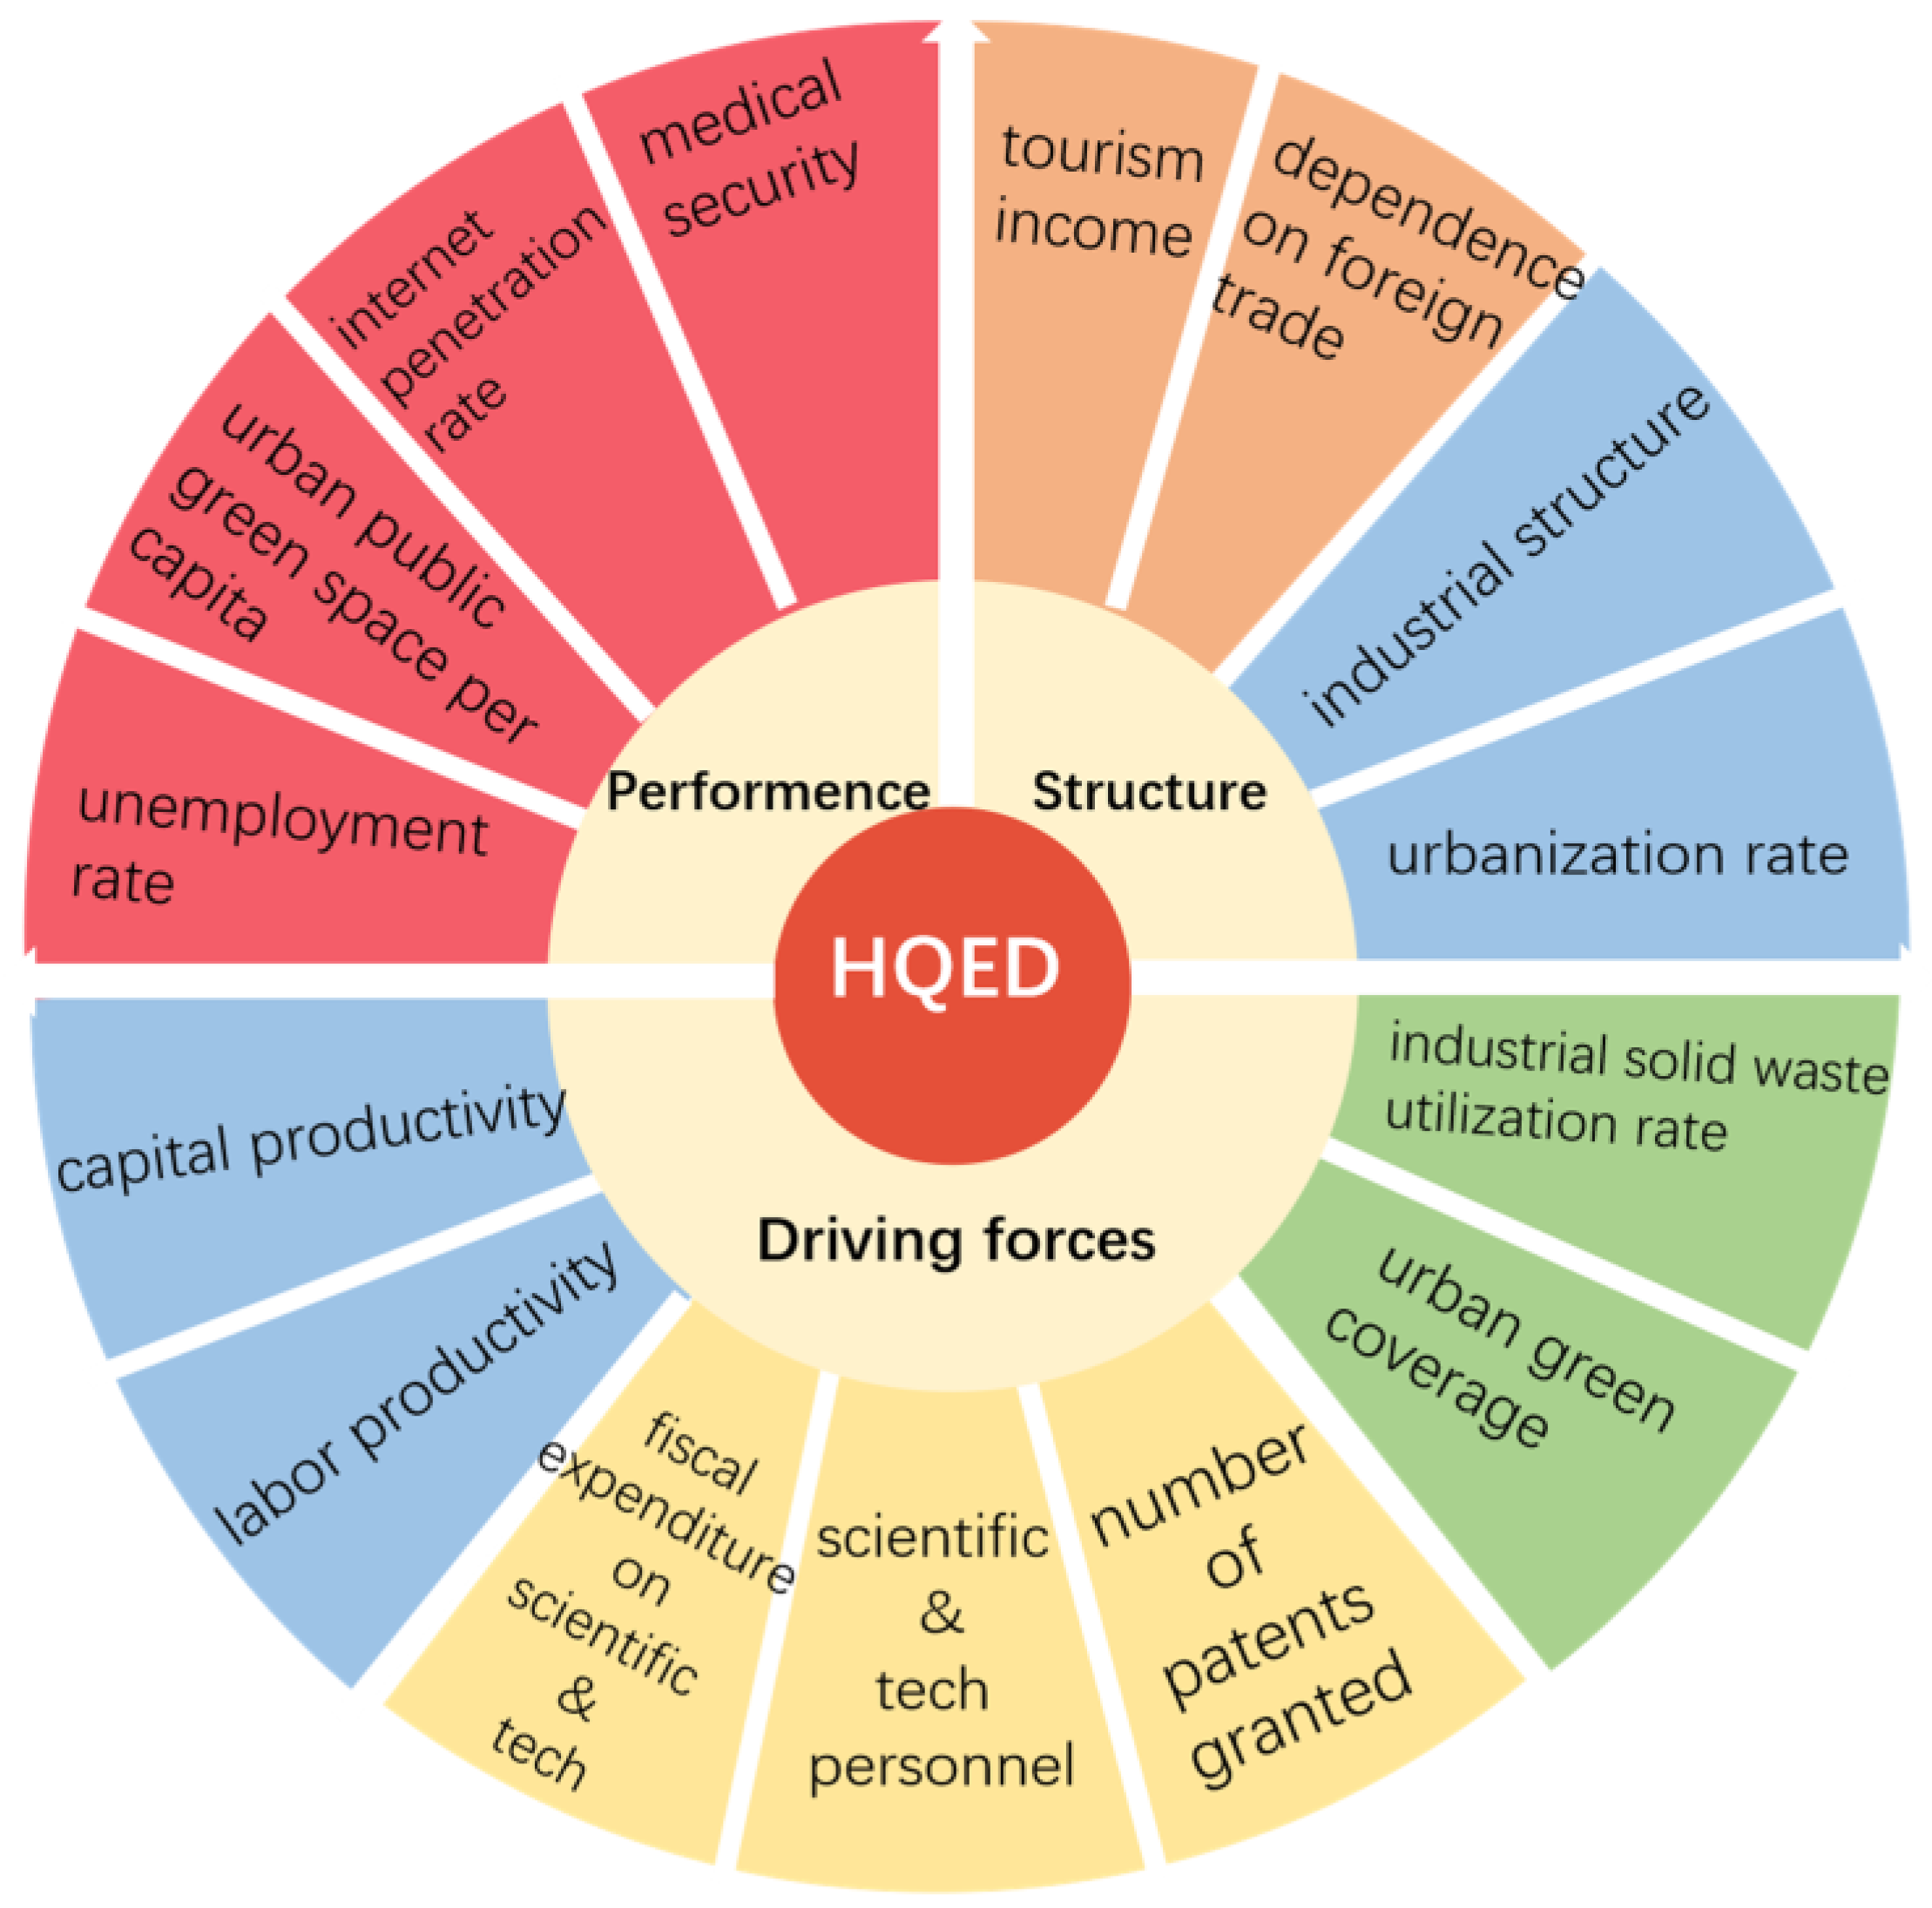
Figure 1. HQED evaluation index system.
Sustainability 15 09385 g001
Figure 2. Division criteria of Tapio decoupling.
Sustainability 15 09385 g002
Figure 3. Map of the study area.
Sustainability 15 09385 g003
Figure 4. Spatial–temporal distribution of the HQED and resource environmental pressure in the YRB.
Sustainability 15 09385 g004
Figure 5. Change of decoupling index in the Yellow River Basin from 2010 to 2019.
Sustainability 15 09385 g005
Figure 6. Spatial distribution of city-level comprehensive decoupling states in the YRB.
Sustainability 15 09385 g006
Figure 7. Temporal distribution of city-level comprehensive decoupling states.
Sustainability 15 09385 g007
Figure 8. Markov transition probability matrices of decoupling type in the YRB.
Sustainability 15 09385 g008
Disclaimer/Publisher’s Note: The statements, opinions and data contained in all publications are solely those of the individual author(s) and contributor(s) and not of MDPI and/or the editor(s). MDPI and/or the editor(s) disclaim responsibility for any injury to people or property resulting from any ideas, methods, instructions or products referred to in the content.