Article

Experimental Study on the Charge Signal Time-Frequency Characteristics during Fracture Process of Precracked Syenogranite under Uniaxial Compression

1
School of Mechanics and Engineering, Liaoning Technical University, Fuxin 123000, China
2
College of Science, Liaoning Technical University, Fuxin 123000, China
*
Author to whom correspondence should be addressed.
Sustainability 2023, 15(12), 9482; https://doi.org/10.3390/su15129482
Submission received: 15 April 2023 / Revised: 9 June 2023 / Accepted: 9 June 2023 / Published: 13 June 2023

Abstract

:
During the process of rock deformation and failure, a significantly large number of charge signals are generated as a result of fracture appearance and crack expansion. The generation of charge signal is the comprehensive embodiment of the coal-failure behavior. The study of charge signal in the process of fractured-rock deformation and failure is of great significance to the prediction of rock dynamic disasters such as tunnel-engineering stability, slope instability and earthquake. In this work, a surveillance system utilizing charge induction is employed to extract precursory information related to the instability and failure of precracked syenogranite. The results reveal a significant influence of fractures on the strength of syenogranite specimens and the number of charge-induction signal events. The position of the charge signal generated is related to the crack dip angle. Furthermore, with the increase of the crack inclination, the number of events and the amplitude and power value of the charge-induced signal increase and reach the maximum in the instability-failure phase. The syenogranite specimen has a relatively large value, medium correlation, or even high correlation charge-induction signal in the phase of rack propagation, which can make an early warning of the deformation and failure risk of syenogranite; with the increase of the fracture degree, the charge-induction signal with large values and high correlations gradually increases.

1. Introduction

Fault rockburst is a dynamic destabilization phenomenon caused by mining activities [1,2]. The characteristics of fault rockburst are large energy release and high seismic amplitude. A key factor in rockburst is the relative slip of the fault. Many rock masses contain macrostructures such as faults, bedding, joints, and fractures. The deformation and fracture of fractured rocks is one of the core contents of fault rockburst, which is of great significance to the prediction of rock dynamic disasters such as tunnel-engineering stability, slope instability, and earthquake [3,4]. There are charge signals in the process of rock deformation and failure. Therefore, the study of the laws of signals associated with charge induction can establish an experimental theoretical basis for fault rockburst prediction.
Numerous academics both domestically and abroad have conducted indepth research on the charge-induction signal in rock deformation and fracture and made many achievements in predicting the precursor characteristics. V. S. Kuksenko et al. measured the induced charge produced when marble was loaded by an electrometer and found that during sudden loading and unloading, the induced charge increased dramatically and then gradually decreased [5,6]. The electron emissions in rock deformation and fracture processes were captured by Guo et al. [7,8]. Based on the primary fracture’s magnetic field intensity, the charge on the fracture surface was calculated by Sun et al. [9]. Zhu et al. [10] measured the spectrum of electric charge at the crack tip during rock deformation and fracture. Via the measurement of the microcurrent, Wu et al. investigated the charge characteristics of granite surfaces [11]. Hao et al. revealed through rock fracture experiments that under various special conditions, such as sudden loading/unloading, stick-slip, and rock fracture, the self-potential and strain field present are relevant and have universal pulse-like transient fluctuations [12,13]. Using a noncontact charge sensor with a high rate and fast response, Zhao et al. conducted field experiments to measure the charge generated by granite, sandstone, and coal in the deformation and fracture process. It is found in experiments that granite, sandstone, and coal all produce charge signals in the process of deformation and fracture and it is believed that charge induction is related to stress [14,15,16]. Pan et al. studied the charge-inducing regularity of coal rock at different loading rates in uniaxial compression tests, the charge-induction laws of gas-bearing coal, and the charge induction law of coal and rock during tensile instability and failure [17,18,19]. In the Changgouyu Coal Mine and the Pingdingshan mining region, Pan et al. concurrently measured both stress and charging-induction signals, revealing the time and space variation law between the coal stress and the induced charge on the coal wall during the excavation process of the coal mining face and discovered the advance mutation phenomenon of the charge signal relative to the coal stress in the rock and coal [16,20]. Li et al. studied the surface-potential signals of coal and rock in the process of friction and the process of gas adsorption by coal. They also tested the surface potential of rock in the process of water inrush and found the critical slow-change property of surface potential before the instability and failure of roof rock [21,22,23,24]. Wang et al. experimentally studied the surface potential and its variation rule of prefabricated cracked coal and granite under uniaxial compression and discussed the influence mechanism of a prefabricated crack on surface potential [25,26]. Wang et al. theoretically analyzed the influence of water on the physical, mechanical, and charge signals of coal samples, identified the characteristics of charge signals before and after water injection, and studied the charge-induction law of prefabricated high-dip cracks under uniaxial compression [27,28]. Xiao et al. established the criterion of coal rock failure based on the granular substance force chain instability and considered the friction and cohesion between particles [29]. Feng et al. conducted optical microscopic observation, P-wave velocity detection, permeability test, and three-point bending fracture experiment on granite samples, studied the fracture toughness, crack-propagation evolution law, and fracture criterion of cracked rock, and modified the maximum tangential stress-fracture theory (MMTS) so as to accurately predict rock fracture characteristics [30,31,32]. Ma et al. established a fully coupled thermal-elastic-plastic-damage constitutive model to capture the mechanical responses of concrete subjected to dynamic loading, through the introduction of a new damage evolution law, a general equation of state, dynamic rate hardening, damage evolution, and plasticity hardening laws within the thermodynamic framework [33]. In order to investigate the electric charge-induction law and its mechanism during the loading-failure process of coal rocks containing gas with a burst tendency, Luo et al. conducted the electric charge-monitoring experiment of the entire loading and failure process of coal rock containing gas with a bursting tendency [34]. Researchers Zhao et al. investigated granite deformation and failure precursor features, collected time-frequency data on the entire granite deformation and failure process, and created a digital filter to reduce noise [35]. It has been demonstrated that Zhao et al. investigated the time-frequency properties of the charge signal in the fault stick-slip instability process as well as the law of charge induction in the fracture process of fractured sandstone [36,37]. In order to investigate a novel strategy for coal and rock dynamic catastrophe prediction based on weak current technology, Li et al. conducted field testing of weak current of coal mass in front of the mining face of a mine with rockburst danger. While mining, the response laws of the weak current of the coal mass in front of the working face and the spatial-distribution laws of the weak current of the surrounding coal of the highway were discovered. Combined with the information on the microseismic events monitored, the precursory characteristics of coal instability or failure based on weak current responses were determined, and the feasibility of using the weak current method to predict coal and rock dynamic disasters was verified [38]. Peng et al. monitored the variation trend of stress and strain in the fault zone, collected information on fault-slip precursor, and concluded that the mining disturbance destroyed the original mechanical equilibrium state of the fault zone and elastic rock series, leading to fault reactivation [39]. Wang et al. concluded that prefabrication without fracture filling reduces the initial damage stress and overall strength of the block and advances the time of rockburst onset but reduces the initial rockburst strength, and that nonexposed fractures are more conducive to rockbursts than exposed fractures [40]. Lin et al. discovered the principle of rock burst induced by the combination of static and static stress and summarized the theories and technologies of rock burst monitoring, prediction, and prevention at home and abroad, including rock burst monitoring zoning, leveling prediction method, and electromagnetic radiation technology [41]. Gulab et al. investigated the effect on fracture parameters of major cracks due to minor cracks, holes, and a combination of minor cracks and holes [42]. A semipermeable crack in piezoelectric material has also been addressed using the extended finite-element method by Pamnani et al. [43]. Yue et al. studied the parametric design of a multilayered piezoelectric/piezomagnetic (PE/PM) ceramic transducer with periodic interfacial electrodes based on fracture-mechanics analysis [44].
In conclusion, although many academics domestically and internationally have conducted extensive research into the laws of induced charge in the deformation and fracture of rocks, they have not studied the laws of charge induction in fractured rocks. Therefore, this paper adopts the charge-induction monitoring system to conduct uniaxial compression tests on syenogranite with cracks of different inclination angles, observes the laws of signals associated with charge induction, and obtains the time-frequency characteristics of signals associated with charge induction in the instability failure of precracked syenogranite.

2. Experimental Procedure

2.1. Specimen Preparation

The syenogranite specimens with a uniaxial compression strength of 143 MPa, a density of 2.8 g cm−3, a p-wave velocity of 6.48 μm s−1, and an s-wave velocity of 3.25 μm s−1 are used in the test. We use a machine to cut rocks to produce the specimens with dimensions of Φ75 mm × 150 mm. There is no moisture present in the specimens, and the parallelism of the end faces of the specimens is controlled within ±0.1 mm. A total of twelve specimens of syenogranite are collected. There are four cohorts of specimens, with three specimens in each cohort. The precrack has an aperture of 1 mm and a depth of 25 mm at different inclination angles of π/6, π/4, and π/3 (The inclination angle of the crack corresponds to the angle between the fracture strike and the horizontal direction of the maximum principal compressive stress). As a result, specimens 2 to 4 are designated as specimens with crack inclinations of π/6, π/4, and π/3, while specimens without cracks are designated as specimens 1 (See Figure 1). Mechanical cutting is used to prefabricate cracks on specimens. This cutting tool consists of a high-speed electric cutting machine with a diamond saw blade on the cutting wheel. Afterward, prefabricated cracks are treated with a 1:1 mixture of gypsum and water. The ingredients are thoroughly mixed before being inserted into the crack voids on the specimens. For the purpose of analyzing the charging properties related to the failure process, the precrack specimens with filled materials are cured at room temperature for 24 h prior to the compression test.

2.2. Experimental System

The experimental test setup employed in this study is seen in Figure 2. It consists of a loading machine, a shielding mechanism for charging signals, as well as a signal collecting system that concurrently collects charge signals. This system is constructed using a microcomputer servo control hydraulic universal testing machine (CTM) of the Institute of Geology, China Earthquake Administration, with a maximum load capacity of 1000 KN. The charge sensor probes, test objects, and the press indenter are all protected by an electromagnetic shielding system that uses a thick copper-wire mesh with a width of less than 0.5 mm. Direct grounding between all system components is accomplished by using a shield of coaxial shielding wire. With a maximum sampling frequency of 100 ksps (specimens per second), the charge-induction signal data gathering system uses a self-developed multichannel data collector. In the experiment, the sampling frequency is 12.5 ksps. In the experiment, the system may simultaneously gather load, displacement, and signals associated with charge induction. Channels 1, 2, and 3 of the data collectors are linked, accordingly, to the charge sensor probes 1, 2, and 3. A sensitive element and a conversion element make up the charge sensor. The conversion element is a charge amplifier that can transform the induced charge signals into voltage signals. The sensitive element is a charge-induction probe composed of a soft magnetic alloy. The input capacitance has no impact on the output. The input capacitance has no impact on the charge sensor’s output, which is very stable. The measurement range of charge induction is ±1.526 × 10⁻¹⁵–5 × 10⁻¹¹C, and the sensitivity of the charge sensor is A C Q = 1 × 10 11 V / C .
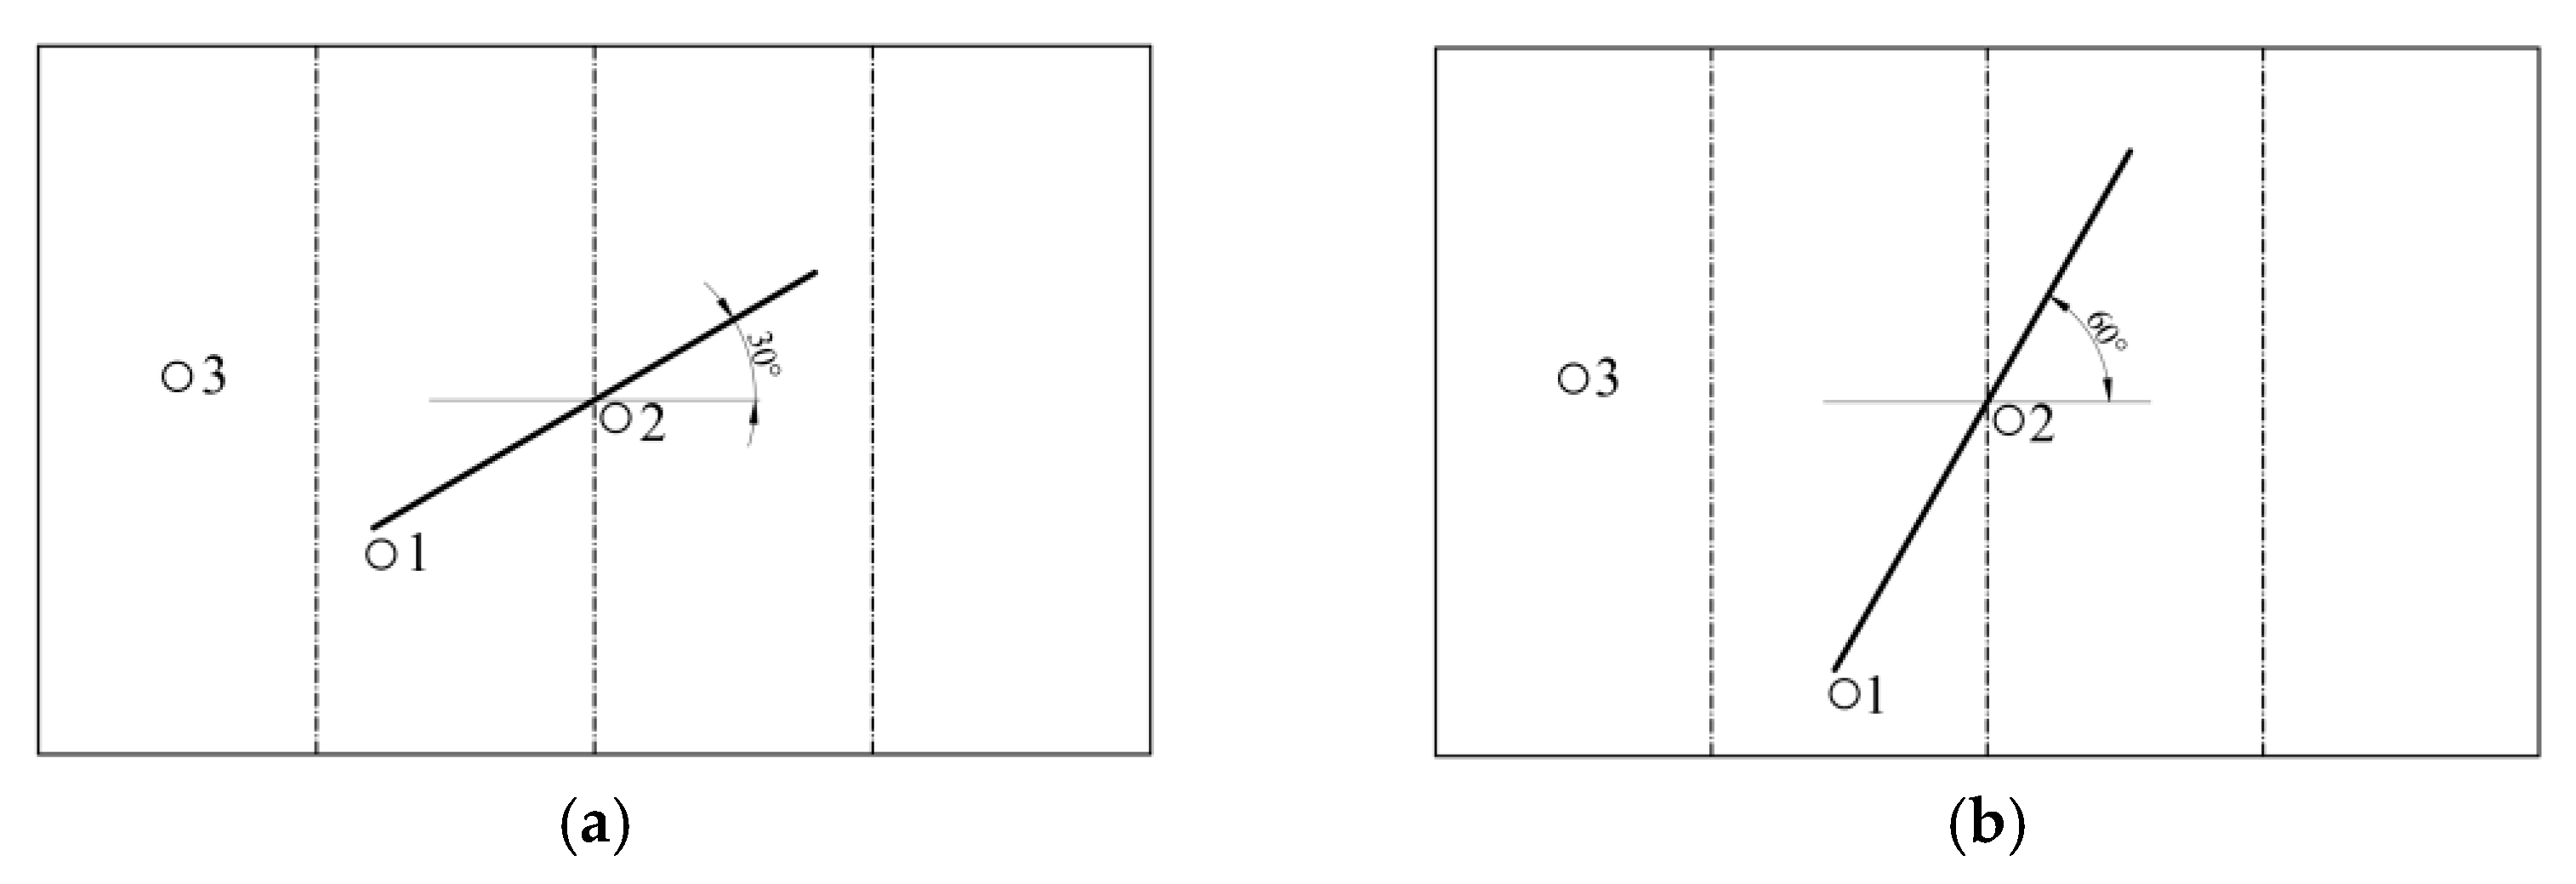
Figure 3 shows the arrangement of the charge sensors on the specimens with crack inclination angles of 30° and 60° and the charge sensor arrangement for the specimen with a 45° inclined crack is similar to Figure 3. Charge sensor 1 is located 5 mm from the lower end of the specimen crack, charge sensor 2 is located directly in the middle of the crack, while charge sensor 3 is 80 mm from the bottom of the sample. The testing machine adopts a force-driven loading mechanism with a loading speed of 0.5 kN/s. During the test, the charge sensors are arranged as shown in Figure 3, and the shielding net is covered. The test is mainly to observe the variation laws of charge induction during the deformation and failure of specimens with different inclination cracks. The experimental test system synchronizes the load-displacement recording system with the charge-induction signal data acquisition system to ensure that the corresponding time point can be found in the subsequent data processing.

3. Analyses of Experimental Results

In this investigation, four-cohort studies of signals associated with charge induction are carried out in the syenogranite’s deformation as well as fracture process. Typical monitoring information is chosen for the study because the empirical results are comparable with similar specimens. The curves in Figures 4 to 22 are formed by processing the parameter information.

3.1. Mechanical Characteristics for Syenogranite Exhibiting Varying Inclination Cracks

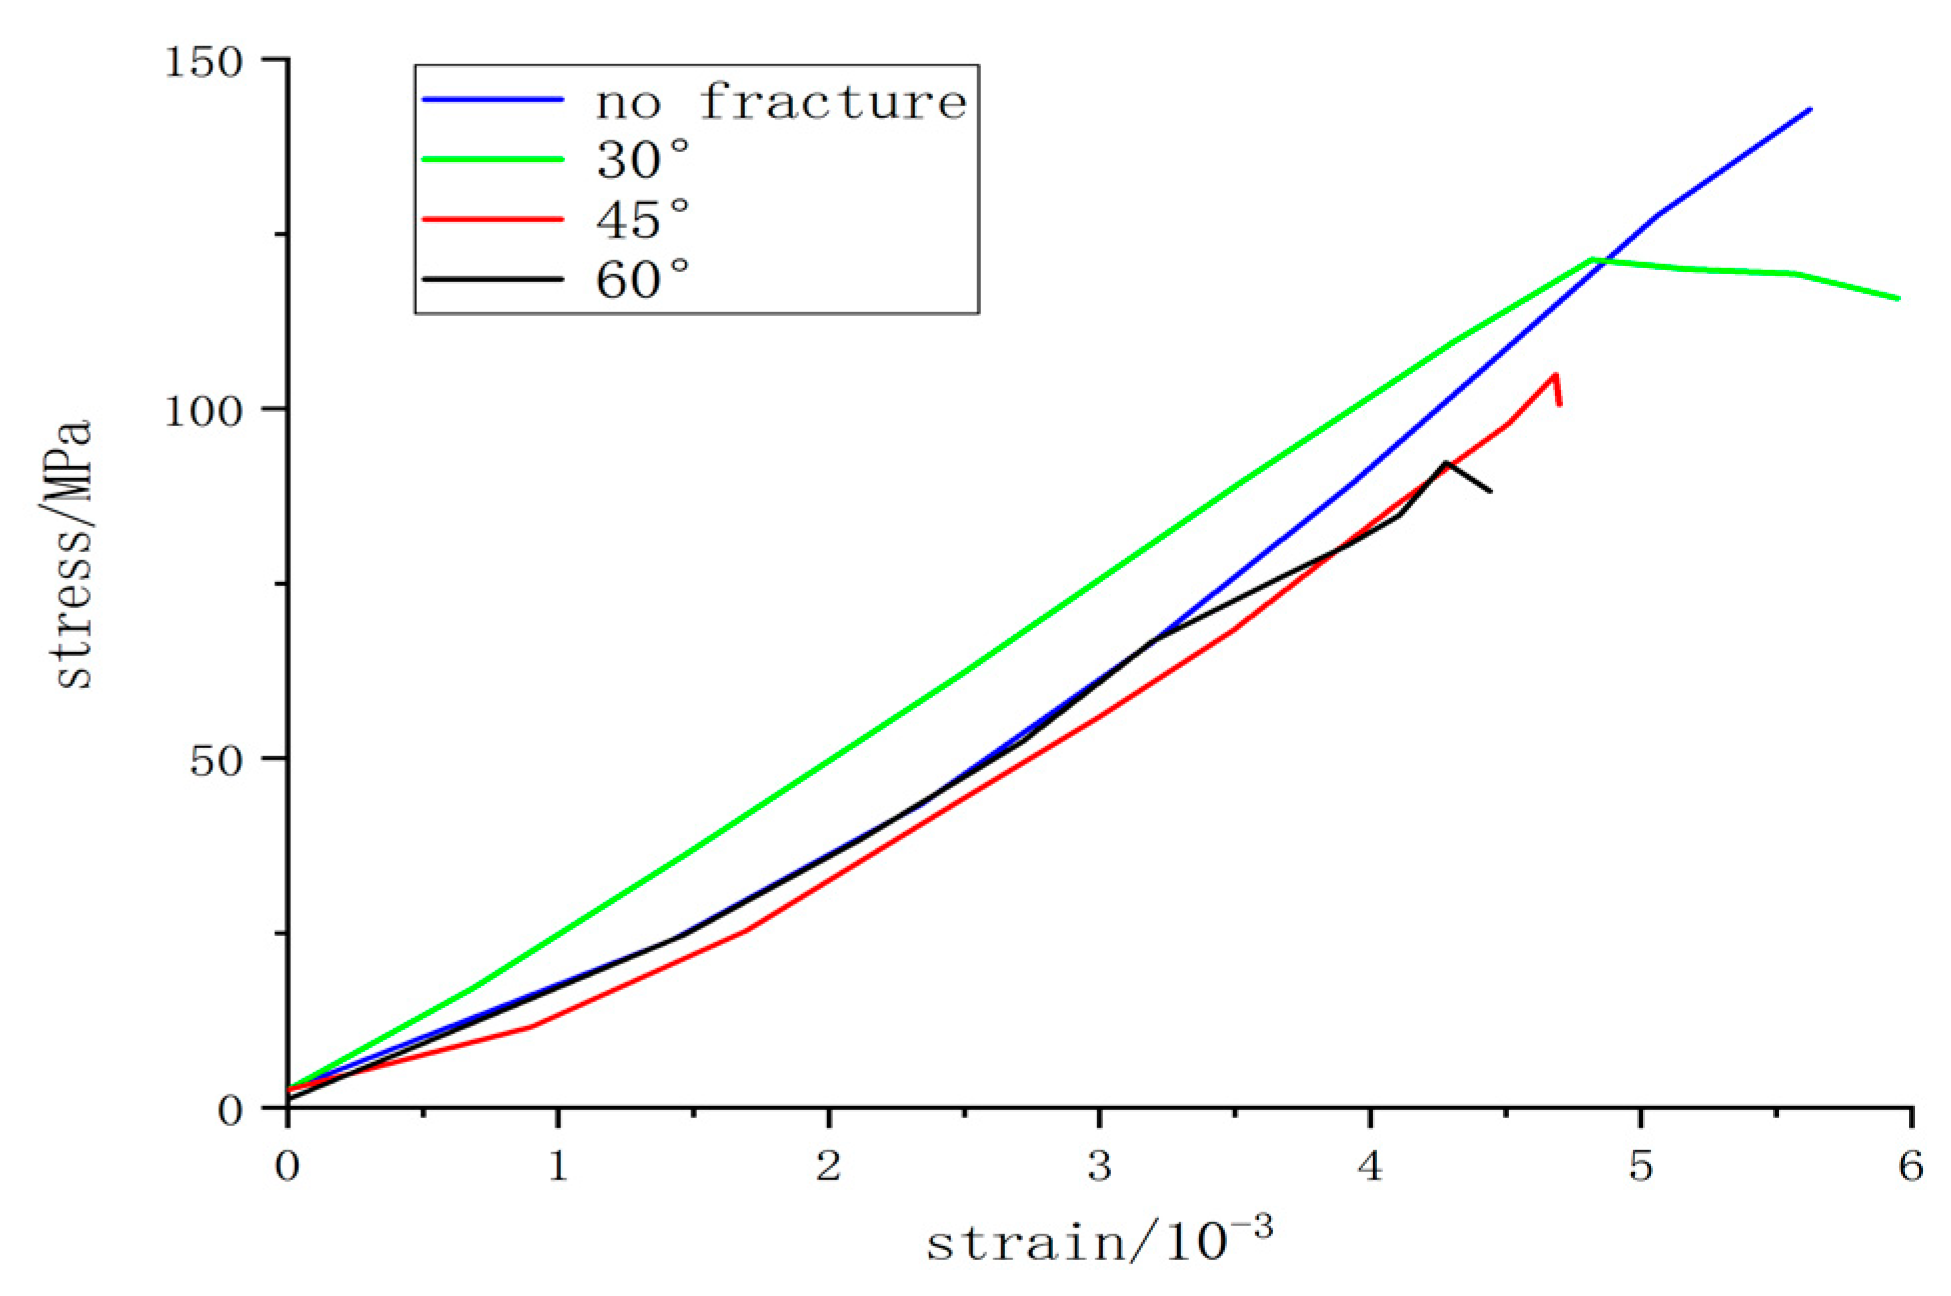
Figure 4 illustrates the curves of stress and strain for precracked syenogranite, and Figure 5 indicates the relationship involving compression strength as well as the crack inclination angles of specimens. From Figure 4 and Figure 5, the uniaxial compression strength of intact syenogranite is 143.21 MPa, the uniaxial compression strength of the syenogranite with a crack dip of 30° is 119.87 MPa, the uniaxial compression strength of the syenogranite with a crack dip of 45° is 105.29 MPa, and the uniaxial compression strength of syenogranite with a crack dip of 60° is 91.02 MPa. Stress and strain of syenogranite are linearly related. The crack tip has little effect on the elastic modulus of syenogranite, while the effect on the uniaxial compression strength is significant. The uniaxial compression strength of the specimen containing cracks is greatly reduced, and the strain at failure is also significantly reduced. This indicates that the presence of cracks causes local stress concentration at the crack tip, leading to the generation and expansion of cracks and the early formation of macroscopic cracks. In response to the increase in crack inclination, the uniaxial compression strength of the specimen decreases linearly. This is due to the fact that syenogranite is a naturally crystalline brittle material, and its shear strength is several times higher than its tensile strength. The strength theory of fractured congruence should adopt the maximum tensile stress theory. At the same load, the maximum tensile stress increases, and the uniaxial compression strength decreases as the direction of the fracture dip increases.

3.2. Charge-Induction Signal Variation Laws

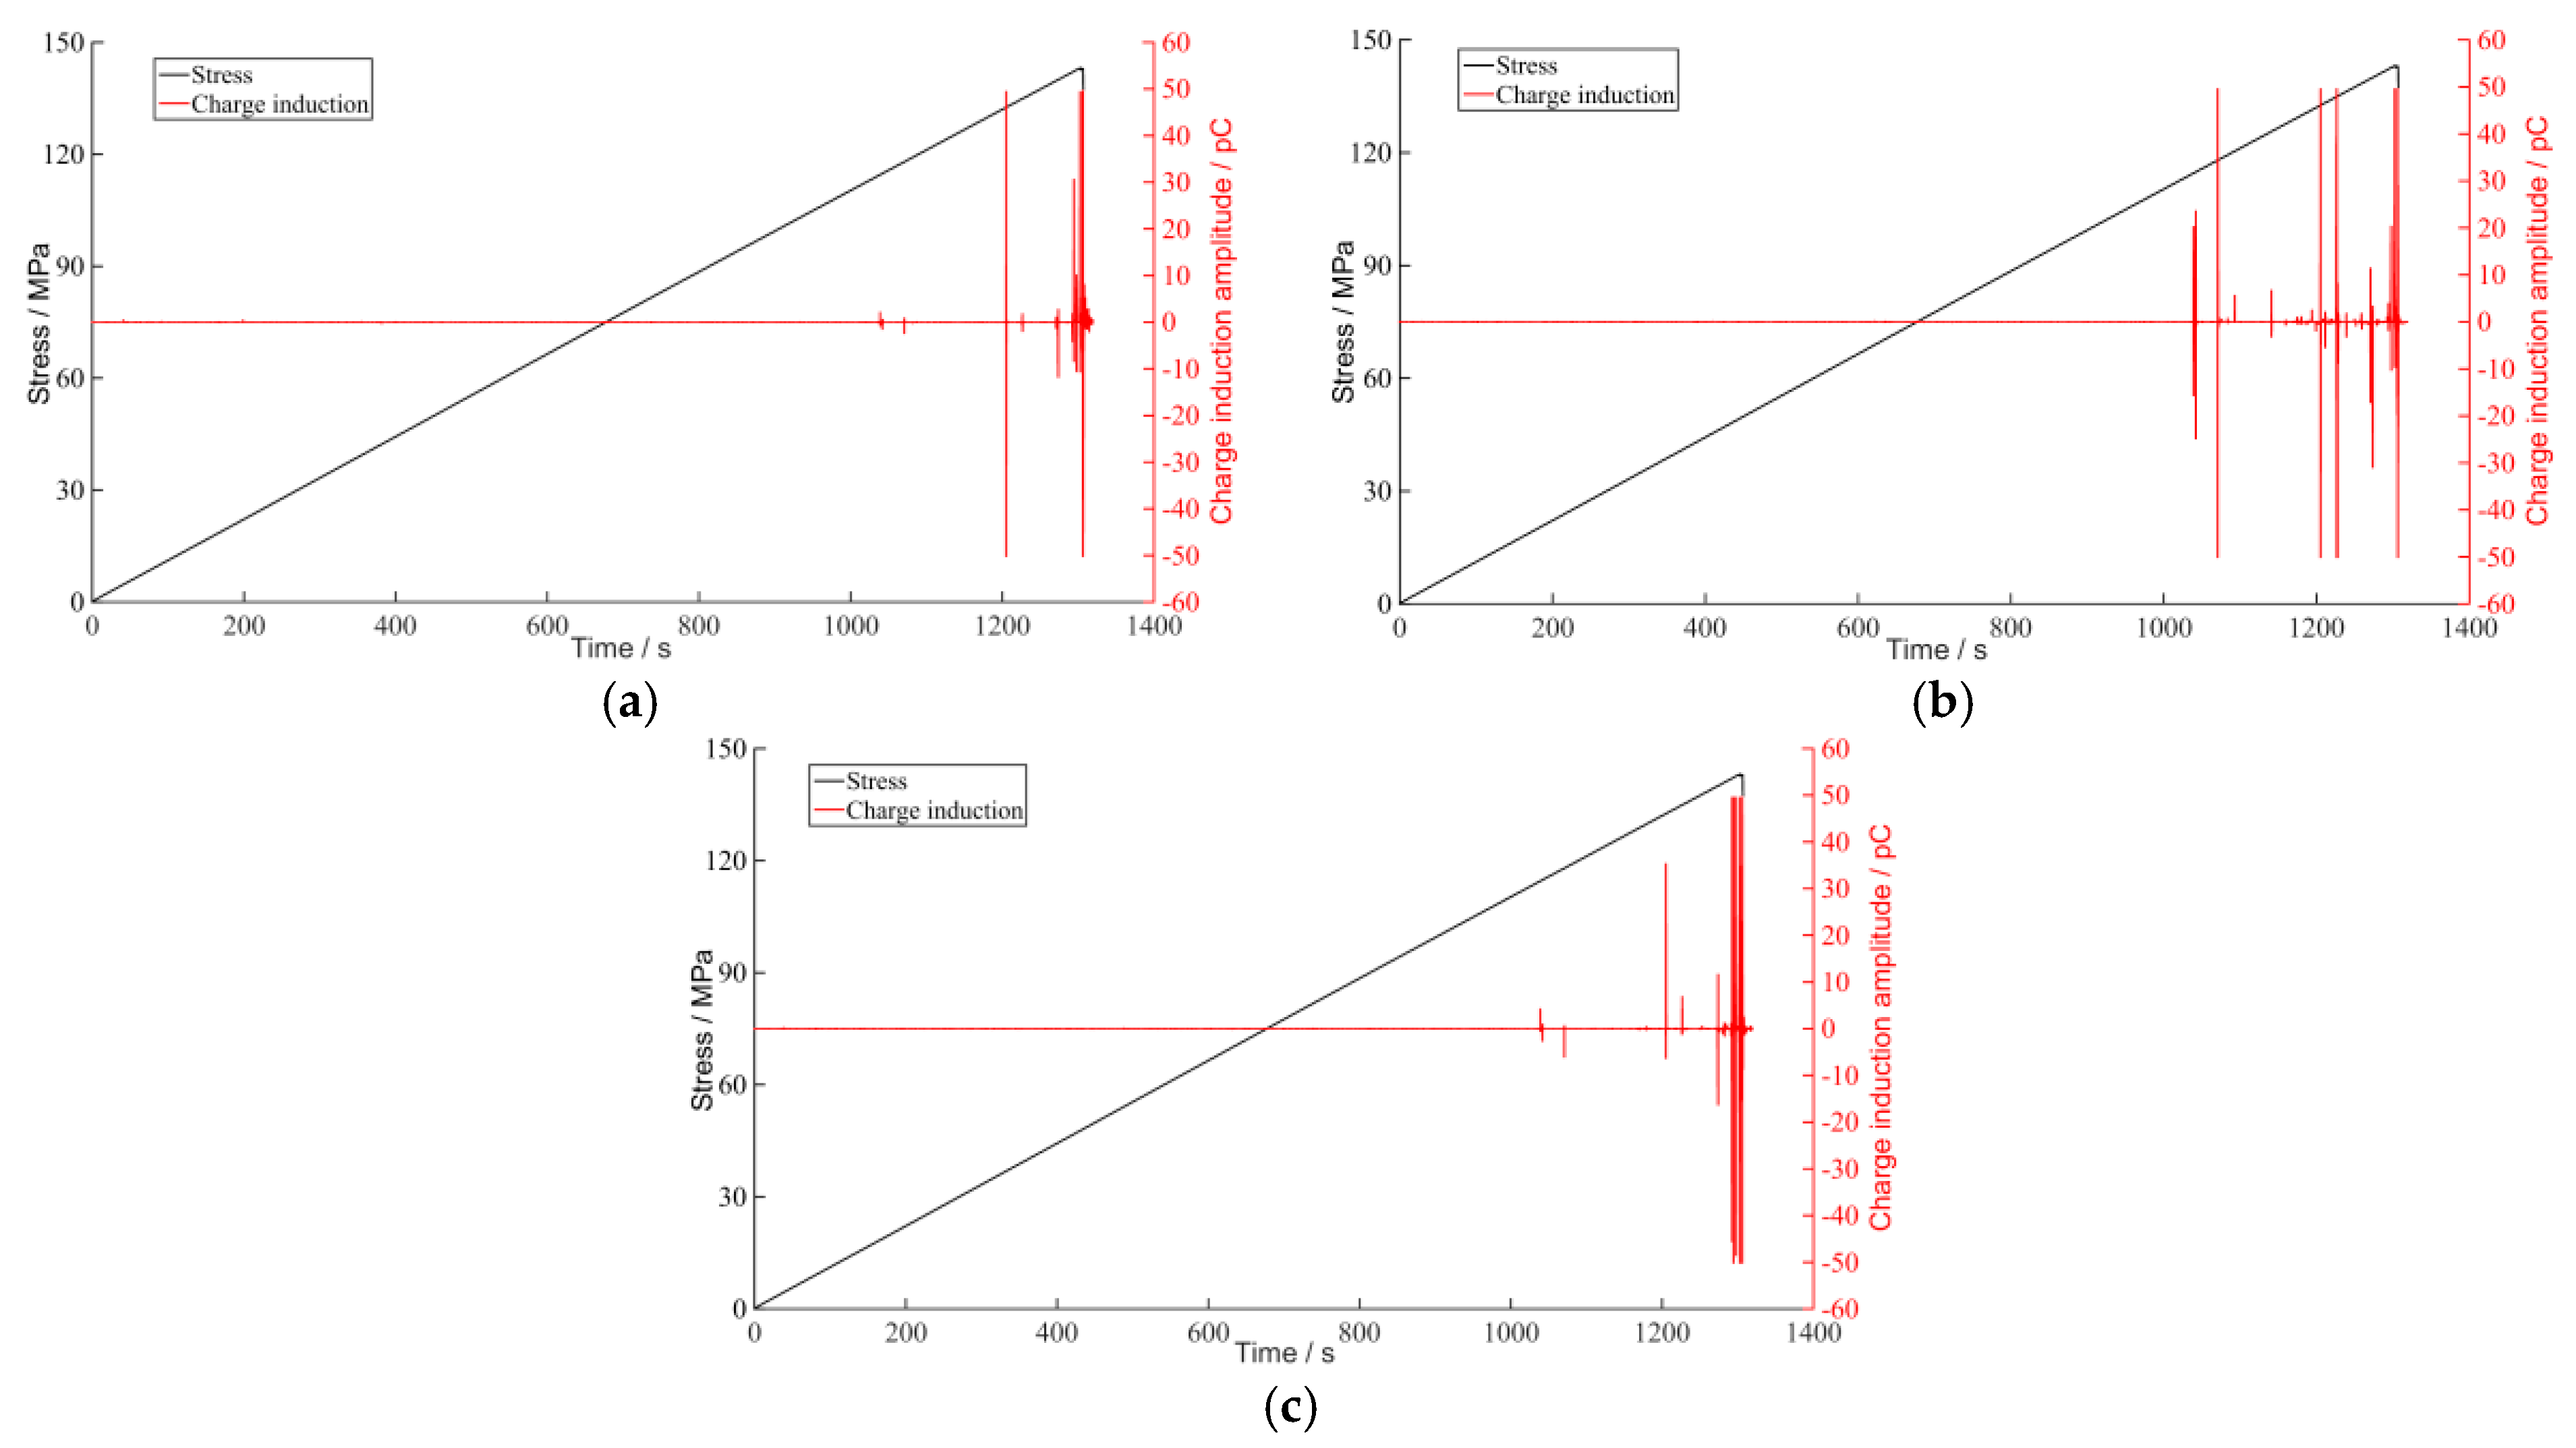
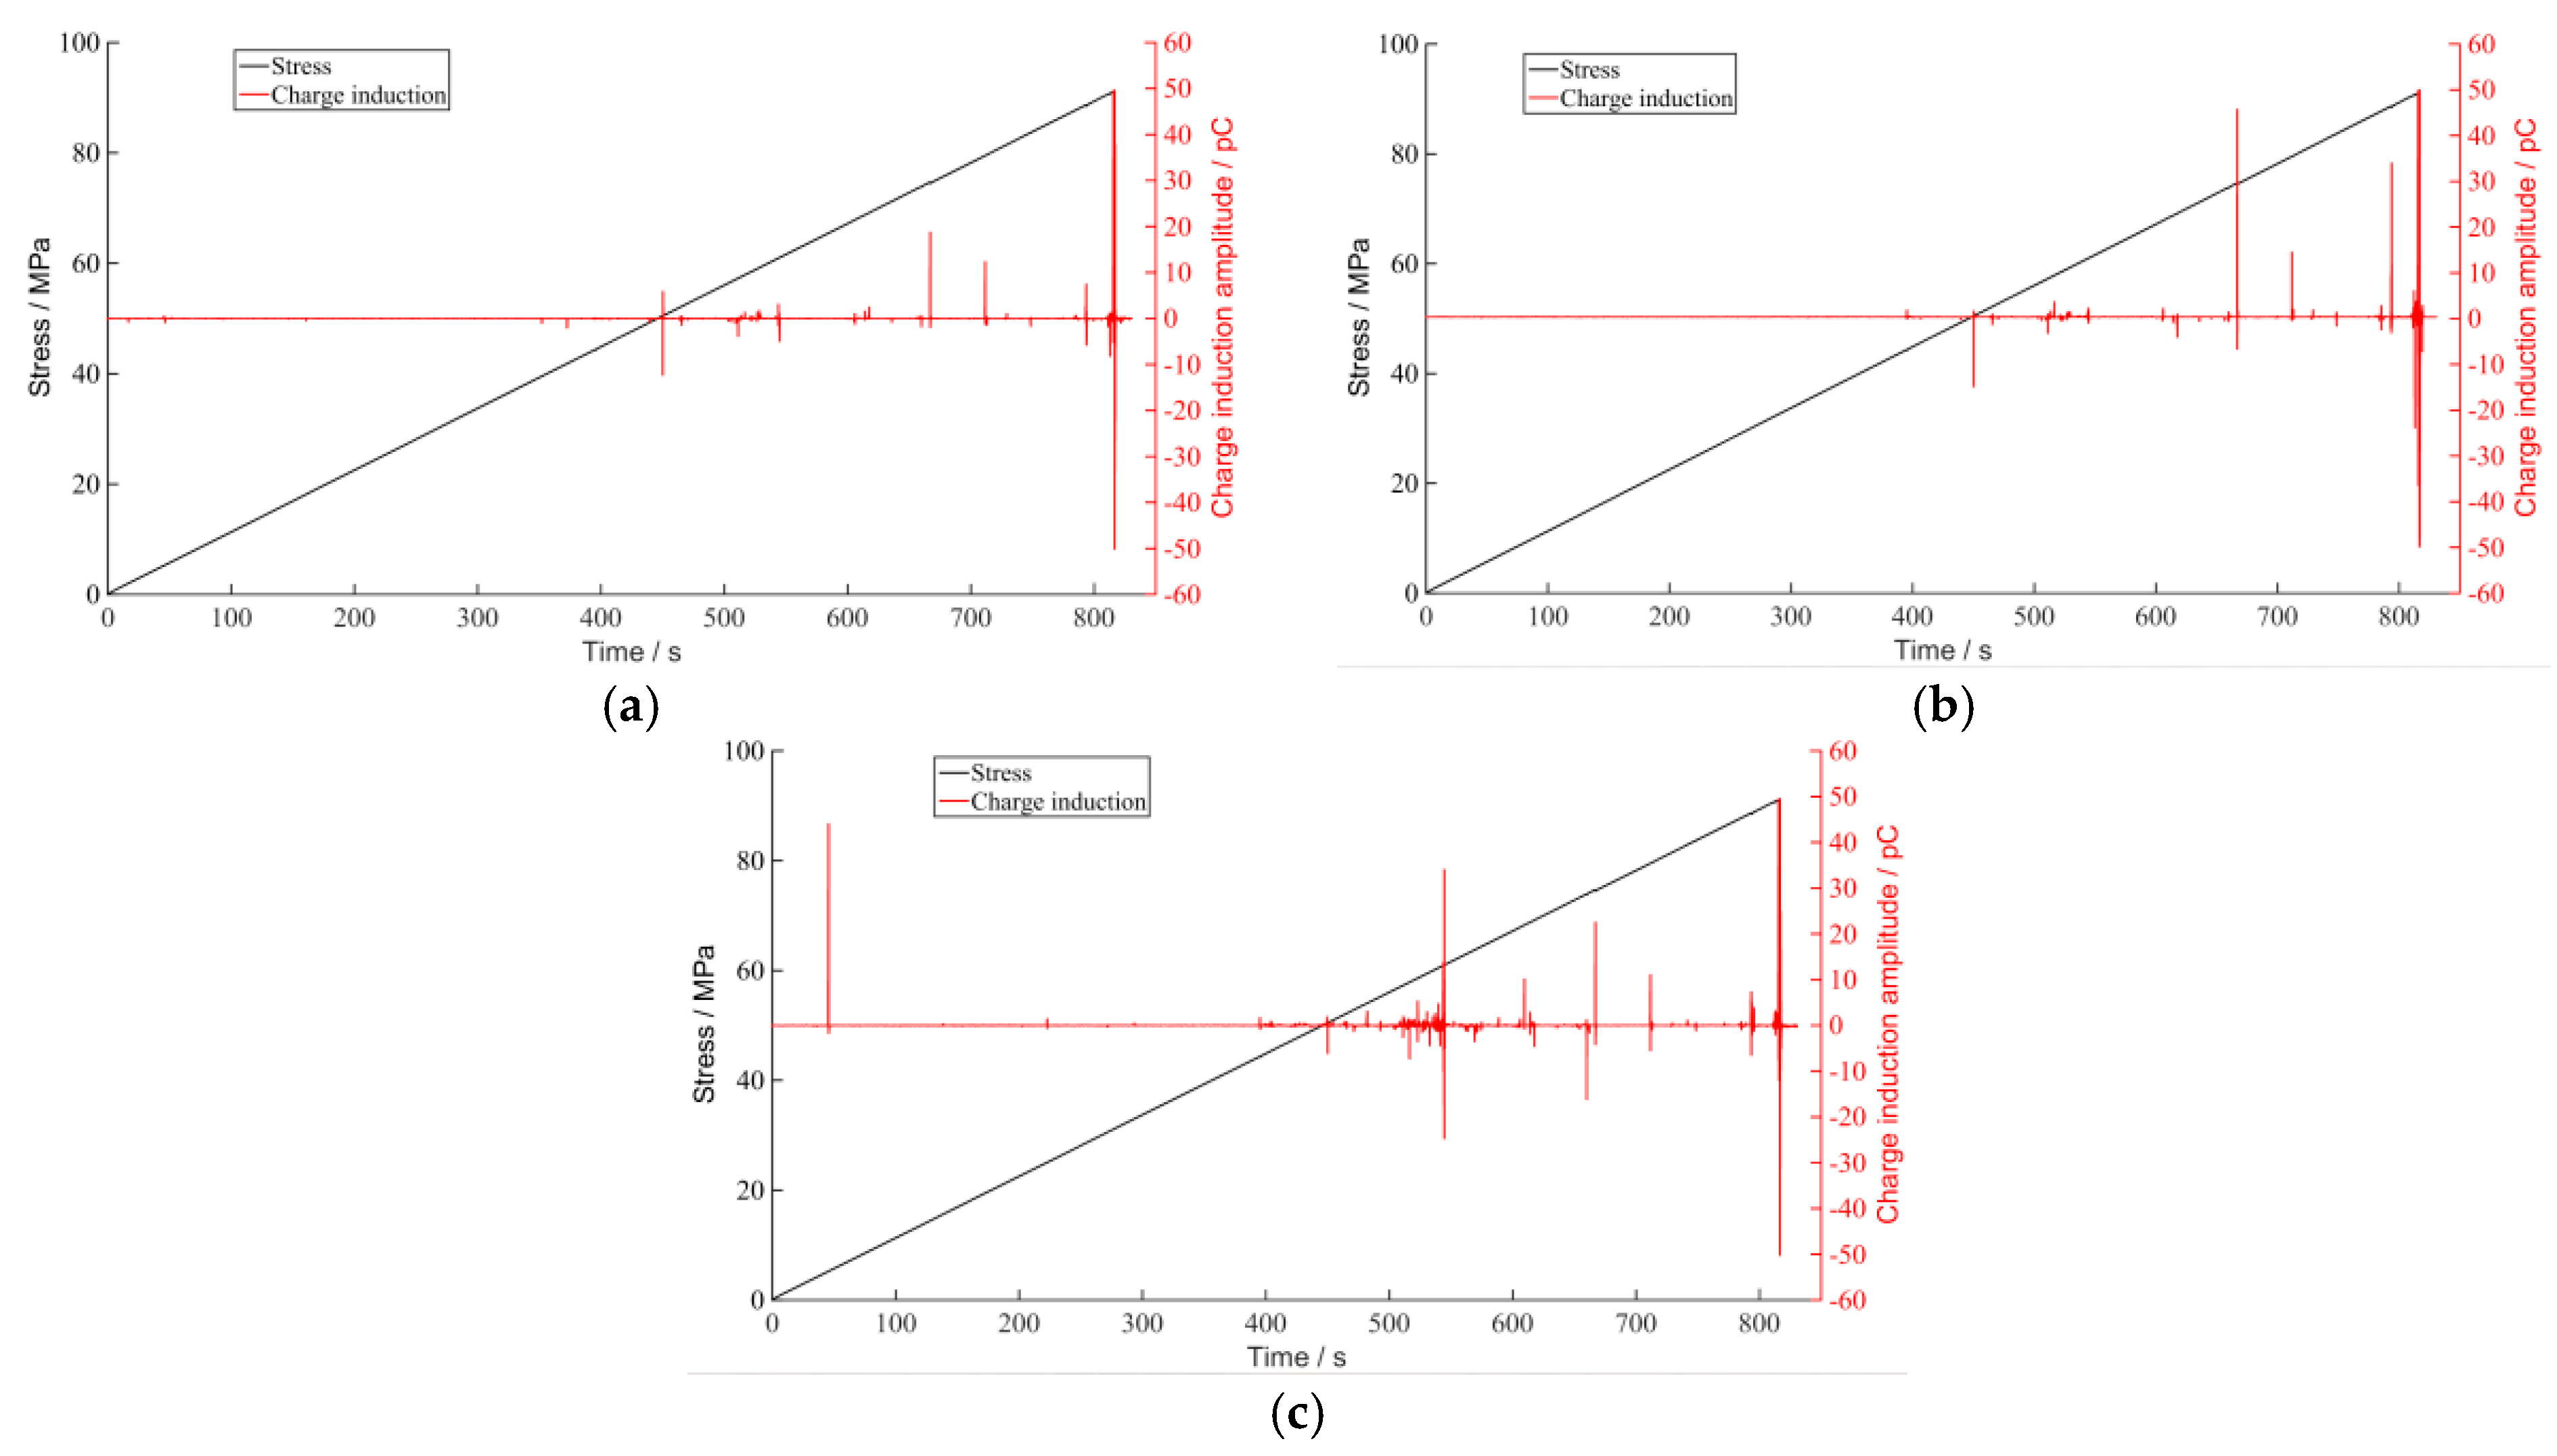
The variation laws of charge-induction signals of intact and precracked syenogranite specimens at a loading rate of 0.5 kN/s and the correlation between the signals are analyzed. Figure 6, Figure 7, Figure 8 and Figure 9 show the charge-induction signal monitoring results of intact syenogranite and syenogranite specimens with crack inclination angles of 30°, 45°, and 60°. In figures (a,b,c), the charge-induction signals acquired by charge sensors 1, 2, and 3 when specimens are deformed or fractured are displayed.
In this paper, the Pearson correlation coefficient is employed to study the correlation between charge-induction signals acquired by sensors during the process of deformation and the fracture of rocks. The correlation coefficient γ between two signal variables can be written as follows:
γ ( X , Y ) = C o v ( X , Y ) V a r X V a r Y γ ( X , Y ) = C o v ( X , Y ) V a r X V a r Y
where, X and Y represent the signals associated with charge induction acquired by different sensors, C o v ( X , Y ) represents X and Y’s covariance, and V a r X and V a r Y represent X and Y’s variances [45]. To obtain the correlation coefficient curves of the signals associated with charge induction acquired by sensors during the whole loading process with time, the correlation coefficients are calculated by taking 1 s data length for variables X and Y, respectively. Figure 10, Figure 11, Figure 12 and Figure 13 depict the correlation of signals associated with the charge induction of intact syenogranite and syenogranite with crack inclinations of 30°, 45°, and 60°; (a,b) in the Figures indicate the correlation coefficients of signals associated with charge induction 1 and 2, 2 and 3 during the deformation and fracture of syenogranite, respectively.
According to the stress and charge-signal evolution curves in Figure 6, Figure 7, Figure 8 and Figure 9, three phases can be distinguished between the specimen’s deformation and fracture process: the deformation phase caused by elastic linear forces, the phase of rack propagation, and the instability-failure phase. Figure 6 and Figure 10 show that the specimen’s elastic linear-deformation phase occurs between the time of first loading and the point at which the stress reaches 75%σ0. The three charge sensors are now receiving signals associated with charge induction but their amplitudes are lower than 0.2 pC, the correlation coefficients are lower than 0.3, and the correlation between the signals is very low. In the phase of rack propagation, the specimen stress reaches 79.95%σ0 at 1038. 73 s. Charge sensor 2 receives a charge-induction signal with an amplitude of 20.9 pC, while charge sensors 1 and 3 receive signals with an amplitude of lower than 3.1 pC. The γ 12 is 0.2967, while γ 13 is 0.5725. At the stress of 82.55%σ0 (1070.8 s) charge sensor 2 receives a charge-induction signal with an amplitude of 50 pC, while charge sensors 1 and 3 receive signals with amplitudes of lower than 3 pC. The γ 12 is 0.4421, γ 23 is 0.4595, and γ 13 is 0.7902. This indicates that microcracks close to point 2 of the specimen are produced at this phase. At the stress of 92.1%σ0 (1204.3 s), charge sensors 1 and 2 receive signals associated with a charge induction of 50 pC in amplitude simultaneously, while charge sensor 3 receives signals associated with a charge induction of 35.1 pC in amplitude. The γ 12 is 0.9691, γ 23 is 0.5471, and γ 13 is 0.5312. In the phase of rack propagation, the three charge sensors continuously receive signals associated with charge induction, which are both synchronous and nonsynchronous. The amplitude of the charge signal collected by each sensor is different and the correlation coefficient is greater than 0.5. Most of the signals in this phase have a moderate correlation, but some of them have a high correlation. In the instability-failure phase (1305–1307 s), the specimen stress reaches 99.72%σ0 at 1305 s. The signals associated with charge induction acquired by the three charge sensors are both large and dense, especially the signals associated with charge induction with amplitudes up to 50 pC are acquired by the three charge sensors within 1 s before the unstable failure occurs. The correlation coefficients of the signals acquired by the three charge sensors at this phase are all greater than 0.9, and the signals have a high correlation with every other.
It can be seen from Figure 7 and Figure 11 that the elastic linear-deformation phase of syenogranite with a crack inclination of 30° is from the initial loading to the stress of 75%σ0. During this phase, the amplitudes of the signals associated with charge induction acquired by the three charge sensors are lower than 0.5 pC, and only at the stress of 35.1%σ0, the amplitude of the signal acquired by charge sensor 2 is 5.1 pC. The correlation coefficients between the signals during this period are lower than 0.39. At the stress of 73.57%σ0 (794.5 s), γ 12 is 0.8063, γ 23 is 0.6581, γ 13 is 0.7313, and the amplitudes of the signals associated with charge induction are small. During the phase of rack propagation, the stress reaches 76.22%σ0 at 823.15 s. The signal amplitude during charge induction acquired by charge sensor 1 is 14.85 pC, while the amplitudes of signals acquired by charge sensors 2 and 3 are lower than 1.1 pC. The correlation coefficients between the charge-induced signals are all greater than 0.4. At a stress of 91.4%σ0 (996.5 s), the amplitudes of the signals associated with charge induction received simultaneously by every charge sensor are 7.65 pC, 2.8 pC, and 11.2 pC. The γ 12 is 0.5062, γ 23 is 0.3176, and γ 13 is 0.8137. During the instability-failure phase, which is from the stress of 98.3%σ0 to the destabilization of the specimen (1072–1089 s), the three charge sensors receive dense and high-amplitude signals associated with charge induction with a maximum amplitude of 50 pC and duration of 1.4 s. The γ 12 is 0.973, γ 23 is 0.8984, and γ 13 is 0.9125 at 1072 s. The γ 12 is 0.8951, γ 23 is 0.9116, and γ 13 is 0.9304 at 1086 s. The signals associated with charge induction have a high correlation in the instability-failure phase and a low correlation in the elastic linear-deformation phase, while most of the signals have a medium correlation and some of them have high correlation signals in the phase of rack propagation.
It can be seen from Figure 8 and Figure 12 that the elastic linear-deformation phase of syenogranite with a crack inclination of 45° is from the initial loading to the stress of 75%σ0. During this phase, the amplitudes of the signals associated with charge induction acquired by the three charge sensors are lower than 2 pC. However, there are a larger number of signals with correlation coefficients greater than 0.7, in which the first high-correlation signal appears at 97.6 s (specimen stress of 10.17% σ0). The γ 12 is 0.7805 and γ 23 is 0.5549. During the phase of rack propagation, the stress reaches 77.5%σ0 at 743.5 s. The amplitudes of the signals associated with charge induction received simultaneously by every charge sensor are 15.75 pC, 7.86 pC, and 5.18 pC. At the stress of 79.1%σ0 (758.9 s), the charge sensors 1, 2, and 3 receive the signals associated with charge induction simultaneously, and their amplitudes are 10.08 pC, 9.176 pC, and 8.866 pC. The γ 12 is 0.9668, γ 23 is 0.9715, and γ 13 is 0.955. The signals associated with charge induction of large amplitude start to be received at a stress of 83.14%σ0 (797.6 s), and charge sensor 1 receives more signals associated with charge induction with a larger amplitude than those acquired by charge sensors 2 and 3. From Figure 3, it can be seen that charge sensor 1 occupies the center of the crack, while charge sensor 2 occupies the center of the crack, and charge sensor 3 is far away from the crack. This indicates that the crack tip is more likely to generate signals associated with charge induction. In the instability-failure phase, signals associated with charge induction with amplitudes up to 50 pC are received at 952.7–954.3 s, and the correlation coefficients are all greater than 0.7. The signals in this phase have a high correlation.
From Figure 9 and Figure 13, as can be seen, the elastic linear-deformation phase of syenogranite with a crack inclination of 60° is from the initial loading to the stress of 51.1%σ0 (415.5 s). During this phase, the amplitudes of the signals associated with charge induction acquired by the three charge sensors are lower than 2.3 pC. At 45.65 s, charge sensor 1 receives a pulse signal with an amplitude of 45 pC, while charge sensors 2 and 3 receive signals associated with charge induction with amplitudes lower than 0.85 pC. The γ 12 is 0.0618 and γ 23 is 0.0418. At 393.7 s, charge sensor 3 receives a charge-induction signal with an amplitude of 2.3 pC. The γ 12 is 0.4739 and γ 23 is 0.6727. In the phase of rack propagation, charge sensors 1, 2, and 3 simultaneously receive signals associated with charge induction with a maximum amplitude of 12.8 pC when the stress reaches 51.1%σ0. At the stress of 66.95%σ0 (544.4 s), charge sensor 1 receives a charge-induction signal with an amplitude of 34.8 pC. When the stress reached 81.56%σ0, a stress drop of 0.3 MPa occurs, and before the stress drop occurs, charge sensor 1 receives a charge-induction signal with an amplitude of 23.9 pC. There is a high correlation between the signals with a correlation coefficient greater than 0.7. During the instability-failure phase (815–817 s), the amplitudes of the signals associated with charge induction reach 50 pC, and signals have a high correlation with correlation coefficients greater than 0.7.

3.3. Charge-Induction Signal Characteristics

The deformation and failure phase of the specimen is split into the elastic linear-deformation phase, the phase of rack propagation, and the instability-failure phase, and a typical charge-induced signal is selected in every phase to analyze the change process of the signal in the time domain. The fast Fourier transform of the waveform is performed to observe the characteristics of the signal in the frequency domain. To investigate the time-frequency features for the charge signals in various loading phases of the syenogranite deformation fracture process, the HHT waveform analysis method is employed to process the signals; the signal is transformed to the domain of time-frequency as well as the alternation of frequency within the signal with time is analyzed. Huang et al. consider that the actual signal consists of multiple frequency components [46], therefore the instantaneous frequency is not meaningful. It is significant to decompose the signal into individual components to analyze the time-frequency characteristics. HHT consists of empirical modal decomposition (emd) and Hibert transform. The signal is decomposed into several intrinsic modal functions (imf) by emd, and then the instantaneous frequency of every imf component is obtained by Hibert transformation to obtain the accurate expression of frequency in the time domain.

3.3.1. Time Domain Characteristics

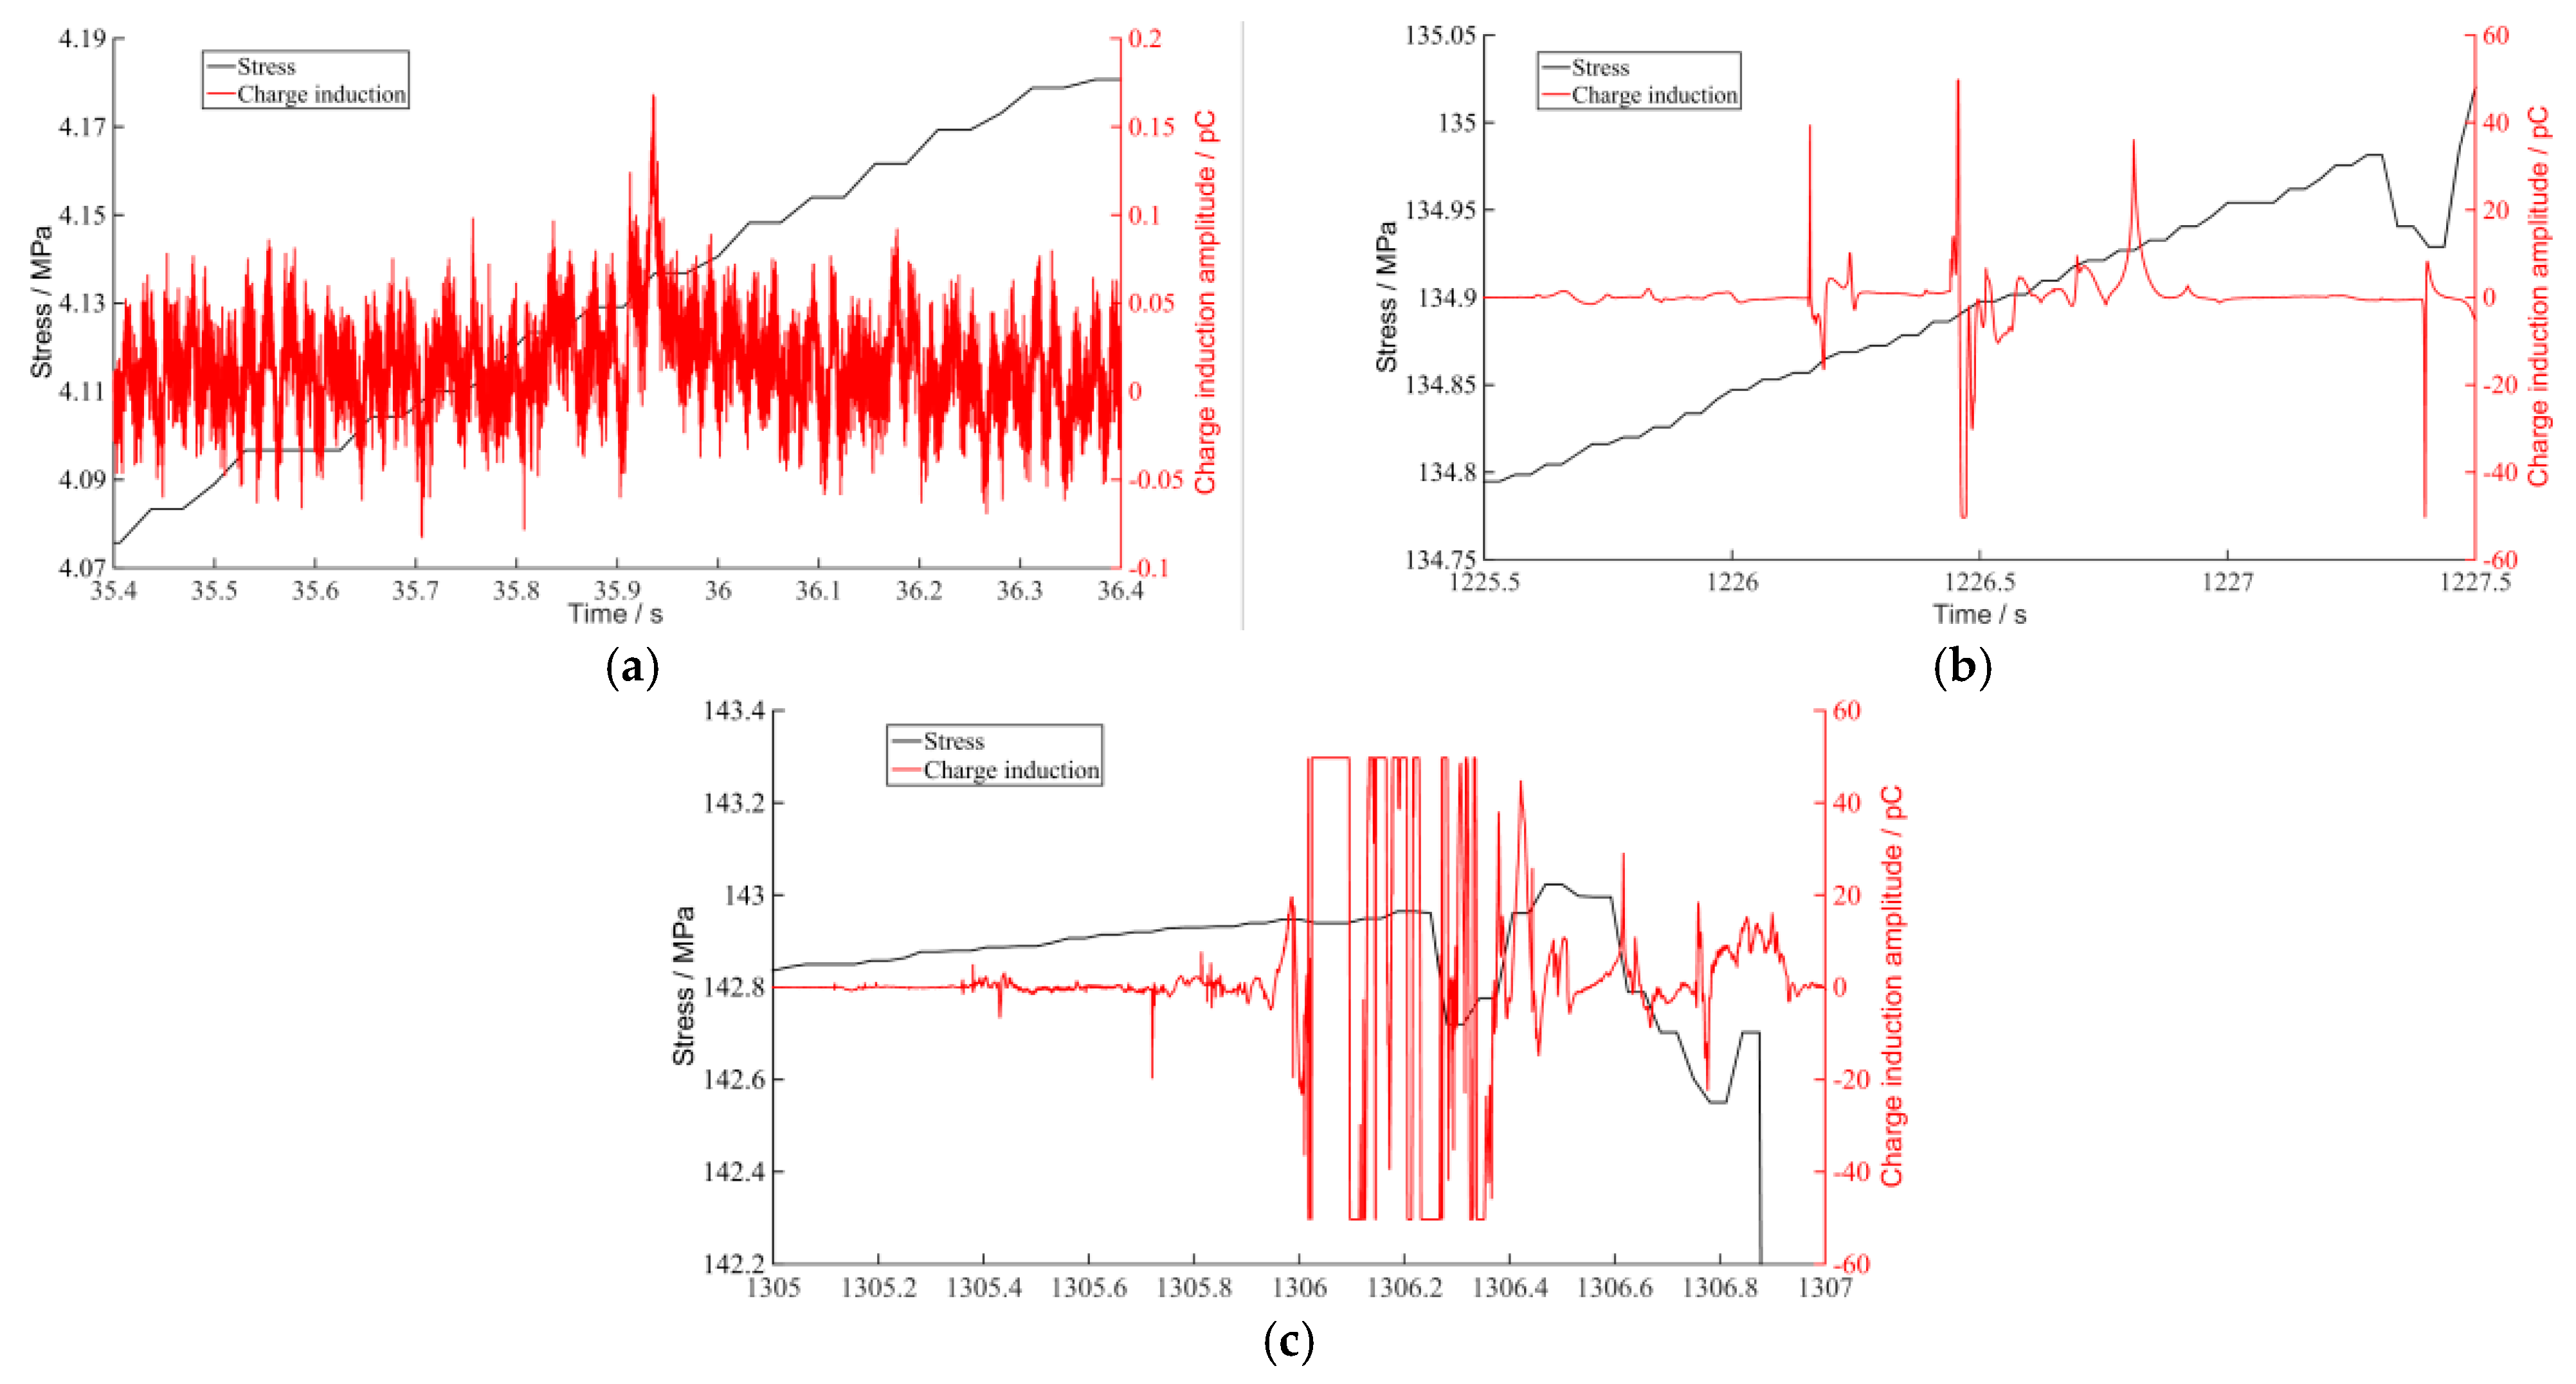
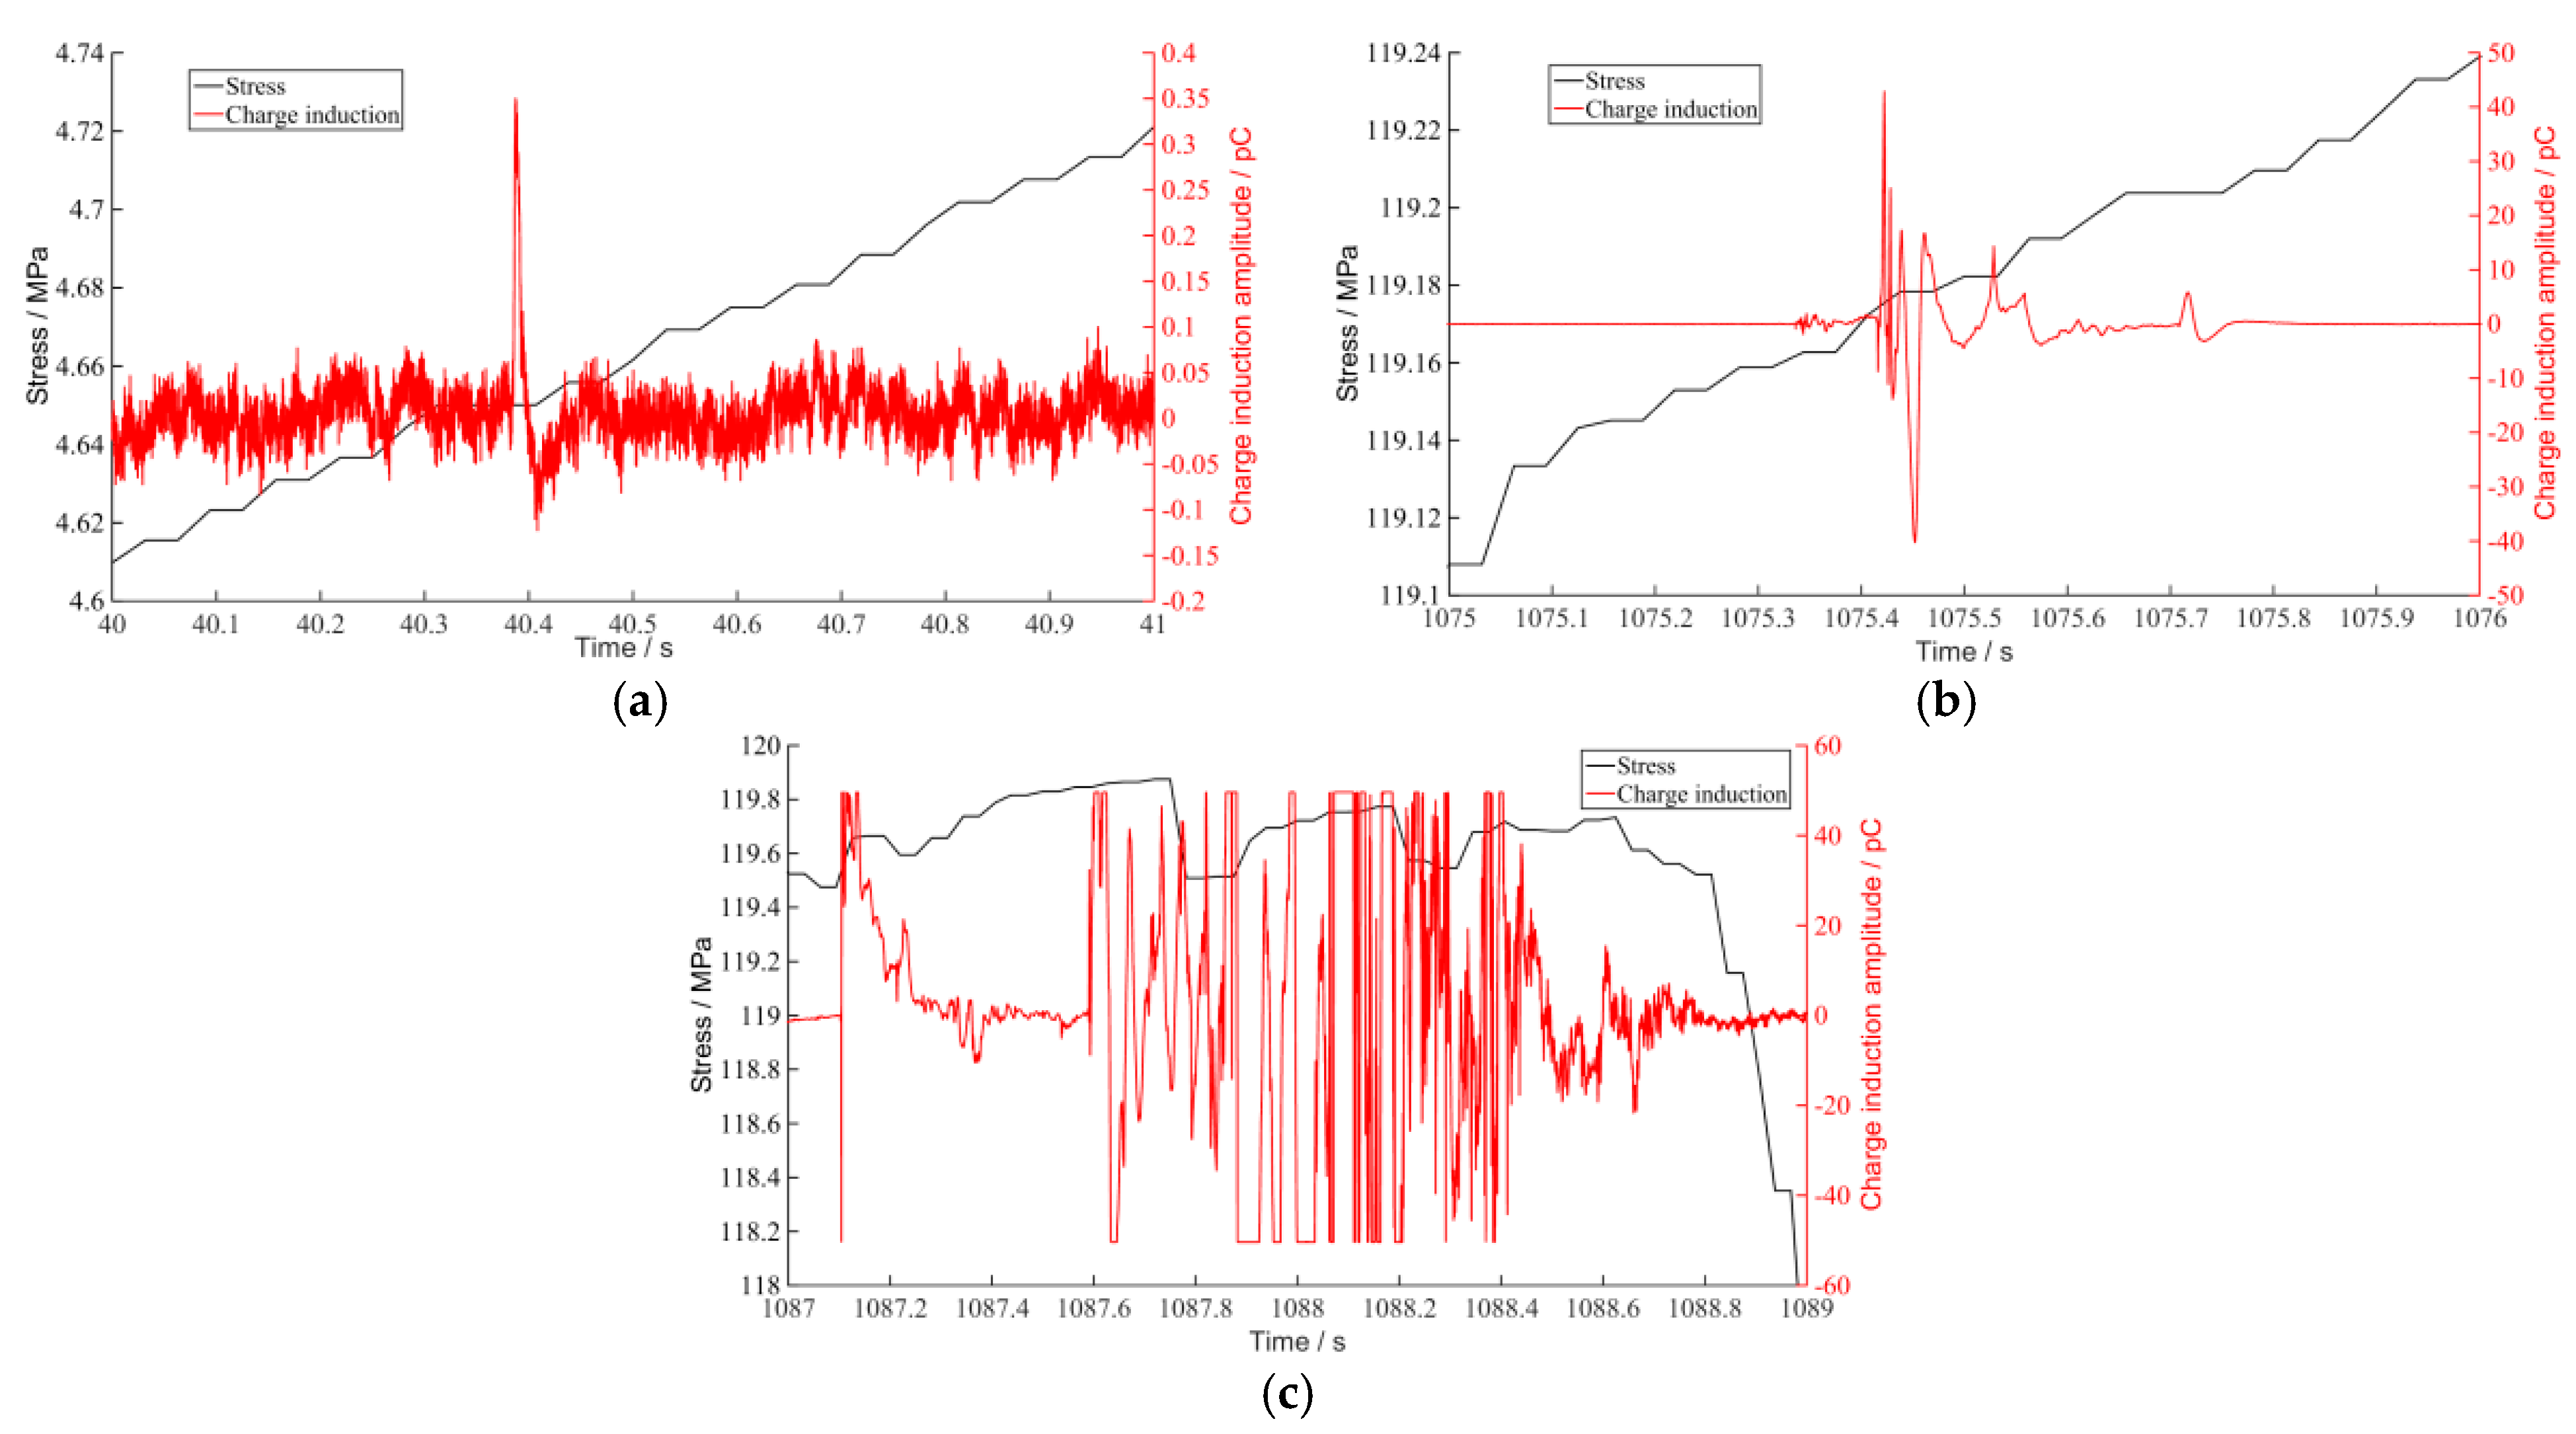
Figure 14, Figure 15 and Figure 16 are the stress and charge-induction signals evolution curves of intact syenogranite and syenogranite with a crack inclination of 30° and 60° at different loading phases (including the elastic linear-deformation phase, crack-propagation phase, and instability-failure phase). The evolution of the waveform can be seen in the linear elastic phase; the charge-induction signal amplitudes are small and, with the increase of the crack inclination, the charge-induction signal amplitudes will increase. However, all of them are pulsed signals with a very short duration. The syenogranite with a crack inclination of 60° produces a crack at the initial loading. The small dislocation causes large pulses of signals associated with charge induction. In the phase of rack propagation, a huge amplitude charge-induction signal is generated and the signal’s duration lengthens. The crack inclination angle causes the charge-induction signal’s amplitude to drop, whereas, for syenogranite with a crack inclination angle of 60°, the signal’s amplitude rises. The charge-induction signal is especially prevalent during the instability-failure phase. The signal has a lengthy length and an amplitude that may go as high as 50 pC. Before there is a major stress decrease or failure, the signals of large amplitude associated with charge induction are produced. The length of the large-amplitude charge-induction signal is shorter as the crack inclination rises.

3.3.2. Frequency-Domain Characteristics

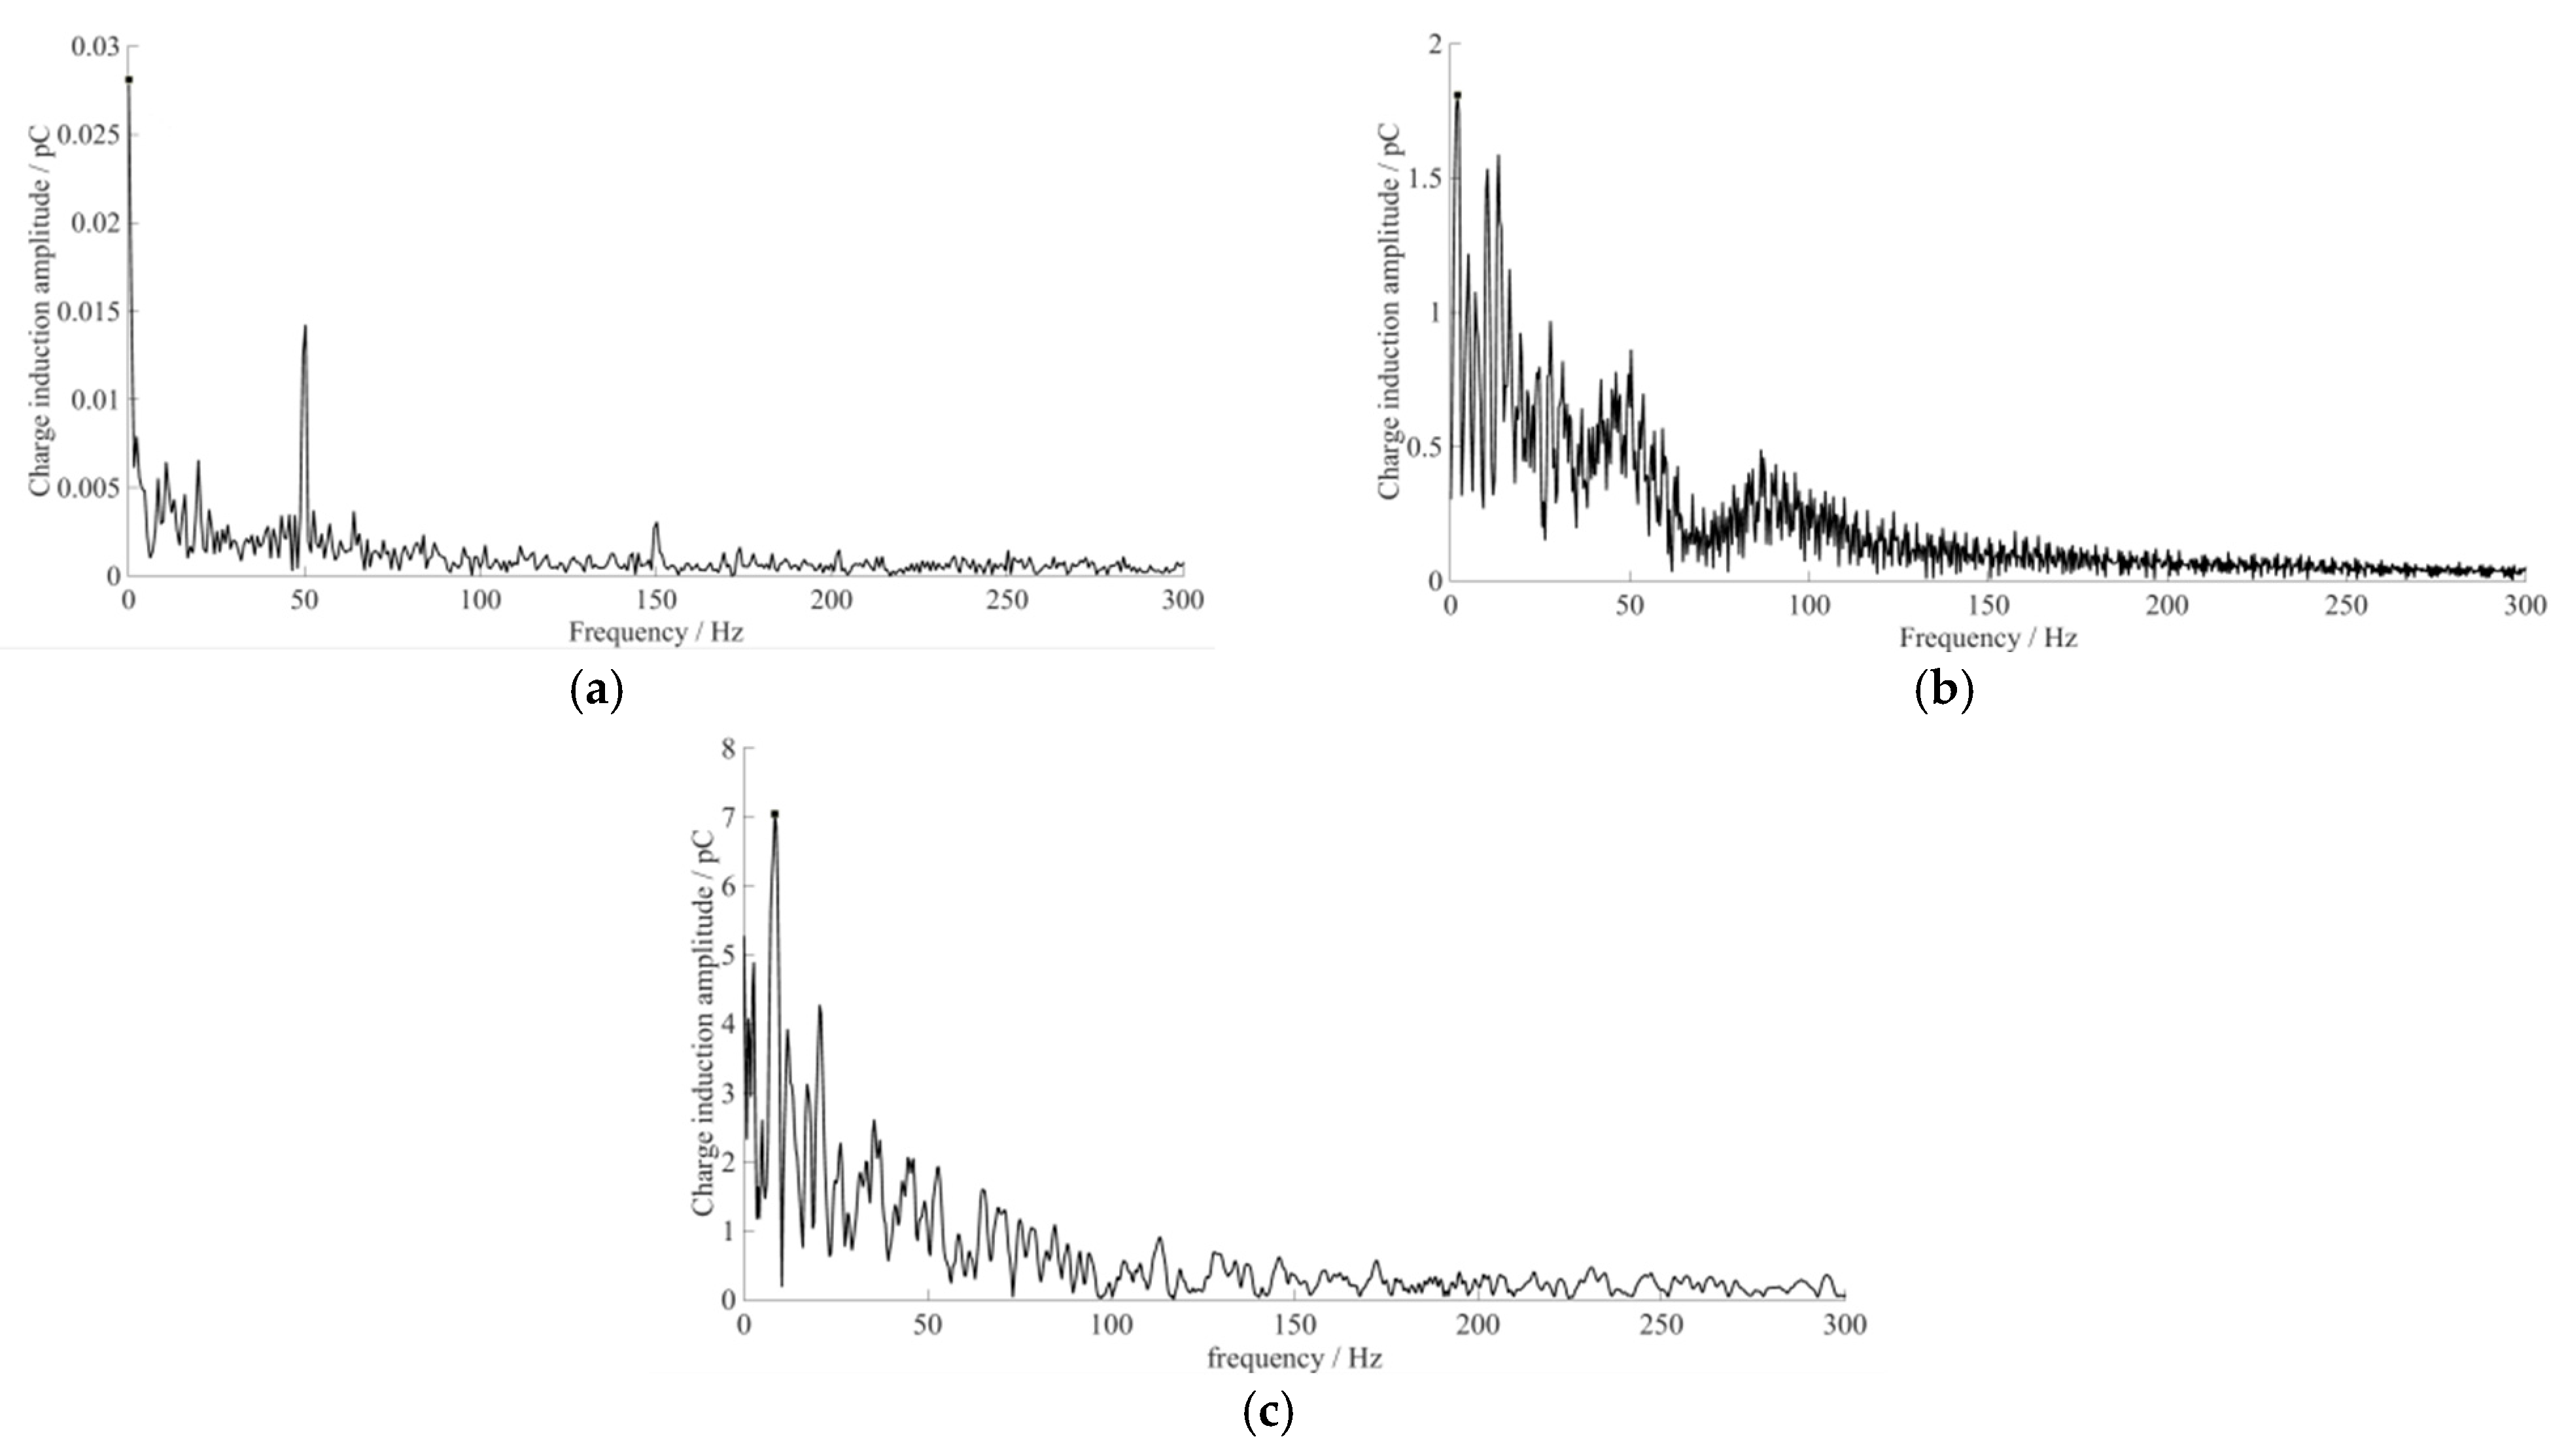
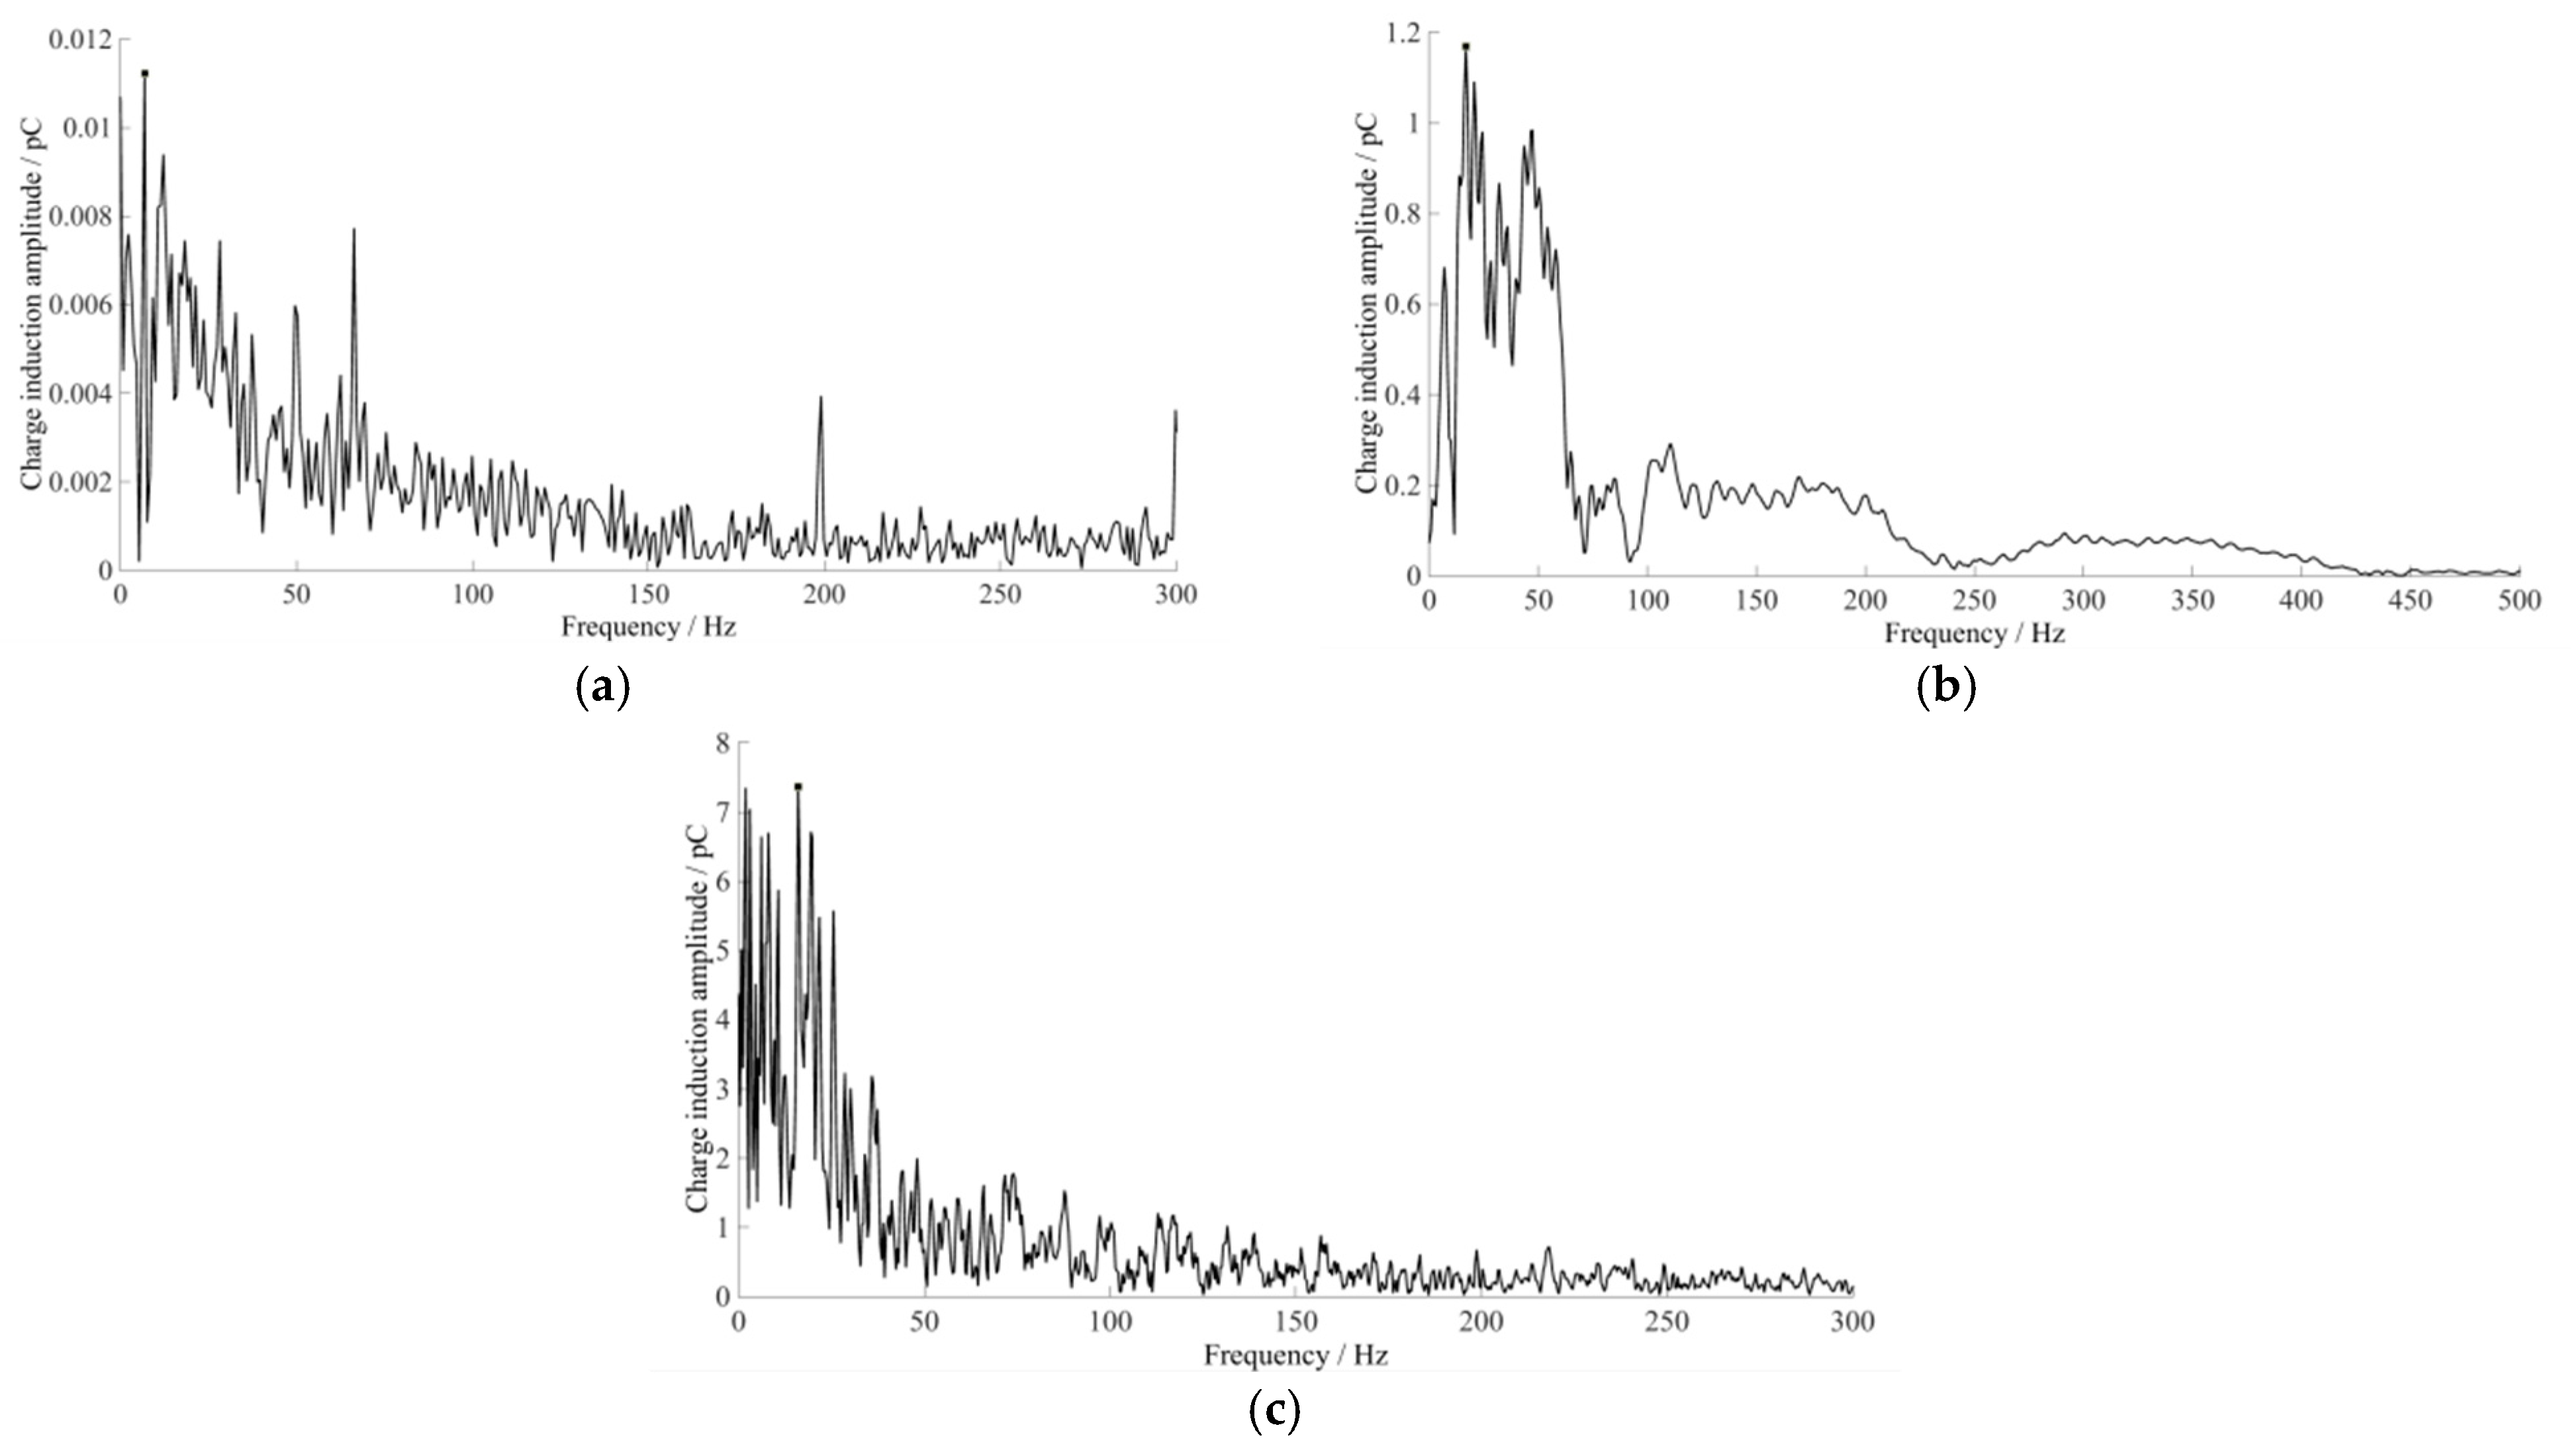
Figure 17, Figure 18 and Figure 19 are frequency-domain diagrams of signals associated with charge induction of intact syenogranite and syenogranite with a crack inclination of 30° and 60° at different loading phases. According to the Figures, most of the frequencies are 0–100 Hz, while a small number of frequencies are distributed in 100–300 Hz. From the phase of elastic linear deformation to the instability-failure phase, amplitudes of the signals in all frequency bands increase. In addition, the amplitudes and energies of the signals associated with charge induction are much larger in the instability-failure phase than in the other phases. In the linear elastic deformation phase, the amplitudes of the signals associated with charge induction in all frequency bands increase with the increase of crack inclination. In the phase of rack propagation, the amplitudes of the signals associated with charge induction in all frequency bands decrease with the increase of the crack inclination. In the instability-failure phase, the amplitudes of signals associated with charge induction in all frequency bands change little with the increase of crack inclination, but the amplitudes of syenogranite with the crack inclination of 60° become small in all frequency bands.

3.3.3. Domain of Time-Frequency Characteristics

Figure 20, Figure 21 and Figure 22 are domains of time-frequency diagrams of signals associated with the charge induction of intact syenogranite and syenogranite with crack inclinations of 30° and 60° at various loading phases. From the Figures, it can be observed that the greatest power values are reached in the instability-failure phase and that the power values of signals associated with charge induction of synogranite dramatically rise from the elastic linear-deformation phase to the instability-of-failure phase. The major frequency of signals related to charge induction reduces with a rise in crack inclination in the 0–100 Hz frequency range during the elastic linear-deformation phase, while the power value increases. The maximum power value of signals associated with charge induction of intact syenogranite is 0.148, and the main frequency is 86.5 Hz. The maximum power value of signals associated with the charge induction of syenogranite with a crack inclination of 60° is 16.2, and the main frequency is 15.2 Hz. In the crack-propagation phase, the energy of charge-induction signals is mainly distributed in the 0–100 Hz frequency range, and the energy of charge-induction signals is the largest around the time of generating signals associated with charge induction. With the increase of the crack inclination angle, the charge-induction signal power values decrease, and the maximum values are 56.3, 38.6, 6.88, and 29.1. In the instability-failure phase, the energy of charge-induction signals is mainly distributed in the 0–400 Hz frequency range. With the increase of crack inclination, the main frequencies in the range of 10–15 Hz, the charge-induction signal power values increase, and the maximum values are 90.5, 108.3, 125.8, and 68.6. The power value of syenogranite with a crack inclination of 60° is the minimum of 68.6.

3.4. Comprehensive Analysis

Above all, the signals associated with charge induction generated during the deformation and fracture of intact syenogranite are more abundant than those generated in precracked syenogranite, and the events of signals associated with charge induction are more numerous. In the elastic linear-deformation phase, no signals associated with charge induction are generated from the intact syenogranite, and small-amplitude signals associated with charge induction are generated from precracked syenogranite. As crack inclination increases, signal amplitude during charge induction increases. Pulse signals with an amplitude of 45 pC are received for a syenogranite with a crack inclination of 60°. The amplitude of the signals associated with charge induction in the elastic linear-deformation phase is low and the correlation is also low. In the phase of rack propagation, signal amplitude during charge induction generated by the intact syenogranite is larger than that generated by the precracked syenogranite, and the events of large-amplitude signals associated with charge induction are more numerous. As the crack inclination increases, the number of events of received signals associated with charge induction and their amplitudes increase, and the time to receive the apparent charge-induction signal advances. Most of the correlations between the charged induction signals belong to the medium correlation, and a small part belongs to the high correlation. In the instability-failure phase, the signals associated with charge induction with an amplitude of up to 50 pC are received simultaneously by every sensor during the deformation and fracture of intact and precracked syenogranite, and the correlation coefficients are all greater than 0.7. Compared with precracked syenogranite, intact syenogranite requires more energy for failure. Intact syenogranites have higher uniaxial compressive strength, release more energy during failure, and have more large-amplitude charge-induced signal events when mineral earthquakes occur. The stress in the precracked syenogranite entering the phase of rack propagation is 75%σ0, while the stress of syenogranite with a crack inclination of 60° is 51.1%σ0. The signals associated with charge induction with large amplitude, medium correlation, or even high correlation are generated at the phase of rack propagation, which can give early warning to the deformation failure of syenogranite. When the large amplitude and high correlation signals associated with charge induction are generated, it means that the syenogranite has entered the instability-failure phase and has a high risk. With the increase of crack inclination, the ability of orthogonal granite to resist failure decreases. Especially for syenogranite with a crack inclination of 60°, the time to enter the instability-failure phase is greatly advanced and the number of large energy events is significantly increased. Therefore, earthquakes and mining earthquakes are more likely to occur on large inclination faults.
There is a relationship between the charge-induction signal’s position and the inclination of the crack in syenogranite during deformation and fracture. Numerous charge-induction signal occurrences occur close to the crack, and the signals connected to charge induction along the crack-inclination direction have relatively substantial amplitudes. The signals associated with charge induction are produced during the deformation of the cracked syenogranite, and their amplitude is at its highest during the instability-failure phase. Before the instability-failure phase, the syenogranite produces obvious precursor signals synchronized with the signals associated with charge induction. As the crack inclination increases, the signals associated with charge induction increase. The stress of the syenogranite is greatly reduced when the first significant charge-induction signal appears or when the first precursor signal synchronized with charge induction appears. (The stress of the specimen without a crack is 92.1%σ0, the stress of the specimen with a crack inclination of 30° is 91.4%σ0, the stress of the specimen with a crack inclination of 45° is 77.5%σ0, and the stress of the specimen with a crack inclination of 60° is 54.9%σ0).
When orthogonal granite is deformed and fractured, signals related to charge induction are mostly generated at frequencies between 0 and 100 Hz. The amplitude and power values of the signals related to charge induction steadily grow in every frequency band from the elastic linear-deformation phase to the instability-failure phase, reaching their maximum value in the instability-failure phase. The power value of the charge-induction signal increases with the increase in crack inclination during the elastic linear-deformation phase. The power for the charge-induction signal is primarily concentrated at the time of generation during the phase of rack propagation. With a rise in crack inclination, the charge-induction signal’s power value diminishes. In contrast to the previous two phases, the instability-failure phase’s charge-induction signal frequency spectrum is dispersed from 0–400 Hz, with the primary frequencies being 10–15 Hz. The strength of the charge-induction signal grows along with the crack inclination.
The charge generated in the process of rock deformation and fracture is caused by the piezoelectric effect, friction effect, microcrack, and crack propagation leading to charge separation at the crack tip. The generation of electric charge in the process of rock deformation and fracture is related to the above mechanisms and is the result of the combined superposition of electric charges generated by the above mechanisms. According to the test results, the physical and mechanical properties of the rock, its main components, and the main reason for the charge generated during the rock deformation and fracture process, is the microcrack leading to the charge separation at the crack tip and friction effect. A large number of microcracks will occur during the deformation and fracture process of any rock, and sliding and friction will occur between the two walls. During the rock deformation and fracture process, sliding and friction will occur between different materials, cracks will propagate, and produce a large number of macro- and microcracks. The physical process of rock fracture is the gradual occurrence of microfractures (low-energy and high-frequency signal) under high stress, followed by crack propagation and connection (increased signal energy and reduced frequency), and finally rock instability and failure (maximum energy and lowest-frequency signal).

4. Discussion

Rock failure charge-induction monitoring technology is a promising geophysical method with many expected advantages that can improve the prediction accuracy and applicability of dynamic hazards and provide scientific reference for the mechanism disclosure of engineering geological hazards in the process of deep mining [18]. In this paper, the effects of fractures on the failure characteristics and charge-induction signal of syenogranite are investigated from the perspective of whether the fractures exist or not. It is found that when the stress of the intact rock specimen is about to reach the ultimate strength, the charge signal is the largest, and the frequency-domain characteristics of deformation and failure generally show that the amplitude of the main frequency increases sharply when the stress drop occurs, and the amplitude of the main frequency increases most when the rock is completely destroyed, which is consistent with the research conclusions of Pan et al. [16,17] and Xiao et al. [47]. The existence of fractures is the main factor affecting the uniaxial compressive strength and failure characteristics of the rock. A linear decrease in the uniaxial compression strength of syenogranite specimens is observed as the crack inclination increased, which is consistent with the conclusions of Zhao et al. [36] and Wang et al. [28]. However, further study in this paper shows that the received charge-induction signal amplitude and correlation between signals are different in each stage of deformation and fracture process of fractured syenogranite, and the influence of crack inclination on the charge-induction signal amplitude and correlation is also different. There is a certain correlation between the position of the charge signal generated in the deformation and fracture process of syenogranite and the crack dip angle. Near the crack, there are many events and a large amount of energy of the charge-induction signal, and signal amplitude during charge induction along the crack dip direction is relatively large. The syenogranite specimen has a relatively large value, medium correlation, or even high correlation charge-induction signal in the phase of rack propagation, which can make an early warning of the deformation and failure risk of syenogranite; in the instability-failure phase, when a large value and high correlation charge-induction signal is generated, it indicates that syenogranite has entered the instability-failure phase, which is of high risk. The charge-induction method can predict the occurrence of shock danger, but it is still in the experimental stage, and the charge-induction prediction technology needs to be continuously verified and improved in the field, so as to provide reliable technical support for noncontact prediction and prediction of rock dynamic disasters such as tunnel-engineering stability, slope instability, and earthquake.

5. Summary

The charge-induction monitoring test system for rock deformation and fracture process is used to monitor the charge-induction signal for the deformation as well as the fracture process of syenogranite with various dip cracks, and the time-frequency features of the charge-induction signal of syenogranite with cracks are analyzed. The following are the primary conclusions:
(1)
The influence of crack on the strength of syenogranite is significant. The uniaxial compression strength of specimens with a crack is greatly reduced, and the strain at failure is also significantly reduced. The uniaxial compression strength of syenogranite decreases linearly with the increase of crack inclination;
(2)
Signals caused by charge induction that were produced in the deformation as well as fracture of intact syenogranite are more abundant than those of crack syenogranite, and the number of charge-induction signal events is more. The signal amplitude during charge induction and the correlation between the signals are different in every phase of the deformation and fracture process of syenogranite, and the influence of the crack inclination on the amplitude and the correlation is also different;
(3)
The location of the charge-induction signal produced by the distortion, as well as the fracture process, of syenogranite has a certain correlation with the crack inclination. Around the crack, the charge-induction signal events with high energy are numerous, and the amplitude is relatively large along the crack inclination direction;
(4)
In the phase of rack propagation, there are large-amplitude, medium-correlation, and even high-correlation signals associated with charge induction, which can give an early warning of the deformation failure of the syenogranite. In the instability-failure phase, when the large-amplitude and high-correlation signals associated with charge induction are generated, it means that the syenogranite has entered the instability-failure phase and has a high risk;
(5)
From the elastic linear-deformation phase to the instability-failure phase, the amplitude and power values of the signals associated with charge induction gradually increase in every frequency band and reach the maximum value in the instability-failure phase. In the instability-failure phase, the charge-induction signal frequency band is distributed in 0–400 Hz, which is different from the other two phases, and the main frequencies are 10–15 Hz. With the increase of the crack inclination, the power of the charge-induction signal increases.

Author Contributions

Conceptualization, Y.Z.; methodology, Y.Z.; validation, L.D.; formal analysis, Y.L., L.D. and Y.Z.; investigation, L.D.; Data curation, L.D.; writing—original draft preparation, Y.L. and Y.Z.; writing—review and editing, Y.L. and L.D.; supervision, L.D.; project administration, Y.Z.; funding acquisition, Y.Z. All authors have read and agreed to the published version of the manuscript.

Funding

This research was funded by [National Natural Science Foundation of China] grant number [52074142, 51274114 and 51974150] and [Liaoning Province Natural Science Foundation] grant number [2022-MS-401].

Data Availability Statement

The data that support the findings of this study are available from the corresponding author upon reasonable request.

Acknowledgments

Acknowledgments are made to the General Programs of the National Natural Science Foundation of China, Liaoning Province Natural Science Foundation.

Conflicts of Interest

The authors declare no conflict of interest.

References

  1. Pan, Y.S.; Wang, L.G.; Zhang, M.T. Theoretical and experimental study on the occurrence of fault rockburst. Chin. J. Rock Mech. Eng. 1998, 17, 642–649. [Google Scholar]
  2. Zhao, Y.F.; Pan, Y.S.; Yu, H.J. Analysis of fault rockburst based on shear beam model for interface failure. Rock Soil Mech. 2007, 28, 1571–1576. [Google Scholar]
  3. Huang, L.C.; Ma, J.J.; Lei, M.F. Soil-water inrush induced shield tunnel lining damage and its stabilization: A case study. Tunn. Undergr. Space Technol. 2020, 97, 103290. [Google Scholar] [CrossRef]
  4. Ma, J.J.; Chen, J.J.; Guan, J.W. Implementation of Johnson-Holmquist-Beissel model in four-dimensional lattice spring model and its application in projectile penetration. Int. J. Impact Eng. 2022, 170, 104340. [Google Scholar] [CrossRef]
  5. Kuksenko, V.S.; Makhmudov, K.F. Mechanically-induced electrical effects in natural dielectrics. Tech. Phys. Lett. 1997, 23, 126–127. [Google Scholar] [CrossRef]
  6. Kuksenko, V.S.; Makhmudov, K.h.F.; Ponomarev, A.V. Relaxation of electric fields induced by mechanical loading in natural dielectrics. Phys. Solid State 1997, 39, 1065–1066. [Google Scholar] [CrossRef]
  7. Guo, Z.Q.; Zhou, D.Z.; Shi, X.J. Electron emission during rock fracture. Chin. J. Geophys. 1988, 31, 566–571. [Google Scholar]
  8. Guo, Z.Q.; Liu, B. Frequency properties of electromagnetic emission associated with microscopic cracking in rocks. Chin. J. Geophys. 1995, 38, 221–226. [Google Scholar]
  9. Sun, Z.J.; Wang, L.H.; Gao, H. Electromagnetic emission and light radiation during fracture of rock samples. Chin. J. Geophys. 1986, 29, 491–495. [Google Scholar]
  10. Zhu, Y.Q.; Guo, X.L.; Guo, Z.Q. A study of mechanism on electromagnetic emission associated with rock fracture. Chin. J. Geophys. 1991, 34, 594–601. [Google Scholar]
  11. Wu, X.P.; Shi, X.J.; Guo, Z.Q. Study of the electrification of granite samples under compression. Chin. J. Geophys. 1990, 33, 208–211. [Google Scholar]
  12. Hao, J.Q.; Liu, L.Q.; Long, H.L. New result of the experiment on self-potential change of rocks under biaxial compression. Chin. J. Geophys. 2004, 47, 475–482. [Google Scholar] [CrossRef]
  13. Hao, J.Q.; Qian, S.Q.; Gao, J.T. ULF electric and magnetic anomalies accompanying the cracking of rock sample. Acta Seismol. Sin. 2003, 25, 102–111. [Google Scholar] [CrossRef]
  14. Zhao, Y.F.; Pan, Y.S.; Li, G.Z. Measuring of the charge-induced signal of rock during the deformation and fracture process. J. Disaster Prev. Mitig. Eng. 2010, 30, 252–256. [Google Scholar]
  15. Zhao, Y.F.; Pan, Y.S.; Liu, Y.C. Experimental study of charge induction of coal samples under uniaxial compression. Chin. J. Rock Mech. Eng. 2011, 30, 306–312. [Google Scholar]
  16. Pan, Y.S.; Zhao, Y.F.; Li, G.Z. Charge-induced technique of predicting rock burst and its application. Chin. J. Rock Mech. Eng. 2012, 31, 3988–3993. [Google Scholar]
  17. Pan, Y.S.; Tang, Z.; Li, Z.H. Research on the charge inducing regularity of coal rock at different loading rate in uniaxial compression tests. Chin. J. Geophys. 2013, 56, 1043–1048. [Google Scholar]
  18. Pan, Y.S.; Tang, Z.; Xiao, X.C. Experimental study on mechanical-charge induction law of coal containing gas under triaxial compression. J. China Coal Soc. 2012, 37, 918–922. [Google Scholar]
  19. Pan, Y.S.; Tang, Z.; Luo, H. Study of charge induction law of coal and rock mass during tensile instability and failure. Chin. J. Rock Mech. Eng. 2013, 32, 1297–1303. [Google Scholar]
  20. Pan, Y.S.; Zhao, Y.F.; Luo, H. Application of charge induction monitoring technology of mine dynamic disaster. Coal Sci. Technol. 2013, 41, 29–34. [Google Scholar]
  21. Yang, Y.L.; Li, Z.H.; Wang, E.Y. Experiment study on surface potential characteristics and rules during coal or rock friction process. J. China Coal Soc. 2013, 38, 215–220. [Google Scholar]
  22. Liu, Y.J.; Li, Z.H.; Song, D.Z. Experimental research on surface potential induced by gas sorption process in coal. J. China Coal Soc. 2013, 38, 1977–1981. [Google Scholar]
  23. Kong, Y.H.; Li, Z.H.; Qiu, L.M. Research on variation rule of coal rock during water-inrush process. J. Mine Autom. 2017, 46, 38–42. [Google Scholar]
  24. Zhang, X.H.; Li, Z.H.; Niu, Y. Experimental study on electric potential critical slowing down characteristics before unstable failure of roof rocks. J. Mine Autom. 2018, 44, 26–31. [Google Scholar]
  25. Liu, J.; Wang, E.Y.; Li, Z.H. Experimental study on surface potential of pre-cracked coal under uniaxial compression. J. China Coal Soc. 2011, 36, 1135–1138. [Google Scholar]
  26. Ren, X.K.; Wang, E.Y.; Li, Z.H. Experimental study of characteristics of surface potential and electromagnetic radiation of pre-cracked rock plate during fracture. J. China Univ. Min. Technol. 2016, 45, 440–446. [Google Scholar]
  27. Wang, G.; Pan, Y.S.; Xiao, X.C. Detection of effects of rock burst prevention by water injection into coal seam using charge induction method. Chin. J. Geotech. Eng. 2019, 41, 311–319. [Google Scholar]
  28. Wang, G.; Pan, Y.S.; Xiao, X.C. Experimental study on the failure characteristics and charge law of coal samples with large scale single pre-crack. J. China Coal Soc. 2018, 43, 2187–2195. [Google Scholar]
  29. Xiao, X.C.; Pan, Y.S.; Ding, X. Experiment of acoustic emission and charge induction in granular coal rock failure. J. China Coal Soc. 2015, 40, 1796–1804. [Google Scholar]
  30. Feng, G.; Wang, X.C.; Wang, M. Experimental investigation of thermal cycling on fracture characteristics of granite in a geothermal-energy reservoir. Eng. Fract. Mech. 2020, 235, 107180. [Google Scholar] [CrossRef]
  31. Feng, G.; Wang, X.C.; Kang, Y. Effect of thermal cycling-dependent cracks on physical and mechanical properties of granite for enhanced geothermal system. Int. J. Rock Mech. Min. Sci. 2020, 134, 104476. [Google Scholar] [CrossRef]
  32. Feng, G.; Zhu, C.; Wang, X.C. Thermal effects on prediction accuracy of dense granite mechanical behaviors using modified maximum tangential stress criterion. J. Rock Mech. Geotech. Eng. 2023, in press. [CrossRef]
  33. Ma, J.J.; Chen, J.J.; Chen, W.X. A coupled thermal-elastic-plastic-damage model for concrete subjected to dynamic loading. Int. J. Plast. 2022, 153, 103279. [Google Scholar] [CrossRef]
  34. Luo, H.; Pan, Y.S.; Yu, J.K. Electric charge induction law of coal rock containing gas with bursting tendency during loading failure process. J. China Coal Soc. 2020, 45, 684–694. [Google Scholar]
  35. Zhao, Y.F.; Jing, G.; Li, B. Charge signal time-frequency characteristics of granite under uniaxial compression. Coal Sci. Technol. 2021, 49, 47–53. [Google Scholar]
  36. Zhao, Y.F.; Jing, G.; Li, B. Tests for fracture characteristics of fractured sandstone and microseismic and charge induced signal laws. J. Vib. Shock 2020, 39, 211–219+233. [Google Scholar]
  37. Zhao, Y.F.; Jing, G.; Fan, Y. Experimental study on the microseism and charge signal time-frequency characteristics in the process of fault stick-slip instability. Chin. J. Rock Mech. Eng. 2020, 39, 1385–1395. [Google Scholar]
  38. Li, D.X.; Wang, E.Y.; Yue, J.H. A weak current technique for coal and rock dynamic disaster prediction and its application. Chin. J. Rock Mech. Eng. 2022, 41, 764–774. [Google Scholar]
  39. Li, F.H.; Ren, H.F.; Wang, J.Q. An Overview of Fault Rockburst in Coal Mines. IOP Conf. Ser. Earth Environ. Sci. 2018, 199, 052039. [Google Scholar] [CrossRef]
  40. Cheng, T.; He, M.C.; Li, H.R. Experimental investigation on the influence of a single structural plane on rockburst. Tunn. Undergr. Space Technol. Inc. Trenchless Technol. Res. 2023, 132, 104914. [Google Scholar] [CrossRef]
  41. Dou, L.M.; Mu, Z.L.; Li, Z.L. Research progress of monitoring, forecasting, and prevention of rockburst in underground coal mining in China. Int. J. Coal Sci. Technol. 2014, 1, 278–288. [Google Scholar] [CrossRef] [Green Version]
  42. Pamnani, G.; Bhattacharya, S.; Sanyal, S. Analysis of interface crack in piezoelectric materials using extended finite element method. Mech. Adv. Mater. Struct. 2019, 26, 1447–1457. [Google Scholar] [CrossRef]
  43. Pamnani, G.; Bhattacharya, S.; Sanyal, S. Analysis of semipermeable crack growth in piezoelectric materials using extended finite element method. Int. J. Appl. Mech. 2017, 9, 1750106. [Google Scholar] [CrossRef]
  44. Yue, Y.; Wan, Y. Parametric design of multilayered piezoelectric/piezomagnetic transducers with periodic interfacial electrodes based on fracture mechanics analysis. Mech. Adv. Mater. Struct. 2020, 28, 2131–2140. [Google Scholar] [CrossRef]
  45. Soletta, J.; Farfan, F.; Felice, C. Measuring Spike Train Correlation with Non-Parametric Statistics Coefficient. IEEE Lat. Am. Trans. 2016, 13, 3743–3746. [Google Scholar] [CrossRef]
  46. Huang, N.E.; Shen, Z.; Long, S.R. The empirical mode decomposition and the Hilbert spectrum for nonlinear and non-stationary time series analysis. Proc. A 1998, 454, 903–995. [Google Scholar] [CrossRef]
  47. Xiao, X.C.; Ding, X.; Lu, X.F. Investigation on charge signal time-frequency domain characteristics in coal failure process and noise reduction. J. China Coal Soc. 2018, 43, 657–666. [Google Scholar]
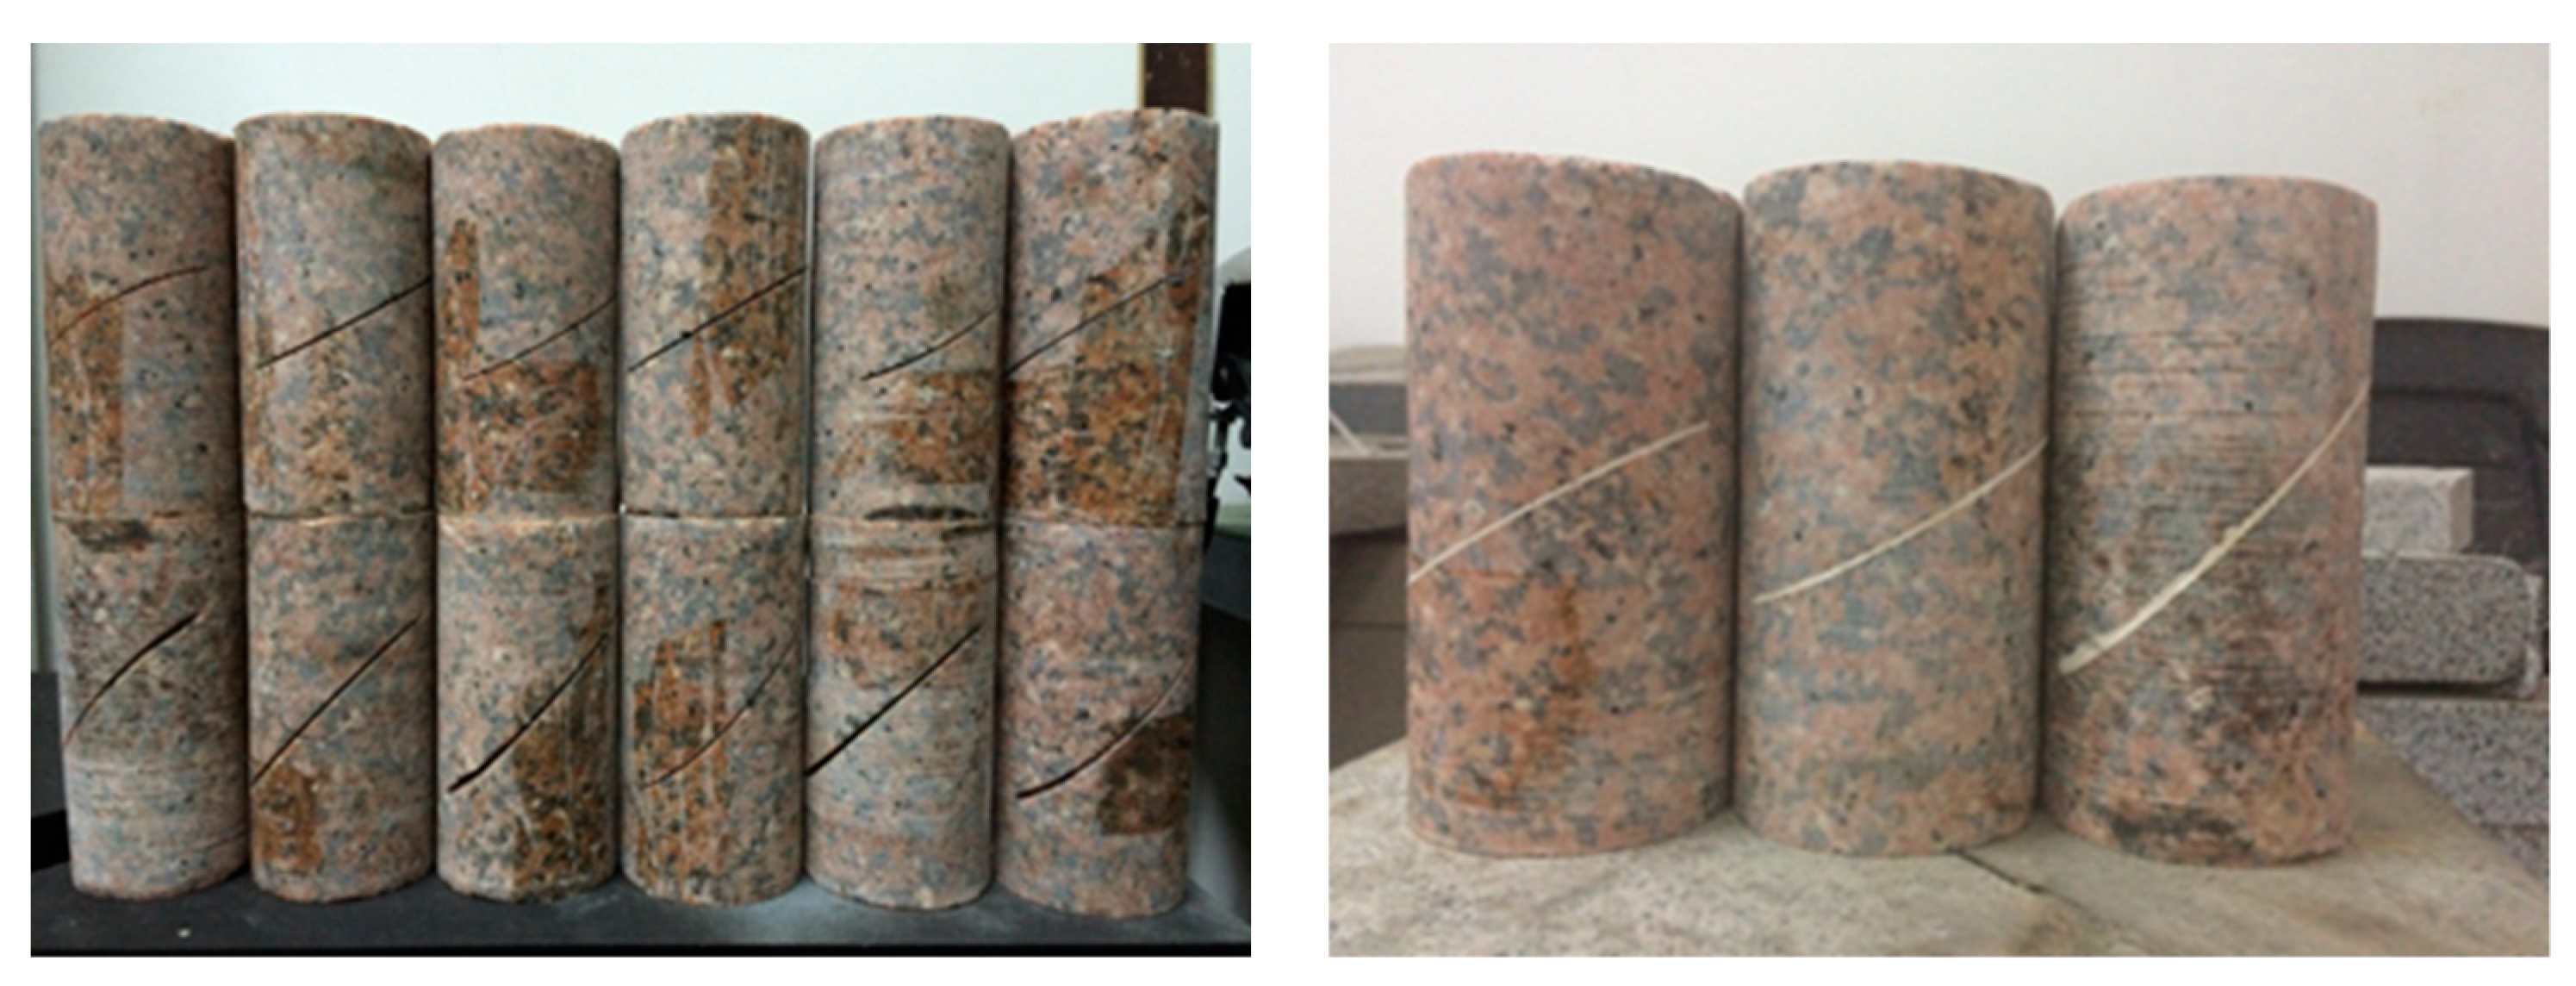
Figure 1. A final view of the precached specimens with varying angles of precrack inclination.
Sustainability 15 09482 g001
Figure 2. An illustration of the physical characteristics of the experimental system.
Sustainability 15 09482 g002
Figure 3. The charge sensor diagrammatic sketch of precrack specimens. (a) The specimen with a crack dip direction of 30°. (b) The specimen with a crack dip direction of 60°.
Sustainability 15 09482 g003
Figure 4. Stress-strain curves of precracked syenogranite.
Sustainability 15 09482 g004
Figure 5. The relationship curve between compression strength and crack-inclination angles.
Sustainability 15 09482 g005
Figure 6. Syenogranite stress and charge-induction signals evolution curve (no crack). (a) Charge-induction signals received by charge sensor 1. (b) Charge-induction signals received by charge sensor 2. (c) Charge-induction signals received by charge sensor 3.
Sustainability 15 09482 g006
Figure 7. Syenogranite stress and charge-induction signals evolution curve (30° crack). (a) Charge-induction signals received by charge sensor 1. (b) Charge-induction signals received by charge sensor 2. (c) Charge-induction signals received by charge sensor 3.
Sustainability 15 09482 g007
Figure 8. Syenogranite stress and charge-induction signals evolution curve (45° crack). (a) Charge-induction signals received by charge sensor 1. (b) Charge-induction signals received by charge sensor 2. (c) Charge-induction signals received by charge sensor 3.
Sustainability 15 09482 g008
Figure 9. Syenogranite stress and charge-induction signals evolution curve (60° crack). (a) Charge-induction signals received by charge sensor 1. (b) Charge-induction signals received by charge sensor 2. (c) Charge-induction signals received by charge sensor 3.
Sustainability 15 09482 g009
Figure 10. Correlation curve between charge-induction signals of syenogranite (no crack). (a) Correlation coefficients of signals associated with charge induction 1 and 2. (b) Correlation coefficients of signals associated with charge induction 2 and 3.
Sustainability 15 09482 g010
Figure 11. Correlation curve between charge-induction signals of syenogranite (30° crack). (a) Correlation coefficients of signals associated with charge induction 1 and 2. (b) Correlation coefficients of signals associated with charge induction 2 and 3.
Sustainability 15 09482 g011
Figure 12. Correlation curve between charge-induction signals of syenogranite (45° crack). (a) Correlation coefficients of signals associated with charge induction 1 and 2. (b) Correlation coefficients of signals associated with charge induction 2 and 3.
Sustainability 15 09482 g012
Figure 13. Correlation curve between charge-induction signals of syenogranite (60° crack). (a) Correlation coefficients of signals associated with charge induction 1 and 2. (b) Correlation coefficients of signals associated with charge induction 2 and 3.
Sustainability 15 09482 g013
Figure 14. Syenogranite stress and charge-induction signals evolution curves (no crack). (a) phase of deformation due to linear elastic forces. (b) phase of racking propagation. (c) instability-failure phase.
Sustainability 15 09482 g014
Figure 15. Syenogranite stress and charge-induction signals evolution curves (30° crack). (a) phase of deformation due to linear elastic forces. (b) phase of racking propagation. (c) instability-failure phase.
Sustainability 15 09482 g015
Figure 16. Syenogranite stress and charge-induction signals evolution curves (60° crack). (a) phase of deformation due to linear elastic forces. (b) phase of racking propagation. (c) instability-failure phase.
Sustainability 15 09482 g016
Figure 17. Charge-induction signals spectrum of syenogranite in different phases (no crack). (a) phase of deformation due to linear elastic forces. (b) phase of racking propagation. (c) instability-failure phase.
Sustainability 15 09482 g017
Figure 18. Charge-induction signals spectrum of syenogranite in different phases (30° crack). (a) phase of deformation due to linear elastic forces. (b) phase of racking propagation. (c) instability-failure phase.
Sustainability 15 09482 g018
Figure 19. Charge-induction signals spectrum of Syenogranite in different phases (60° crack). (a) phase of deformation due to linear elastic forces. (b) phase of racking propagation. (c) instability-failure phase.
Sustainability 15 09482 g019
Figure 20. Domain of time-frequency diagrams of signals associated with charge induction (no crack). (a) phase of deformation due to linear elastic forces. (b) phase of racking propagation. (c) instability-failure phase.
Sustainability 15 09482 g020
Figure 21. Domain of time-frequency diagrams of signals associated with charge induction (30° crack). (a) elastic linear-deformation phase. (b) phase of rack propagation. (c) instability-failure phase.
Sustainability 15 09482 g021
Figure 22. Domain of time-frequency diagrams of signals associated with charge induction (60° crack). (a) phase of deformation due to linear elastic forces. (b) phase of racking propagation. (c) instability-failure phase.
Sustainability 15 09482 g022
Disclaimer/Publisher’s Note: The statements, opinions and data contained in all publications are solely those of the individual author(s) and contributor(s) and not of MDPI and/or the editor(s). MDPI and/or the editor(s) disclaim responsibility for any injury to people or property resulting from any ideas, methods, instructions or products referred to in the content.