Article

Is Loose-Fill Plastic Waste an Opportunity for Thermal Insulation in Cold and Humid Tropical Climates?

by
Bruno Malet-Damour
1,*,†,
Jean-Pierre Habas
2 and
Dimitri Bigot
1
1
PIMENT Laboratory, University of Reunion Island, 97430 Le Tampon, France
2
ICGM, CNRS, ENSCM, University Montpellier, 34293 Montpellier, France
*
Author to whom correspondence should be addressed.
Current address: 120 Avenue Raymond Barre, 97430 Le Tampon, France.
Sustainability 2023, 15(12), 9483; https://doi.org/10.3390/su15129483
Submission received: 16 May 2023 / Revised: 9 June 2023 / Accepted: 10 June 2023 / Published: 13 June 2023
(This article belongs to the Special Issue Waste-to-Wealth: Waste Valorization into Sustainable Materials)

Abstract

:
This paper addresses the plastic waste management challenge by proposing a sustainable solution for the building sector. The proposed solution uses Loose-Fill Plastic Waste (LFPW) as a thermal insulation material, the world’s first in plastic waste recovery. To investigate the potential of this new path, an experimental study was conducted on test cells in Reunion Island’s cold and wet climate. It was revealed that LFPW (size between 3 and 4 mm with 8 cm thickness) can reduce surface temperatures by nearly 3.2 °C, with a maximum difference by almost 22.2 °C. The thermal phase shift is significant (190 mn) and comparable to conventional thermal insulation solutions. The study results suggest that LFPW can provide an effective and economical solution to the challenge of plastic waste management while promoting sustainable development.

1. Introduction

Waste management, especially plastic waste, is becoming an increasingly pressing issue. Global waste production is expected to increase by nearly 70% by 2050, with plastics being a major contributor to this problem [1]. Despite plastics’ low cost and versatility, their long-term stability creates contamination problems, especially in emerging countries where waste disposal is not adequately controlled. The Sustainable Development Goals (SDGs) were established to address this issue, with “Responsible Consumption and Production” identifying solid waste recycling as a top environmental challenge. Although developed countries are making progress, emerging countries need to do more to tackle the problem. One potential solution is to shift from “waste management” to “resource management”.
Several authors have studied the environmental impact of using recycled plastic in building materials. A 2011 study found that using recycled plastic reduced the carbon footprint of insulation boards by 50% [2], while a 2014 study suggested that recycling PET would decrease its negative impacts [3]. Plastic waste has potential and can be used in construction in different ways. One method is to integrate plastic waste as aggregates in composite concrete or mortar, which can improve its resistance to cracking and increase lifespan. However, plastic–cement interactions are weaker than those observed in natural aggregates, and an increase in the proportion of plastic leads to a reduction in mechanical stiffness. Another method is adding plastic fibers to cemented composite materials, improving their mechanical properties. The reduced fiber required in the formulation makes it a low-waste plastic solution. Indeed, the optimum volume fraction is about 1%. Beyond this, the mechanical properties are weakened, and many articles demonstrate this [4,5,6,7], while thermal properties can be improved [8,9]. One method to produce composite concrete involves converting solid plastic into a polymer resin as a binder, mixed with aggregates and sometimes additives. This process is similar to traditional concrete methods, involving vibration, hardening, and molding. Various studies have described techniques for producing liquid resin from plastic waste [10,11,12]. This method can only handle a maximum of 20% of these materials. Beyond that, the results may be less satisfactory than those with a lower ratio [13]. Other studies have explored the potential use of plastic waste as a cement substitute or filler in rubber-modified asphalt [14,15]. Plastic waste can also be transformed (grinding, extrusion, 3D printing) into bricks or blocks using various fillers, although separating the materials during deconstruction is challenging. The interest in this method essentially lies in the notable consumption of plastic waste (60–80% by weight), in the good level of finishing, or, again, in reduced water absorption [16]. Several review articles analyze the limitations and benefits of upgrading plastic waste using actual methods by indicating their important properties [17,18,19,20,21,22,23].
Plastics have long been used as insulation materials in the building industry, with the most common types being expanded polystyrene and extruded polystyrene. However, these materials have a low recycling rate, and their waste is often burned or not reused as insulation [24,25]. Studies have tested ways to reuse plastic waste for insulation, including making panels, fibers, and new materials [2,14,26,27,28,29].
However, these recovery or upcycling routes require additional processing steps and energy consumption [28]. Despite this, all studies agree that adding plastic in any form can improve the thermal performance of the final product.
Insulation materials come in various forms, such as loose fill, roll, rigid or padded board, and foam. The appropriate form and material choice depend on the application and desired physical properties. Cellulose, wood chips, glass fiber, raw hemp fiber, perlite, and hemp shives are commonly studied insulation materials. Loose-fill insulation is easy to implement and provides high thermal resistance due to its low density combined with entrapped air, resulting in low thermal conductivity.
Fungal growth is potentially favored in environments with relative humidity exceeding 90%, which can affect the insulation’s durability and thermal properties and pose health risks [30]. The choice of insulation material should consider the environmental conditions and the risks of fungal development. Plastic waste interacts poorly with other materials, particularly water, which limits fungal growth.
Plastics have favorable properties in Reunion Island’s chilly and wet tropical climate, including low thermal conductivity, durability, and hydrophobicity. These qualities could help address issues such as mold and condensation. Traditional materials such as glass wool, rock wool, and cellulose wadding have poor stability in these conditions. Waste management on the island is a critical issue due to limited space, making waste burial unsustainable and ecologically questionable.
This article presents an innovative approach for valorizing plastic waste as thermal insulation and evaluating its thermal potential in cold tropical climate conditions. Our study stands out by utilizing shredded and bulk plastic waste, which represents a new approach in terms of process and experimental evaluation.
Indeed, while conducting a literature review, we found various technical solutions for valorizing plastic waste, but no case studies specifically focused on its application as bulk thermal insulation. Therefore, our article represents a world-first in plastic waste recovery. This promotes a sustainable circular economy and reduces the environmental impact of the building sector by decreasing reliance on imported materials. After describing our analysis method in detail, we conducted experimental assessments to evaluate the thermal performance of recovered plastic waste in a cold, humid, and high-altitude (1560m) tropical climate. Our data analysis confirms the potential of this technical solution in such a climate.

2. Materials and Methods

The plastics we used were subjected to preliminary processing before being chemically characterized. In this section, we describe in detail these preliminary steps before presenting our experimental method.

2.1. Analysis of the Plastic Wastes Used

The plastic waste used in this study was collected directly from various professionals in the construction sector on Reunion Island. As they came from construction or demolition sites, they were supplied to us in raw form without any prior sorting. They presented very diverse aspects (plates, tubes, profiles, liners, films, or foams); in most cases, no logo or symbol allowed the direct identification of their constituent material. This fact may explain why these plastic elements are generally not recovered after use on Reunion Island. They are part of the waste for which the local outcome has become landfill or export [31].
To optimize our approach in economic terms, we specifically developed a method for valorizing plastic waste to avoid complex preliminary sorting. Instead, we focused on simple cleaning and shredding phases. Our process allows for the utilization of bulk plastic waste, adjusting only the chip size to ensure relative homogeneity of properties over large volumes while maintaining low density for optimal thermal resistance. This flexibility also enables mixing different types of plastics without pre-sorting, facilitating their accessible and sustainable reuse. As a result, we can obtain diverse sources of plastic materials, whether from construction sites or municipal collection bins.
We characterized the chemical nature of our plastic waste collection by analyzing a large and diverse range of samples in the first part of our study. Then, all the wastes were crushed and mixed. The size distribution of the resulting shredded material was evaluated using particle size analysis.

2.1.1. Chemical Analyses

The chemical structure of the different plastic elements was registered before crushing using Fourier transform infrared spectroscopy (FTIR). The analyses were registered on a Spectrum One spectrometer from Perkin Elmer. The apparatus, which included a universal attenuated total reflectance accessory with a ZnSe crystal, enabled direct contact surface analysis of each plastic waste sample. The spectra were registered by varying the wavenumber between 4000 and 650 cm 1 , using 32 scans and 2 cm 1 resolution.

2.1.2. Loose-Fill Material Preparation and Preliminary Analysis

The plastic waste used came from the construction sector (Figure 1) and underwent cleaning before being shredded. First, the materials were rinsed with hot water to remove dirt and residues, then dried in the open air to avoid any trace of moisture. Next, the materials were shredded with a knife mill, and the shredded material was analyzed using a sieving column. This step determined their particle size distributions and sorted the different particle sizes. The fraction retained for the study contained only coarse plastic aggregates (3–4 mm). This particle size allowed for a significant presence of air, which enabled the product to display an apparent density of 0.056 g/cm 3 , compared to nearly 1 for compacted material. This density allowed for a thermal conductivity measured with the FP2C conductimeter ranging from 0.022 to 0.032 W/m.K. These values were compared to several thermal standard insulation materials. Table 1 presents some values demonstrating that the insulating performance of LFPW is close to polyurethane foam with an apparent density closer to twice as large.
It should be noted that the chips were not dusty, and their size was such that they could not be inhaled, thereby eliminating the risk of inhalation. Furthermore, the material’s intended use did not require chemical treatments, thermal degradation, or exposure to direct sunlight. This made it possible to ensure no release of volatile organic compounds (VOCs) or toxic compounds took place. Physical contact with the chips was also limited to the placing or replacement process. Thus, the ceiling contained loose-fill plastic, which posed no more significant health risk than other plastics already used in the building.

2.2. Experiment in Real Weather Conditions

2.2.1. Description of the Test Cells

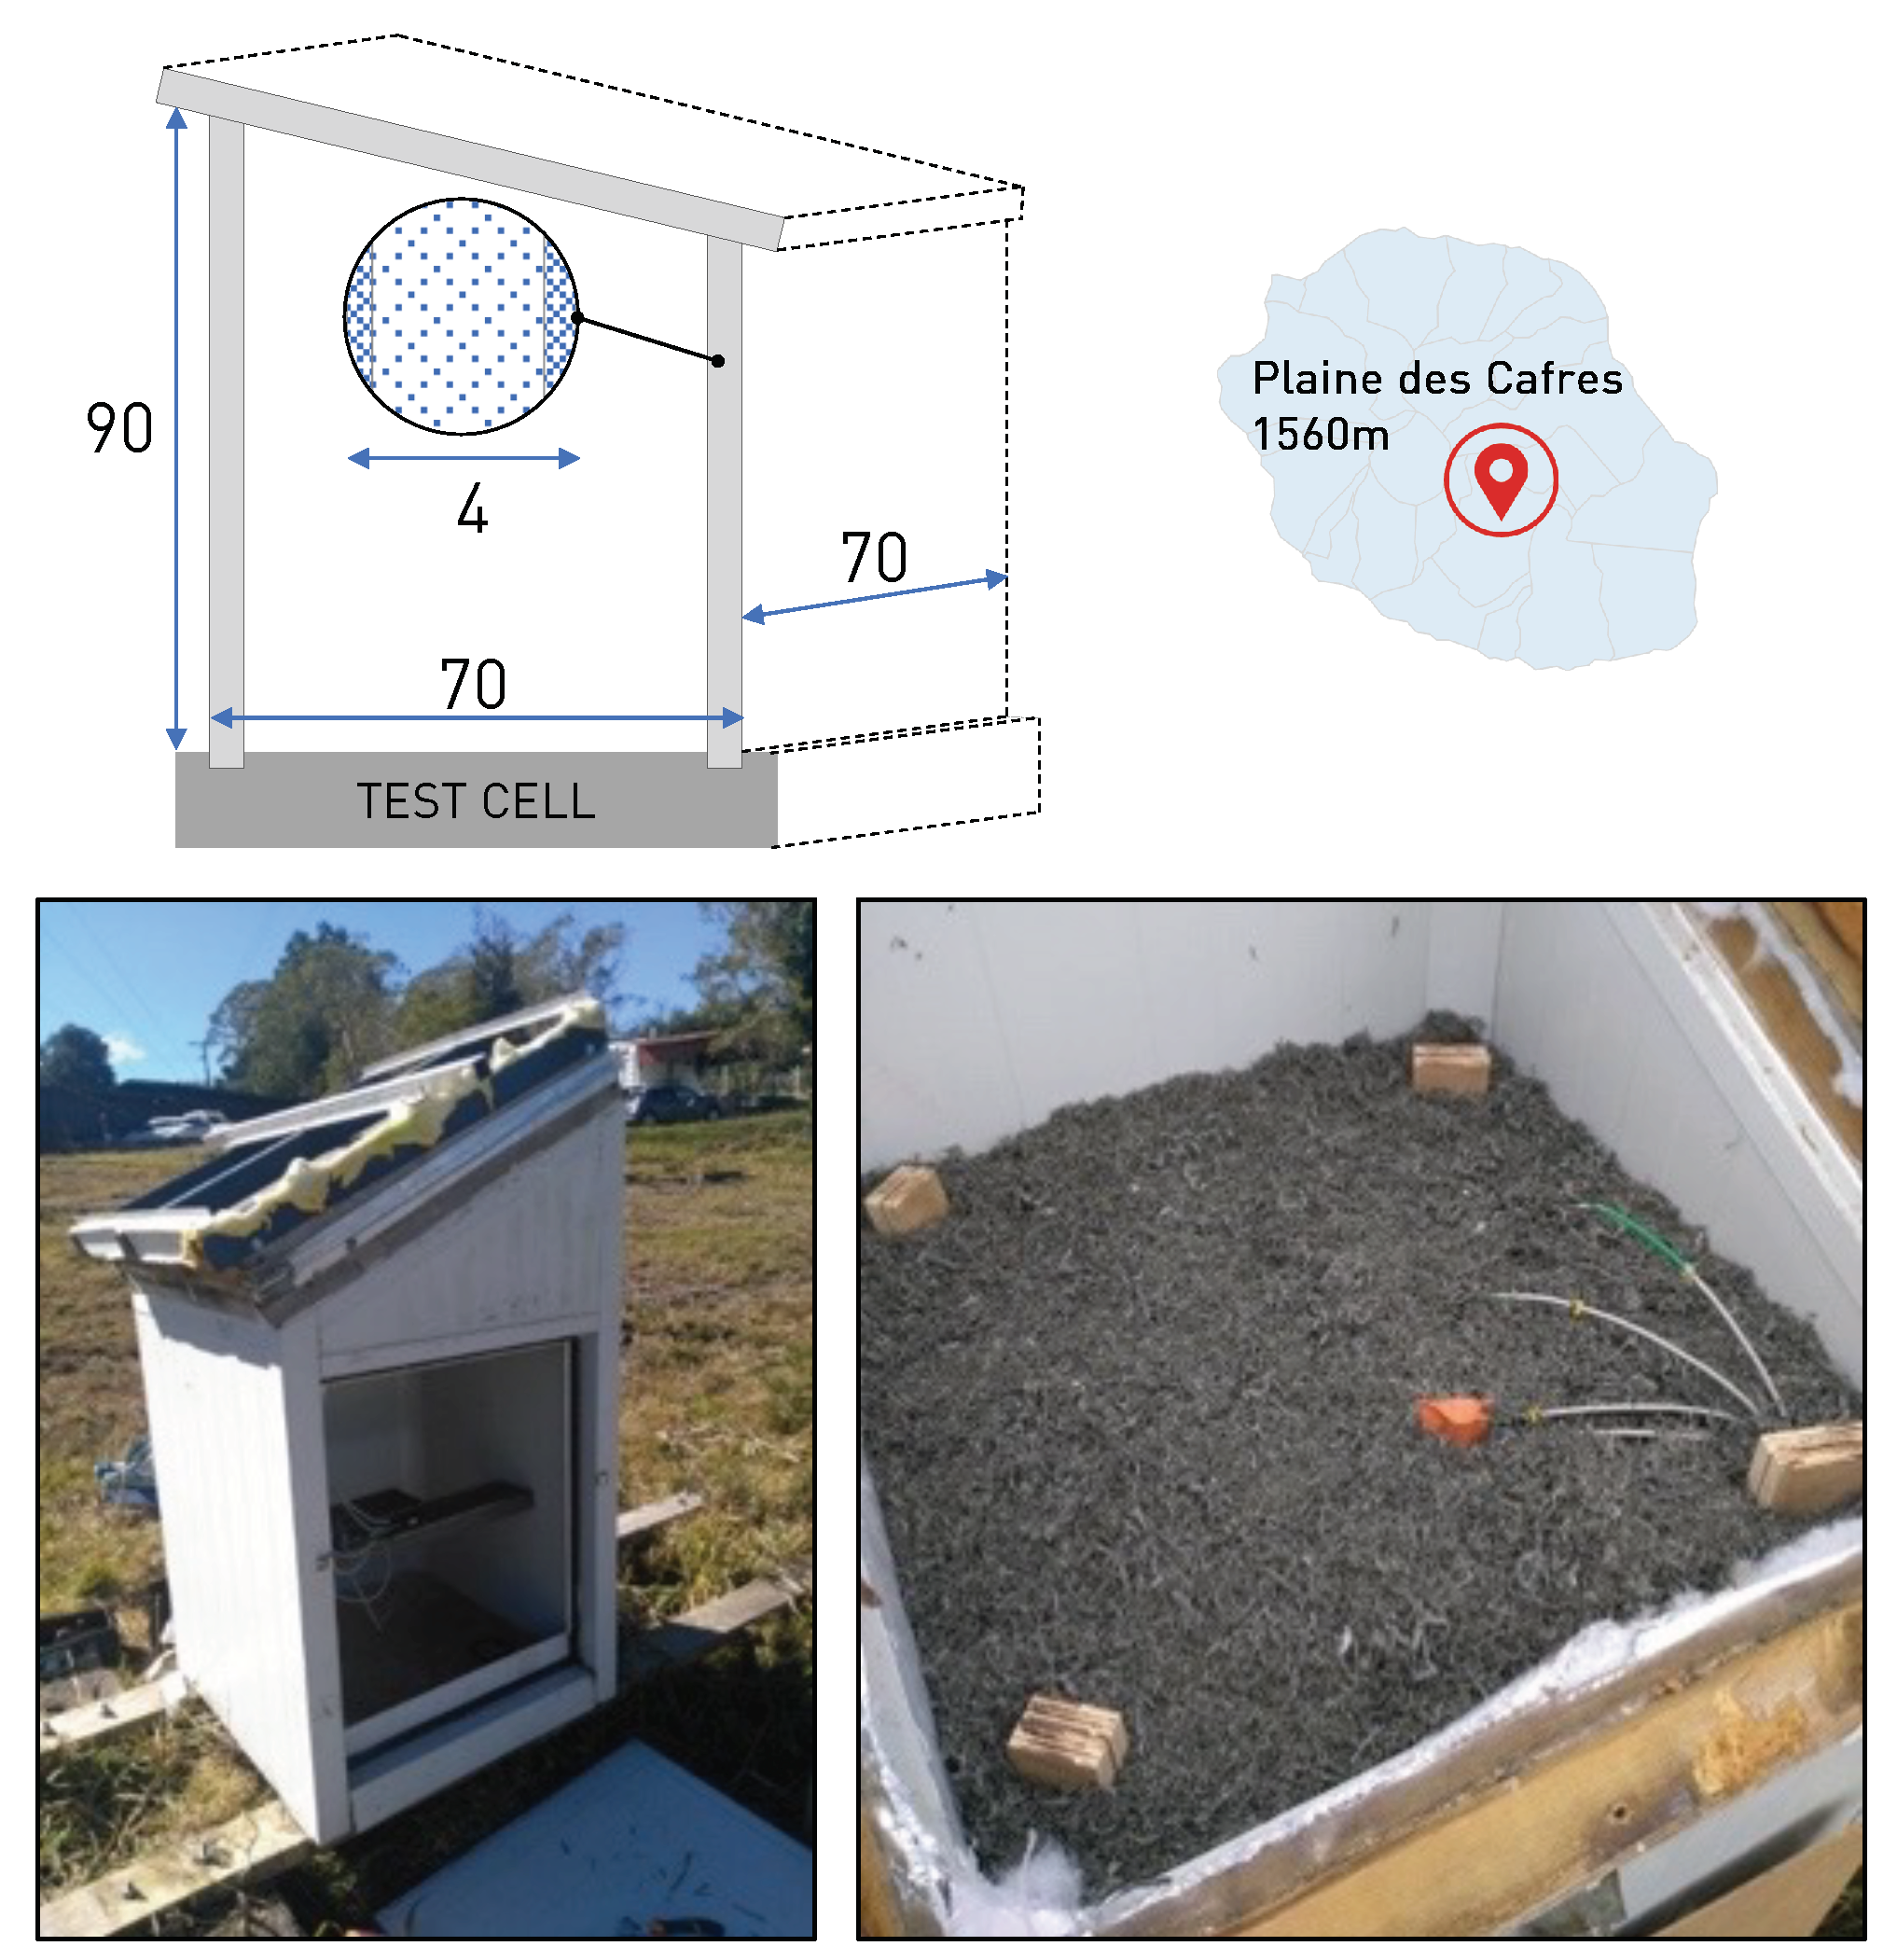
The experimentation was carried out on reduced scale measurement cells, whose dimensions are shown in Figure 2. The test cells were 1:3 scale cells of a full-size cell, representative of a 9 m 2 room (minimum regulatory living area). This configuration allowed us to study the behavior of two cells synchronously: a reference cell (without LFPW) and another equipped with loose-fill plastic waste (LFPW). Finally, the analyses were based on relative data, not absolute. This allowed for the transposition of the case study. The experimental cell aimed to study the thermal behavior of various roofs while minimizing the effects of ground, walls, doors, windows, and air systems. This has been performed in previous works [32,33].
The vertical walls were composed of expanded polyurethane encapsulated in two steel plates, for an overall thickness of 4 cm. The roof was made of a dark blue corrugated sheet. A horizontal wall acted as a ceiling. In the case of the cell equipped with the insulation to be tested, the loose-fill plastic waste was placed on this ceiling. This approach aligns with the methods commonly used for this type of insulation, as a ceiling is typically required to support the loose-fill insulation.
The sandwich panel had three layers (see Figure 3). The lower layer was made of commercial plasterboard, which was 1.3 cm thick. The middle layer was 8 cm of loose-fill plastic waste. The upper layer was a plywood panel that was 4 mm thick. This thin plywood plate was used to guarantee the thickness of the LFPW. It was held on all sides so to as not exert pressure on the loose-fill material. This last plate’s contribution to this wall’s global thermal behavior was neglected in our study. The thickness of the loose-fill plastic layer was chosen arbitrarily. Still, it is consistent with the standard average thickness of thermal insulation commonly used in Reunion Island, which is between 6 and 10 cm.
Different sensors were installed identically on the two cells. For surface and thermal gradient temperatures, we used K-type thermocouples. They were manufactured and calibrated in the laboratory according to a rigorous experimental protocol. The accuracy of these sensors is on the order of 0.5 °C.
The different sensors were positioned as shown in Figure 3. A thermocouple was positioned at the upper surface of the plasterboard ceiling T s , c e i l i n g , R E F for the reference cell and T s , c e i l i n g , L F P W for the tested wall. Three thermocouples were placed at various thicknesses to measure the thermal gradient T g , 1 , T g , 2 , and T g , 3 within the loose-fill plastic layer. This allowed for the measurement of only the thermal behavior of the loose-fill plastic layer. All thermocouples were connected to a multiplexer (AM25T from Campbell Scientific®), which allowed for differentiating each acquisition unit’s channels (CR3000). We also placed Testo® brand stand-alone thermohygrometers (TESTO 175H1) in each of the test cells to measure the air temperatures T a , R E F and T a , L F P W , as well as the relative humidities R H R E F and R H L F P W , throughout the experiment. In parallel, the climatic data were collected from the meteorological station of the site (distance from the cells < 100 m). Météo France owned the site and was responsible for maintaining the facilities and collecting data. This analysis was carried out during 2021. Thus, the outdoor air temperature T a , o u t , relative humidity R H o u t , and global solar radiation G L O o u t were regularly measured throughout the experimental phase. All data were collected at a time step of one minute for test cells and hourly for meteorological data.

2.2.2. Study Climates and Analysis Period

Reunion Island is subject to a humid tropical climate, divided into about forty microclimates due to its very uneven relief due to its volcanic geology. The standardization of these climates made it possible to orient the climatic classification described in the thermal regulation available on the island. The territory is divided into three climatic zones: the low zone (altitude < 400 m), the mid-height zone (400 m < altitude < 600 m), and the high zone (altitude > 600 m). The high-altitude area (1560 m) of La Plaine des Cafres (Le Tampon, France) was the focus of our study. A brief analysis was conducted on this cold and humid climate.
The annual changes in several meteorological parameters (air temperature in °C, relative humidity in %, and global solar radiation in W/m 2 ) are presented in Figure 4. The left-hand column shows the amplitude of the daylight duration. This representation allows us to identify four distinct climatic periods. Period 1 corresponds to summer, with an average temperature of 16.1 °C and a maximum temperature of 25.7 °C. The average relative humidity is 86.6%. Periods 2 and 4 are the inter-seasons, with average temperatures ranging from 11.6 to 14.4 °C. Period 3 corresponds to the winter season, with minimum temperatures close to 2.2 °C and an average of 10.8 °C. The average relative humidity is the highest, at almost 89.1%. The maximum temperature difference between summer and winter does not exceed 5.6 °C. The climate is, therefore, very cool in both summer and winter. Summer is driest, but relative humidity levels remain relatively high. Global solar radiation is low compared to the island’s coastal areas, with a maximum value of 1180 W/m 2 reached during the summer, compared to less than 920 W/m 2 in winter. The period of experimental data acquisition with the cells was spread over two years (2020 and 2021).

2.2.3. Thermal Comfort Analysis Method

The study would not be complete if we did not look at the coupled effect of different measured quantities on a multi-sensory machine such as the human body. To this end, we sought to assess the impact of LFPW on thermal comfort using a cross-analysis of three main indoor environmental parameters of thermal perception: air temperature, relative humidity, and airspeed. When individuals cannot express a need for cooling or heating in a confined environment, they are said to be in a state of thermal neutrality [34]. Their thermoregulatory mechanisms are in a dormant state. Nevertheless, there is a zone where fluctuations in thermal comfort are low. Many authors have used this zone as a basis for their research. It is also known as the “thermal comfort range”.
Givoni’s study [35] is a reference frequently used in the design of tropical buildings. It is a graphical method representing the thermal experience of the person. The “summer diagram,” used for passive activities and light clothing at this time of year in Reunion Island, is based on integrating the physiological phenomena of evapotranspiration. By identifying comfort ranges that can be extended according to airspeed, Givoni established a link between air temperature and relative humidity. The resulting three comfort zones are linked to three airspeeds between 0 and 1 m.s 1 . Beyond this, the air velocities are considered to be a draught. Thus, the strategy suggests a passive building design without any HVAC equipment. The “winter diagram” also identifies three comfort levels for integrating passive heating methods. The first comfort level corresponds to a relative humidity range of 20–80% and a temperature of 19–26 °C. The thermal comfort range can be increased by regulating temperatures with internal loads or passive solar heating. It is also made for sedentary activities, but with a level of clothing adapted to the winter (more than summer).

3. Results and Discussion

In the following, we concomitantly present and discuss the results using the available data.

3.1. FTIR Chemical Analyses

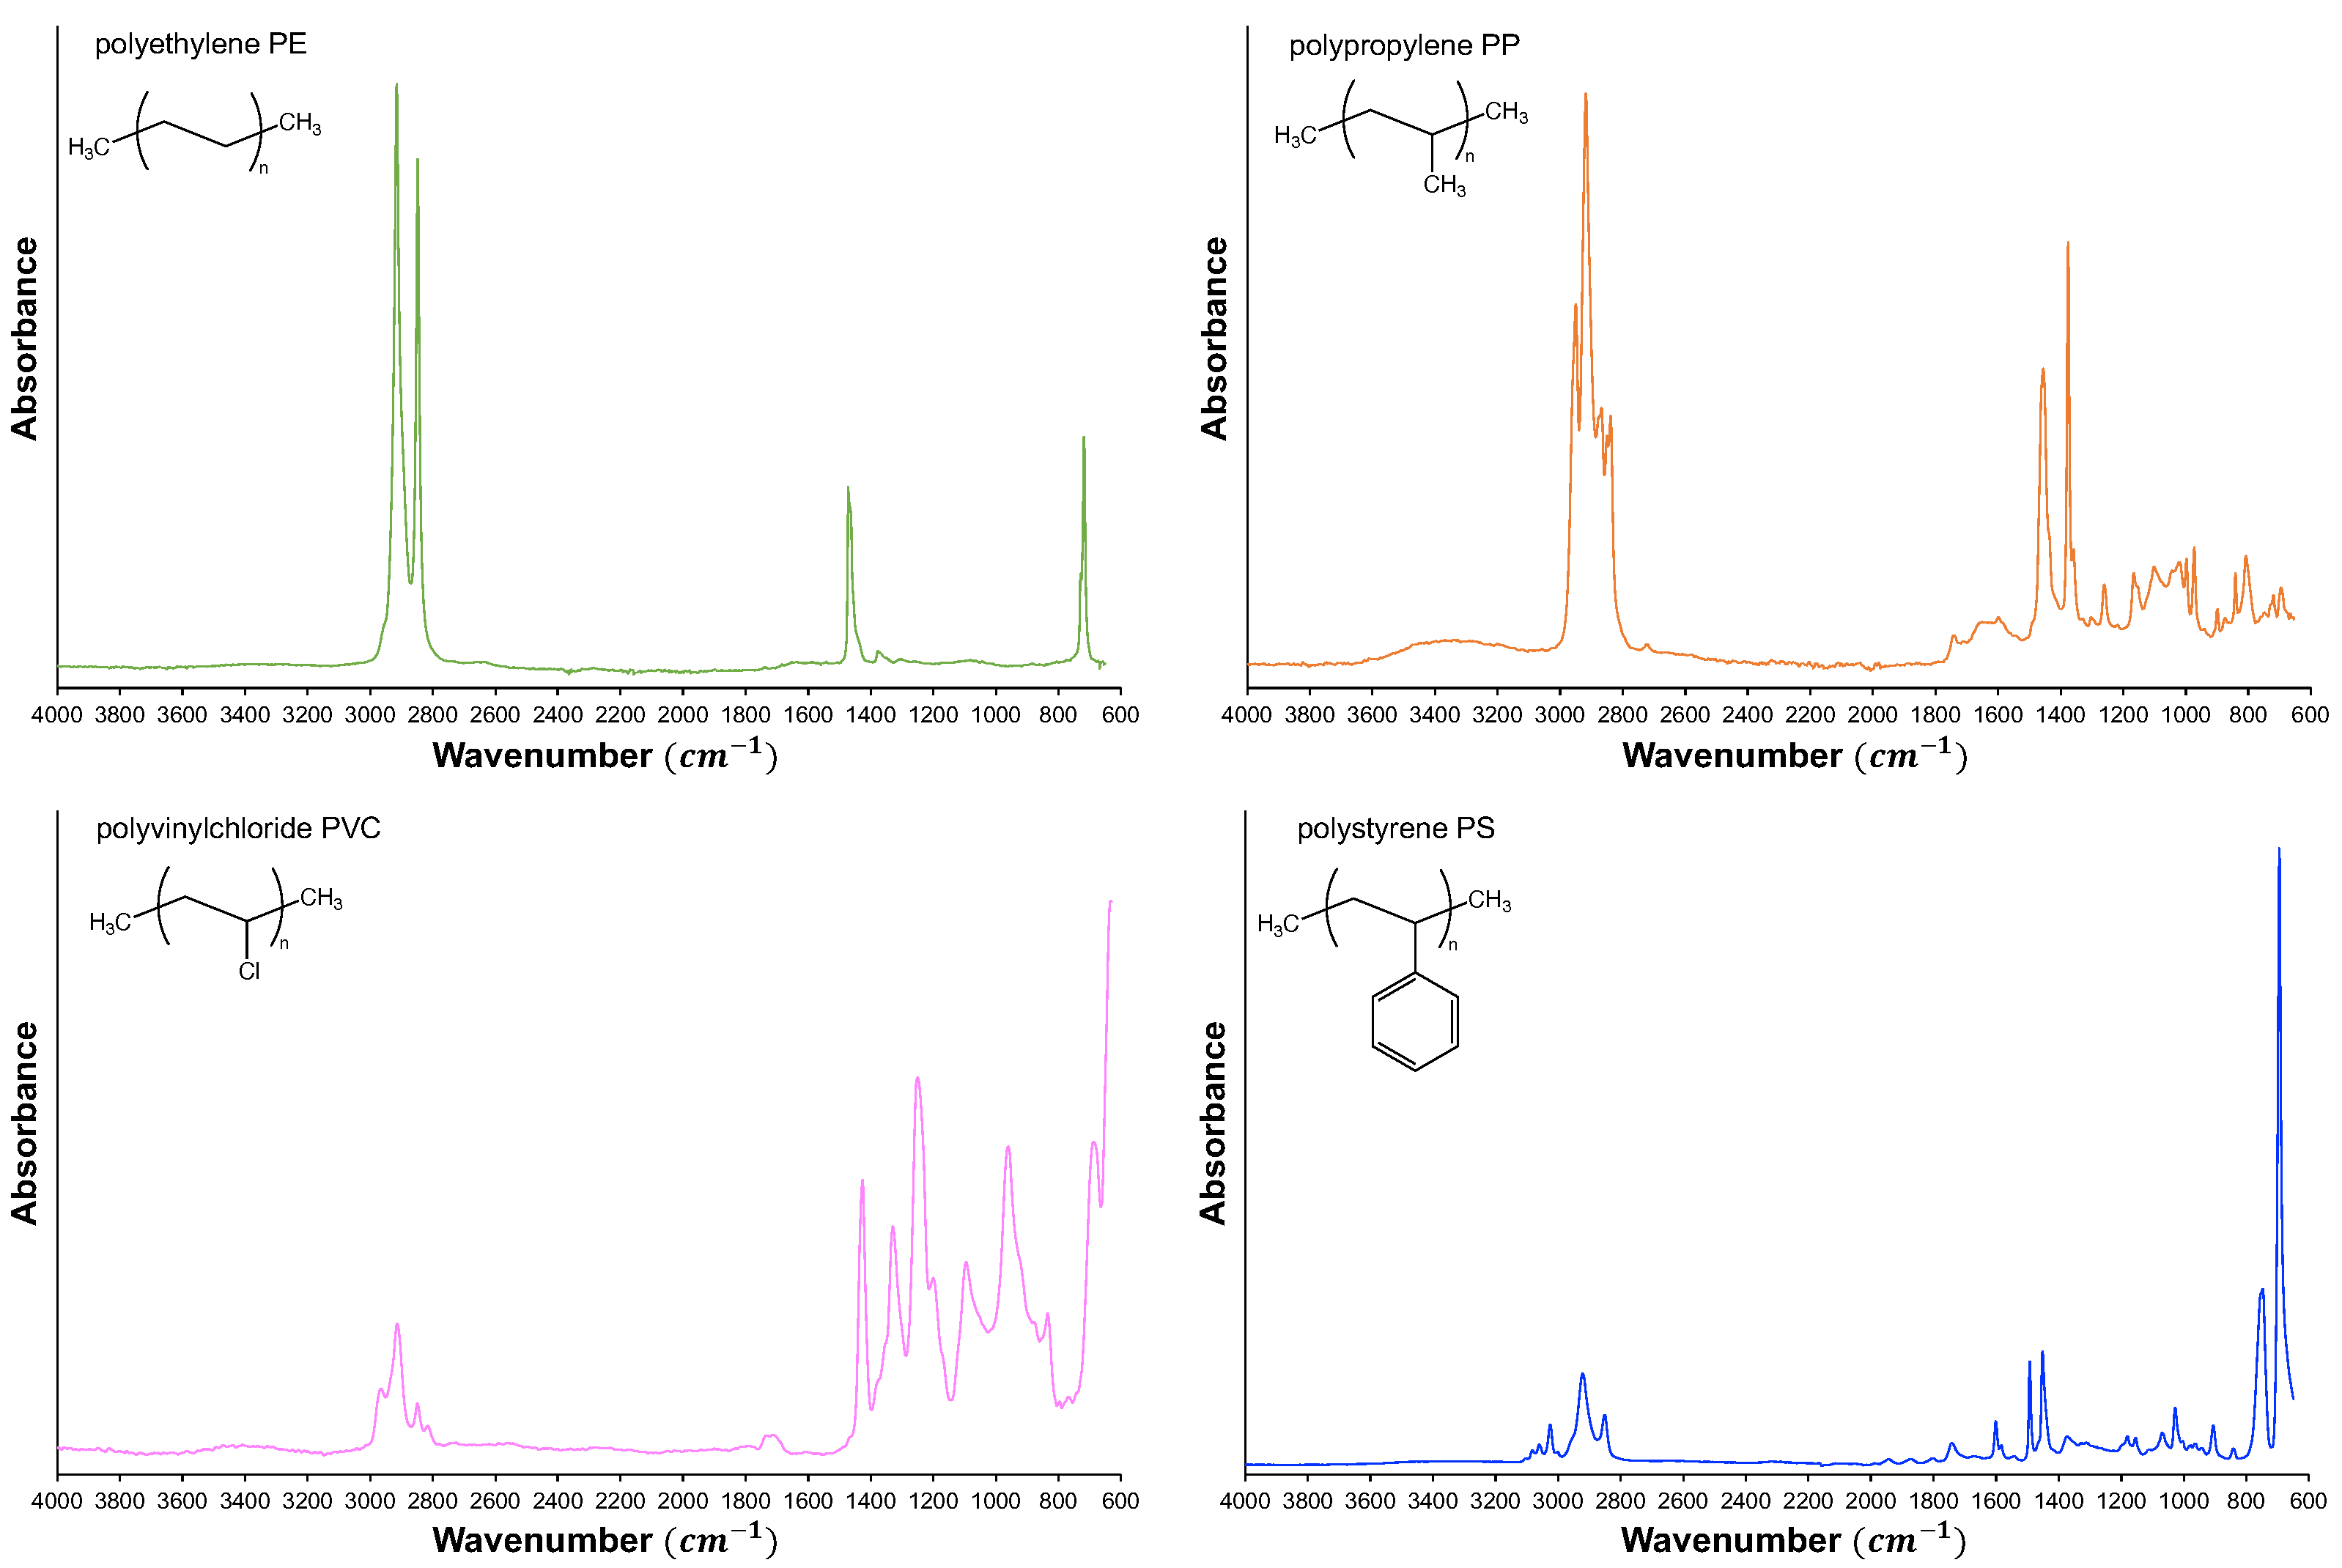
The first experiments analyzed each plastic waste (before the shredding step) to determine its chemical structure. These measurements performed with all samples of our material panel led to the recording of four distinct spectra, as drawn in Figure 5. Their absorbance bands presented in Table 2 could be assigned to specific chemical bonds using libraries of spectral data [36,37]. Their overall analysis allowed the identification of each plastic. The four thermoplastics that were determined this way were polyethylene, polypropylene, polystyrene, and polyvinyl chloride. These four thermoplastics do not contain any chemical groups that may have any affinity with water. In other words, they are known to be hydrophobic.
Some remaining absorbance bands could not be related to chemical groups present in the skeleton of these plastics. They are specific additives (antioxidant, UV stabilizer, organic pigment…) present in these technical grades [38]. Based on these analyses alone, one should also note that it was impossible to differentiate between the two types of polyethylene commonly used in the building sector: high-density polyethylene (HDPE) and low-density polyethylene (LDPE).

3.2. Particule Size Distribution

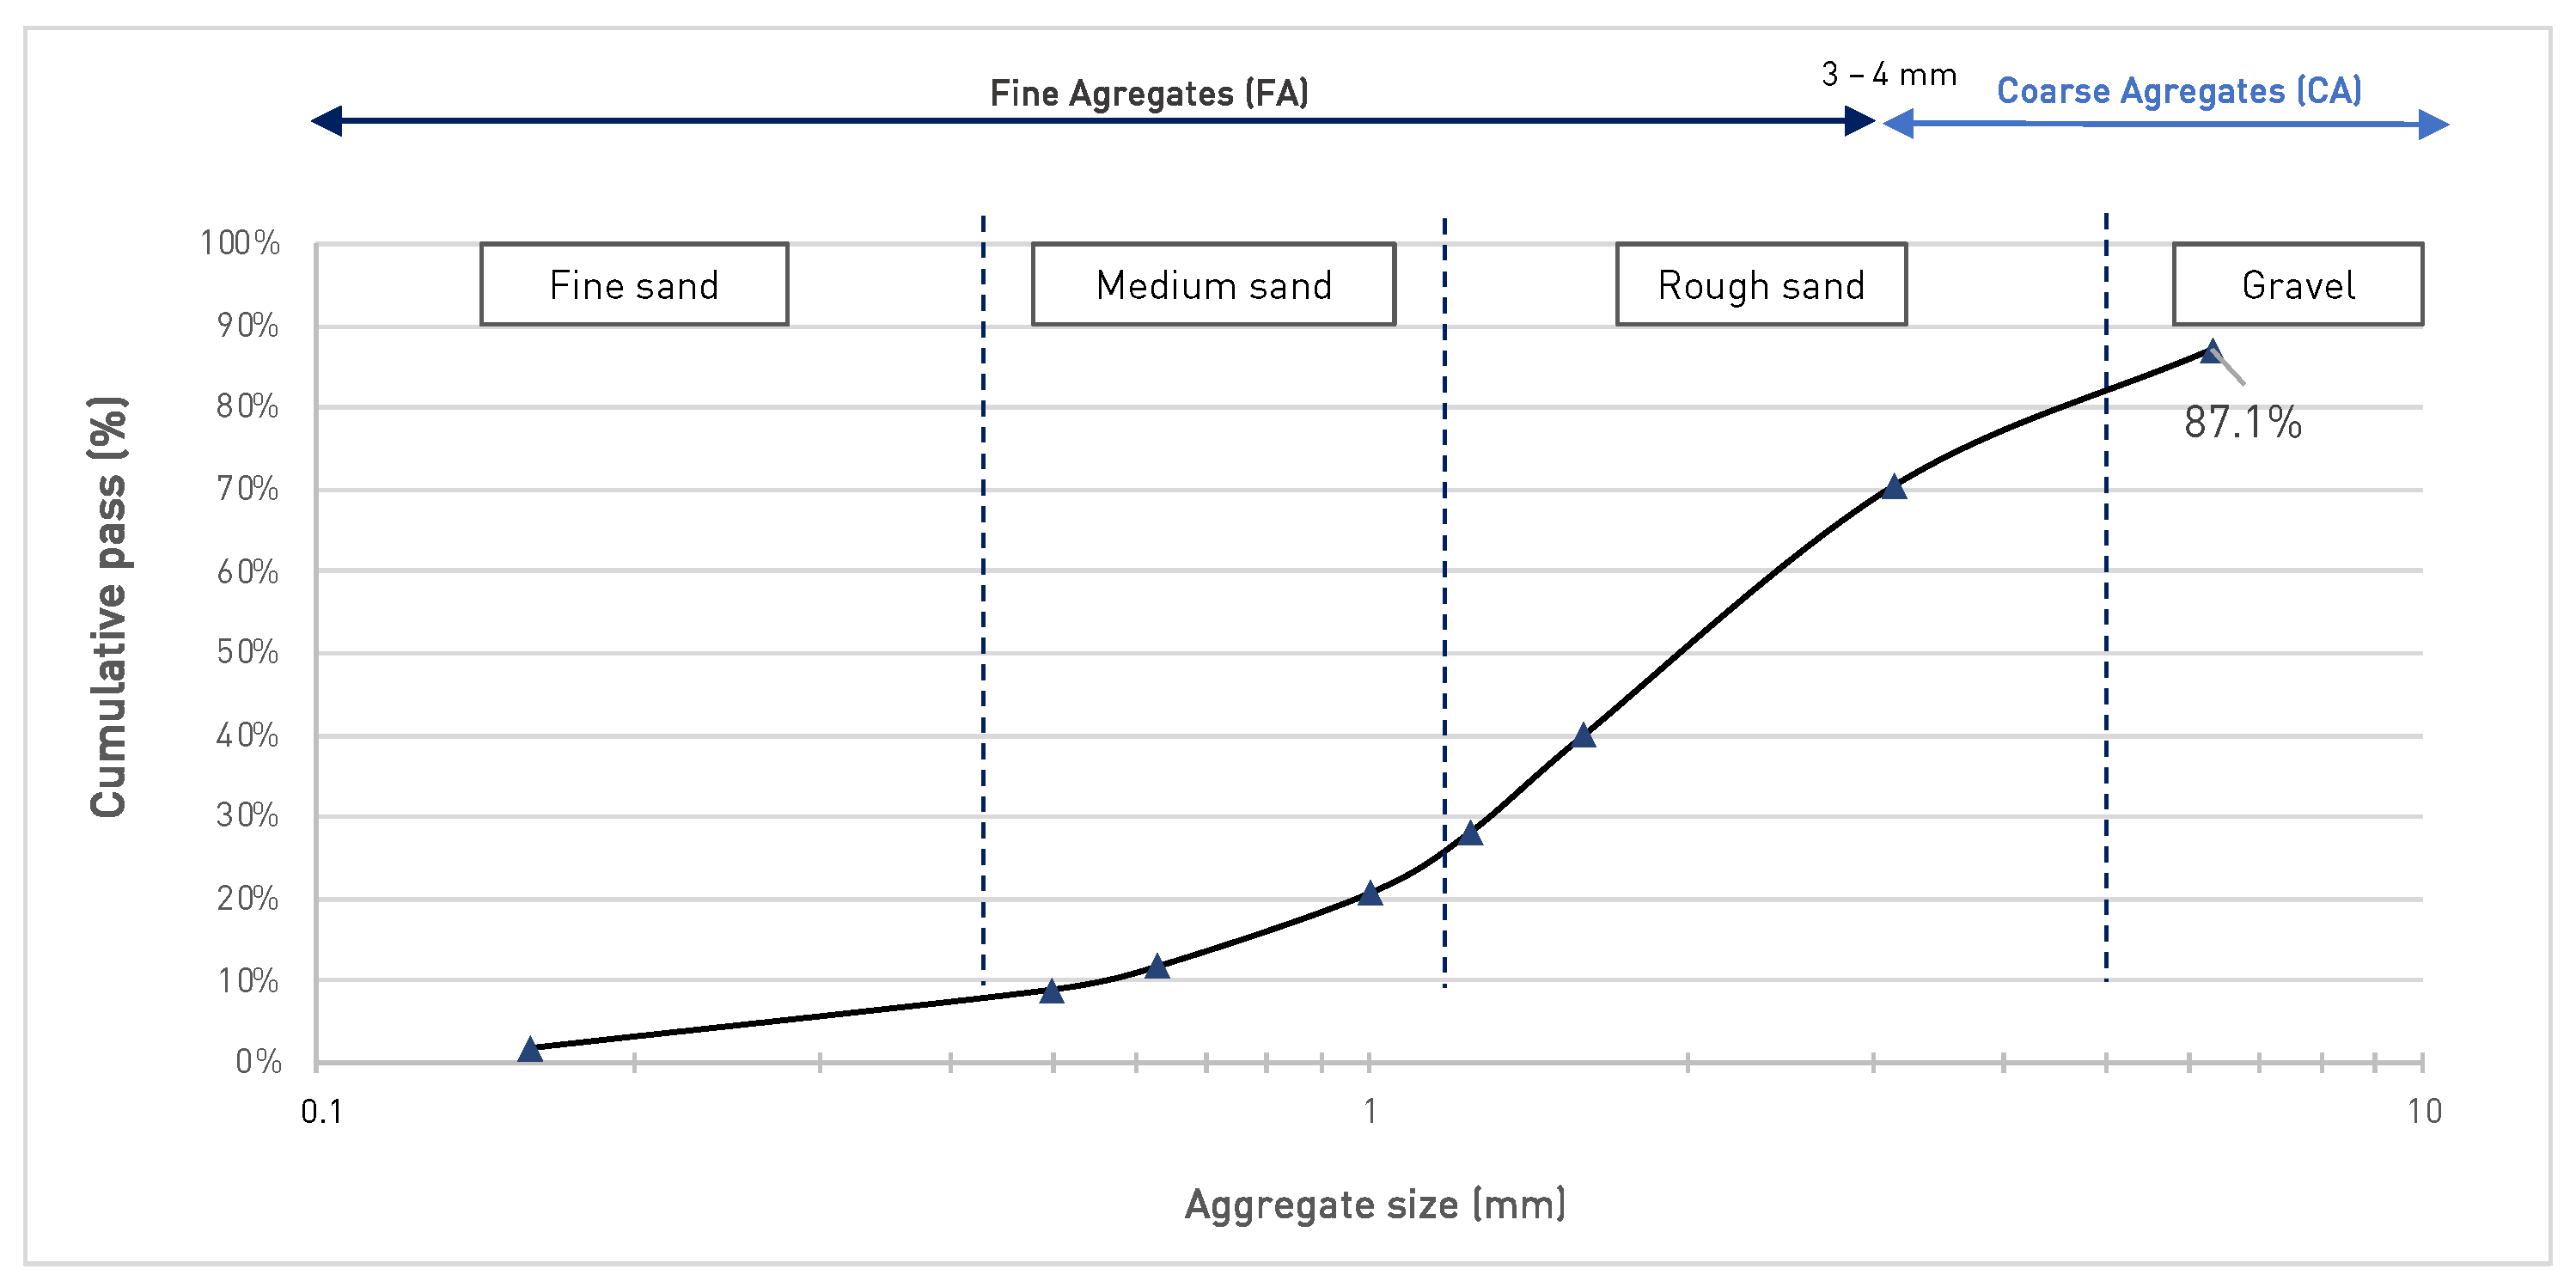
The results of the granulometry analysis can be seen in Figure 6, which shows the weight percentage of aggregates that passed through each of the sieves. According to the ranking used in the literature, 70% of the waste analyzed can be considered as Fine Aggregate (FA), and the remaining 30% as Coarse Aggregate (CA). If we compare with the aggregates usually used for concrete, such granulometry would be represented by coarse sand and regular sand. As stated before in the bibliographic review, using FA in composite concrete often permits higher mechanical properties than that registered with CA. However, regarding the thermal aspect, no data exist to show differences between aggregates. Our study used plastic chips larger than 3–4 mm for the LFPW wall. Two critical elements guided this choice. The first is economic. Indeed, large aggregates (CA) require a shorter crushing time than FA, which positively impacts the cost of this transformation operation. The second factor is health. CA is less powdery than very small aggregates and, thus, is less likely to disperse in the ambient air during installation and future use.

3.3. Experimentation in Real Environment

We now carry out our various experimental analyses using all or part of the data collected during two years of study.

3.3.1. Impact of the LFPW on Surface Temperatures

We analyzed the surface temperature T s , c e i l i n g at the bottom of the plasterboard and compared the cell equipped with LFPW with the reference cell. This measurement allowed us to evaluate the attenuation capacity of the LFPW on the conductive exchanges between the roof and the cell enclosure.
The data available for this experiment can be broken down into two distinct periods:
  • From 18 August 2020 to 10 September 2020: Corresponding to the end of the winter and the beginning of the winter inter-season (respectively, periods 3 and 4 in Figure 4);
  • From 13 April 2021 to 8 July 2021: Corresponding to the summer inter-season until the middle of the winter season (respectively, periods 2 and 3 in Figure 4). As this second measurement phase is the longest (87 days), we isolate from this section the coldest week (from 20 to 28 June 2021). The entire period is analyzed in Section 3.3.5.
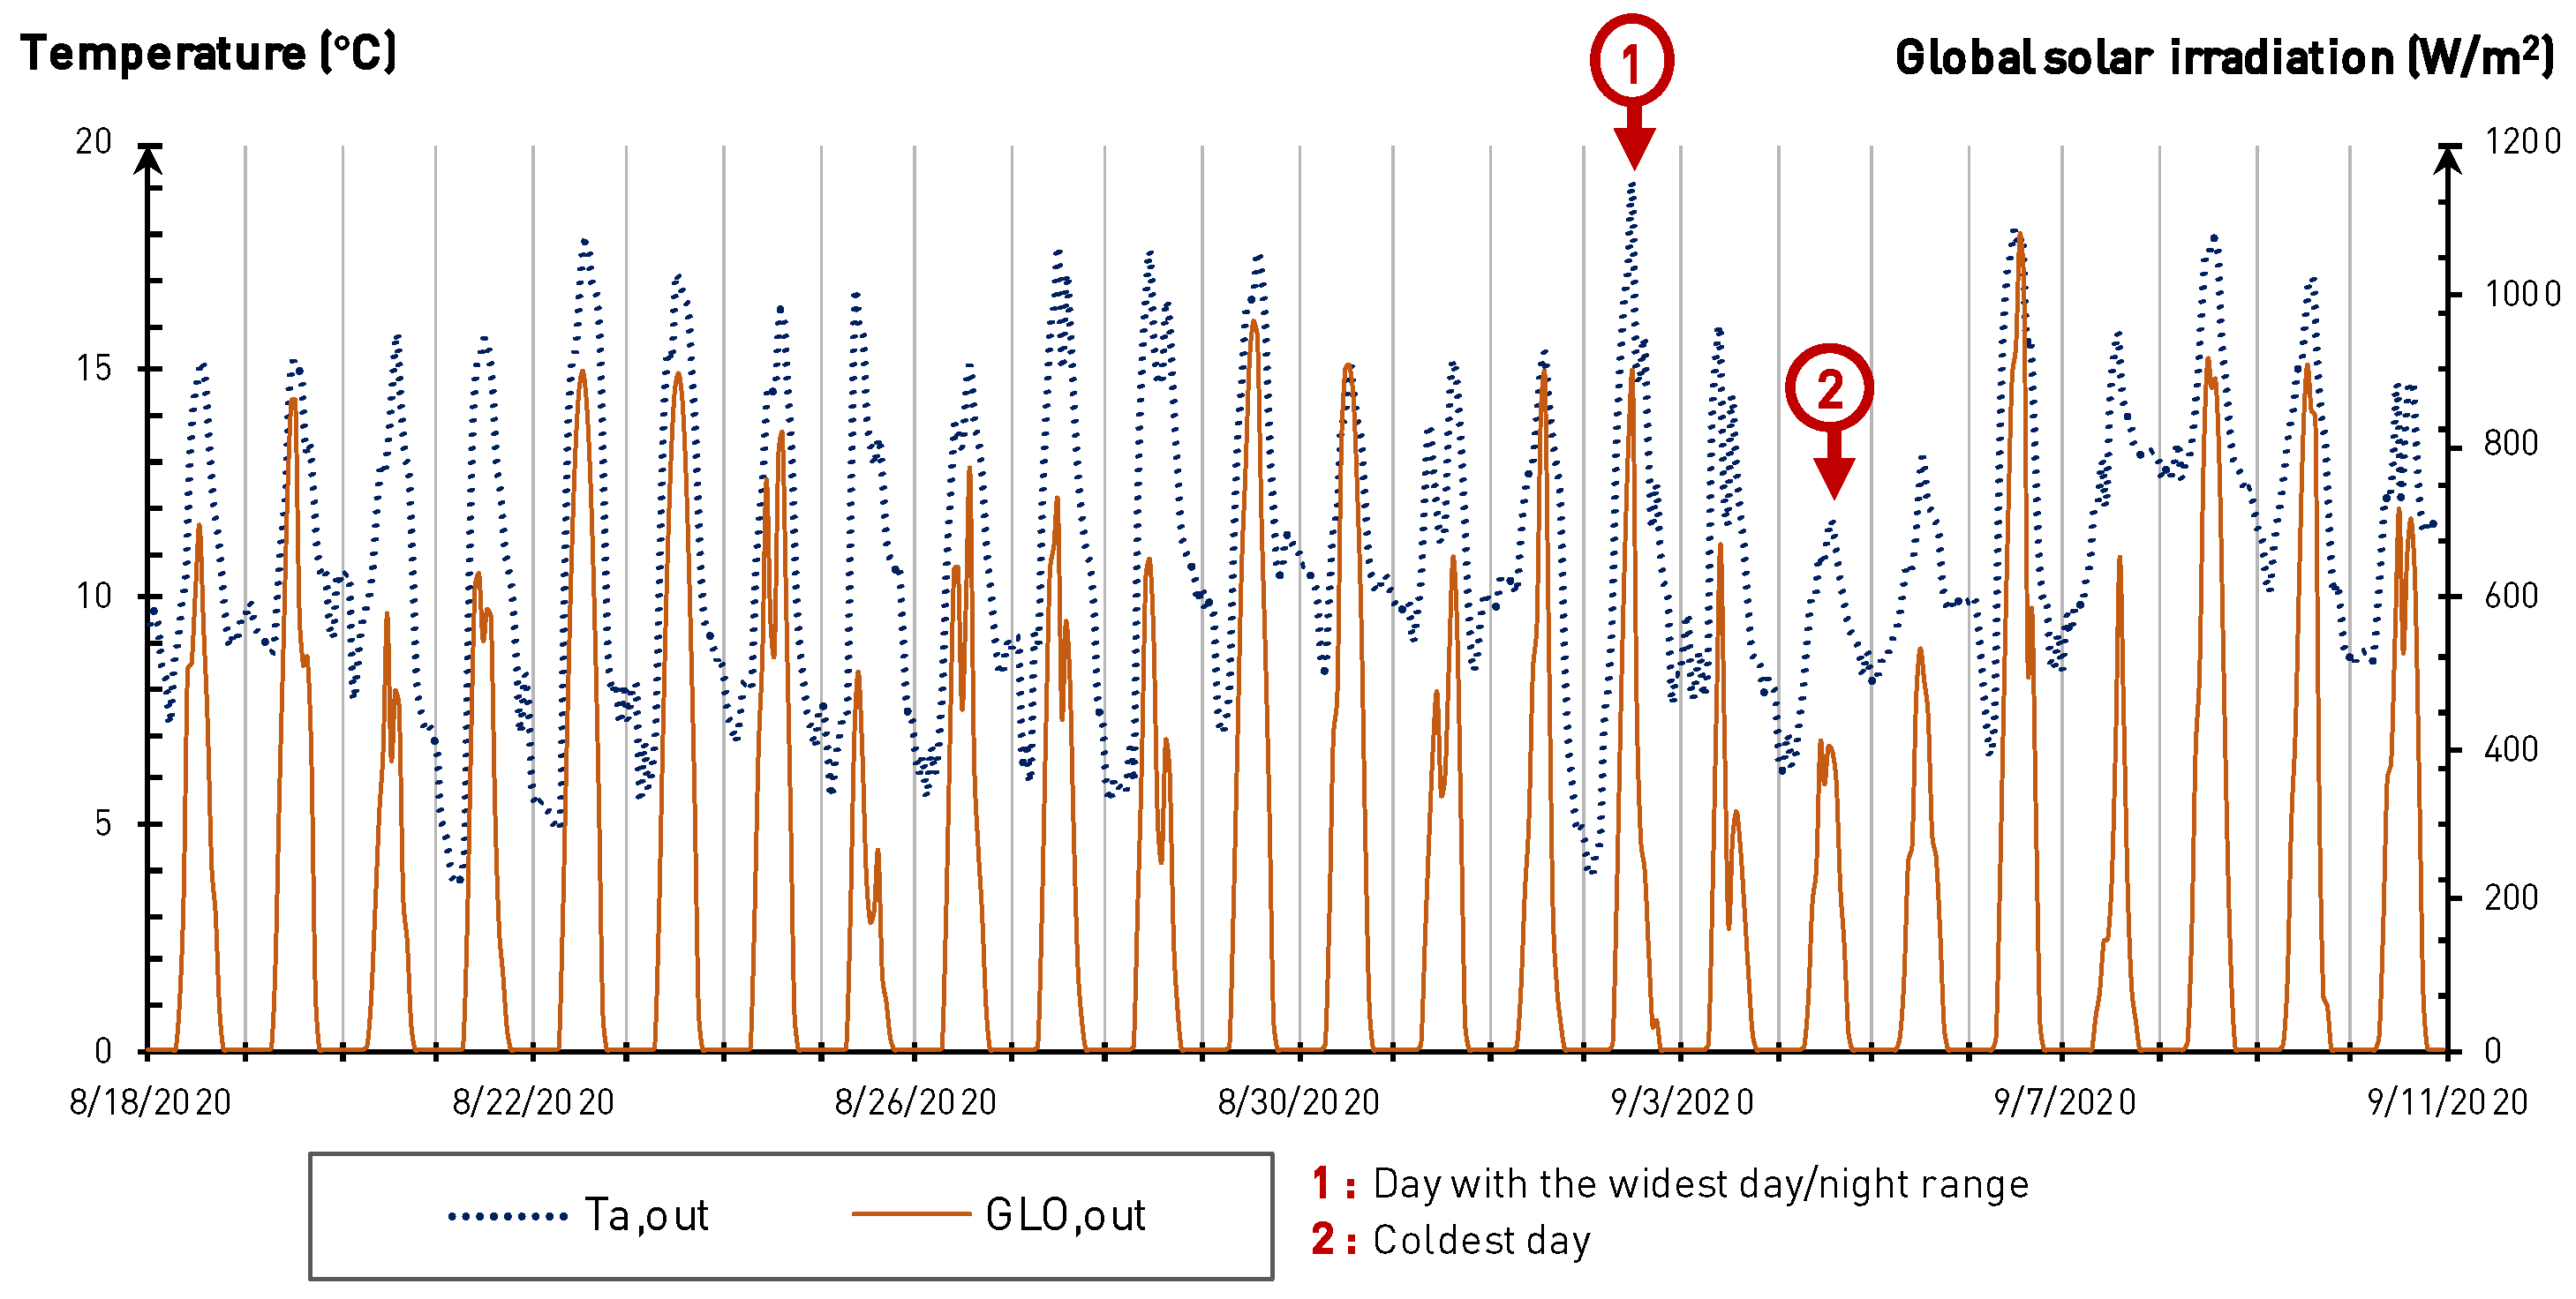
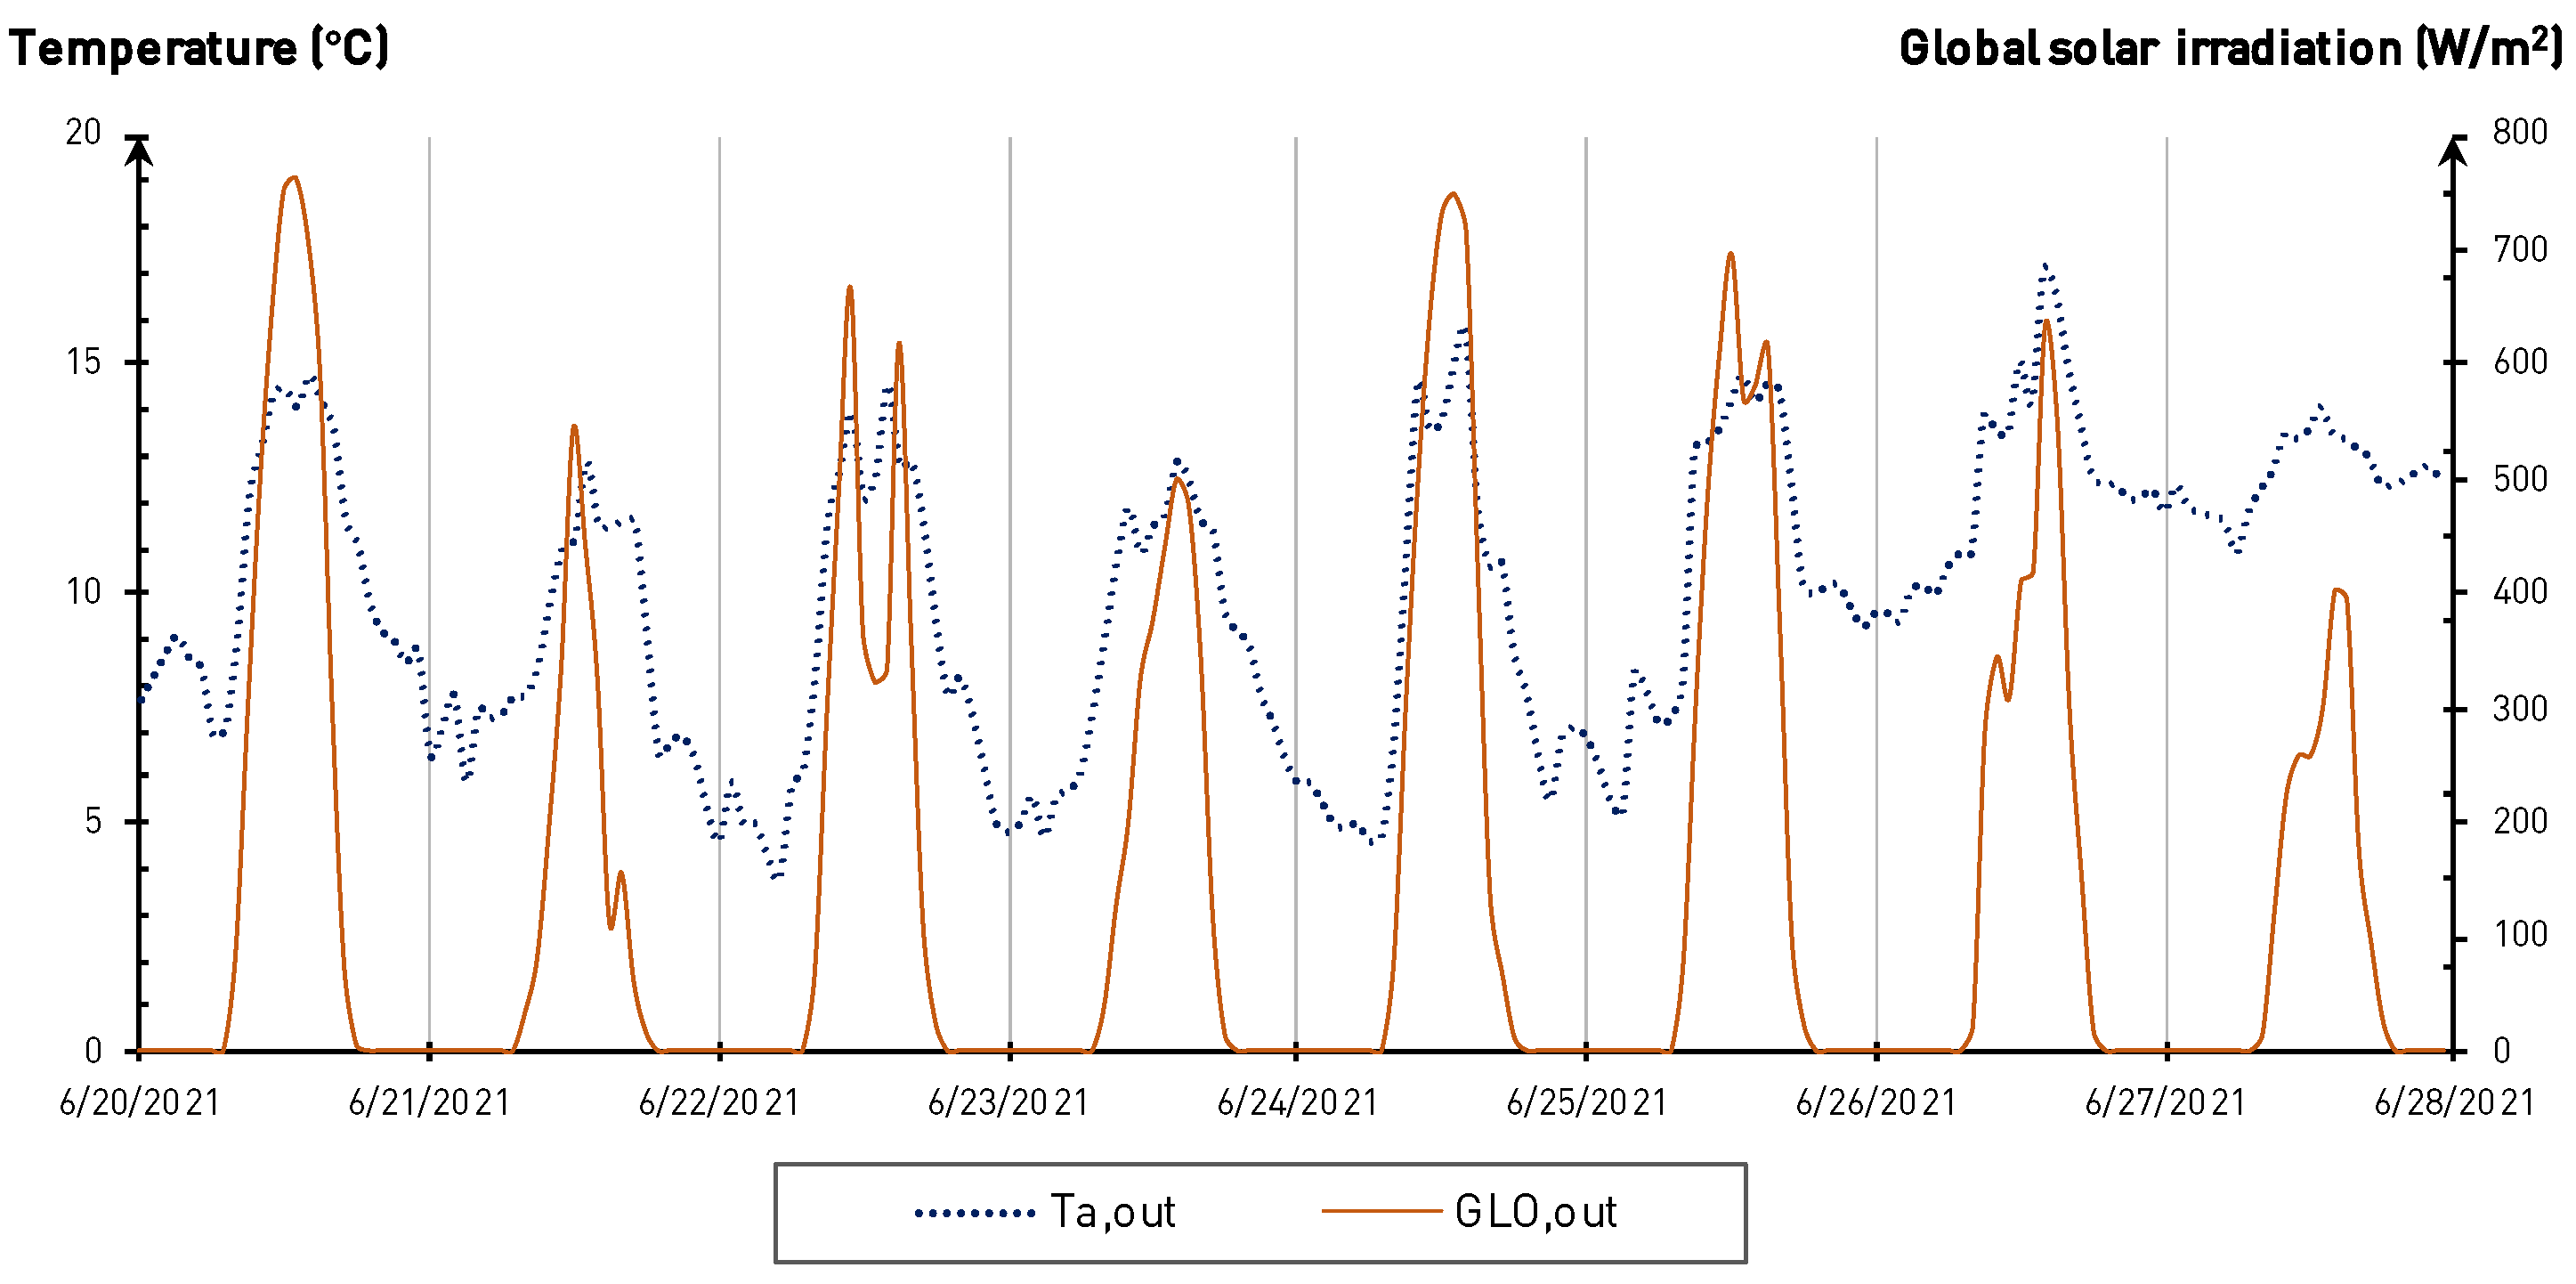
To obtain an overview of the weather conditions over the period studied, we plotted the evolution of the outdoor air temperature T a , o u t over time and the global solar radiation G L O o u t (Figure 7 and Figure 8). The latter parameter was representative of the energy transmitted by the sun and could be correlated to the cloud density. For instance, a clear sky is characterized by the daily profile of its radiation, similar to a Gaussian distribution. Such a situation was observed on 22, 23, 29 August, and 6 September. In this case, the global solar irradiation was similar to the direct solar irradiation, with nominal values of 1050 W/m 2 (6 September).
In contrast, the global solar irradiation profile on overcast (cloudy) days is up and down, as was on 25 August or 4 September, when the nominal values were around 500 W/m 2 . The outdoor air temperatures were only slightly affected, given the density of the surrounding vegetation and the seasonal temperatures at this altitude. Indeed, they ranged from 4 to 17 °C.
From 20 to 28 June 2021, which was the coldest week of our second measurement phase, the outdoor surface temperatures fluctuated between 3.8 °C and 17.1 °C, while the nominal global solar irradiation was around 760 W/m 2 .
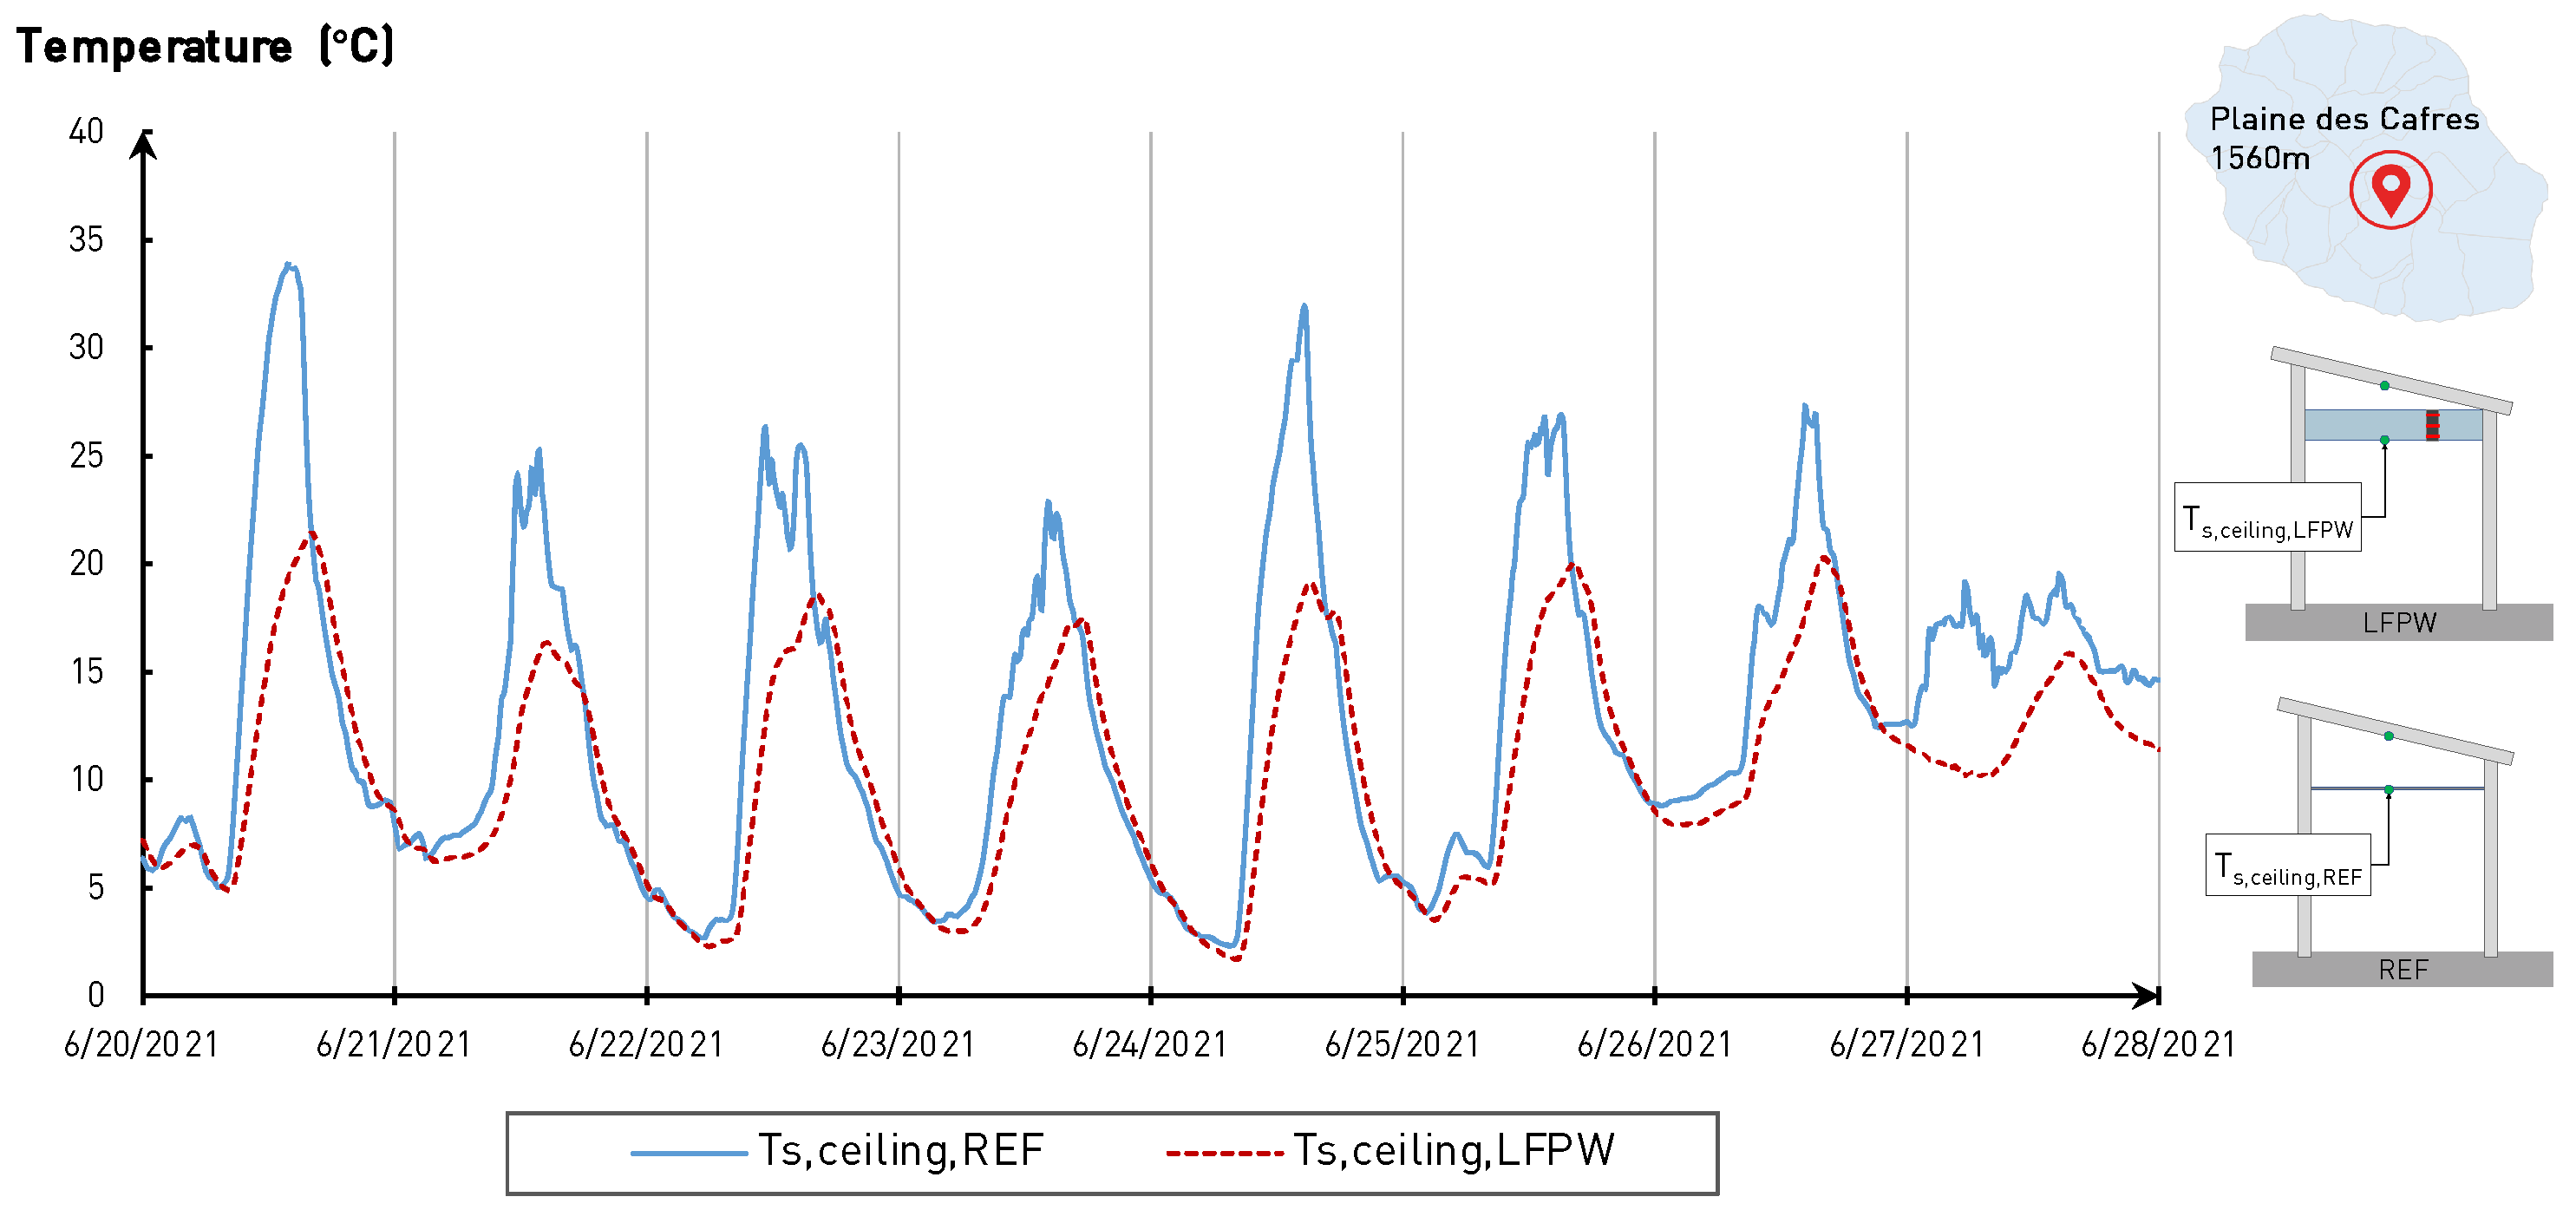
The examination of the surface temperatures of the ceiling (Figure 9 and Figure 10) shows that the presence of the loose-fill insulation reduced the value of the maximum temperature inside during the day. Overnight, the temperatures of the two cells were similar. The influence of solar irradiation is probably the reason for this equality. During the day, the sun irradiated the dark roof, raising this metallic panel’s temperature. Then, the temperature of the air gap increased faster than that of the outside environment. The LFPW exhibits a unique thermal conductivity that arises from the interplay of the plastic’s insulating properties and the trapped air between the chips. As a result, the conductive and radiative effects of the air/sheet complex are significantly reduced. These findings validate the earlier thermal conductivity measurements and underscore the distinctiveness of LFPW’s thermal behavior.
For example, on 22 August, under a clear sky, the maximum global solar irradiation reached nearly 850 W/m 2 at 1:00 p.m. (Figure 7). The maximum surface temperature in the reference cell reached 35.3 °C almost 2 h later (3:10 p.m.), compared to 23.2 °C simultaneously in the cell equipped with the LFPW (Figure 9). The maximum surface temperature in the test cell was reached 140 min later, with a nominal value of about 26 °C. Thus, from the peak of maximum solar irradiation, the cell equipped with the LFPW reached its maximum surface temperature not less than 270 min later, with an attenuation factor of 0.73 compared to the reference cell. The thermal inertia of the LFPW wall is also visible in the rate of variability of the surface temperatures. On a cloudy day, when global irradiation has evolved in a sawtooth pattern, the surface temperature of the ceiling of the reference cell undergoes a multitude of temperature amplitudes. On the opposite, the LFPW wall reduced the variations in the surface temperature. This observation highlights the increase in thermal inertia by simply adding the LFPW.
The same was true for the coldest week of our second measurement phase. The plastic bulk significantly reduces the maximum temperatures reached by the ceiling surface. We noted a maximum difference in favor of LFPW of 15.1 °C on 20 June 2021, a clear day, as shown in the global solar radiation profile in Figure 8. Over this week, the average difference amounted to 3.3 °C. Although the temperatures recorded were cold with LFPW, we confirm its ability to reduce conductive heat transfer.
Under cloudy skies, such as June 27, the maximum difference was minor (9 °C) but still favored LFPW. Furthermore, the temporal phase shift observed in the location of the maximum temperature peak is worth noting. To verify this observation, a thorough analysis is conducted in the subsequent section.

3.3.2. LFPW Performance on Two Typical Days

We next focus on two typical days in Figure 11. These days have the particularity of presenting the most significant surface temperature differences during the measurement periods.
For example, 20 May 2021 was the day with the most considerable difference in surface temperature between the reference and test cells. As shown in Figure 11, the weather conditions were typical of an overcast day with a nominal irradiation of nearly 710 W/m 2 and a relatively constant temperature of 12.2 °C. The difference was smaller but still notable on 6 September 2020. Solar radiation was higher, with a nominal value close to 1100 W/m 2 and a day/night temperature amplitude of almost 11.6 °C.
The evolution of the two surface temperatures throughout the day is presented in Figure 11. In both cases, the values recorded by the two ceilings were similar during the night. These nighttime data show that the vertical walls and the floor of the cells exchanged with their environment, and the solar energy stored by the thermal mass was quickly lost. On 6 September 2020, within the reference cell, the temperature stabilized at 2:10 p.m., reaching a maximum value of 37.2 °C. Two notable temperature drops were observed within the reference cell. The first one, by more than 8 °C, was observed at 2:30 p.m., almost simultaneously with the external global solar radiation (2:00 p.m.). The presence of a cloud mass was probably the reason for this. Then, the second, slower drop started at 4:40 p.m., marking the day’s end. The cell equipped with the LFPW showed different behavior. The surface temperature increased slowly from 7:40 a.m. (i.e., 20 min later than in the reference cell) to reach a maximum temperature of 25.2 °C at 5:40 p.m. The difference between the maximum temperatures reached 17.4 °C. The maximum temperature of the cell with LFPW was reached 190 min after the reference cell. The cloud event, which was widely observed in the reference cell, seemed to have less impact on the ceiling surface temperature of the cell with LFPW since the temperature drop remained minor (less than 1 °C).
The observation is the same for 20 May 2021. Despite the gradual drops in the ceiling surface temperature, the nominal value of this parameter was reached at 11:10 a.m. in the reference cell, reaching a maximum value of 31.2 °C. Cloudy episodes were also seen in the evolution of global solar radiation during this day. This was noticeably reflected in the evolution of the surface temperature in the reference cell and, to a lesser extent, in the test cell. At the beginning of the day, when the temperature increased in the reference cell, it decreased in the cell equipped with the LFPW. We assume that this is due to a shadow on the LFPW cell. At this time of the year (close to the winter solstice in Reunion Island), the sun’s rays are low, as the sun is lower in the sky. The reference cell probably masked a significant part of the solar radiation from the rising sun. As the outside air temperature fell (see Figure 11), the ceiling temperature of the LFPW was impacted. From 9:10 a.m. onwards, the temperature rose again, reaching its nominal value at 2:20 p.m., i.e., 190 min after the reference cell, for a difference of almost 22.2 °C.
As with conventional insulation, the air trapped between the plastic chips reduces the material’s thermal conductivity. In other words, the presence of LFPW considerably increased the thermal inertia of the horizontal wall, since the phase shifts are significant (190 min in both cases studied).

3.3.3. Study of the Thermal Gradient within the LFPW

The time has come to look at the evolution of the thermal gradient within the loose-fill plastic waste. Indeed, it is important to know if the thermal behavior of the bulk can be considered proportional to its thickness. To this end, two types of days were studied.
The first one, September 4th, was the coldest day of our first measurement period, i.e., when the maximum temperature presented the lowest value registered, as shown in Figure 7 (called “2”). Figure 12 represents the evolution of the thermal gradient for this day at different times. A first examination of these data indicated that the temperature profile could vary depending on the time of day due to the variations in sunshine. Then, different characteristic hours were examined with closer attention.
At 6:00 a.m., at the beginning of the day, the cell had not yet received any heat, which justifies that the temperatures within the material, the air gap, and the sheet remained stable at 6.5 °C. At 9:00 a.m., the temperature T g , 1 was 6.4 °C higher than the temperature T g , 3 close to the plywood. However, the temperature of the sheet metal reached 18 °C. This is because the outside air temperature remained low, but the cell received the first irradiation from the sun. The vertical walls and the sheet metal heated up, while the bulk plastic and the air gap maintained their temperatures. This demonstrates the low thermal conductivity of the wall, in contrast to the steel roof. At noon, temperatures continued to rise with the maintenance of a thermal phase shift within the LFPW. At 6:00 p.m., the trend was reversed. When the solar radiation became zero, the temperature near the plasterboard and the temperature of the metallic sheet stabilized at 11 °C. In comparison, the temperature within the LFPW was 3.3 °C higher. At 11:00 p.m. and midnight, the temperature difference outside the LFPW was reduced but remained positive: the thermal inertia of the LFPW was deemed sufficient to induce a remarkable thermal phase shift.
The maximum amplitude of the thermal gradient was notable. Indeed, the temperature difference between the upper and lower nodes could reach more than 5 °C over 8 cm. Furthermore, in the middle of the day, the closer to the interior (i.e., towards the ceiling), the more the temperature increased, which proves the insulating power of this loose plastic waste.
The second study day is 2 September 2020, referenced as “1” in Figure 7. This is the day with the most significant day/night temperature amplitude (15.2 °C). Indeed, in the first part of the day, the outdoor temperature dropped to 3.9 °C (1:00 a.m.), reaching a nominal value of 19.1 °C at midnight (see Figure 13). This scenario makes it possible to study the material’s behavior subjected to an environment with a significant temperature difference over a brief time (11 h).
The evolution of temperatures confirms the previous observation: the temperature profile varies according to the time of day due to variations in sunlight. However, the temperature amplitude is much greater, with a surface temperature at the air–LFPW interface varying from −4.1 °C in the morning to 18.1 °C in the evening.
At dawn (6:00 a.m.), the temperatures within the test cell were balanced at an average of 2.2 °C due to the very cool nighttime temperatures. The sun’s rays heated up the roof and walls, increasing the temperature inside the cell and heating up the plasterboard surface (10.5 °C) from early morning. At the same time, the sheet metal reached a temperature of 18.6 °C. In contrast, the temperature inside the loose-fill plastic layer dropped by almost 5 °C compared to 6:00 a.m. This finding was confirmed in the previous day’s study. A notable relative humidity within the material can justify this event: the plastic chips trapped water (probably in liquid form, due to temperatures close to the dew point). Water being a better thermal conductor than air, exchanges became noticeable in this zone. The zone then exchanged with the coldest zones of the cell. This reveals the likely impact of water in the LFPW. The behavior is more or less the same throughout the day on 4 September. At 6:00 p.m., at dusk, the material retained the heat stored during the day while the temperature of the sheet began to drop.
It is important to note that, even at low temperatures, our polyolefin material remained mechanically stable due to its temperature range, chip weight, and intrinsic nature. Thus, there is no risk of altering the mechanical behavior of the material due to the glass transition temperature being exceeded.

3.3.4. Impact on Thermal Comfort

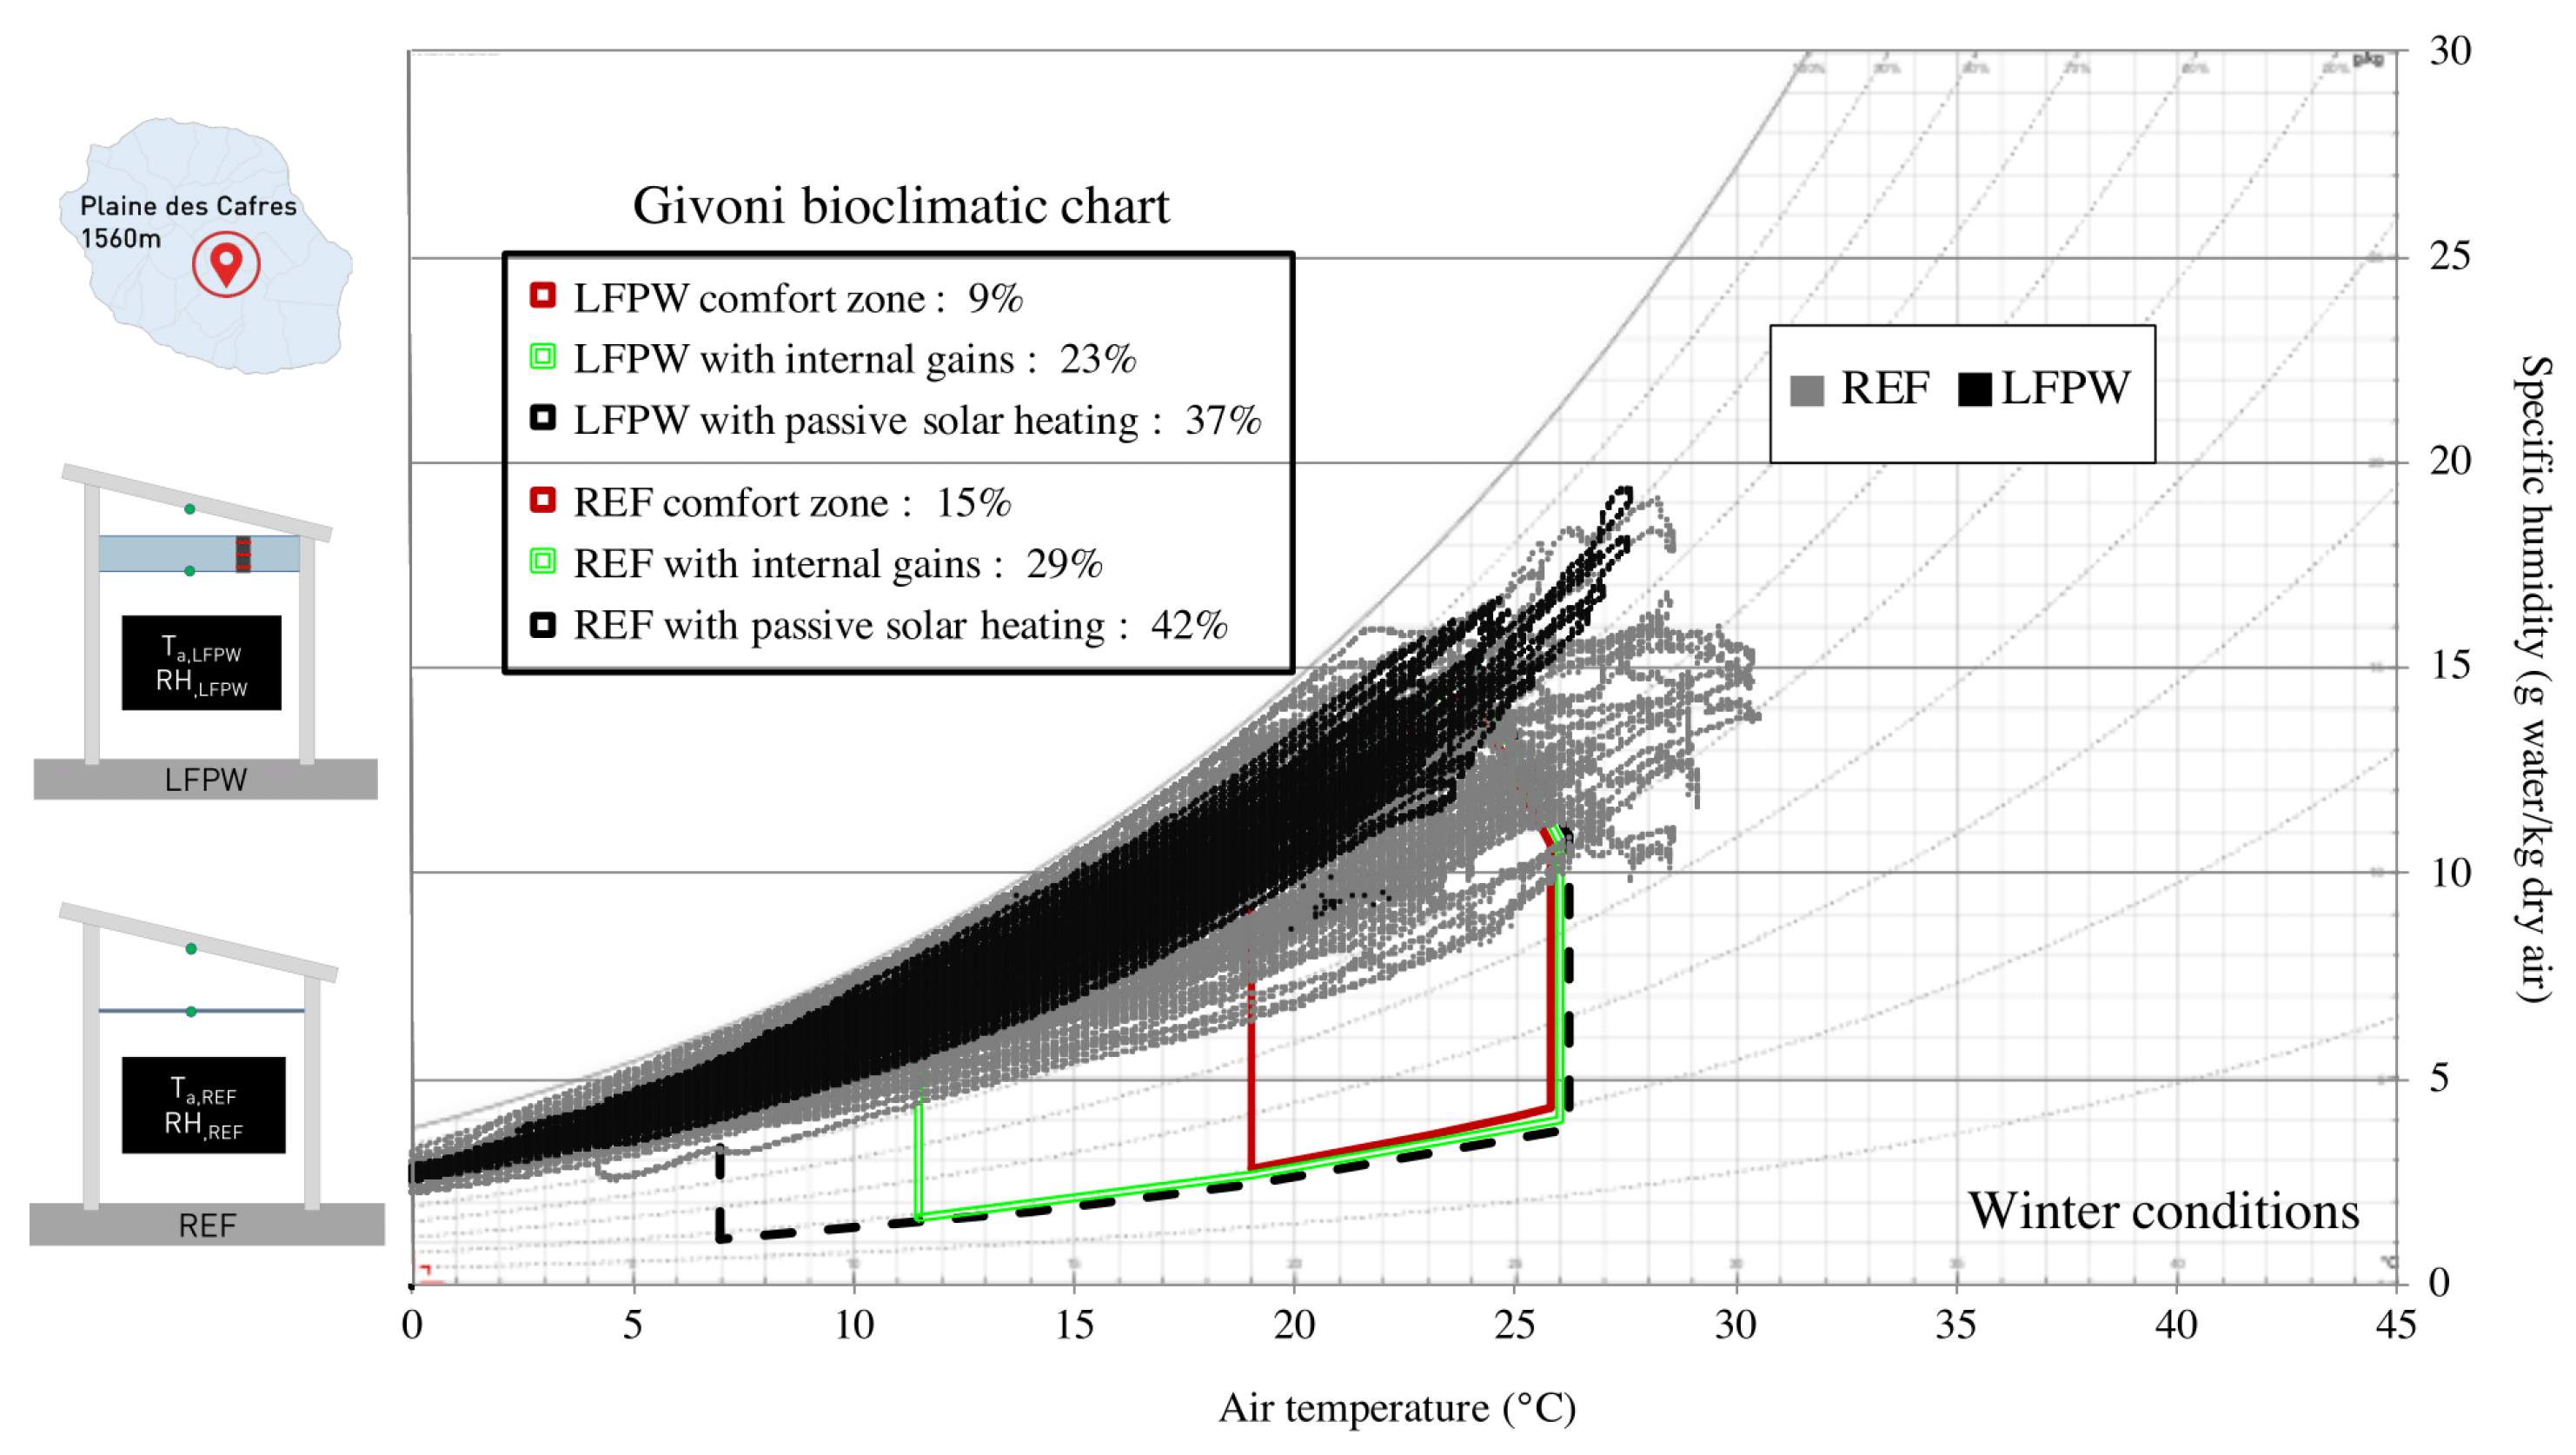
We now seek to demonstrate the impact on the theoretical thermal experience of an occupant using Givoni’s comfort ranges. To do this, air temperatures and relative humidities were positioned on the humid air diagram with the three Givoni summer comfort zones (example in Figure 14).
The diagram results contradict the previous analyses. Indeed, the LFPW reduced the time spent in thermal comfort situations by almost 2% compared to the reference cell for a room ventilated at 1 m/s, as shown in Table 3. The results for a non-ventilated room (at 0 m/s) were similar to the reference cell: the LFPW allowed a thermal comfort situation to be reached 19% of the time in summer.
The analysis using Givoni’s bioclimatic chart shows that the LFPW, in its current configuration, does not allow one to reach complete summer thermal comfort in Plaine des Cafres. It is important to note that this does not call into question the performance of the technology. The thermal exchanges between the cell and its environment weigh significantly in this observation. Indeed, as the cell floor was not insulated and was, instead, constructed as a crawl space, cold outside air during the night rapidly cooled the building through its floor. This partially explains the great number of points to the left of Givoni’s comfort zones.
The LFPW wall alone regulated ceiling temperatures, but its impact on air temperatures and indoor relative humidity was minimal in proportion to the vertical surfaces. Looking at the distribution of the points on the moist air diagram, we can see that the indoor air temperature and relative humidity amplitude were much lower with the 8 cm of LFPW than in the reference cell. Given the hydrophobic nature of the plastics constituting LFPW, this phenomenon cannot be the consequence of water absorption by the plastic aggregates. It is probably due to air trapped between the chips, which acts as a hygrometric regulation zone, similar to a trap. The relative humidity regulation seems to be a point of interest since the LFPW presented rates varying between 55 and 80%, compared to 25 to 100% for the reference cell.
Focusing now on the winter thermal experience, we see a similar behavior as in summer. The LFPW seems to reduce the number of hours in thermal neutrality. The Givoni diagram for winter conditions proposes extending comfort ranges by combining passive heating solutions: internal load addition or passive solar heating. The analysis of the performance of LFPW on thermal perception in combination with either of these solutions does not suggest a significant contribution. However, as mentioned later, it is necessary to contextualize this analysis concerning the current configuration. Indeed, the LFPW seems again to positively influence the atmosphere by regulating the quantity of water in the air (Figure 14).
The increase in heat exchange between a person and their environment in winter circumstances will probably be detrimental to thermal neutrality. Despite its thinness and uneven surface distribution in space, the hygroscopic behavior of LFPW and, more precisely, of the air trapped between plastic chips seems to be proven again.
Table 3 extends the study to the two inter-seasons and summarizes all the results, confirming the previous analyses.

3.3.5. LFPW Performance over All Periods

Table 4 summarizes the data over the entire measurement period, including those from the thermohygrometric sensors. The average difference in air temperature between the two cells was about 1.2 °C, with the advantage for the LFPW cell. The temperatures were more stable there, even if the deployment of the LFPW on all the walls (i.e., horizontal and vertical) would make it possible to increase the benefits due to its use. The maximum temperature did not exceed 34 °C, while the reference cell reached 38.9 °C. The observation is the same for the surface temperatures, where the average difference was about 3.2 °C. The presence of the LFPW also reduced the amplitude of variation of the relative humidity, due to a higher value of the minimum measured. Indeed, in the test cell, the relative humidity remained above 55.1%, while, without insulation, it could decrease to 25.3%. A similar hierarchy was observed concerning the average RH value, but both values (test and reference) remained below that registered outdoors. The LFPW seems able to regulate the hygrometric exchanges between the ceiling and the airspace. This insulating complex containing air will tend to “trap” water in the bulk of plastic chips.

4. Conclusions and Perspectives

This innovative study explored the benefits of using plastic waste chips as loose-fill insulation. Such an application has never been studied before. Plastic waste from the construction industry was carefully cleaned, shredded, and screened to obtain a clean and dry fraction with a size ranging from 3 to 4 mm. These chips were then tested in experimental cells as thermal ceiling insulation during a nearly two-year experiment in a cold and humid tropical climate (Reunion Island, France).
The results showed that the LFPW technology significantly improved indoor relative humidity, reducing daily variations and conductive exchanges between the roof and the cell. This air-containing insulating complex acts as a buffer zone, particularly against humidity. Regarding temperature stability, the LFPW-equipped cell demonstrated better stability than the reference cell. However, to fully optimize the advantages of LFPW, it would be preferable to install it on all horizontal and vertical walls.
An analysis based on Givoni’s bioclimatic chart indicated that, in its current configuration, LFPW does not achieve complete summer thermal comfort in a cold tropical climate. However, it is essential to note that this does not undermine the performance of the technology. By observing the distribution of points on the moist air diagram, it is evident that using LFPW significantly reduces the amplitude of indoor air temperature and relative humidity compared to its absence. Therefore, the regulation of relative humidity and the reduction in surface temperatures is particularly interesting. LFPW exhibits much lower variation rates than the reference cell (without LFPW), demonstrating its effectiveness in managing indoor humidity.
This technology shows promise, as it offers high thermohydraulic efficiency while being easy to implement and cost-effective. However, further studies are needed to optimize its performance and adapt it to different climates and locations before it can be widely used as insulation. Additional research is required to experimentally compare this material to standard thermal insulators and evaluate its resistance to moisture, fire, and pests.

Author Contributions

B.M.-D.: Investigation, Data Curation, Writing—Original Draft, Visualization, Methodology, Validation, Writing—Review & Editing; J.-P.H.: Conceptualization, Methodology, Writing—Review & Editing, Validation; D.B.: Conceptualization, Methodology, Writing—Review & Editing, Validation. All authors have read and agreed to the published version of the manuscript.

Funding

The APC was funded by the Action Logement’s overseas innovation plan, as part of the PIV OM LAB-iMAC project.

Institutional Review Board Statement

Not applicable.

Informed Consent Statement

Not applicable.

Data Availability Statement

Not applicable.

Acknowledgments

We thank the PIMENT laboratory technician, Jérôme Vigneron, and the laboratory trainee, Laurane Ruggeri, for contributing to the experiment’s deployment and the data’s reliability.

Conflicts of Interest

The authors declare no conflict of interest.

References

  1. Kaza, S.; Yao, L.; Bhada-Tata, P.; Van Woerden, F. What a Waste 2.0: A Global Snapshot of Solid Waste Management to 2050; Technical Report; World Bank Group: Washington, DC, USA, 2018. [Google Scholar]
  2. Intini, F.; Kühtz, S. Recycling in buildings: An LCA case study of a thermal insulation panel made of polyester fiber, recycled from post-consumer PET bottles. Int. J. Life Cycle Assess. 2011, 16, 306–315. [Google Scholar] [CrossRef]
  3. Ingrao, C.; Lo Giudice, A.; Tricase, C.; Rana, R.; Mbohwa, C.; Siracusa, V. Recycled-PET fibre based panels for building thermal insulation: Environmental impact and improvement potential assessment for a greener production. Sci. Total Environ. 2014, 493, 914–929. [Google Scholar] [CrossRef]
  4. Silva, D.; Betioli, A.; Gleize, P.; Roman, H.; Gómez, L.; Ribeiro, J. Degradation of recycled PET fibers in Portland cement-based materials. Cem. Concr. Res. 2005, 35, 1741–1746. [Google Scholar] [CrossRef]
  5. Pelisser, F.; da S. Santos Neto, A.B.; Rovere, H.L.L.; de Andrade Pinto, R.C. Effect of the addition of synthetic fibers to concrete thin slabs on plastic shrinkage cracking. Constr. Build. Mater. 2010, 24, 2171–2176. [Google Scholar] [CrossRef]
  6. Bhogayata, A.C.; Arora, N.K. Impact strength, permeability and chemical resistance of concrete reinforced with metalized plastic waste fibers. Constr. Build. Mater. 2018, 161, 254–266. [Google Scholar] [CrossRef]
  7. Patnaik, A.; Mvubu, M.; Muniyasamy, S.; Botha, A.; Anandjiwala, R.D. Thermal and sound insulation materials from waste wool and recycled polyester fibers and their biodegradation studies. Energy Build. 2015, 92, 161–169. [Google Scholar] [CrossRef]
  8. Jackowski, M.; Małek, M. A multi-site study of a new cement composite brick with partial cement substitutes and waste materials. Case Stud. Constr. Mater. 2023, 18, e01992. [Google Scholar] [CrossRef]
  9. Małek, M.; Jackowski, M.; Łasica, W.; Kadela, M. Influence of polypropylene, glass and steel fiber on the thermal properties of concrete. Materials 2021, 14, 1888. [Google Scholar] [CrossRef] [PubMed]
  10. Rebeiz, K. Precast use of polymer concrete using unsaturated polyester resin based on recycled PET waste. Constr. Build. Mater. 1996, 10, 215–220. [Google Scholar] [CrossRef]
  11. Tawfik, M.E.; Eskander, S.B. Polymer Concrete from Marble Wastes and Recycled Poly(ethylene terephthalate). J. Elastomers Plast. 2006, 38, 65–79. [Google Scholar] [CrossRef]
  12. Rebeiz, K.; Craft, A. Plastic waste management in construction: Technological and institutional issues. Resour. Conserv. Recycl. 1995, 15, 245–257. [Google Scholar] [CrossRef]
  13. Bulut, H.A.; Şahin, R. A study on mechanical properties of polymer concrete containing electronic plastic waste. Compos. Struct. 2017, 178, 50–62. [Google Scholar] [CrossRef]
  14. Wijesekara, D.A.; Sargent, P.; Ennis, C.J.; Hughes, D. Prospects of using chars derived from mixed post waste plastic pyrolysis in civil engineering applications. J. Clean. Prod. 2021, 317, 128212. [Google Scholar] [CrossRef]
  15. Nyika, J.; Dinka, M. Recycling plastic waste materials for building and construction Materials: A minireview. Mater. Today Proc. 2022, 62, 3257–3262. [Google Scholar] [CrossRef]
  16. Maneeth Pd, P.K.K.; Shetty, S. Utilization of Waste Plastic in Manufacturing of Plastic-Soil Bricks. Int. J. Eng. Res. Technol. (IJERT) 2014, 3, 529–536. [Google Scholar]
  17. Siddique, R.; Khatib, J.; Kaur, I. Use of recycled plastic in concrete: A review. Waste Manag. 2008, 28, 1835–1852. [Google Scholar] [CrossRef]
  18. Almeshal, I.; Tayeh, B.A.; Alyousef, R.; Alabduljabbar, H.; Mustafa Mohamed, A.; Alaskar, A. Use of recycled plastic as fine aggregate in cementitious composites: A review. Constr. Build. Mater. 2020, 253, 119146. [Google Scholar] [CrossRef]
  19. Gu, L.; Ozbakkaloglu, T. Use of recycled plastics in concrete: A critical review. Waste Manag. 2016, 51, 19–42. [Google Scholar] [CrossRef]
  20. Saikia, N.; de Brito, J. Use of plastic waste as aggregate in cement mortar and concrete preparation: A review. Constr. Build. Mater. 2012, 34, 385–401. [Google Scholar] [CrossRef]
  21. Li, X.; Ling, T.C.; Hung Mo, K. Functions and impacts of plastic/rubber wastes as eco-friendly aggregate in concrete—A review. Constr. Build. Mater. 2020, 240, 117869. [Google Scholar] [CrossRef]
  22. Selvam, M.; Debbarma, S.; Singh, S.; Shi, X. Utilization of alternative aggregates for roller compacted concrete pavements—A state-of-the-art review. Constr. Build. Mater. 2022, 317, 125838. [Google Scholar] [CrossRef]
  23. Kazemi, M.; Faisal Kabir, S.; Fini, E.H. State of the art in recycling waste thermoplastics and thermosets and their applications in construction. Resour. Conserv. Recycl. 2021, 174, 105776. [Google Scholar] [CrossRef]
  24. Zhao, J.R.; Zheng, R.; Tang, J.; Sun, H.J.; Wang, J. A mini-review on building insulation materials from perspective of plastic pollution: Current issues and natural fibres as a possible solution. J. Hazard. Mater. 2022, 438, 129449. [Google Scholar] [CrossRef]
  25. Babaremu, K.O.; Okoya, S.A.; Hughes, E.; Tijani, B.; Teidi, D.; Akpan, A.; Igwe, J.; Karera, S.; Oyinlola, M.; Akinlabi, E.T. Sustainable plastic waste management in a circular economy. Heliyon 2022, 8, e09984. [Google Scholar] [CrossRef]
  26. Megri, A.C.; Achard, G.; Haghighat, F. Using plastic waste as thermal insulation for the slab-on-grade floor and basement of a building. Build. Environ. 1998, 33, 97–104. [Google Scholar] [CrossRef]
  27. Datsyuk, V.; Trotsenko, S.; Peikert, K.; Höflich, K.; Wedel, N.; Allar, C.; Sick, T.; Deinhart, V.; Reich, S.; Krcmar, W. Polystyrene nanofibers for nonwoven porous building insulation materials. Eng. Rep. 2019, 1, e12037. [Google Scholar] [CrossRef] [Green Version]
  28. Choi, J.; Yang, I.; Kim, S.S.; Cho, S.Y.; Lee, S. Upcycling Plastic Waste into High Value-Added Carbonaceous Materials. Macromol. Rapid Commun. 2022, 43, 210–467. [Google Scholar] [CrossRef] [PubMed]
  29. Abu-Thabit, N.Y.; Pérez-Rivero, C.; Uwaezuoke, O.J.; Ngwuluka, N.C. From waste to wealth: Upcycling of plastic and lignocellulosic wastes to PHAs. J. Chem. Technol. Biotechnol. 2021. [Google Scholar] [CrossRef]
  30. Lopez Hurtado, P.; Rouilly, A.; Vandenbossche, V.; Raynaud, C. A review on the properties of cellulose fibre insulation. Build. Environ. 2016, 96, 170–177. [Google Scholar] [CrossRef] [Green Version]
  31. Bénard, F.; Malet-Damour, B. Assessing potential of plastic waste management policies for territories sustainability: Case study of Reunion Island. World Dev. Sustain. 2022, 1, 100030. [Google Scholar] [CrossRef]
  32. Miranville, F.; Boyer, H.; Lauret, P.; Lucas, F. A combined approach for determining the thermal performance of radiant barriers under field conditions. Sol. Energy 2008, 82, 399–410. [Google Scholar] [CrossRef]
  33. Guichard, S.; Miranville, F.; Bigot, D.; Boyer, H. A thermal model for phase change materials in a building roof for a tropical and humid climate: Model description and elements of validation. Energy Build. 2014, 70, 71–80. [Google Scholar] [CrossRef] [Green Version]
  34. Djongyang, N.; Tchinda, R.; Njomo, D. Thermal comfort: A review paper. Renew. Sustain. Energy Rev. 2010, 14, 2626–2640. [Google Scholar] [CrossRef]
  35. Givoni, B. Comfort, climate analysis and building design guidelines. Energy Build. 1992, 18, 11–23. [Google Scholar] [CrossRef]
  36. Bellamy, L.J. The Infra-Red Spectra of Complex Molecules; Springer: Dordrecht, The Netherlands, 1975. [Google Scholar] [CrossRef]
  37. Krimm, S.; Liang, C.Y.; Sutherland, G.B.B.M. Infrared spectra of high polymers. V. Polyvinyl alcohol. J. Polym. Sci. 1956, 22, 227–247. [Google Scholar] [CrossRef]
  38. Coates, J. Interpretation of Infrared Spectra, A Practical Approach. In Encyclopedia of Analytical Chemistry; John Wiley & Sons, Inc.: Hoboken, NJ, USA, 2006. [Google Scholar] [CrossRef]
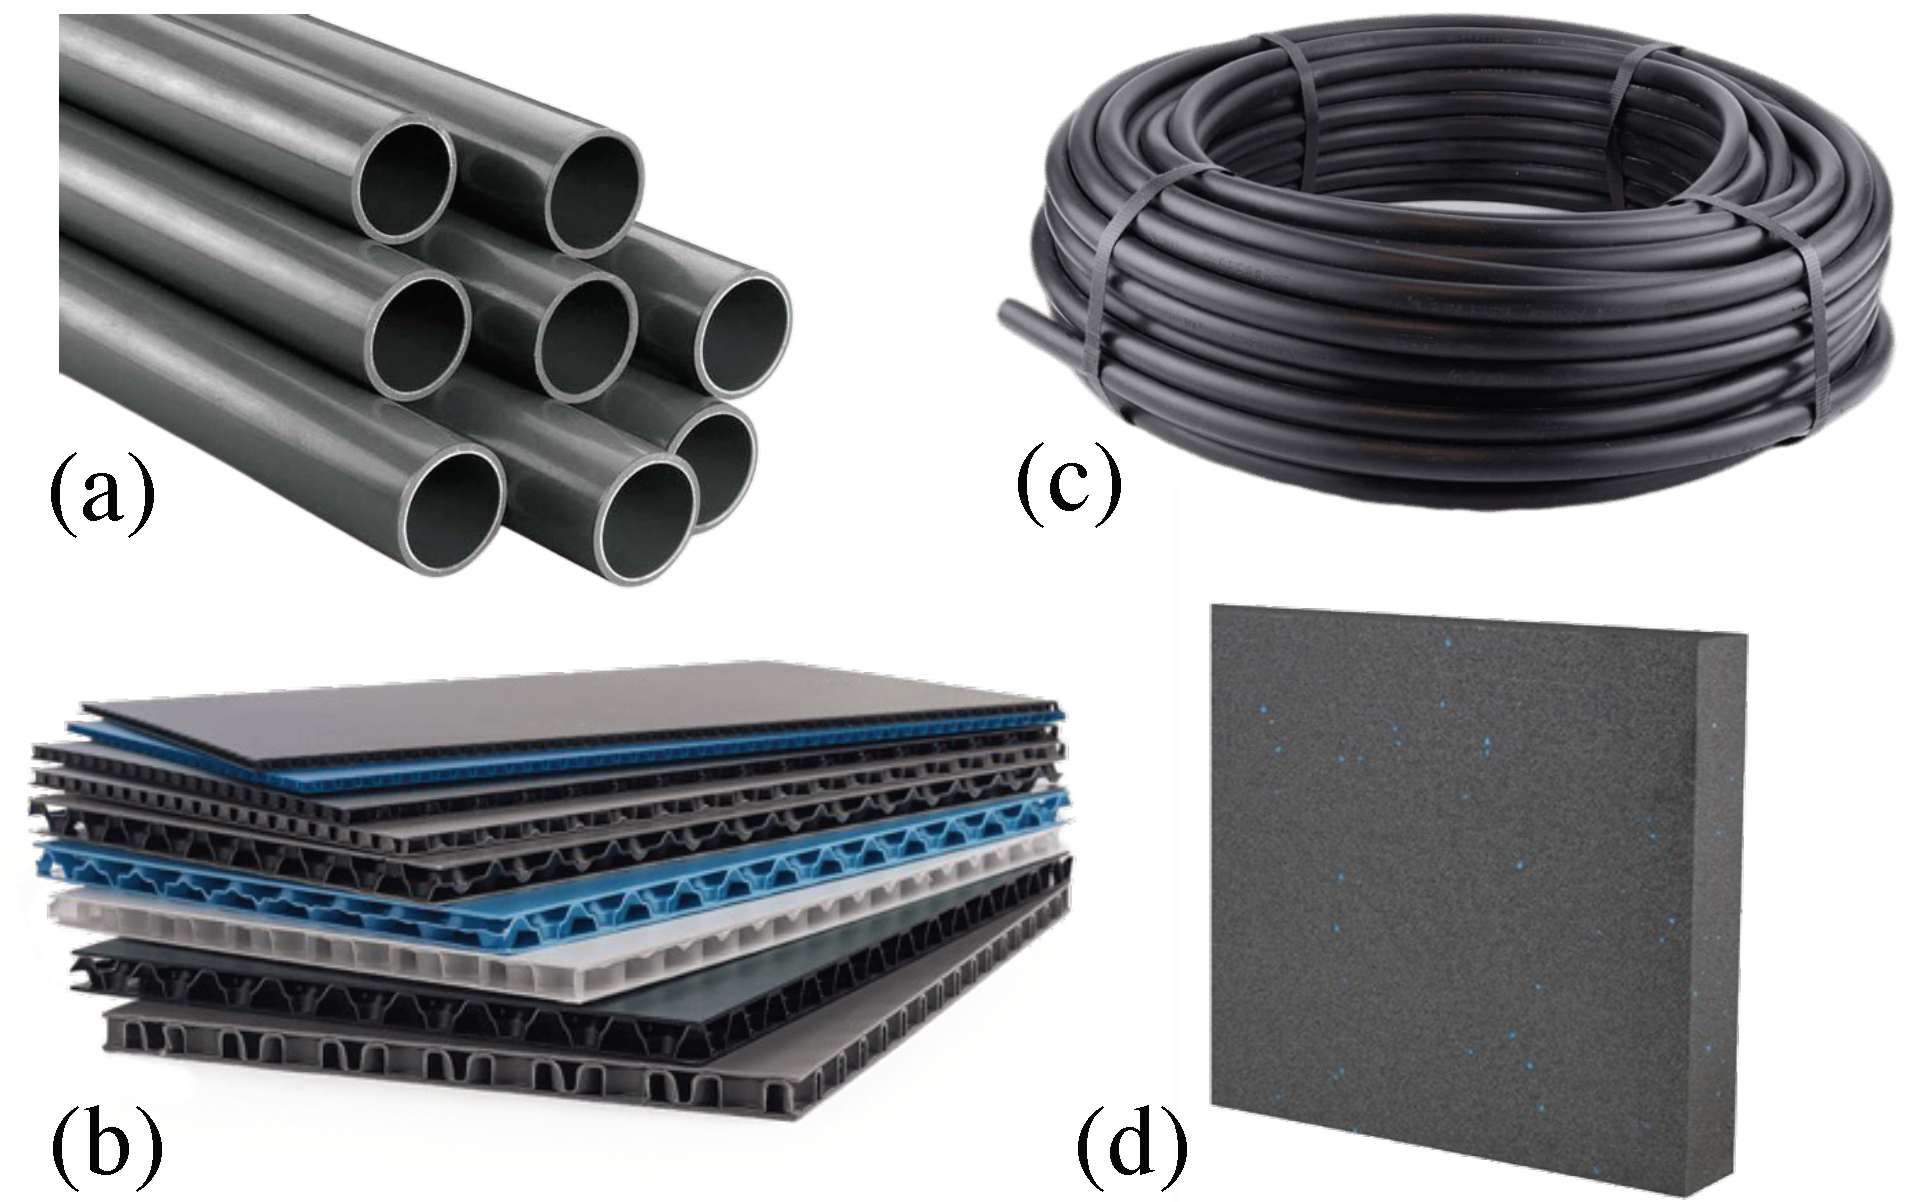
Figure 1. Examples of the products used: (a) Polyvinylchloride (PVC) pipe; (b) Polypropylene (PP) corrugated sheet; (c) Polyethylene (PE) tubes; (d) Polystyrene (PS) thermal insulation.
Sustainability 15 09483 g001
Figure 2. Schematic representation of the test cells (dimensions in cm), location of the experiment, and view of the LFPW wall.
Sustainability 15 09483 g002
Figure 3. Details of the LFPW wall and sensor placement (dimensions in cm).
Sustainability 15 09483 g003
Figure 4. Evolution of (a) air temperature, (b) relative humidity, and (c) global solar irradiation for the year 2021.
Sustainability 15 09483 g004
Figure 5. FTIR absorbance spectra registered from our plastics panel, and representation of their respective chemical skeletons.
Sustainability 15 09483 g005
Figure 6. Size analysis of the loose-fill plastic waste with aggregate size equivalence.
Sustainability 15 09483 g006
Figure 7. Evolution of meteorological parameters T a , o u t and G L O o u t during the first part of the measurement period.
Sustainability 15 09483 g007
Figure 8. Evolution of meteorological parameters T a , o u t and G L O o u t during the coldest week of the second part of the measurement period.
Sustainability 15 09483 g008
Figure 9. Evolution of the surface temperature of the ceiling during the first part of the measurement period.
Sustainability 15 09483 g009
Figure 10. Evolution of the surface temperature of the ceiling during the coldest week of the second part of the measurement period.
Sustainability 15 09483 g010
Figure 11. Evolution of the surface temperature of the ceiling for two days with the highest deviation (Top: 6 September 2020, and Bottom: 20 May 2021).
Sustainability 15 09483 g011
Figure 12. Evolution of the thermal gradient of the ceiling for the coldest day, i.e., with the lowest T a , o u t , M A X (4 September 2020).
Sustainability 15 09483 g012
Figure 13. Evolution of the thermal gradient of the ceiling during the day with the widest day/night range (2 September 2020).
Sustainability 15 09483 g013
Figure 14. Example of winter bioclimatic chart of Givoni for the winter period (period 3 in Figure 4).
Sustainability 15 09483 g014
Table 1. Thermal conductivity measurements from FP2C conductimeter.
Thermal Insulation MaterialThermal Conductivity [W/m.K]Apparent Density [g/cm 3 ]
Loose fill Plastic Waste (LFPW)0.022–0.0320.056
Cellulose wadding in bulk0.035–0.0410.023
Rock wool0.030–0.0400.016
Polyurethane foam0.021–0.0280.024
Table 2. Interpretation of the FTIR absorbance bands of the different plastics analyzed.
PlasticMain Characteristic Absorbance Bands
polyethylene (PE)2850–2915 cm 1 : ν ( C H ) s p 3
1425–1470 cm 1 : δ ( C H ) s p 3
718–728 cm 1 : r ( C H ) s p 3
polypropylene (PP)2838–2949 cm 1 : ν ( C H ) s p 3
1377–1460 cm 1 : δ ( C H ) s p 3
718–815 cm 1 : r ( C H ) s p 3
polyvinylchloride (PVC)2805–2950 cm 1 : ν ( C H ) s p 3
1325–1430 cm 1 : δ ( C H ) s p 3
680–830 cm 1 : r ( C H ) s p 3
630 cm 1 : ν ( C C l )
polystyrene (PS)3002–3095 cm 1 : ν ( C H ) a r o
2805–2950 cm 1 : ν ( C H ) s p 3
1449–1451 cm 1 : δ ( C H ) s p 3
1488 cm 1 : ν ( C = C ) a r o
1025–1251 cm 1 : δ ( C H ) a r o
744 cm 1 : r ( C H ) s p 3
690–902 cm 1 : δ ( C H ) a r o
Table 3. Summary of the thermal comfort study.
PeriodsClimate ConditionsGivoni Bioclimatic ZonesREF
(%)
LFPW
(%)
Deviation
(LFPW–REF)
(%)
Period 1
From 9 October to 10 April
SummerZone 1: with no change19190
Zone 2: with airspeed at 0.5 m/s2826−2
Zone 3: with airspeed at 1 m/s3230−2
Periods 2 and 4
From 11 April to 31 May
and
From 1 September to 8 October
Summer inter-season considerationsZone 1: with no change113−8
Zone 2: with airspeed at 0.5 m/s1914−5
Zone 3: with airspeed at 1 m/s2523−2
Winter inter-season considerationsZone 1: with no change133−10
Zone 2: with internal gains237−16
Zone 3: with passive solar heating2910−19
Period 3
From 1 June to 31 August
WinterZone 1: with no change159−6
Zone 2: with internal gains2923−6
Zone 3: with passive solar heating4237−5
Table 4. Summary of measurements in La Plaine des Cafres for different periods.
ParametersPeriodsDesignationAverageMinimumMaximum
Air temperature (C)From 17 July 2020 to 10 July 2021 T a , o u t 14.11.125.7
T a , R E F 16.7−2.138.9
T a , L F P W 16.1−1.434.0
Δ T a , ( R E F L F P W ) 0.7−4.319.7
Average deviation T a , ( R E F L F P W ) 1.2
Surface temperature (C)From 18 August 2020 to 10 September 2020
and
From 13 April 21 to 8 July 21
T s , c e i l i n g , R E F 15.61.539.9
T s , c e i l i n g , L F P W 13.11.327.3
Δ T s , c e i l i n g , ( R E F L F P W ) 2.5−6.122.2
Average deviation T s , c e i l i n g , ( R E F L F P W ) 3.2
Relative humidity (%)From 17 July 2020 to 10 July 2021 R H o u t 87.217.0100.0
R H R E F 75.125.399.9
R H L F P W 80.155.198.3
Δ R H ( R E F L F P W ) −5.0−44.576.6
Average deviation R H ( R E F L F P W ) 9.5
Disclaimer/Publisher’s Note: The statements, opinions and data contained in all publications are solely those of the individual author(s) and contributor(s) and not of MDPI and/or the editor(s). MDPI and/or the editor(s) disclaim responsibility for any injury to people or property resulting from any ideas, methods, instructions or products referred to in the content.