Abstract
Wetland ecosystems are essential for maintaining biological diversity and are significant elements of the global landscape. However, the biodiversity of wetlands has been significantly reduced by more than 50% worldwide due to the rapid expansion of urban areas and other human activities. The aforementioned factors have resulted in drastic antagonistic effects on species composition, particularly aquatic avifauna. The decline in wetland avifauna, which can be attributed to changes in water quality that impact aquatic habitats, is a major concern. In this study, we evaluated the impact of physicochemical parameters on aquatic avifauna in India’s first Conservation Reserve, a Ramsar site and an Important Bird Area. Water samples were collected on a monthly basis across nine different sites and various parameters, such as temperature, electrical conductivity, pH, biological oxygen demand, dissolved oxygen, total dissolved solids and salinity, were analyzed for pre-monsoon and post-monsoon seasons, while point count surveys were conducted to assess species richness and the density of waterbirds. Our findings show a positive correlation of species density with water temperature (r = 0.57), total dissolved solids (r = 0.56) and dissolved oxygen (r = 0.6) for pre-monsoon season and a negative correlation for dissolved oxygen (r = −0.62) and biological oxygen demand (r = −0.69) for post-monsoon season. We suggest that a synergistic effect of pH, salinity, biological oxygen demand and total dissolved solids may affect aquatic bird populations in Asan Conservation Reserve. Poor water quality was observed in a few sampling sites, which may negatively affect the number and density of waterbirds present. The findings of this study emphasize the importance of water quality in wetland conservation, particularly for aquatic avifauna.
1. Introduction
Wetlands are found in all shapes and sizes throughout the world, ranging from swamps, marshes and bogs to large coastal mudflats [1]. Often described as the ‘kidneys of the earth’, these unique ecosystems play a crucial role in maintaining the water quality and filtering the waste materials of the landscape. Apart from that, wetlands provide a wide range of ecosystem services, such as sequestering carbon, controlling floods, biodiversity management, groundwater recharge and fish production, to name a few [2]. Wetlands cover about 5–10% of the world and are a major part of freshwater ecosystems, which host countless species of birds, mammals, amphibians, reptiles and invertebrates. However, recent changes in climatic conditions coupled with various other anthropogenic factors have resulted in drastic changes in species composition and loss in global wetland systems [3]. According to the Millennium Ecosystem Assessment [4], the biodiversity of inland water systems, which includes rivers, wetlands and large water bodies such as lakes, has declined by more than 50% globally.
Wetlands of international importance are classified as Ramsar Sites under the Ramsar Convention, an intergovernmental treaty for the conservation and sustainable use of wetlands [5]. Monitoring Ramsar Sites is essential to assess their ecological status and ensure their effective management [6]. Remote sensing and GIS-based systems have turned out to be valuable tools for the monitoring and management of Ramsar Sites worldwide [7]. These technologies enable the collection, analysis and visualization of spatial data, thus contributing to an improved understanding and decision-making processes. The Ramsar network, including programs and services such as Globwetland II, POLWET and the Ramsar portal, utilize remote sensing and GIS-based systems to facilitate the monitoring and assessment of Ramsar Sites [8].
Notably, the organisms that thrive in wetland ecosystems depend on the availability of clean water for their survival [9]. The impact of human-induced perturbation on water quality affects these species, which are adapted to specific habitats [10]. Water quality changes can have cumulative impacts on wetlands; for instance, changes in macroinvertebrate communities can indicate a major alteration in wetland water quality [9,10,11]. Declines in herbivore, fish-eating and other waterbirds were also found to be associated with changes in water quality in Caisang Lake, Hunan Province [12]. Long-term declines were even found in Murray–Darling Basin for abundant, functional response groups such as piscivores and individual waterbird species due to changes in the cumulative annual flow of water [13]. Furthermore, the concentration of nutrients may be altered when adjacent sites located close to the wetlands are used for agriculture, urbanization, discharge of industrial effluents and land reclamation activities [14]. These anthropogenic factors have been shown to increase the concentration of macronutrients and pollutants such as nitrogen, phosphorous, iron, organic matter, total dissolved solids (TDSs), chloride, sulphate, sodium, naphthenic acid and boron in the affected wetlands [15]. Further, high levels of such nutrients can result in eutrophication and harmful algal blooms, which can reduce the oxygen levels in the water and lead to fish mortality [15]. Additionally, pollutants such as heavy metals and pesticides can accumulate in the tissues of wetland fauna, leading to long-term health effects, and can even have cascading impacts on the trophic system [16]. Changes in water quality can also indirectly affect wetland fauna through alterations in food availability, predator–prey relationships and habitat structure. Overall, the impacts of water quality on wetland fauna are complex and can affect an entire community or wipe out specific taxa. Therefore, considering this, it is crucial to study the effects of these changes on the community structure of wetland ecosystems [17] and manage the water quality to ensure conservation and sustainable use of wetland ecosystems [13]. Aquatic birds, especially waterfowl, are very sensitive to environmental changes [18], and act as indicators of wetland health [19,20,21]. Importantly, physicochemical parameters play a critical role in shaping aquatic bird habitats [22]. Thus, maintaining high-quality habitats through effective management is a critical issue in waterbird conservation [22,23,24,25]. Aquatic birds such as waterfowl and waders require sufficient nesting, roosting, foraging and wintering habitats for their survival [23,26,27]. Therefore, understanding physicochemical parameters is essential for the conservation and management of wetland ecosystems, particularly those that support aquatic bird populations [28].
Considering the aforementioned challenges, the current study was proposed and conducted in the Asan Conservation Reserve (ACR), a recently declared Ramsar site in the state of Uttarakhand, India. Unfortunately, rapid urbanization around the wetland, agricultural practices such as the use of pesticides, sand mining and run-offs from nearby point sources have deteriorated the water quality and indirectly taken a toll on the waterbirds that thrive in this wetland. Therefore, the present study aimed to address the following major objectives: (i) assess the physicochemical parameters of water and (ii) analyze the effects of pre-monsoon and post-monsoon variations in water quality on the diversity of aquatic avifauna. The study’s findings are expected to provide a foundation for managing this Ramsar site and Conservation Reserve, particularly in terms of improving water quality.
2. Materials and Methods
Study Area
The Asan Conservation Reserve (30°26′09″ N and 77°39′56″ E) is located near the confluence of the Asan and Yamuna rivers in Doon Valley, Uttarakhand, India (Figure 1). This magnificent man-made reservoir was designated as India’s first Conservation Reserve in 2005 and Uttarakhand’s first Ramsar site in 2020. Covering an area of approximately 4 km2, the ACR attracts about 5040 waterbirds each year [29] and provides a suitable habitat for local and migratory avifauna. Being an Important Bird Area (IBA) in the state, the wetland supports over 358 species of birds [30], including the critically endangered red-headed vulture (Sarcogyps calvus), slender-billed vulture (Gyps tenuirostris) and white-rumped vulture (Gyps bengalensis), with infrequent records of Baer’s pochard (Aythya baeri) [31,32,33]. According to Kaushik and Gupta [34], ruddy shelduck (Tadorna ferruginea) is the most dominant waterfowl in the reserve, followed by Eurasian coot (Fulica atra), red-crested pochard (Netta rufina), common pochard (Aythya ferina) and mallard (Anas platyrhynchos). Other non-avian species include 49 fish species, 1 of them being the critically endangered golden mahseer (Tor putitora) [35], https://rsis.ramsar.org/ris/2437 (accessed on 31 May 2023). The wetland is surrounded by natural vegetation, Eucalyptus plantation, agricultural lands and human settlements. The natural vegetation in the wetland includes floating, submerged and riparian species. The vegetation of the ACR is predominantly composed of wetland and aquatic plants, including species such as Typha domingensis Pers., Phragmites karka (Retz.) Trin. ex Steud., Arundo donax L., Saccharum spontaneum L., S. bengalense Retz., Ipomoea carnea Jacq., and Eichhornia crassipes (Mart.) Solms., Nymphaea nouchali Burm.f. and Hydrilla verticillata (L.f.) Royle. These plants provide food, shelter and nesting sites for a variety of avifauna. The wetland also supports a number of terrestrial tree species, such as Senegalia catechu (L.f.) P.J.H.Hurter & Mabb., Dalbergia sissoo Roxb. ex-DC., Mallotus nudiflorus (L.) Kulju & Welzen and Bombax ceiba L. The wetland acts as a natural filter, trapping pollutants and nutrients and helping to maintain the water quality of the Yamuna River. The wetland also acts as a natural sponge, absorbing excess rainfall and reducing the risk of flooding in downstream areas. The designation of the ACR as a Ramsar site highlights the importance of this wetland as a critical habitat for a wide range of avifauna and an important provider of ecosystem services. The protection and conservation of this wetland are essential for the continued survival of these bird species and the maintenance of the ecological health of the region.
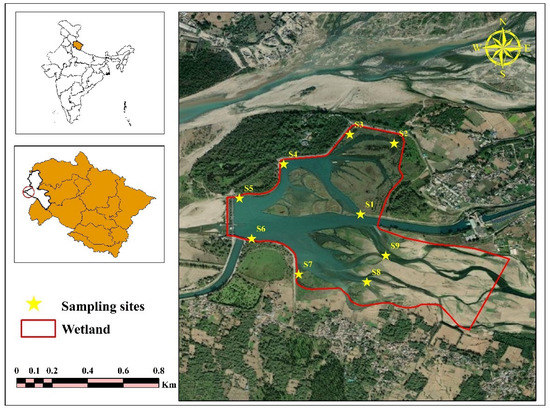
Figure 1.
Map showing location of the Asan Conservation Reserve, Uttarakhand, India, along with sampling sites.
3. Methodology
3.1. Site Selection
The reserve comprises microhabitats of fresh running to stagnant water, islands, riverine habitats and swamp areas. Considering the different habitat characteristics of the wetland, sampling sites were specifically selected to cover the entire wetland. Thus, based on the presence of sewage discharge sources, human settlements and land use/land cover patterns, nine different sites were found feasible for collecting water samples in the ACR (Table 1).

Table 1.
Sampling sites in the Asan Conservation Reserve and their habitat characteristics.
3.2. Land Use and Land Cover (LULC)
In order to understand the LULC pattern of the ACR, the World Geodetic System (WGS) 1984 (datum 43 zones) and the Universal Transverse Mercator (UTM) coordinate system were used to rectify satellite data and toposheets using ERDAS software. Arc-GIS 10.3 software was also used for atmospheric and radiometric correction of satellite data. The satellite imagery was classified by assigning per-pixel signatures and categorizing them into land use types based on the origin of the exact digital number (DN) value of various landscape basics [36]. Sentinel-2 data were used to create a land use/land cover (LULC) map by determining the spectral signature of earth surface features. For better accuracy, a support vector machine (SVM) technique was used. The classification accuracy of SVM was 85% and the Kappa coefficient (k) was 0.87. Thus, dense forest, open forest, submerged vegetation, agricultural land, riverbed and water zone were identified as different LULC classes in the ACR (Figure 2).
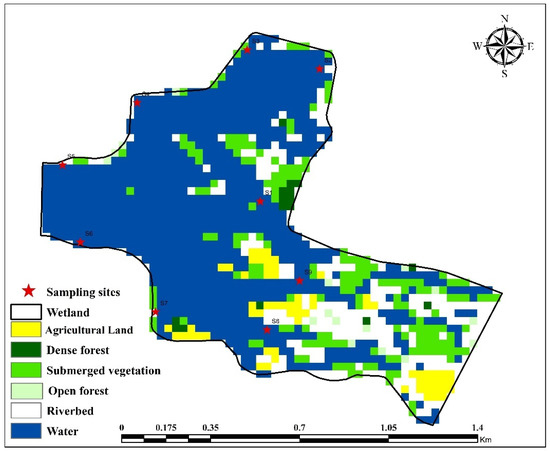
Figure 2.
Map showing LULC patterns of Asan Conservation Reserve.
3.3. Water Quality Analysis
In this study, the physicochemical parameters of water were examined during the pre-monsoon and post-monsoon seasons over two consecutive years (2021 and 2022) in the ACR. Water samples were collected from nine distinct locations in the wetland during March, April and May (pre-monsoon) and October, November and December (post-monsoon). The parameters analyzed included potential of hydrogen (pH), electrical conductivity (EC), dissolved oxygen (DO), biological oxygen demand (BOD), total dissolved solids (TDSs) and salinity, following the methods described by Bassi et al. and the American Public Health Association standard (APHA) [37,38]. The samples were collected in acid-soaked (5% HNO3) and rinsed polypropylene bottles and kept at 40 °C prior to laboratory analysis. DO and pH were measured on-site, while the remaining parameters were assessed in the laboratory. Thematic maps depicting the spatial distribution of the studied parameters were generated using the inverse distance weighted (IDW) technique using ArcGIS 10.3 [39].
3.4. Waterbird Survey
The field surveys for waterbirds were conducted across two seasons, viz., pre-monsoon (March–May) and post-monsoon (October–December), in 2021 and 2022 (Figure 3). In order to determine any changes in community assemblages with respect to water quality, we investigated the wetland for the presence of waterfowl and other water-dependent bird species. Water sampling and point counts for the bird survey were carried out in the same place, and the distance between any two locations was approximately 100 m. With the aid of 10 × 50 magnification binoculars, bird observations were conducted. In addition to the field survey, pre-monsoon and post-monsoon ebird data were also extracted. Furthermore, the species were classified in different groups based on their feeding habits: Group 1. Divers such as grebes (Podicipedidae), cormorants (Phalacrocoracidae) and moorhens and coots (Rallidae); Group 2. Ducks (Anatidae); Group 3. Waders such as herons and egrets (Ardeidae), storks (Ciconiidae), ibises (Threskiornithidae), stilts (Recurvirostridae), lapwing and plovers (Charadriidae) and sandpipers (Scolopacidae); Group 4. Kingfishers (Alcedinidae) and gulls and terns (Laridae); and Group 5. Marsh or swamp-dependent birds such as crakes, rails and swamphens (Rallidae).
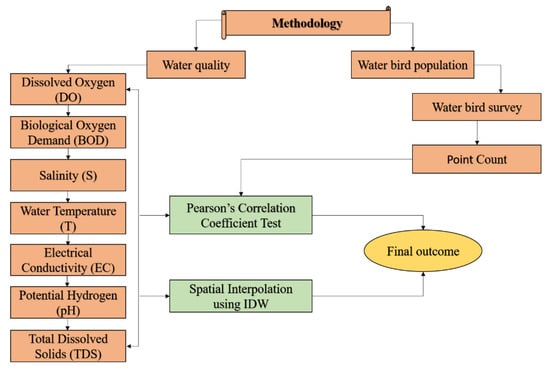
Figure 3.
Methodological framework used in the current study.
3.5. Data Analysis
The finalized dataset of waterbirds was assessed for species richness and density (species per km2) for the pre-monsoon and post-monsoon seasons. A comparative analysis of species richness and density was carried out for the different groups of birds that were classified based on feeding guilds. Furthermore, to determine the probable relationship of various physicochemical parameters of water with aquatic avifauna, a Pearson correlation coefficient test was performed. The statistical tests and analyses were performed in Microsoft Excel and R (Version 4.2.3).
4. Results and Discussion
Based on the thematic maps and extensive field observations of aquatic avifauna of the wetland, the results show significant changes in the seasonal pattern of avifauna with respect to water quality. During the post-monsoon season, dissolved oxygen, pH and temperature were positively correlated with avifauna species richness and density. However, during the pre-monsoon season, the opposite was observed, with dissolved oxygen, pH and temperature having a negative effect. Results on the analysis of the physicochemical parameters of water examined during the pre-monsoon and post-monsoon season are discussed in detail.
4.1. pH and Electrical Conductivity
The aquatic flora and fauna depend on the pH of water in rivers, lakes and wetlands [38]. Most animals cannot survive in either highly acidic, i.e., a pH less than 5.0, or highly basic, i.e., a pH higher than 7.0, environments [40]. The current study revealed that during the pre-monsoon season, the pH ranged between 5.77 and 10.02, while the pH ranged between 6.0 and 9.32 during the post-monsoon season. (Figure 4). The pH was highly alkaline in most of the studied sampling sites, such as S9 (10.4), S8 (9.8), S6 (9.1) and S3 (10.4), during the pre-monsoon season, and in S9 (10) and S8 (9.1) during the post-monsoon season. The pH was recorded as 5.7 in S1 and 6.0 in S2 during the pre-monsoon season and 6.1 in S1 and 6.5 in S2 in the post-monsoon season, showing these locations’ acidic nature.
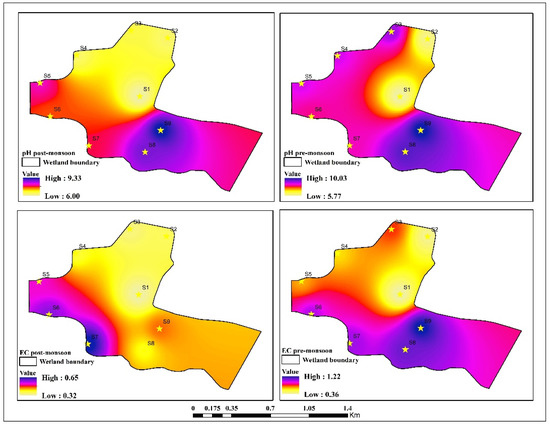
Figure 4.
Thematic map of pH and electrical conductivity in pre- and post-monsoon seasons (★ denotes sampling sites).
Electrical conductivity, expressed in μmho/cm, is a measurement of the capacity of water to carry electrical current [41]. Conductivity is a cation measurement that has a significant impact on the taste of water. It is used as a proxy for total dissolved solids (TDSs). In the present study, the EC of the wetland during the pre-monsoon season fluctuated between 0.3 and 1.21 μmho/cm. On the other hand, the range was recorded to be between 0.34 and 0.64 μmho/cm in the post-monsoon season (Figure 4). According to Whigham and Thomas [39], the permissible limit of EC for drinking water is less than 250 μmho/cm. The present study revealed very low conductivity (0.3–1.2 μmho/cm) across the sampling sites of the ACR. One probable reason for this low conductivity could be attributed to the release of organic contaminants, such as pesticides from agricultural fields, into the wetland from adjoining areas, viz., S1, S2, S3 and S4. Low conductivity may indicate that the wetland is isolated from surrounding watersheds and has limited inputs of nutrients and organic matter. This could limit the productivity of the ecosystem and impact the growth and survival of certain species [42]. Furthermore, another plausible reason for the low conductivity in the ACR is temperature fluctuations, as also suggested by Brevik et al. [43].
4.2. Biological Oxygen Demand (BOD) and Dissolved Oxygen (DO)
BOD and DO levels are inversely related; hence, a decrease in DO levels indicates a high amount of BOD. BOD is an indirect indicator of the biodegradability of water. The BOD of water and wastewater is defined as the volume of molecular oxygen necessary for aerobic oxidative activity to stabilize decomposable organic matter in water. The oxidation of organic materials in river waters boosts the BOD level. In the present study, the BOD ranged between 1.8 and 8.3 mg/L in the pre-monsoon season and from 5.4 to 10.2 mg/L in the post-monsoon season (Figure 5). According to WHO [44], the maximum permissible BOD of drinking water is 2.0 mg/L, whereas the BOD level in the water of the ACR was exceptionally high at 10.2 mg/L, indicating that the wetland is moderate to severely contaminated. Higher BOD levels indicate that more oxygen is required, which suggests that there are fewer oxygen-demanding species to feed on and therefore water quality is poorer. High levels of BOD have the same effects as low levels of DO, which may lead to aquatic animals experiencing stress, suffocation and sometimes death.
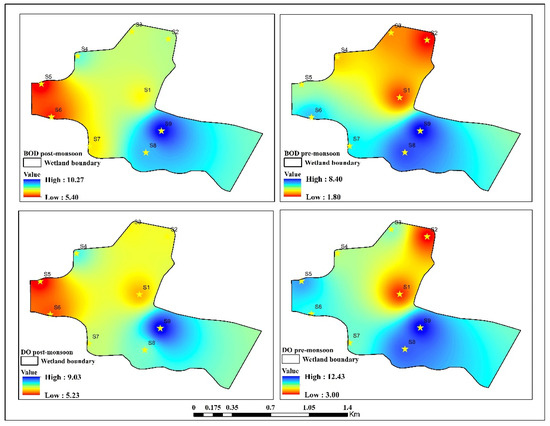
Figure 5.
Thematic map of biological oxygen demand and dissolved oxygen in pre- and post-monsoon seasons (★ denotes sampling sites).
The physical, chemical and biological factors of a water body influence the concentration of DO. The concentration of DO is inversely proportional to the temperature; hence, as temperature increases, the concentration of DO decreases accordingly. Our results show that the DO in the pre-monsoon season ranged between 3.0 and 12.4 mg/L, while it ranged from 5.2 to 9.0 mg/L in the post-monsoon season (Figure 5). As per WHO [44], the maximum DO level permissible in drinking water is greater than 5.0 mg/L. In the present study, DO was reported to be 10.5, 8.8, 7.0, 10.3 and 12.4 mg/L at sites S5–S9 in the pre-monsoon season, respectively, whereas it was recorded as 7.5, 8.3 and 9.0 mg/L at sites S7–S9, respectively, in the post-monsoon season, indicating no pollution load with high oxygen content. Interestingly, sampling sites such as S1–S4 had lower concentrations of DO in both the pre- and post-monsoon seasons, indicating that they may be polluted, particularly near the human settlements and confluence of wetlands and rivers.
4.3. Total Dissolved Solids (TDSs) and Salinity
TDS refers to the amount of minerals, organic materials and salts dissolved in the water. The majority of solids in natural waters are carbonate, bicarbonate, sulphate, chloride, iron, phosphate, calcium, magnesium and nitrate. In the current study, the concentration of TDSs varied between 195 and 636 mg/L for the pre-monsoon season, whereas it ranged between 131.3 and 306.4 mg/L in the post-monsoon season (Figure 6). As per WHO [44] standards, the reported range fluctuates around the permissible limit of 600 mg/L. Our results show that the overall TDSs fluctuated around the permissible limit in both seasons. However, sites such as S6 (610 mg/L), S8 (622 mg/L) and S9 (636.6 mg/L) revealed a high concentration of TDSs in the pre-monsoon season. This may be attributed to anthropogenic disturbances such as the discharge of domestic and household wastes. TDS levels above a certain threshold suggest the existence of toxic minerals, which can be harmful to aquatic organisms [45].
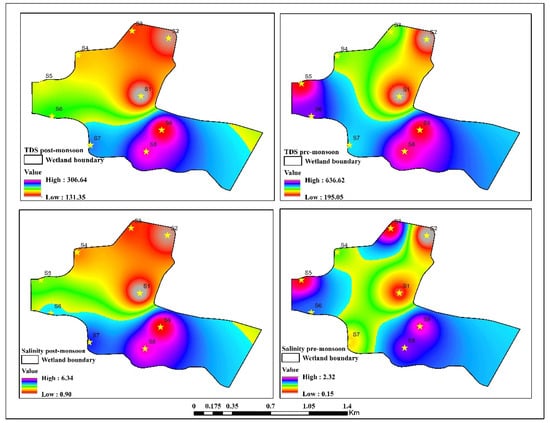
Figure 6.
Thematic map of TDSs and salinity in pre- and post-monsoon seasons (★ denotes sampling sites).
Salinity is a measure of the concentration of salts in water. According to WHO [44], the maximum salinity level allowed in rivers and lakes is 500 mg/L. In this study, salinity in the pre- and post-monsoon seasons ranged between 0.15 and 2.3 mg/L and 0.9 and 6.3 mg/L, respectively (Figure 6). The low salinity of the ACR could have negative impacts on the wetland ecosystem, particularly due to excessive groundwater pumping or diversion of freshwater sources, as also suggested by Green et al. [46]. It can also lead to changes in water chemistry and the loss of salt-tolerant species that are important for maintaining the ecological balance of the wetland [47].
4.4. Waterbird Population
Based on extensive field excursions conducted during the pre- and post-monsoon seasons and ebird data, a total of 55 waterbird species were recorded in the ACR. Among the recorded species, 50 species are listed as ‘Least Concern’, whereas the falcated duck (Mareca falcata), ferruginous pochard (Aythya nyroca), painted stork (Mycteria leucocephala) and river lapwing (Vanellus duvaucelii) are listed as ‘Near-Threatened’, and the Asian woolly necked stork (Ciconia episcopus) is listed as ‘Vulnerable’ in the different threat categories of the IUCN. Most recorded species belong to the Anatidae family (20 species), followed by Ardeidae (9 species), Rallidae (5 species), Alcedinidae (5 species) and Scolopacidae (3 species) (Figure 7). Based on the feeding guilds, it was observed that ducks and waders, with 20 and 19 species, respectively, were the dominant groups in the ACR (Figure 8). Our results show that the species richness was lower in the year 2022 (42 for pre-monsoon and 43 for post-monsoon) as compared to 2021 (47 species in each season; Figure 9).
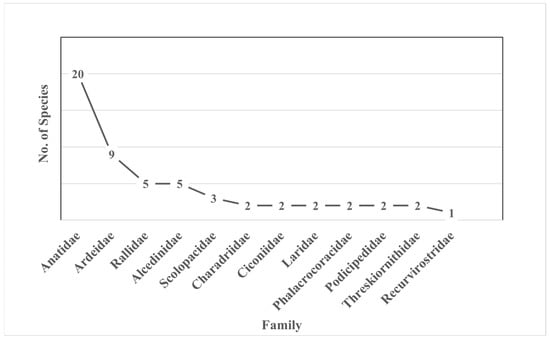
Figure 7.
Number of waterbird species across different families in ACR.
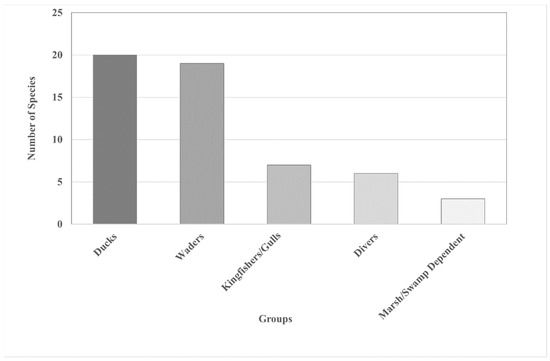
Figure 8.
Distribution of bird groups based on feeding guilds in ACR.
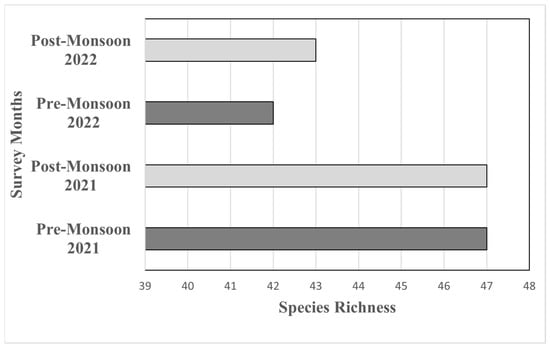
Figure 9.
Species richness in pre- and post-monsoon seasons in ACR.
Year-wise, the species density was higher in the year 2022 (72.86 ± 3.37) as compared to 2021 (62.32 ± 2.36). Seasonally, the highest bird density recorded was 55.28 ± 2.84 during the post-monsoon season in 2022, whereas the lowest density (17.57 ± 0.53) was recorded in the pre-monsoon season of 2022. Species density was higher in the post-monsoon seasons of 2021 (42.22 ± 1.75) and 2022 (55.28 ± 2.84) as compared to the pre-monsoon seasons of 2021 (20.09 ± 0.60) and 2022 (17.57 ± 0.53), indicating an influx of winter migrants during the months of October to December in the wetland (Table 2).
Table 2.
Species density across different seasons in 2021 and 2022.
Based on feeding guilds, the study revealed that ducks had the highest species density (24.33 ± 1.63 and 33.41 ± 2.93), followed by divers (11.85 ± 3.51 and 16.11 ± 5.24) in the post-monsoon seasons of 2021 and 2022. Interestingly, the density of waders, kingfishers/gulls and marsh-/swamp-dependent species remained fairly similar across the seasons. This could be attributed to the few migrating species that overwinter in the wetland. Furthermore, short-distance migrants as well as residents also use the wetland for a longer period of time after the post-monsoon season. This could be another plausible reason for the similarity in the occurrence of waders, kingfishers/gulls and marsh-/swamp-dependent species across different seasons (Table 3).
Table 3.
Species density of different bird groups across different seasons in 2021 and 2022.
Based on the Pearson correlation coefficient test, a strong positive correlation (r = 0.6) was observed between dissolved oxygen (DO) and species density, followed by water temperature (r = 0.57) and total dissolved solids (TDSs) (r = 0.56) (Figure 10). The positive correlation between the dissolved oxygen and species density of waterbirds in the ACR could be attributed to the fact that higher levels of dissolved oxygen support a healthier and more productive aquatic ecosystem. Adequate dissolved oxygen in the water allows for the survival of a diverse range of aquatic organisms, including the food sources of waterbirds. Similar findings were reported by Hazra et al. [48], where dissolved oxygen showed a significant positive correlation with the abundance of waterbirds in tropical wetlands of Kolkata, India. Water temperature also exhibited a positive association with species density, suggesting that waterbirds may tend to utilize different parts of the wetland based on temperature fluctuations. Although water depth was not considered as a part of this study, Yetis et al. [49] reported that waterbird abundance is higher in shallower areas where water temperature is lower. While the study did not specifically predict the association of water temperature with each group of waterbirds, such as ducks and waders, a strong correlation between species density and water temperature suggests a potential relationship between these two factors in the ACR. Waterbirds, such as ducks, herons and egrets, mainly rely on aquatic organisms, including fish, amphibians and invertebrates, as their primary food source and therefore may have a crucial role in determining the abundance and distribution of these prey species. Warmer water temperatures can enhance biological activity, increasing the availability of food resources for waterbirds, and lead to higher species densities in specific regions of the wetland [50].
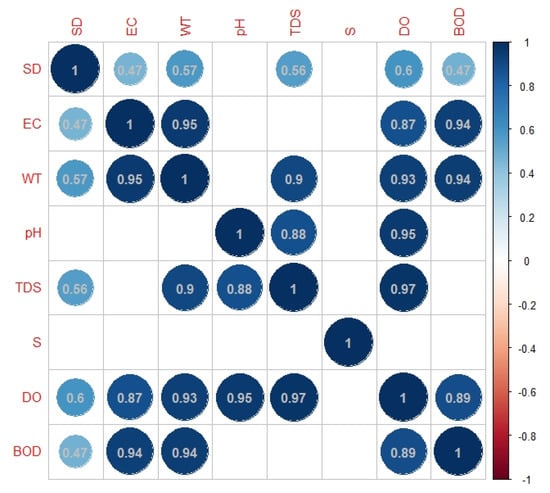
Figure 10.
Relationships between various physicochemical parameters of water in pre-monsoon season.
Furthermore, species density was moderately associated with electrical conductivity (EC) (r = 0.47) during the pre-monsoon season, which may indicate that waterbirds tend to use areas of wetland that are rich in dissolved salts and minerals. The presence of dissolved salts is associated with higher nutrient levels in wetlands, leading to enhanced productivity and availability of aquatic plants, phytoplankton and other prey organisms, thereby attracting more waterbirds during winter. Notably, the negative association between species density, dissolved oxygen (DO) and biochemical oxygen demand (BOD) (r = −0.62 and −0.69, respectively) observed during the post-monsoon season (Figure 11) may imply high levels of BOD in the ACR, which may further indicate the presence of organic pollutants. Factors such as industrial discharges, agricultural run-off or sewage can also introduce excessive nutrients and organic matter into the water.
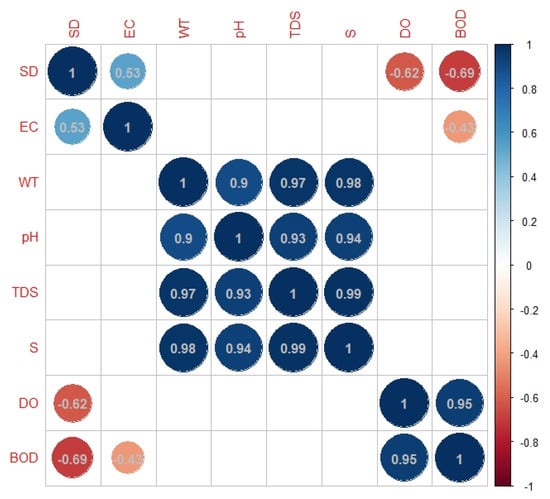
Figure 11.
Relationship between various physicochemical parameters of water in post-monsoon season.
During the pre-monsoon season, a positive correlation was observed between water temperature and EC (r = 0.95), TDSs (r = 0.9), DO (r = 0.93) and BOD (r = 0.94) (Figure 10). Additionally, during the post-monsoon season, water temperature was positively correlated with pH (r = 0.9), TDSs (r = 0.97) and salinity (r = 0.98). Therefore, overall water quality parameters such as EC, water temperature, DO and BOD may determine how the species density of waterbirds in the wetland is affected. Similar relationships between species richness and abundance and water quality parameters such as pH, EC, water temperature and DO have also been documented by Thapa and Saund [50], Sulai et al. [51] and Yetis et al. [49]. An additional potential factor, independent of human-induced alterations in the wetland surroundings, may be attributed to the impact of aquatic avifauna. Specifically, the excrement of waterbirds facilitates the release of nutrient compounds such as nitrogen and phosphorus into the water, thereby augmenting the nutrient enrichment within the wetland ecosystem [52,53].
While this study aims to provide insight into the changes in water quality parameters and their implications for wetland-dependent avifauna, a strong relationship between the waterbirds and various water quality parameters could not be concluded from the results obtained. However, significant hikes in the pollution load of certain parameters, such as BOD and TDSs, in specific areas of the wetland were detected, indicating a rise in gradual contamination of the water in this newly designated Ramsar site. Furthermore, the species richness was lower in 2022 as compared to 2021. While the decrease in the species richness of waterbirds could be related to a multitude of challenges migrating waterbirds face on their way to wintering grounds (destruction of stop-over areas, climate change, hunting and illegal trade, disturbance and human activities, predation and diseases), maintenance of wetland water quality is an important factor for waterbird survival [23]. A long-term assessment of the water quality parameters coupled with seasonal surveys of waterbirds is necessary to accurately predict the impact of water quality parameters on the waterbirds in the ACR. Furthermore, monitoring of the ACR via remote sensing in order to understand habitat suitability for waterbirds within the wetland can be useful in predicting future implications for avifauna within the wetland [54,55,56]. The role of machine learning, specifically deep learning techniques, in assessing biophysical parameters of water is crucial to understand environmental quality. These algorithms can analyze large datasets and extract valuable insights, enabling accurate assessment of parameters such as temperature, pH levels, turbidity and nutrient concentrations. The integration of machine learning with sensor networks and IoT devices allows for real-time monitoring and predictive modeling, supporting effective environmental management strategies. Such advancements offer promising avenues for informed decision making and protecting water resources and ecosystems [57,58].
5. Conclusions
The present study highlights the role of the Asan wetland, as a Ramsar site and Conservation Reserve, in providing a sanctuary for numerous migrating waterbirds along the Central Asian Flyaway. The wetland faces threats from various sources, such as domestic waste discharge, human activities and pollution. The presence of pharmaceutical factories near the catchment area has also resulted in the dumping of harmful effluents into the Asan River, while non-point sources of pollution, such as pesticides and fertilizers, have contributed to nutrient imbalances within the wetland. Our findings indicate a possibility of contamination of water with increases in the concentration of parameters such as BOD (S8—9 mg/L, S9—10.27 mg/L) and TDSs (S6—610 mg/L, S8—622 mg/L, and S9—636.6 mg/L). These sites are close to the area where the Asan as well as the Tons River converge into the wetland.
Our findings further indicate that water quality may have an influence on the breeding and migratory waterbirds that use large parts of the wetland for their survival. The dependency of species density on different water quality parameters, such as DO (r = 0.6 in pre-monsoon season, r = −0.62 in post-monsoon season), BOD (0.47 in pre-monsoon season, r = −0.69 in post-monsoon season), water temperature (r = 0.57 in pre-monsoon season) and TDSs (r = 0.56 in pre-monsoon season), is indicative of their effects on waterbird survival and their use of habitat. The wetland is further threatened by the presence of invasive alien species and weeds, including Lantana camara, Mesosphaerum suaveolens, Parthenium hysterophorus, Pontederia crassipes and Eupatorium adenophorum, which pose a significant risk to the wetland’s natural vegetation. Additionally, unsustainable tourism practices and illegal bio-mass harvesting, particularly wood extraction, further jeopardize the wetland’s sustainability. To ensure the long-term viability of the wetland and its associated avifauna populations, it is crucial good water quality is maintained through effective management strategies. This study underscores the importance of continuous monitoring of the wetland over multiple seasons to assess changes and implement appropriate mitigation measures. Quantitative results reveal specific contamination levels at different sampling sites, emphasizing the urgent need for targeted interventions in areas of higher pollution. To address the multiple risks that the Asan wetland faces, a collaborative strategy including stakeholders, locals and authorities is required. The preservation of this habitat, which is invaluable for both residents and migratory bird populations, can be achieved by applying sustainable management practices, raising awareness about the ecological importance of the wetland and imposing tough legislation to battle pollution and invasive species.
Author Contributions
A.P.M.: original draft preparation, water quality analysis, field data collection and GIS analysis; S.K.: original draft preparation and bird data collection; R.P.: original draft preparation and bird data collection; A.K.: supervision, technical input and review; H.S.: original draft preparation and GIS and statistical analysis; N.C.: conceptualization, field data collection and data analysis; C.B.P.: technical input and review, writing—review and editing. F.A.: writing—review and editing, Funding. All authors have read and agreed to the published version of the manuscript.
Funding
Abdullah Alrushaid Chair for Earth Science Remote Sensing Research at King Saud University, Riyadh, Saudi Arabia.
Institutional Review Board Statement
Not applicable.
Informed Consent Statement
Not applicable.
Data Availability Statement
Data can be made available on request.
Acknowledgments
The authors extend their appreciation to Abdullah Alrushaid Chair for Earth Science Remote Sensing Research for funding.
Conflicts of Interest
The authors declare no conflict of interest.
References
- Fraser, L.H.; Keddy, P.A. (Eds.) The World’s Largest Wetlands: Ecology and Conservation; Cambridge University Press: Cambridge, UK, 2005. [Google Scholar] [CrossRef]
- Keddy, P.A.; Fraser, L.H.; Solomeshch, A.I.; Junk, W.J.; Campbell, D.R.; Arroyo, M.T.; Alho, C.J. Wet and wonderful: The world’s largest wetlands are conservation priorities. BioScience 2009, 59, 39–51. [Google Scholar] [CrossRef]
- Davidson, N.C.; Finlayson, C.M. Extent, regional distribution and changes in area of different classes of wetland. Mar. Freshw. Res. 2018, 69, 1525–1533. [Google Scholar] [CrossRef]
- MA Condition Working Group. Appendix D—Glossary. In Current State & Trends Assessment; The Millennium Ecosystem Assessment: Washington, DC, USA, 2005. [Google Scholar]
- Gardner, R.C.; Davidson, N.C. The Ramsar convention. In Wetlands; Springer: Berlin/Heidelberg, Germany, 2011; pp. 189–203. [Google Scholar]
- Gaget, E.; Le Viol, I.; Pavón-Jordán, D.; Cazalis, V.; Kerbiriou, C.; Jiguet, F.; Popoff, N.; Dami, L.; Mondain-Monval, J.; du Rau, P.D.; et al. Assessing the effectiveness of the Ramsar Convention in preserving wintering waterbirds in the Mediterranean. Biol. Conserv. 2020, 243, 108485. [Google Scholar] [CrossRef]
- Weise, K.; Paganini, M.; Wolf, B.; Fitoka, E.; Hansen, H.; Bonino, E.; van Valkengoed, E. GlobWetland II-The new Opportunities with Sentinel-2 for Wetland Mapping and Monitoring. In Proceedings of the First Sentinel-2 Preparatory Symposium, Frascati, Italy, 23–27 April 2012; Volume 707, p. 5. [Google Scholar]
- Dabrowska-Zielinska, K.; Bartold MGurdak, R. POLWET—System for new space-based products for wetlands under RAMSAR Convention. Geoinf. Issues 2016, 8, 25–35. [Google Scholar] [CrossRef]
- Fretwell, J.D. National Water Summary on Wetland Resources; US Government Printing Office: Washington, DC, USA, 1996; Volume 2425. [Google Scholar]
- Lougheed, V.L.; Crosbie, B.; Chow-Fraser, P. Predictions on the effect of common carp (Cyprinus carpio) exclusion on water quality, zooplankton, and submergent macrophytes in a Great Lakes wetland. Can. J. Fish. Aquat. Sci. 1998, 55, 1189–1197. [Google Scholar] [CrossRef]
- Riens, J.R.; Schwarz, M.S.; Mustafa, F.; Hoback, W.W. Aquatic Macroinvertebrate Communities and Water Quality at Buffered and Non-Buffered Wetland Sites on Federal Waterfowl Production Areas in the Rainwater Basin, Nebraska. Wetlands 2013, 33, 1025–1036. [Google Scholar] [CrossRef]
- Wang, W.; Fraser, J.D.; Chen, J. Distribution and Long-Term Population Trends of Wintering Waterbirds in Poyang Lake, China. Wetlands 2019, 39, 125–135. [Google Scholar] [CrossRef]
- Kingsford, R.; Biggs, H.C.; Pollard, S.R. Strategic Adaptive Management in freshwater protected areas and their rivers. Biol. Conserv. 2011, 144, 1194–1203. [Google Scholar] [CrossRef]
- Mishra, A.P.; Khali, H.; Singh, S.; Pande, C.B.; Singh, R.; Chaurasia, S.K. An Assessment of In-situ Water Quality Parameters and its variation with Landsat 8 Level 1 Surface Reflectance datasets. Int. J. Environ. Anal. Chem. 2021, 1–23. [Google Scholar] [CrossRef]
- Begum, A. Harikrishnarai Study on the Quality of Water in Some Streams of Cauvery River. E-J. Chem. 2008, 5, 377–384. [Google Scholar] [CrossRef]
- Wenger, A.S.; Fabricius, K.E.; Jones, G.P.; Brodie, J.E. Sedimentation, eutrophication and pollution: Effects on coral reef fishes. In Ecology of Fishes on Coral Reefs: The Functioning of an Ecosystem in a Changing World; Cambridge University Press: Cambridge, UK, 2015; pp. 145–153. [Google Scholar]
- Dunson, W.A.; Travis, J. The Role of Abiotic Factors in Community Organization. Am. Nat. 1991, 138, 1067–1091. [Google Scholar] [CrossRef]
- Mishra, A.P.; Singh, R. Physico-chemical characteristics of Asan wetland with reference to Avian and Molluscan diversity, Doon Valley (Uttarakhand), India. Int. Res. J. Environ. Sci. 2019, 8, 1–11. [Google Scholar]
- Ogden, J.C.; Baldwin, J.D.; Bass, O.L.; Browder, J.A.; Cook, M.I.; Frederick, P.C.; Frezza, P.E.; Galvez, R.A.; Hodgson, A.B.; Meyer, K.D.; et al. Waterbirds as indicators of ecosystem health in the coastal marine habitats of southern Florida: 1. Selection and justification for a suite of indicator species. Ecol. Indic. 2014, 44, 148–163. [Google Scholar] [CrossRef]
- Chatterjee, A.; Adhikari, S.; Pal, S.; Mukhopadhyay, S.K. Foraging guild structure and niche characteristics of waterbirds wintering in selected sub-Himalayan wetlands of India. Ecol. Indic. 2020, 108, 105693. [Google Scholar] [CrossRef]
- Sun, X.; Shen, J.; Xiao, Y.; Li, S.; Cao, M. Habitat suitability and potential biological corridors for waterbirds in Yancheng coastal wetland of China. Ecol. Indic. 2023, 148, 110090. [Google Scholar] [CrossRef]
- Weber, L.M.; Haig, S.M. Shorebird Use of South Carolina Managed and Natural Coastal Wetlands. J. Wildl. Manag. 1996, 60, 73. [Google Scholar] [CrossRef]
- Ma, Z.; Cai, Y.; Li, B.; Chen, J. Managing Wetland Habitats for Waterbirds: An International Perspective. Wetlands 2010, 30, 15–27. [Google Scholar] [CrossRef]
- Taft, O.W.; Colwell, M.A.; Isola, C.R.; Safran, R.J. Waterbird responses to experimental drawdown: Implications for the multispecies management of wetland mosaics. J. Appl. Ecol. 2002, 39, 987–1001. [Google Scholar] [CrossRef]
- Ramachandra, T.V.; Solanki, M. Ecological assessment of lentic water bodies of Bangalore. Minist. Sci. Technol. 2007, 25, 96. [Google Scholar]
- O’Neal, B.J.; Heske, E.J.; Stafford, J.D. Waterbird Response to Wetlands Restored Through the Conservation Reserve Enhancement Program. J. Wildl. Manag. 2008, 72, 654–664. [Google Scholar] [CrossRef]
- Yadav, A.K.; Dash, P.; Mohanty, A.; Abbassi, R.; Mishra, B.K. Performance assessment of innovative constructed wetland-microbial fuel cell for electricity production and dye removal. Ecol. Eng. 2012, 47, 126–131. [Google Scholar] [CrossRef]
- Galib, S.M.; Lucas, M.C.; Chaki, N.; Fahad, F.H.; Mohsin, A. Is current floodplain management a cause for concern for fish and bird conservation in Bangladesh’s largest wetland? Aquat. Conserv. Mar. Freshw. Ecosyst. 2018, 28, 98–114. [Google Scholar] [CrossRef]
- Asian Waterbird Census, Uttarakhand Biodiversity Board. Report on Uttarakhand Asian Waterbird Census; Uttarakhand Biodiversity Board: Dehradun, India, 2023. [Google Scholar]
- Mohan, D.; Sondhi, S.; Kumar, R.; Singh, P.; Datta, S.B. A Checklist of the Birds of Asan Conservation Reserve; Uttarakhand Forest Department and Titli Trust: Dehradun, India, 2023. [Google Scholar]
- Islam, M.Z.; Rahmani, A.R. Important Bird Areas in India: Priority Sites for Conservation; Indian Bird Conservation Network: Bombay, India; Natural History Society and Birdlife International (UK): London, UK, 2004; p. 1133. [Google Scholar]
- Patra, R.; Bisht, M.; Kumar Sipu, K. Amit., Saevus. 2022, pp. 70–73. Available online: https://www.magzter.com/IN/Saevus-Wildlife-India-LLP/Saevus/Animals-and-Pets/922955 (accessed on 1 May 2023).
- Mohan, D.; Sondhi, S. An Updated Checklist of the Birds of Uttarakhand; Uttarakhand Forest Department: Dehradun, India, 2015. [Google Scholar]
- Kaushik, T.K.; Gupta, R.C. Understanding and Analysing the Coordinates of Diversity of Wetland Birds of Asan Barrage near Paonta Sahib, Northern India. Our Nat. 2013, 11, 192–200. [Google Scholar] [CrossRef]
- Jha, B.R.; Rayamajhi, A.; Dahanukar, N.; Harrison, A.; Pinder, A. Tor putitora. In The IUCN Red List of Threatened Species; IUCN Global Species Programme Red List Unit: Cambridge, UK, 2018; e. T126319882A126322226. [Google Scholar]
- Mishra, A.P.; Rai, I.D.; Pangtey, D.; Padalia, H. Vegetation Characterization at Community Level Using Sentinel-2 Satellite Data and Random Forest Classifier in Western Himalayan Foothills, Uttarakhand. J. Indian Soc. Remote Sens. 2021, 49, 759–771. [Google Scholar] [CrossRef]
- Bassi, N.; Kumar, M.D.; Sharma, A.; Pardha-Saradhi, P. Status of wetlands in India: A review of extent, ecosystem benefits, threats and management strategies. J. Hydrol. Reg. Stud. 2014, 2, 1–19. [Google Scholar] [CrossRef]
- American Public Health Association (APHA). Standard Methods for the Examination of Water and Wastewater, 23rd ed.; APHA: Washington, DC, USA, 2017. [Google Scholar]
- Mishra, A.P.; Singh, S.; Jani, M.; Singh, K.A.; Pande, C.B.; Varade, A.M. Assessment of water quality index using Analytic Hierarchy Process (AHP) and GIS: A case study of a struggling Asan River. Int. J. Environ. Anal. Chem. 2022, 1–13. [Google Scholar] [CrossRef]
- Khadri, S.F.R.; Pande, C. Ground water flow modeling for calibrating steady state using MODFLOW software: A case study of Mahesh River basin, India. Model. Earth Syst. Environ. 2016, 2, 39. [Google Scholar] [CrossRef]
- Gilfedder, B.; Frei, S.; Hofmann, H.; Cartwright, I. Groundwater discharge to wetlands driven by storm and flood events: Quantification using continuous Radon-222 and electrical conductivity measurements and dynamic mass-balance modelling. Geochim. Et Cosmochim. Acta 2015, 165, 161–177. [Google Scholar] [CrossRef]
- Whigham, D.F.; Jordan, T.E. Isolated wetlands and water quality. Wetlands 2003, 23, 541–549. [Google Scholar] [CrossRef]
- Brevik, E.C.; Fenton, T.E.; Horton, R. Effect of Daily Soil Temperature Fluctuations on Soil Electrical Conductivity as Measured with the Geonics®EM-38. Precis. Agric. 2004, 5, 145–152. [Google Scholar] [CrossRef]
- World Health Organization (WHO). Guidelines for Drinking Water Quality, Incorporating 1st and 2nd Addenda, 3rd ed.; Recommendations; WHO: Geneva, Switzerland, 2008; Volume 1. [Google Scholar]
- Ajibade, O.M.; Banjo, O.A.; Oguntuyaki, T.A.; Osobamiro, T.M.; Ajakore, A.A. Implications of carbonates and chlorides contam-ination in groundwater: Examples from textile tie and dye markets in some parts of Southwestern Nigeria. Indian J. Sci. Technol. 2020, 13, 3349–3363. [Google Scholar] [CrossRef]
- Green, A.J.; Alcorlo, P.; Peeters, E.T.; Morris, E.P.; Espinar, J.L.; Bravo-Utrera, M.A.; Bustamante, J.; Díaz-Delgado, R.; Koelmans, A.A.; Mateo, R.; et al. Creating a safe operating space for wetlands in a changing climate. Front. Ecol. Environ. 2017, 15, 99–107. [Google Scholar] [CrossRef]
- Herbert, E.R.; Boon, P.; Burgin, A.J.; Neubauer, S.C.; Franklin, R.B.; Ardón, M.; Hopfensperger, K.N.; Lamers, L.P.M.; Gell, P. A global perspective on wetland salinization: Ecological consequences of a growing threat to freshwater wetlands. Ecosphere 2015, 6, art206. [Google Scholar] [CrossRef]
- Hazra, P.; Sinha, A.; Mondal, P.; Khan, T. Calendar-effects and temperature-impacts in migratory waterbirds at three tropical Indian wetlands. Acta Oecologica 2012, 43, 60–71. [Google Scholar] [CrossRef]
- Yetis, R.; Nergiz, H.; Yetis, A.D. Effects of water quality on the species richness and population distribution of waterbirds in Ahlat marshes, Turkey. Biologia 2021, 76, 3299–3309. [Google Scholar] [CrossRef]
- Thapa, J.B.; Saund, T.B. Water Quality Parameters and Bird Diversity in Jagdishpur Reservoir, Nepal. Nepal J. Sci. Technol. 2012, 13, 143–155. [Google Scholar] [CrossRef]
- Sulai, P.; Nurhidayu, S.; Aziz, N.; Zakaria, M.; Barclay, H.; Azhar, B. Effects of water quality in oil palm production landscapes on tropical waterbirds in Peninsular Malaysia. Ecol. Res. 2015, 30, 941–949. [Google Scholar] [CrossRef]
- Boros, E. Generalized estimation of nutrient loading of waterbirds on inland aquatic ecosystems. Methodsx 2021, 8, 101465. [Google Scholar] [CrossRef]
- Gautam, V.K.; Pande, C.B.; Moharir, K.N.; Varade, A.M.; Rane, N.L.; Egbueri, J.C.; Alshehri, F. Prediction of Sodium Hazard of Irrigation Purpose using Artificial Neural Network Modelling. Sustainability 2023, 15, 7593. [Google Scholar] [CrossRef]
- Liu, X.; Qiu, Y.; Zheng, Z.; Hong, Q.; Zhang, Y.; Qian, Q.; Wan, B.; Chen, Q. Spatiotemporal Changes in Waterfowl Habitat Suitability in the Caohai Lake Wetland and Responses to Human Activities. Sustainability 2022, 14, 14409. [Google Scholar] [CrossRef]
- Dong, Z.; Wang, Z.; Liu, D.; Li, L.; Ren, C.; Tang, X.; Jia, M.; Liu, C. Assessment of habitat suitability for waterbirds in the West Songnen Plain, China, using remote sensing and GIS. Ecol. Eng. 2013, 55, 94–100. [Google Scholar] [CrossRef]
- Na, X.D.; Zang, S.; Zhang, Y.H.; Li, W. Assessing Breeding Habitat Suitability for the Endangered red-Crowned Crane (Grus japonensis) Based on Multi-Source Remote Sensing Data. Wetlands 2015, 35, 955–967. [Google Scholar] [CrossRef]
- Bartold, M.; Kluczek, M. A Machine Learning Approach for Mapping Chlorophyll Fluorescence at Inland Wetlands. Remote Sens. 2023, 15, 2392. [Google Scholar] [CrossRef]
- Kim, Y.W.; Kim, T.; Shin, J.; Lee, D.-S.; Park, Y.-S.; Kim, Y.; Cha, Y. Validity evaluation of a machine-learning model for chlorophyll a retrieval using Sentinel-2 from inland and coastal waters. Ecol. Indic. 2022, 137, 108737. [Google Scholar] [CrossRef]


Disclaimer/Publisher’s Note: The statements, opinions and data contained in all publications are solely those of the individual author(s) and contributor(s) and not of MDPI and/or the editor(s). MDPI and/or the editor(s) disclaim responsibility for any injury to people or property resulting from any ideas, methods, instructions or products referred to in the content. |
© 2023 by the authors. Licensee MDPI, Basel, Switzerland. This article is an open access article distributed under the terms and conditions of the Creative Commons Attribution (CC BY) license (https://creativecommons.org/licenses/by/4.0/).