Article

Improving CO2 Absorption Using Artificial Intelligence and Modern Optimization for a Sustainable Environment

by
Ahmed M. Nassef
1,2
1
Department of Electrical Engineering, College of Engineering in Wadi Alddawasir, Prince Sattam Bin Abdulaziz University, Wadi Alddawasir 11991, Saudi Arabia
2
Computers and Automatic Control Engineering Department, Faculty of Engineering, Tanta University, Tanta 31733, Egypt
Sustainability 2023, 15(12), 9512; https://doi.org/10.3390/su15129512
Submission received: 9 May 2023 / Revised: 6 June 2023 / Accepted: 12 June 2023 / Published: 13 June 2023
(This article belongs to the Section Air, Climate Change and Sustainability)

Abstract

:
One of the essential factors in maintaining environmental sustainability is to reduce the harmful effects of carbon dioxide (CO2) emissions. This can be performed either by reducing the emissions themselves or capturing and storing the emitted CO2. This work studies the solubility of carbon dioxide in the capturing solvent, which plays a crucial role in the effectiveness and cost-efficiency of carbon capture and storage (CCS). Therefore, the study aims to enhance the solubility of CO2 by integrating artificial intelligence (AI) and modern optimization. Accordingly, this study consists of two consecutive stages. In the first stage, an adaptive neuro-fuzzy inference system (ANFIS) model as an AI tool was developed based on experimental data. The mol fraction was targeted as the model’s output in terms of three operating parameters; the concentration of tetrabutylphosphonium methanesulfonate [TBP][MeSO3], temperature, and pressure of CO2. The operating ranges are (2–20 wt%), (30–60 °C), and (2–30 bar), respectively. Based on the statistical measures of the root mean squared error (RMSE) and the predicted R2, the ANFIS model outperforms the traditional analysis of variance (ANOVA) modeling technique, where the resulting values were found to be 0.126 and 0.9758 for the entire samples, respectively. In the second stage, an improved grey wolf optimizer (IGWO) was utilized to determine the optimal operating parameters that increase the solubility of CO2. The optimal values of the three operating parameters that improve the CO2 solubility were found to be 3.0933 wt%, 40.5 °C, and 30 bar, respectively. With these optimal values, the collaboration between the ANFIS and IGWO produced an increase of 13.4% in the mol fraction compared to the experimental data and the response surface methodology. To demonstrate the efficacy of IGWO, the obtained results were compared to the results of four competitive optimization techniques. The comparison showed that the IGWO demonstrates superior performance. Overall, this study provided a cost-efficient approach based on AI and modern optimization to enhance CO2 solubility in CCS.

1. Introduction

Nowadays, global warming and climate changes are the main concerns of the whole world. Unfortunately, this problem contributed negatively to desertification in some countries and floods in others and neglecting the confrontation of these changes will become a great danger to environmental sustainability. Studies proved that increasing the concentration of carbon dioxide (CO2) in the atmosphere is the most significant cause of this issue [1,2,3,4]. Therefore, governments and researchers are searching seriously for appropriate solutions either to reduce CO2 emissions or to minimize their undesired effects. To address this problem, several strategies have been suggested to address global warming, including improving the efficacy of existing processes through waste heat recovery [5,6,7] in sectors that consume high levels of energy, such as ceramics, aluminum [8], cement [9,10], steel [11], and so on. Furthermore, efficient and ecologically friendly energy conversion technologies, such as fuel cells powered by renewable energy sources [12,13,14], are being implemented. In addition, utilizing sustainable energy sources has minimal or no environmental consequences. Another solution is carbon capture and storage (CCS) [15,16], which involves capturing CO2 from industrial processes, power plants, and other point sources and then storing it underground or using it in various ways [17]. The solubility of CO2 in the capture solvent is a critical aspect of CCS that determines its effectiveness and cost-efficiency [18].
Chemical absorption is one of the most practical ways to reduce CO2 emissions in the oil and gas industries [19]. Currently, the most common chemical solvents used as CO2 absorbents are aqueous alkanolamines, which absorb CO2 by forming CO2-amine complex mixtures. The CO2-amine complex mixture is then stripped to release the CO2 to be stored in CO2 storage. This process is known as amine scrubbing and has been widely used as CO2 capture technology [20]. Because of their reactivity with CO2, the commercial alkanolamines used in the amine scrubbing process are currently monoethanolamines (MEAs), methyl diethanolamines (MDEAs), and more recently, triethanolamines (TEAs), which form stable carbamates as intermediates. However, amine CO2 capture has several inherent disadvantages, such as corrosion [21].
To overcome these drawbacks and increase the solubility of CO2, various strategies have been explored, including the use of different solvents, such as ionic liquids (ILs) [22,23]. Ionic liquids (ILs) are a type of liquid salt that have unique properties, such as being liquid at or near room temperature and having high thermal stability. They are useful in a range of applications due to their chemical structures and compositions [24,25]. For carbon capture, ILs can be modified to increase the solubility of CO2 by incorporating functional groups or additives such as amines. Compared to conventional aqueous alkanolamine solvents, ILs have high CO2 solubility and exceptional properties, such as low volatility, high thermal stability, non-flammability, tuneability, and solvability. Furthermore, the physicochemical properties of ILs can be customized [26,27]. A promising hybrid solvent for the commercial CO2 absorption process is the composite aqueous solution of monoethanolamine (MEA)-tetrabutylphosphonium methanesulfonate [TBP][MeSO3] “(MEA-[TBP][MeSO3])” [28].
Another approach to increasing CO2 solubility is the use of hybrid solvents, which combine two or more solvents with complementary properties. For example, the combination of an IL with a conventional amine solvent can yield a hybrid solvent with improved CO2 solubility and selectivity. This approach offers the potential to tailor solvent properties to meet specific process requirements and improve overall performance.
Other methods for enhancing CO2 solubility include altering the process conditions, such as the temperature, pressure, and flow rate, and optimizing the solvent composition and concentration. Advanced computational methods, such as molecular dynamics simulations and artificial intelligence techniques, can also be employed to design and optimize capture solvents with high CO2 solubility and selectivity.
To determine the optimal ratios of MEA and [TBP][MeSO3] to enhance CO2 absorption, it is crucial to develop an accurate model. The adaptive network fuzzy inference system (ANFIS) is an artificial intelligence tool that can deduce the trend of a model from experimental input–output data. Unlike traditional mathematical tools, ANFIS uses IF-THEN fuzzy rules to represent the functionality between inputs and outputs. These rules can be generated through data modeling using a clustering approach. Using this approach, ANFIS can develop an optimal set of rules to obtain the least number of rules while maintaining model accuracy. Before submitting the inputs to the fuzzy rule to generate the output, the inputs are nonlinearly mapped from their crisp domain values to the fuzzy domain values by membership function MFs. The inference engine then generates an output for each rule, which is combined to form a final single output. ANFIS is well-suited for this task due to its high efficiency in modeling data-based systems [29,30,31].
Mun et al. [32] developed a new CO2 absorption solution by blending monoethanolamine (MEA) and diisopropanolamine (DIPA) in H2O. The optimal blending ratio was obtained by considering four different targets, including maximum total amine-based CO2 cyclic capacity and minimum regeneration energy. Kum et al. [33] developed a pre-combustion CO2 absorption process using a methyldiethanolamine (MDEA) and piperazine (PZ) blended solvent for CO2 capture from steam methane reforming (SMR) gas. Techno-economic analysis was performed, and the results showed that the novel blended-solvent looping system had a lower CO2 capture cost per ton at a 99% CO2 capture rate. The study provided insights into the blended solvent and guidelines for a high-pressure CO2 absorption process for cost-effective blue H2 production. Nassef et al. [34] maximized the CO2 capture capacity using artificial intelligence and metaheuristics. The carbonation temperature, duration, and H2O-to-CO2 flow rate ratio were analyzed, and a fuzzy model was developed to simulate and optimize the process using RUN. The proposed method outperformed response surface methodology and measured data by increasing the CO2 capture capacity by 10.08% and 9.39%, respectively. Ochedi et al. [35] reported that phase-changing absorbents, membrane and microencapsulation technologies, nanoparticle addition, solvent blends, and promoter-improved solvents are among the promising approaches for enhancing CO2 absorption performance. Khan et al. [36] showed that the use of ionic liquids in CO2 absorption at room temperature could reduce energy consumption. According to studies conducted by Ren et al. [37] and Ivanova et al. [38], the solubility of CO2 in single or mixed ILs decreased with rising temperatures but increased with increasing pressures. Lv et al. [39] and Zhou et al. [40] found that the absorption capacity of functionalized ionic liquids is primarily determined by the number of functional groups, which reduces the number of absorbent molecules required to absorb the same quantity of CO2. Functionalized ionic liquids have faster absorption rates, higher CO2 uptake capacities, and are easier to apply on a large scale than conventional ionic liquids, according to Zeng et al. [41]. Figure 1 provides an overview of the various technologies utilized for capturing CO2, with a focus on technologies that specifically address the solubility aspect of CO2 capture.
After surveying the published studies, there has been increasing interest in the development of carbon capture and storage (CCS) technology as a means of reducing greenhouse gas emissions and mitigating the impacts of climate change. The solubility of CO2 in capture solvents is a critical factor for the efficiency and cost-effectiveness of CCS processes, and many efforts have been performed to optimize this process using various methods. Although progress has been made in this area, there is still a research gap in terms of developing more efficient and cost-effective methods for optimizing CO2 solubility in capture solvents.
The objective of this study was to fill this research gap by applying advanced optimization methods and artificial intelligence techniques to design and optimize capture solvents with high CO2 solubility and selectivity, specifically, to identify the optimal values of various parameters, such as concentration, temperature, and pressure of CO2 that produced the highest value of mol fraction. To achieve this objective, the ANFIS was used to develop a model that could accurately predict the solubility of CO2 in the capture solvents. The optimal values of various parameters such as concentration of [TBP][MeSO3], temperature, and pressure of CO2 that produce the highest value of mol fraction were identified using five recent and significant metaheuristic algorithms, including particle swarm optimization (PSO), slime mould algorithm (SMA), Harris Hawks optimization (HHO), grey wolf optimizer (GWO), and improved grey wolf optimizer (IGWO). The novelty of this study lies in the combination of an advanced optimization method to improve the solubility of CO2 in the capture solvents. The combination of the robustness of ANFIS modeling and metaheuristic optimization methods has proven to be highly efficient in finding reliable and feasible outcomes [42,43]. This approach has the potential to significantly improve the efficiency and cost-effectiveness of the CO2 capture processes. Ultimately, the findings of this study will contribute to the development of more efficient and cost-effective CCS technologies that can help mitigate the impacts of climate change.
The main contribution of the paper can be summarized as follows.
  • A new application of improved grey wolf optimizer is proposed to improve CO2 absorption;
  • The optimal values of concentration of [TBP][MeSO3], temperature, and pressure of CO2 are determined;
  • The value of mol fraction is increased.

2. Dataset

The MEA and [TBP][MeSO3] were selected to be mixed, producing aqueous hybrid solvent for CO2 removal. The MEA concentration was kept constant at 30 wt% as per typical amine concentrations used in commercialized CO2 absorption technology. The absorption of the CO2 by MEA-[TBP][MeSO3] was calculated by measuring the difference between the initial number of the n C O 2 i introduced into the system and the final CO2 moles after the absorption process, i.e., left after reaching the equilibrium, n C O 2 e q calculated as follows [28]:
n C O 2 i = P i V r e s Z C O 2   R   T
where n C O 2 i is the initial moles of the CO2, Vres is the volume of the reservoir, ZCO2 is the compressibility of the CO2, R is the gas constant, and T is the reservoir temperature [28].
The n C O 2 e q can be calculated as follows:
n C O 2 e q = P e q   ( V t o t V s ) Z C O 2   R   T
Vs is the volume of the aqueous MEA-[TBP][MeSO3], Teq is the temperature at equilibrium, Peq is the pressure at equilibrium,
The absorbed CO2 molecules are:
n C O 2 a b s = n C O 2 i n C O 2 e q
The following parameters were investigated, the percentages of the IL [TBP][MeSO3] (2%, 10%, and 20 wt%), absorption temperature (30, 45, and 60 °C), and the CO2 pressure (2, 16, and 30 bar) [28].

3. Methodology

The proposed methodology, as explained in Figure 2, includes two parts: modeling and optimum parameter identification. The first part was performed using ANFIS modeling, whereas the process of identification in the second part was performed using the improved grey wolf optimizer.

3.1. ANFIS-Model

Since its appearance in the late sixties, fuzzy logic (FL) has played a crucial role in system modeling and control. It changes the views of actions from binary-valued sets to very general and global multi-valued sets. This transformation makes FL much closer to the human-thinking procedure. Therefore, FL is one of the most efficient and state-of-the-art artificial intelligence (AI) tools. The ANFIS is an example of the collaboration between fuzzy logic and artificial neural networks (ANNs). ANFIS is a networked structure that formulates fuzzy logic processes. These processes are fuzzification, inference engine, and defuzzification in sequence. The first process in the fuzzy systems is to convert the variable from the crisp state to its equivalent fuzzy state. This can be carried out through nonlinear mapping functions, namely the membership functions (MFs). Any function that satisfies the convexity property and is able to map a real number to the range [0 1] can be utilized as a MF. The resulting mapping value indicates the degree of belonging of a variable to a certain MF. A variable is not belonging, fully belonging, and partially belonging to a MF if the mapping value is 0, 1, and [0 1], respectively. The fuzzy values are then supplied to the fuzzy rules in the inference engine to generate the rules’ outputs based on the minimum (Min) operation. In modeling the system, ANFIS always uses the Sugeno-type IF-THEN fuzzy rule, where its IF part represents the inputs and the THEN part represents the output. The final crisp output is obtained by the union of the weighted average of the whole set of rules. This is the last process in the fuzzy modeling procedure, namely the defuzzification process. At the end of these processes, ANFIS can effectively produce the best model using the experimental data of the system. Similar to the artificial neural network (ANN) tool, a certain learning algorithm must be applied to obtain the optimal weights of the ANFIS model. The form of the output as a function of the weight vector can be expressed as [44]:
c = i n W i f i i W i
The equation involves the weight and output of the ith rule, denoted as W i   and f i , respectively, where c represents the final crisp output, and n is the total number of rules.
However, both gradient descent (GD) and least squares estimate (LSE) methods are used to train the ANFIS model in a sort of hybrid mechanism to generate the optimal parameters of the network. In this study based on the acquired data, an ANFIS model was built. An illustration of a 2-input Sugeno-type fuzzy rule is presented as follows:
IF x is 𝛼 and y is 𝛽 THEN z = f(x, y)
where z is the rule’s output; 𝛼 and 𝛽 are nonlinear mapping functions of the two input variables x and y, respectively; f(x, y) is a mathematical function that relates the inputs to the output.

3.2. Improved Grey Wolf Optimizer

The first standard version of the grey wolf optimizer (GWO) was proposed in 2014 by Mirjalili and his colleagues [45]. The main idea of the GWO algorithm is inspired by the behavior of grey wolves during prey hunting. The authors mimicked this behavior as an optimization algorithm by categorizing the flock into four hierarchical categories and considering the first three wolves as the best three leaders (best three solutions), namely, alpha (𝛼), beta (𝛽), and delta (𝛿), while the remaining set of wolves, namely (𝜔), represents the fourth category (other solutions). Generally speaking, the updating formula for the whole flock is based on the position of those best three wolves. The GWO algorithm simulates the hunting process according to the purpose of the task in three phases; encircling, hunting, and attacking [46].

3.2.1. Encircling Phase

In this phase, the wolves estimate the distance to the prey, and accordingly, they propose the location of the next move. This phase can be modeled as follows [47]:
d i k = 2 r 1 i k . x p k x i k
x i k + 1 = x p k C i k d i k
C i k = 2 r 2 i k a k
a k = 2 2 k T
where x i k and x p k   are the ith solution (wolf) and the prey’s position at an iteration k, respectively; r 1 i k and r 2 i k are two random numbers in the range [0 1] associated to the ith solution at an iteration k; a k is a scalar parameter linearly decreasing with k and its value is in the range [0 2]. It is worth mentioning that as the parameter “a” changes from 2 to 0, the parameter “C” changes within the range [−2 2].

3.2.2. Hunting Phase

During this phase, each wolf assesses the predicted position of the prey based on information from the best three wolves, and hence predicts its next move. This phase is defined by the following equations:
d α , β , δ i k = 2 . x α , β , δ k x i k r 1 α , β , δ i k
x α , β , δ i k = x α , β , δ k C α , β , δ i k d α , β , δ i k
x i k + 1 = x α , β , δ i k 3
where x i k and x i k + 1 are the current and updated positions of the ith solution at iteration k, respectively; and x α , β , δ k   are the α , β and δ wolves’ positions at an iteration k; x α , β , δ i k is the ith solution update at an iteration k based on the α , β and δ wolves’ positions; C α , β , δ i k is a scalar variable that is calculated as in Equation (4) and it has the same property of changing within the range [−2 2].

3.2.3. Attacking Phase

The optimization process is close to termination in this phase. The linear decrement of parameter a formulates the simulation of this behavior, as displayed in Equation (5), as long as the searching process is going to its end and hence terminates. This decreasing parameter controls the exploration and exploitation phases such that its value is large at the beginning of the optimization process (close to 2). Hence, the wolves can explore a wide search, however after a while, its value becomes smaller and smaller (close to zero), and hence the process switches to the exploitation phase.
However, GWO performs well in many applications. However, it still, like many other optimizers, has some limitations, such as premature convergence (stuck in local optima) problems and improper switching between the exploration and exploitation phases [48]. Owing to these inappropriate issues, Nadimi-Shahraki and his colleagues proposed, in 2021, an improved version of the standard GWO, to address these weaknesses [47]. In the new IGWO version, they proposed a strategy to efficiently balance the exploitation and exploration phases and prevent the premature convergence dilemma. This strategy, namely learning-based hunting (DLH), was inspired by the natural hunting behavior of wolves. The DLH strategy is based on sharing information between neighboring wolves within a distance of radius R. Using this DLH search strategy, the switching from exploration to exploitation is enhanced by maintaining the diversity of the search space [2N]. Accordingly, the IGWO algorithm comprises three consecutive phases.
The IGWO starts with the initialization phase in which N random solutions are proposed. For every dimension d with upper and lower limits Ud and Ld, respectively, the proposed ith initial solution is [18]:
x i d = L i d + r i d ( U i d L i d )
where r is a random generator that produces a value between 0 and 1; x i d , L i d and U i d are the initial solution, lower and upper limits of the ith solution in dimension d.
The second phase is the movement phase, in which the wolves (solutions) benefit from the social information of the neighboring wolves located within a circle of radius R. To mimic this social behavior, the DLH hunting strategy is applied by first calculating the neighboring solutions, as in Equations (10) and (11).
R i k = x i k ( x i k + 1 ) G W O
A solution j is said to be a neighboring solution n to the solution i at an iteration k if it satisfies the following criterion:
x n k = x j k | D i , j k x i k , x j k < R i k ; i , j , i j
where, D i , j k x i k , x j k   is the Euclidean distance between the solutions x i k and x j k . Definitely, there are many wolves that satisfy Equation (11). The updating rule using the DLH strategy is as follows:
( x i k + 1 ) D L H = x i k + r i k x n k x r k
where x n k is a randomly selected neighbour solution to x i k ; x r k is any solution selected randomly from the solution pool; r i k is a randomly generated variable in the range [0 1].
The third and last phase is the select and update phase, in which the comparison between the results obtained from the standard GWO and DLH strategy is applied, and the solution with the best cost function is updated according to the following equation:
x i k + 1 = { ( x i k + 1 ) G W O   i f   f ( x i k + 1 ) G W O < f ( x i k + 1 ) D L H   ( x i k + 1 ) D L H   O t h e r w i s e  
where x i k + 1 is the selected solution; ( x i k + 1 ) G W O and ( x i k + 1 ) D L H are the updated solutions using GWO and DLH, respectively; f(.) is the cost function to be optimized. Here, the cost function is considered to be minimized.
Finally, the x i k + 1 solution is selected if it is better than x i k otherwise, it is omitted, as shown in Equation (18)
x i k + 1 = { x i k + 1   i f   f ( x i k + 1 ) < f ( x i k )   x i k   O t h e r w i s e  

4. Assessing Societal Benefits: Key Determinants Evaluation

This study aims to address the significant environmental concerns associated with the increasing concentration of CO2 in the atmosphere and its contribution to global warming and climate change. The benefits of this study are:
  • Reducing CO2 emissions: The study focuses on developing efficient and ecologically friendly energy conversion technologies, carbon capture and storage (CCS), and advanced CO2 absorption solutions to reduce CO2 emissions from various sectors that consume high levels of energy;
  • Environmental sustainability: The use of sustainable energy sources and carbon capture and storage techniques has minimal consequences and promotes environmental sustainability;
  • Solvent optimization: This study focuses on optimizing the solvent composition and concentration using advanced computational methods such as molecular dynamics simulations and artificial intelligence techniques, resulting in improved CO2 solubility and selectivity;
  • Lower costs: The literature provides insights on blended solvents and guidelines for a high-pressure CO2 absorption process for cost-effective blue H2 production;
  • Improved technology: The previous studies discussed the use of ionic liquids (ILs) and hybrid solvents, resulting in high CO2 solubility and selectivity, and exceptional properties, such as low volatility, high thermal stability, non-flammability, and tunability. However, this study contributes to the development of new and advanced CO2 absorption technologies.
In summary, this study contributes to addressing the significant environmental concerns of global warming and climate change by reducing CO2 emissions, promoting environmental sustainability, optimizing solvents, and improving technology while reducing costs.

5. Results and Discussion

The main objective of this study is to determine the optimal set of control parameters that can maximize CO2 solubility. Because the available data points are limited, an appropriate approach is to use an AI tool, such as ANFIS, to construct a model of the system. Once the model is generated, an optimization technique can be applied to identify the optimal parameter values. In this study, the IGWO method was utilized to perform the task. Therefore, the following subsections outline the methodologies for both phases.

5.1. Modeling Phase

For the ANFIS model training purposes, the values of training to testing ratio, MF type, rule’s generation method and defuzzification technique were assigned to 70 to 30, the Gaussian shape, the subtractive clustering (SC), and the weighted average (Wavg), respectively. These values were carefully selected to appropriately achieve the modeling task. In the following paragraph, it will be explained why these specific values were selected. Despite the very small number of data samples, only 20 samples in this case study, the training dataset allocated no more than 70% of the entire samples. Due to its smooth transition from one predicted point to the next, unlike the other triangular or trapezoidal shapes, the Gaussian shape is a suitable choice for nonlinear mapping and performs well. However, triangular and trapezoidal shapes are the most suitable MFs in control systems. For generating the fuzzy rules from the data samples, the SC technique is highly nominated as it is able to produce the shortest list of rules that can efficiently predict the output correctly. The ANFIS structure used in this study was a Sugeno-type fuzzy model. In this type, each rule considers the consequence (output) as a linear function of the antecedent (inputs). Accordingly, the defuzzification method aggregates the outputs by obtaining the weighted average of each rule to obtain a final single-valued output. As mentioned earlier, the available 20-sample experimental dataset was partitioned with a 70:30 ratio to obtain 14 points for the training phase. For comparison, the remaining six points were reserved for the testing phase. To build a robust model, continuous training was performed for the ANFIS model until the stopping criterion was met. In this study, the training process was stopped when the root mean squared error (RMSE) of the testing data reached the minimum value. In both stages, statistical markers were computed to measure the robustness of the ANFIS model. Table 1 lists the resulting statistical values of MSE, RMSE, and R2 for the training, testing and entire data sets. The low values of MSE and RMSE indicate the reliability of the model’s predictions. On the other hand, the high value of R2 indicates that the ANFIS model tracks the trend of the data efficiently. It is worth mentioning that the predictions are fully correlated or not correlated with the measured samples when the value of R2 is 1 or 0, respectively. For a high correlation between the model predictions and actual signals, it is expected that the R2 should be as close as possible to 1. Table 1 shows that the obtained ANFIS model performed well based on the low values of the RMSE for both training and testing, which reached 0.0017 and 0.0229, respectively. Additionally, in both phases, the model’s predictions were very close to fully tracking their associated experimental signals as the calculated R2 values are found to be 0.9996 and 0.9632, respectively, which are almost 1. Compared with the literature [28], where they used the ANOVA statistical method to obtain the model, the RMSE and predicted R2 for the entire samples were found to be 0.1174 and 0.8443, respectively. However, the ANFIS model yielded values of 0.0126 and 0.9758 for the same markers, respectively. This implies that the RMSE decreased by 9.32 times, and the signal tracking increased by 15.58% when using the ANFSI modeling technique instead of ANOVA. According to this comparison, the ANFIS outperformed the classical ANOVA modeling techniques.
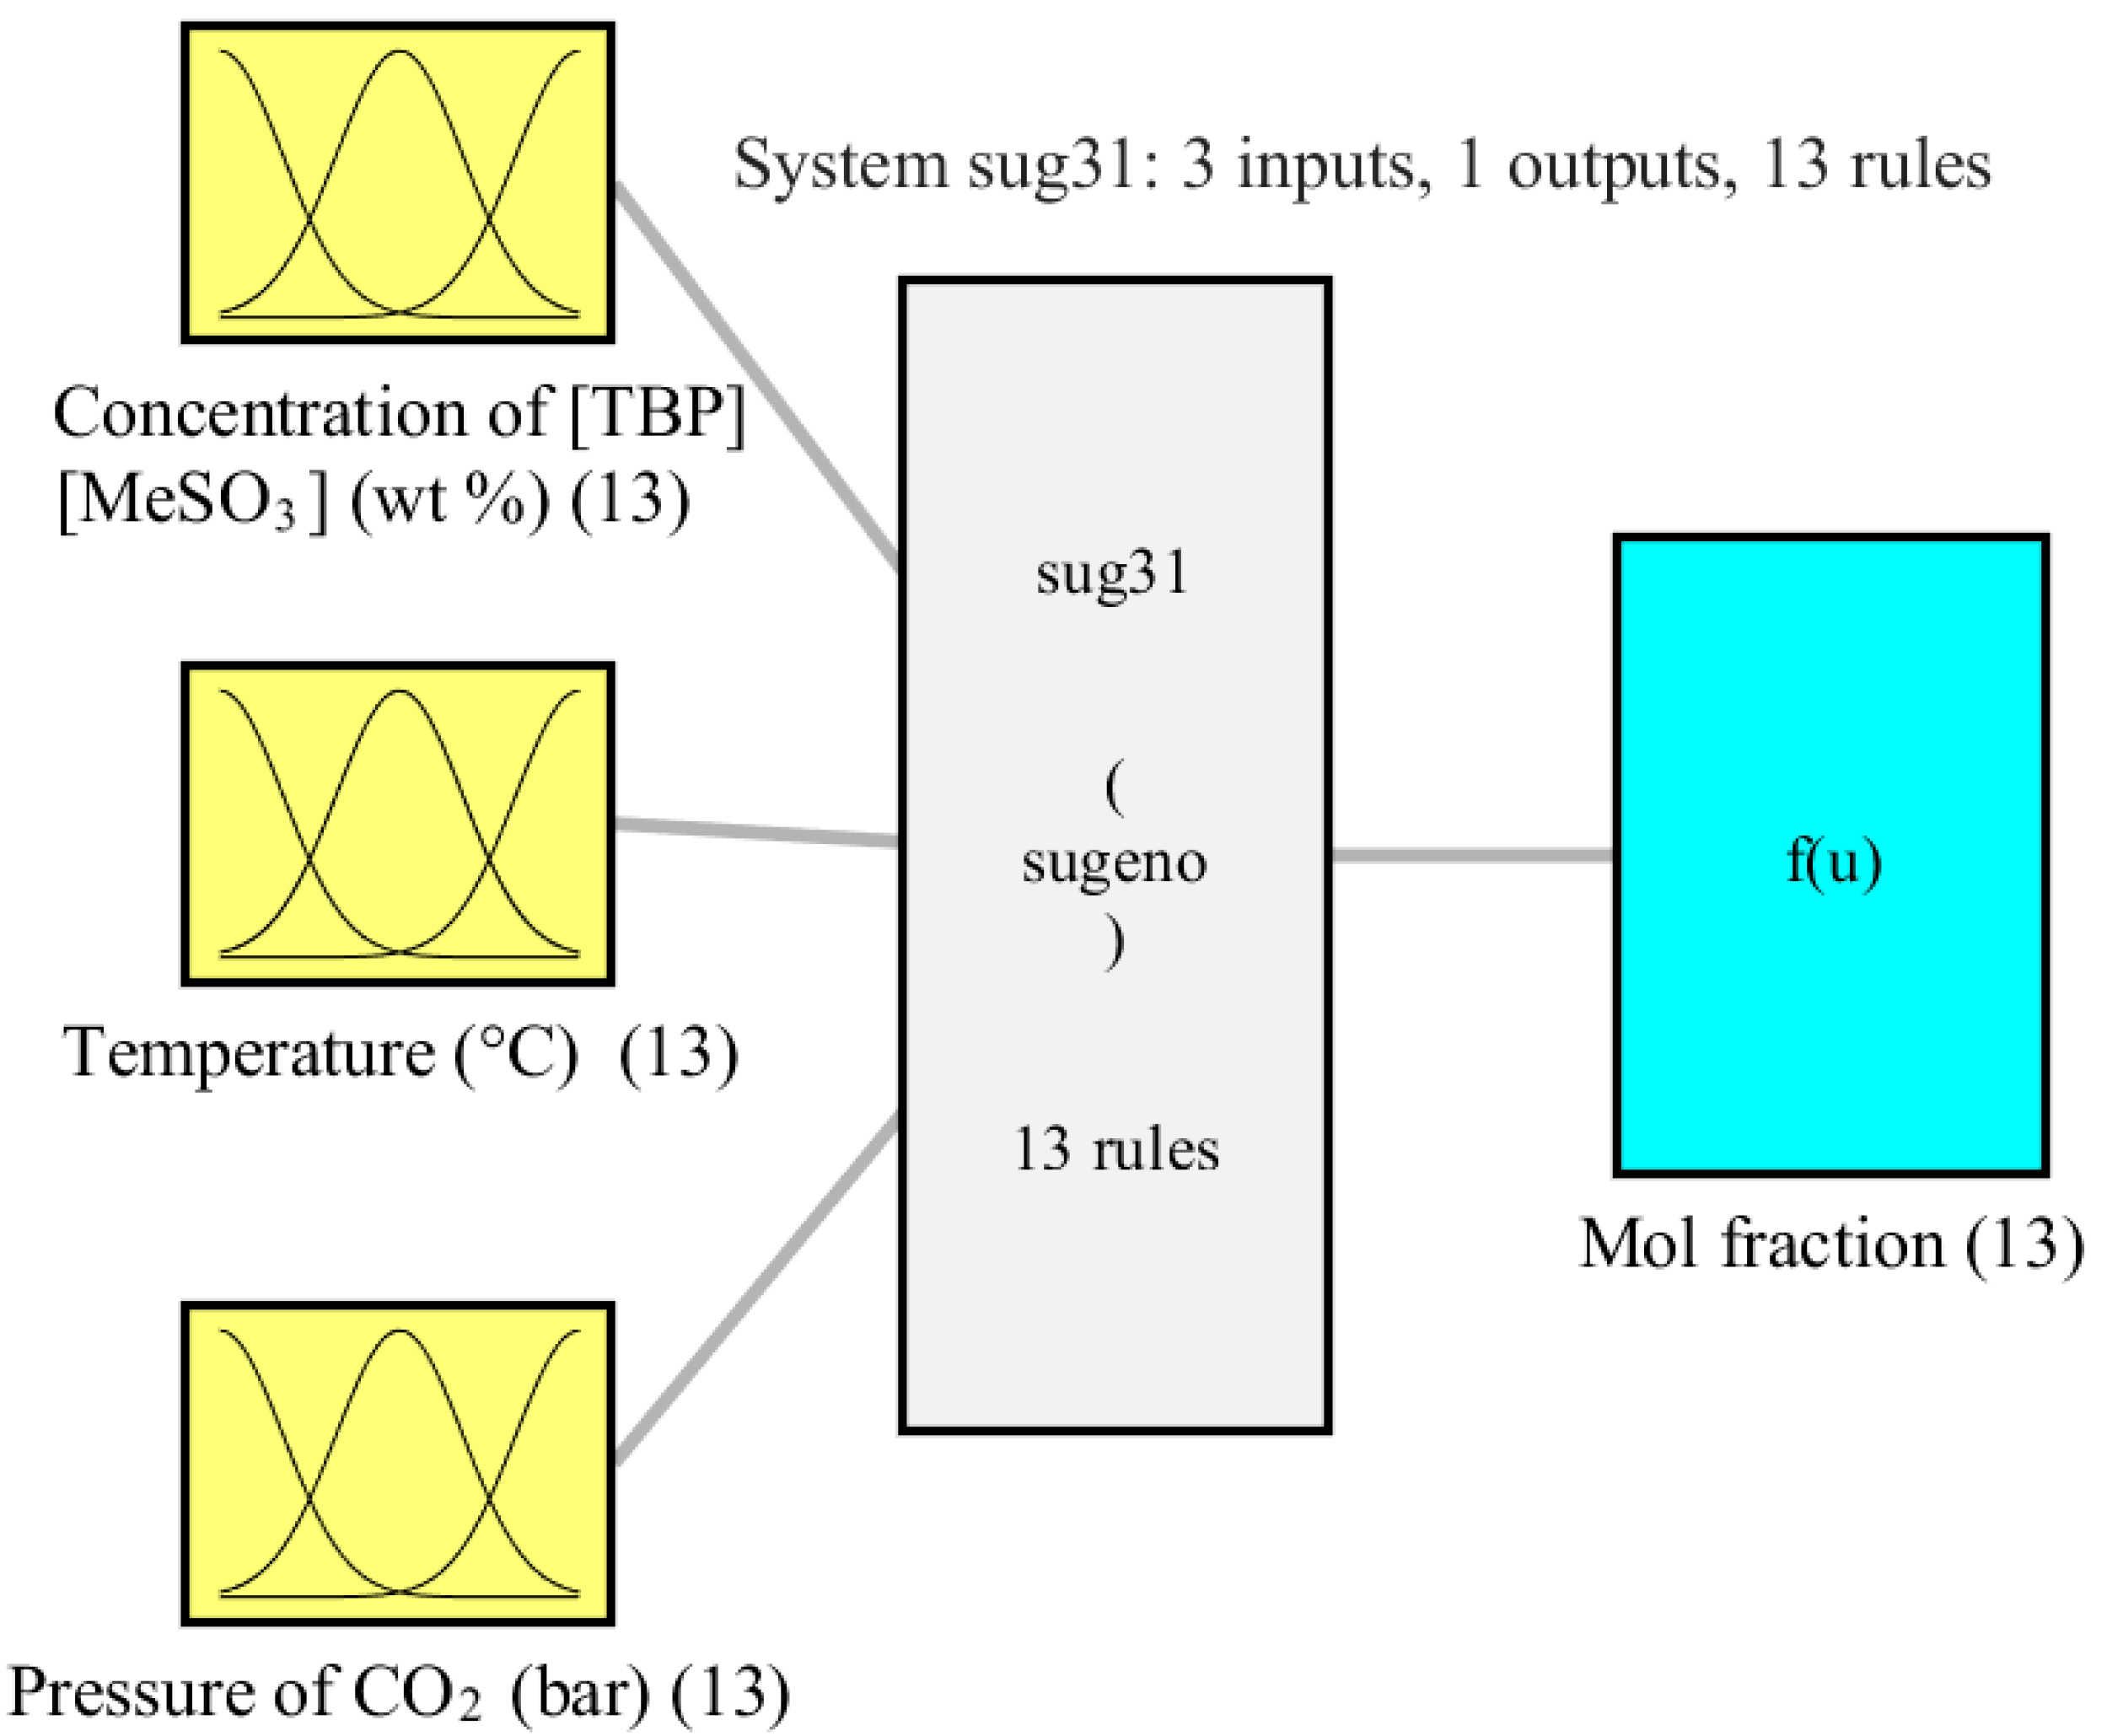
In the current study, the concentration of [TBP][MeSO3], temperature, and pressure of CO2 were used as the inputs and the mol fraction as the output. Figure 3 illustrates the structure of the three-input single-output ANFIS model, showing the inputs, outputs, and rule types. In the modeling, the ANFIS rules are selected as Sugeno-type, and the subtractive clustering algorithm generates the lowest number of rules 13. Additionally, at Gaussian shape, MF was selected for the nonlinear mapping between the crisp and ANFIS domains. Figure 4 shows the MFs for each input. The figure shows that the inputs are consistently dispersed throughout their discourse domain with uniformly spaced distances, indicating that each cluster (defined by a different colored curve) has the same impact on the outcome.
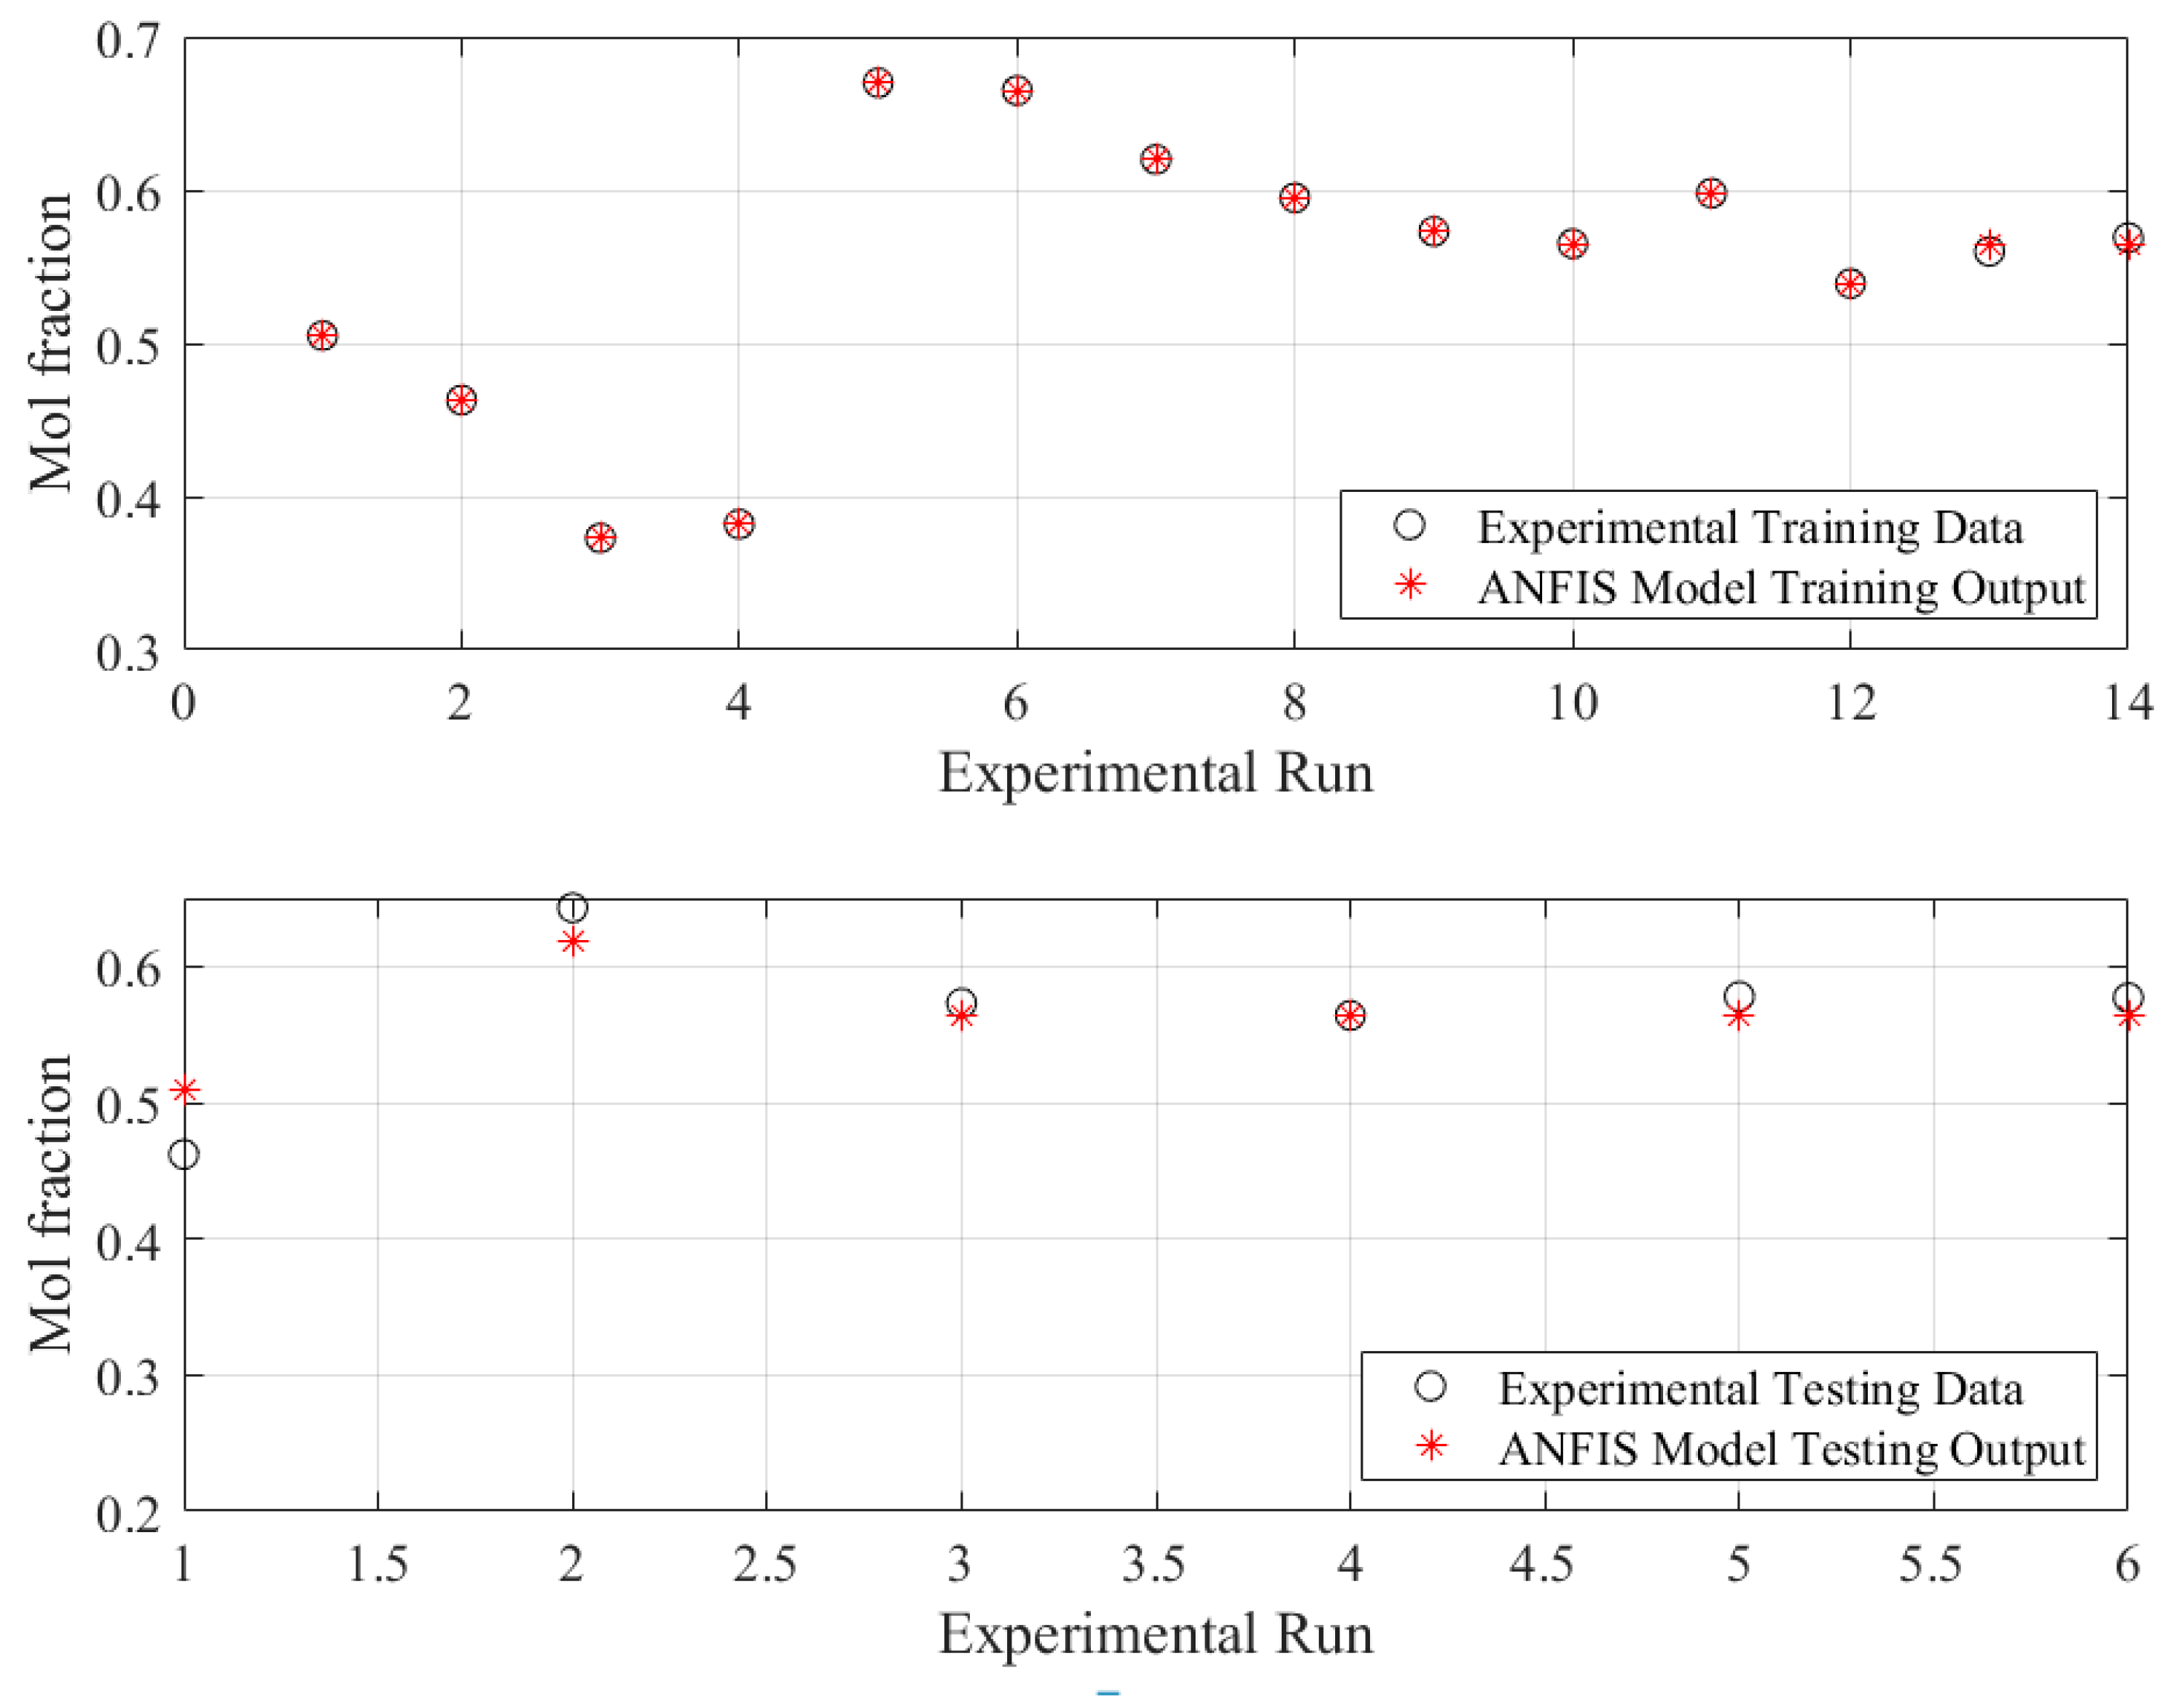
Visual plots typically assist the reader in immediately understanding and analyzing the behavior of the predictions. Figure 5 and Figure 6 are presented for this issue but from different perspectives. Figure 5 shows the ANFIS model outputs against the measured data for the train subset (upper plot) and test subset (lower plot). The plots clearly illustrate that the model predictions were almost the same as their associated experimental points for the training dataset. Furthermore, the ANFIS model produced output points that were extremely close to the corresponding testing data points.
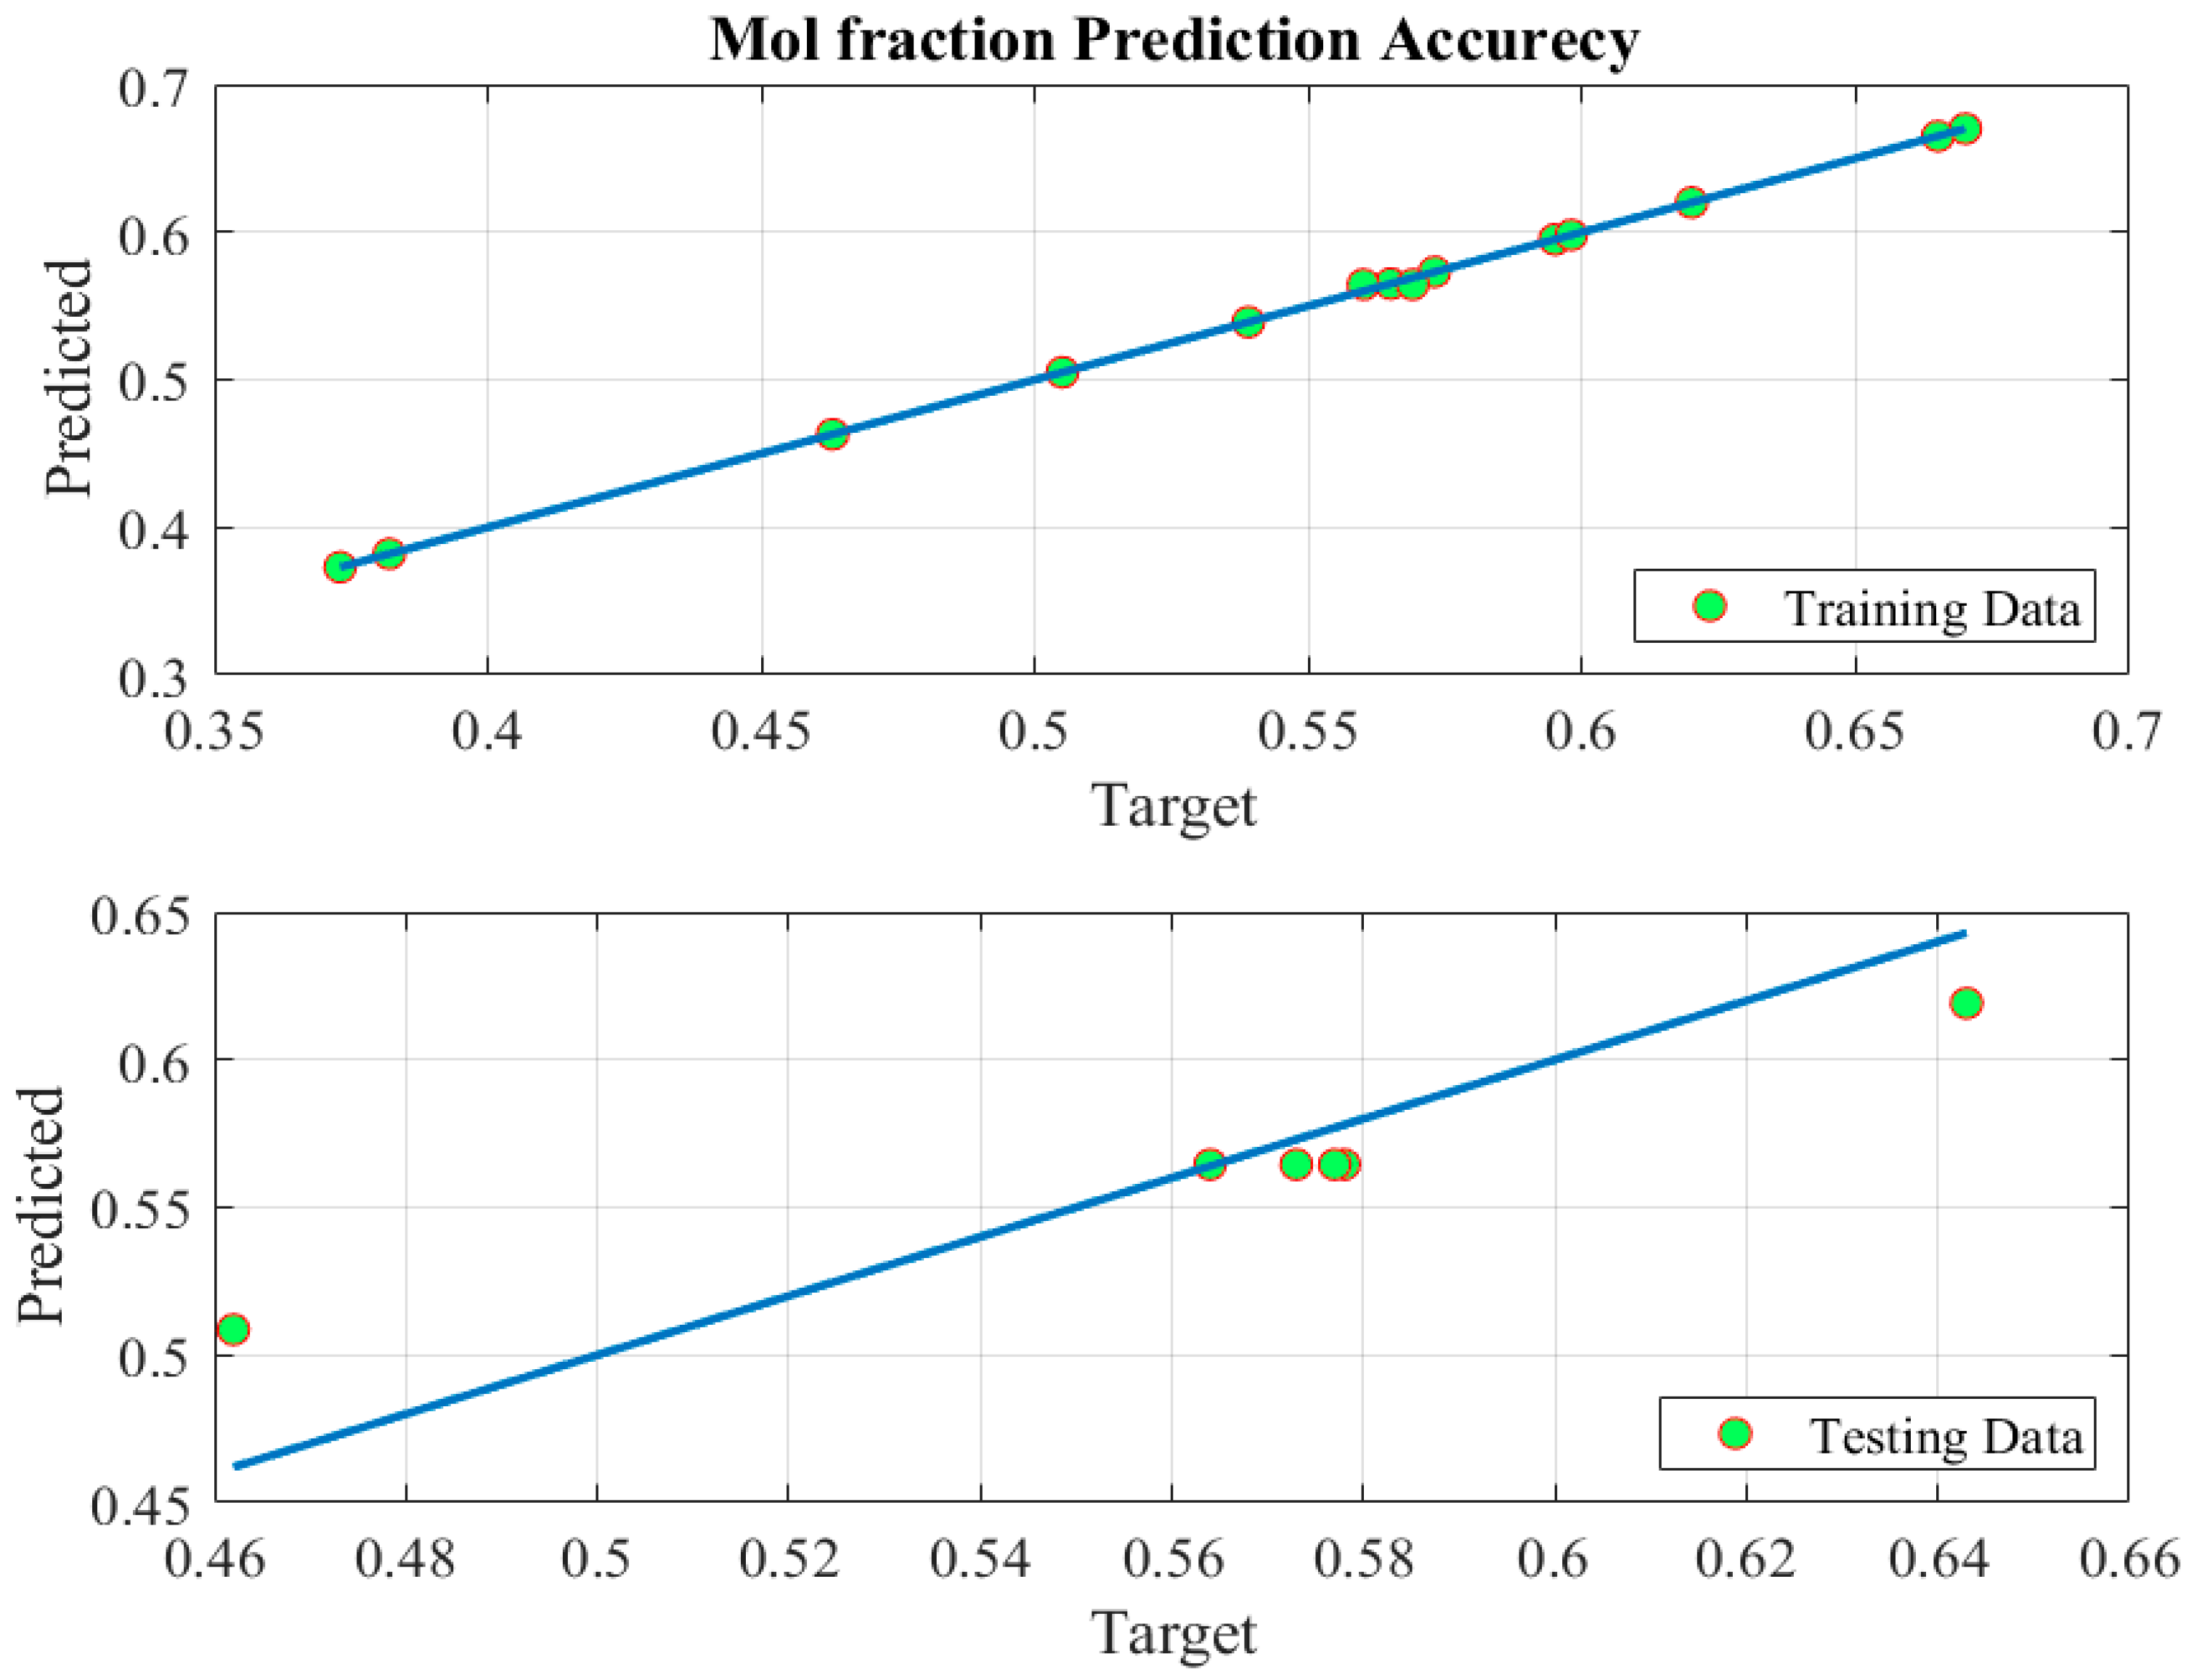
Figure 6 supports the outstanding prediction accuracy of the ANFIS model, as shown in Figure 5, by plotting the predicted data points around the 100% prediction accuracy line. This demonstration was performed for both training and testing predictions, where it shows that the model was trained with almost 100% accuracy (upper plot). To demonstrate that the model was not overtrained, the plots for the testing data points proved that the predictions (lower plot) were close to the 100% accuracy line.
Figure 7 illustrates the influence of the interaction between the two variables on the absorption process. Figure 7 (upper left) displays the influence of the absorption temperature and concentration of the IL on the absorption process. Figure 7 (upper right) shows the interaction between the two variables, that is the CO2 pressure and IL concentration of the CO2 absorption process. It is clear from the figure that the pressure significantly affects the absorption process for all IL concentrations. This was confirmed by studying the interaction between the CO2 pressure and absorption temperature, as shown in Figure 7 (bottom). As it is obvious from Figure 7 (bottom), the CO2 absorption is enhanced by increasing the CO2 pressure and reducing the absorption temperature. In Figure 7, the gradation from blue to red colors denotes the gradual change of the output from the lower-most to the higher-most values, respectively.

5.2. Optimization Phase

The main task of the optimization phase is to determine the best set of values for the concentration of [TBP][MeSO3], temperature, and pressure of CO2 that increases the mol fraction. Thus, after producing a reliable ANFIS model of the mol fraction, IGWO was employed to identify the best set (optimal) values of the three controlling variables. To demonstrate the efficacy of IGWO, the results of the proposed strategy were compared to four different competitive optimization algorithms, such as the original grey wolf optimizer (GWO), particle swarm optimization (PSO), slime mould algorithm (SMA), and Harris Hawks optimization (HHO). The optimization problem of the case study can be formulated as follows.
x = m a x m o l   f r a c t i o n  
where x represents the three controlling parameters.
Table 2 presents the optimal concentration values of [TBP][MeSO3], temperature, and pressure of CO2 corresponding to the highest mol fraction according to the experimental data, RSM modelling tool, and the proposed method. The collaboration between the ANFIS and IGWO boosted the mol fraction from 0.67 to 0.76 by approximately 13.4% relative to the experimental data and RSM technique. This implies that the optimal values of the controlling parameters result in an increase in CO2 solubility.
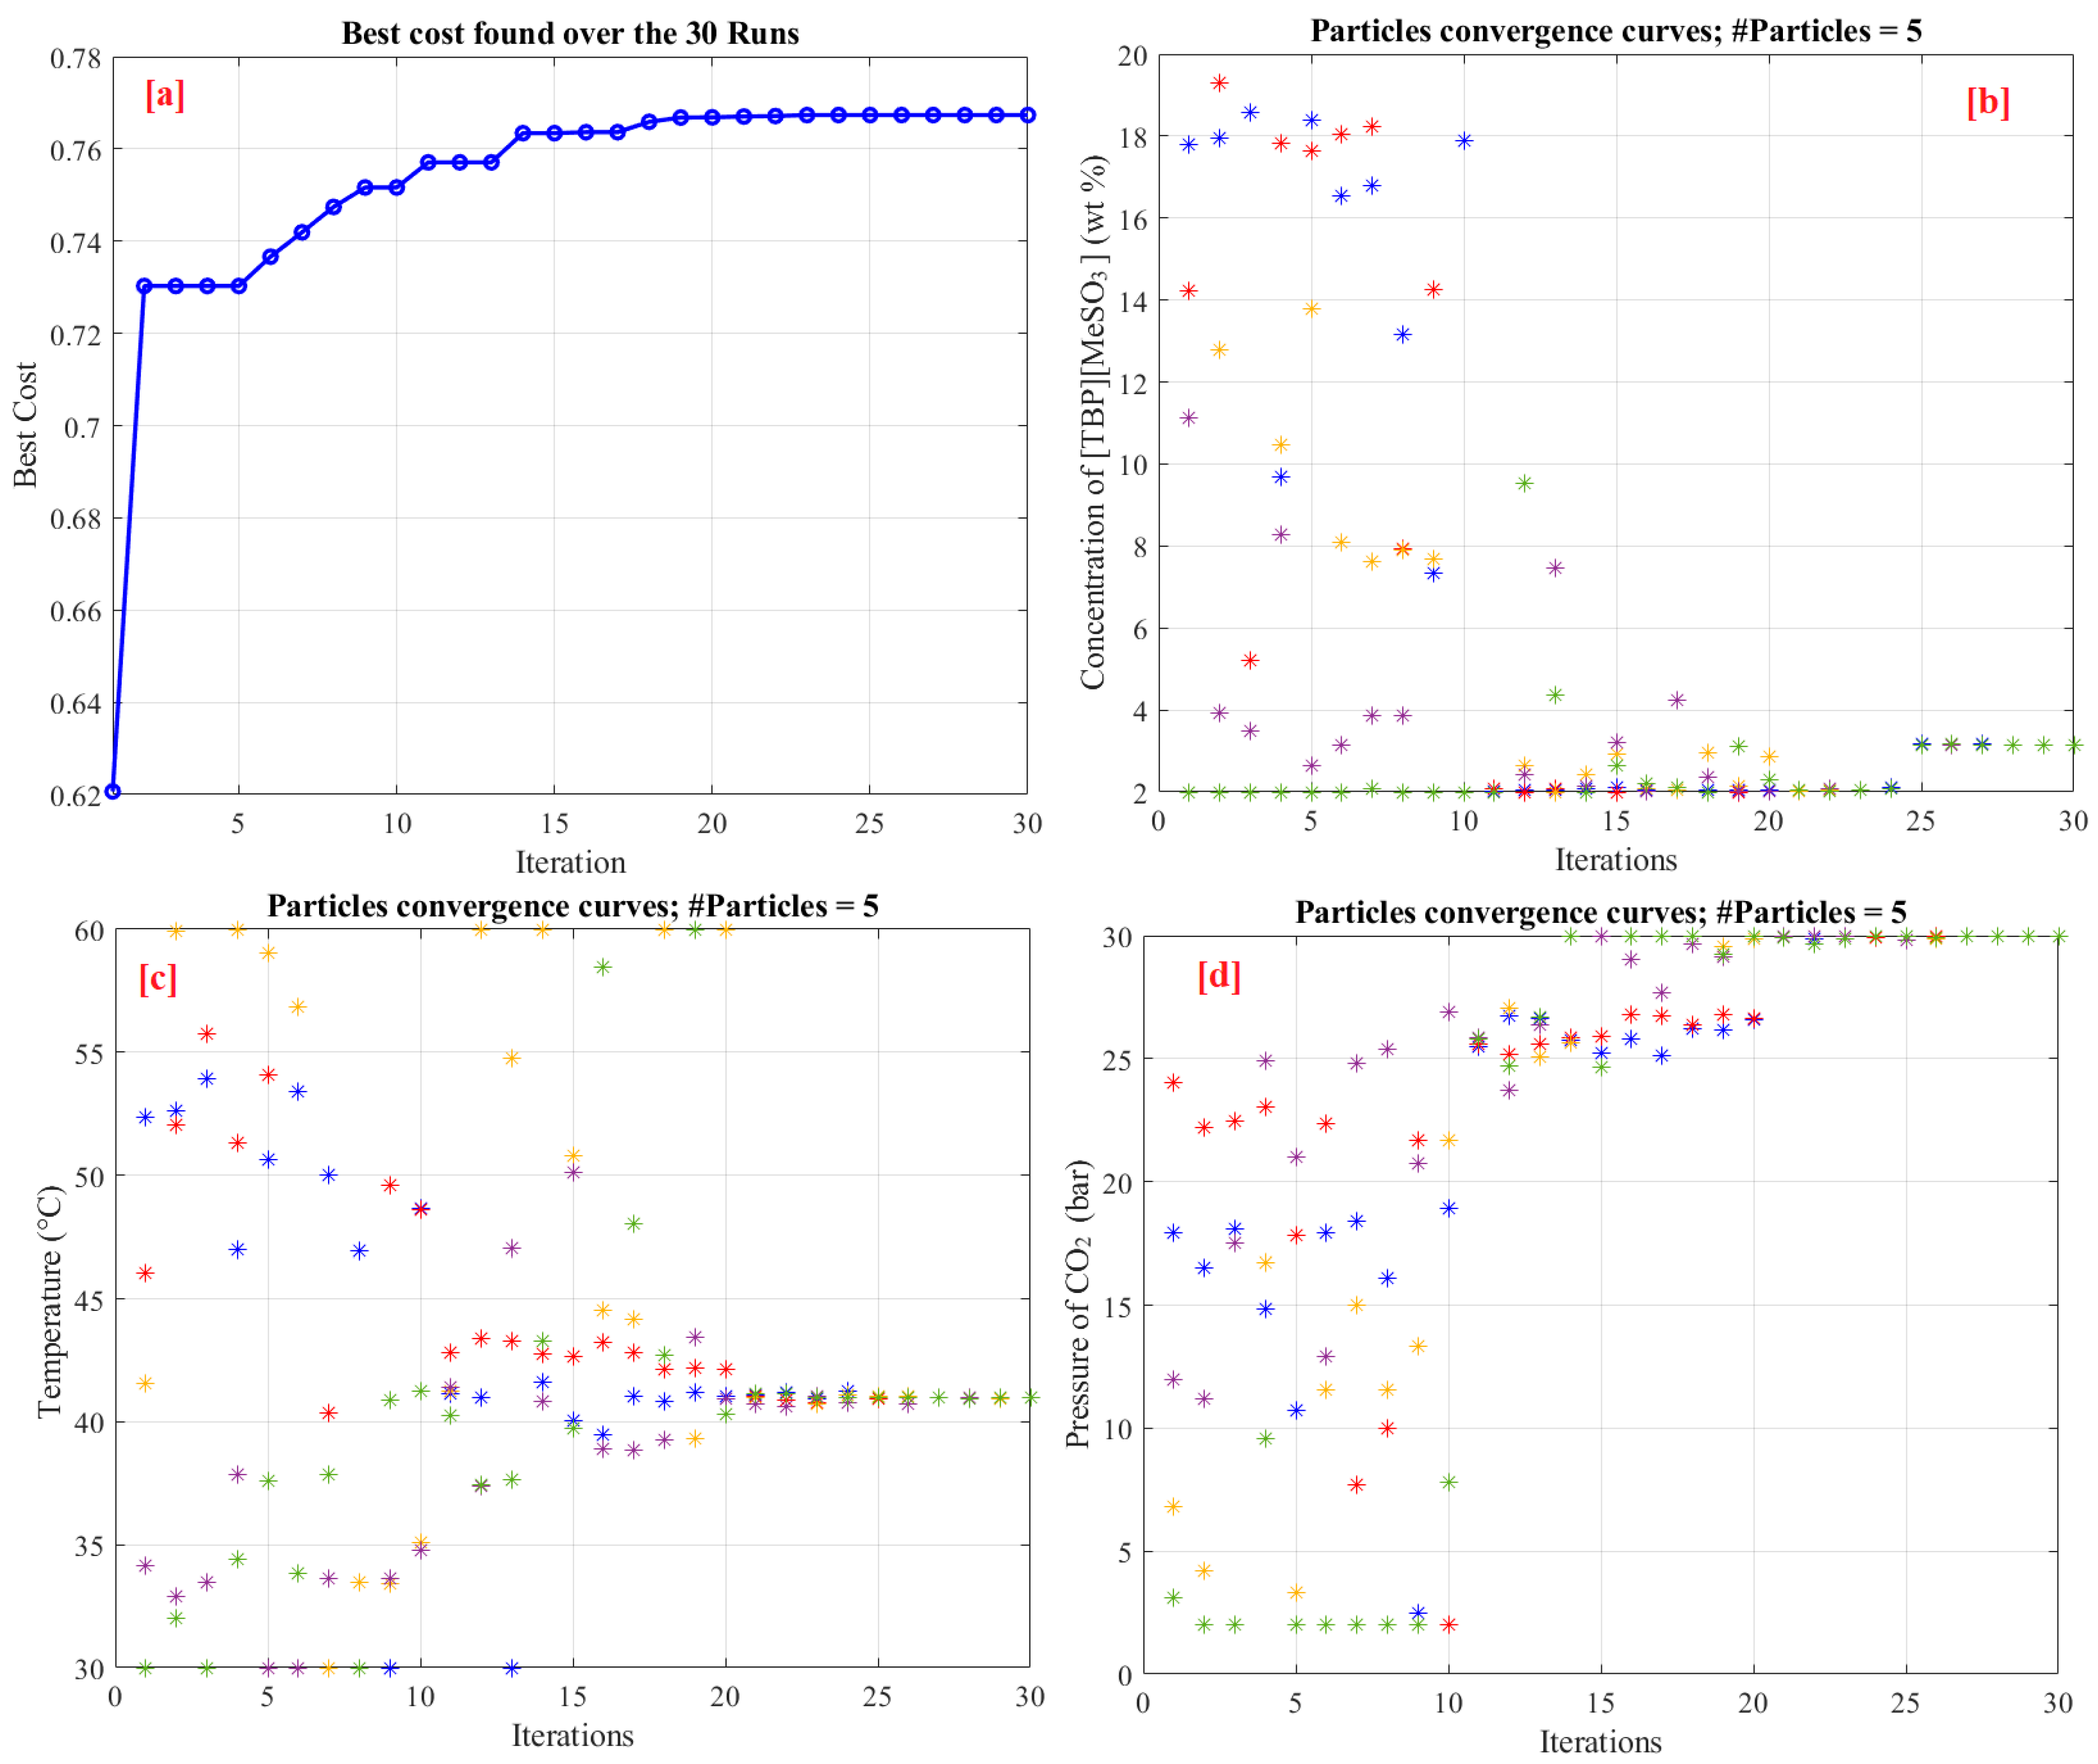
Each considered optimization algorithm has to be executed several times to ensure its robustness. In this study, a 30-run optimization process has been applied for all optimizers. Table 3 presents the statistical analysis of the considered optimizers over 30 runs. For all optimizers, the number of populations and the maximum number of iterations were set to 5 and 30, respectively. Table 3 indicates that IGWO is superior to the classic original versions of GWO, PSO, SMA, and HHO. The lowest standard deviation (STD) value of 0.00032 was obtained for IGWO, whereas PSO obtained the highest STD of 0.05486. IGWO has the best average cost function of 0.76585, whereas SMA has the poorest mean cost function of 0.67981. This proves the efficacy of IGWO. Figure 8 shows the particle convergence during the identification procedure. The best values are 3.0933 wt%, 40.5 °C, and 30 bar, respectively, for a concentration of [TBP][MeSO3], temperature, and pressure of CO2.
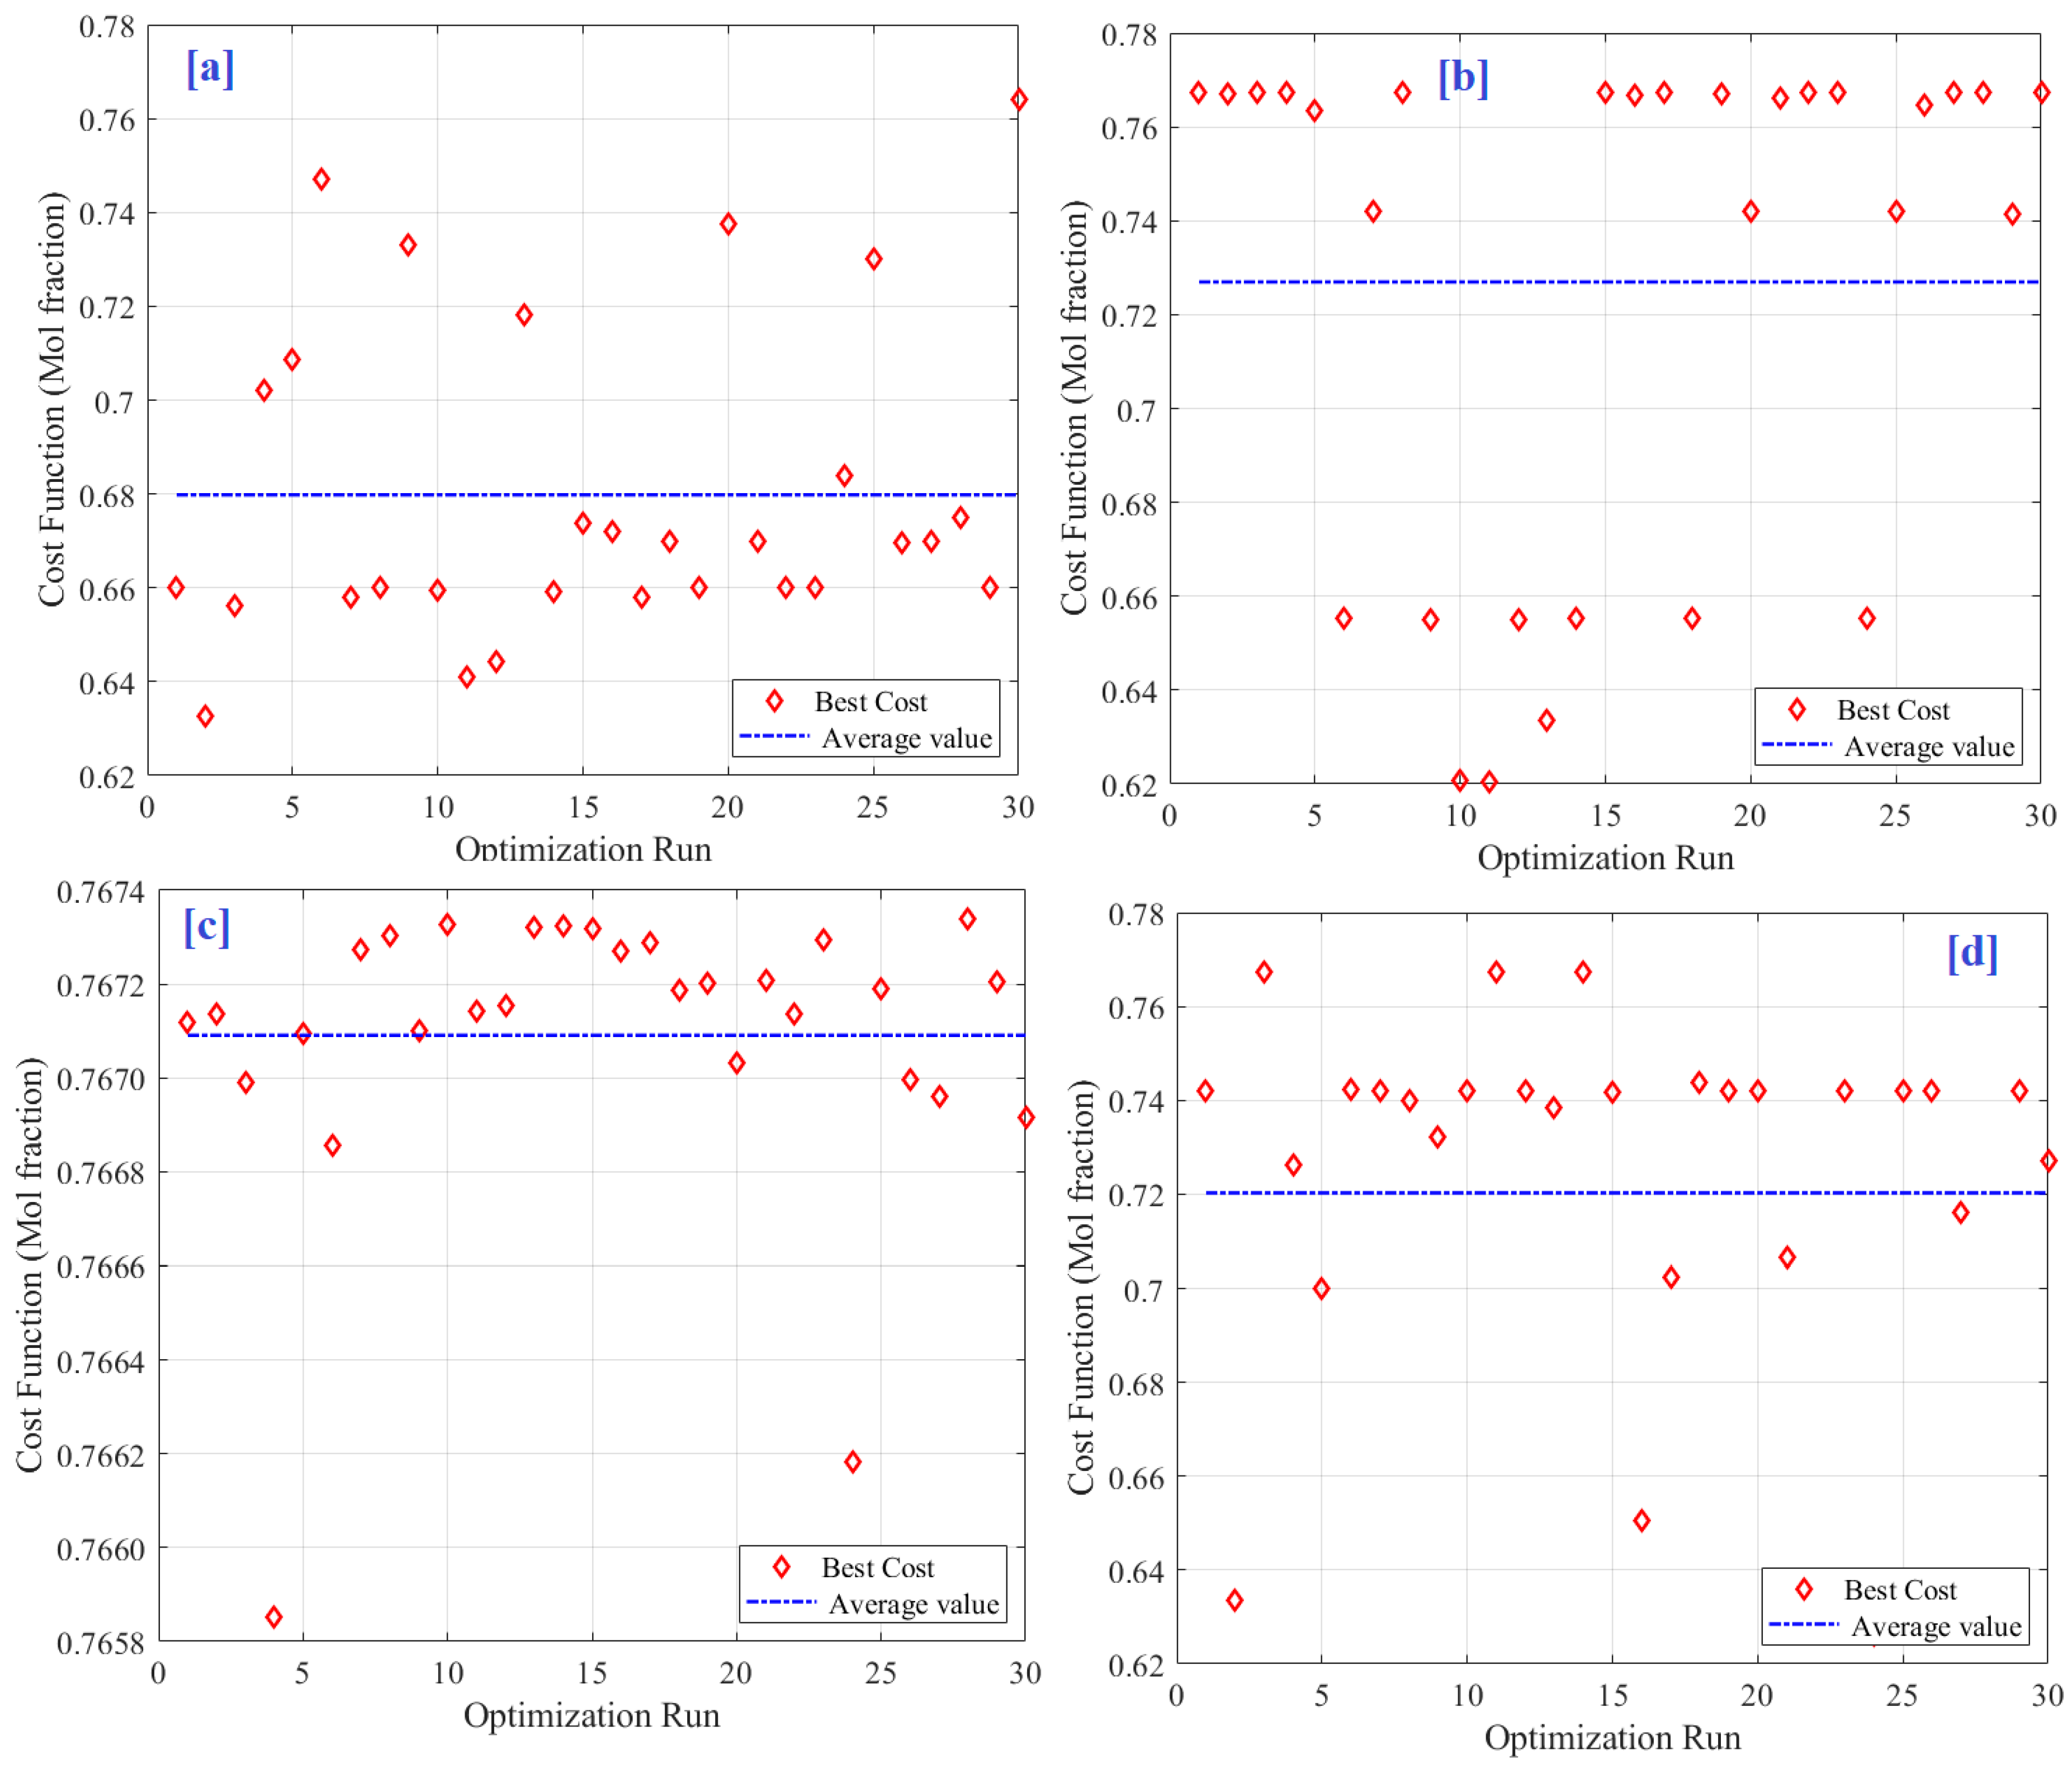
Figure 9 shows the performance of the five optimization algorithms considered in the 30-run processes. This procedure is usually performed to demonstrate the robustness of every optimizer based on the calculated average and STD values of the optimizer outputs throughout the whole run. The optimizer was considered more robust when the average value was closer to the best value. In addition, when the standard deviation is small, the results of most runs are very close to each other. As shown in Figure 9c, the IGWO produced the best (highest) average value. It is clear that the average value is really close to the optimal value. Additionally, each run yielded a result distributed close to the average value, and most of the results were above the average. These findings were obtained because of the guided convergence behavior of the proposed solutions during the search process, as shown in Figure 8. In contrast, SMA exhibited the lowest average value, as shown in Figure 9a. In addition, the SMA results were broadly scattered, most of which were lower than the average value. This conclusion supports and matches the statistical analysis illustrated in Table 4, which presents the cost function values obtained during the 30 optimization runs.
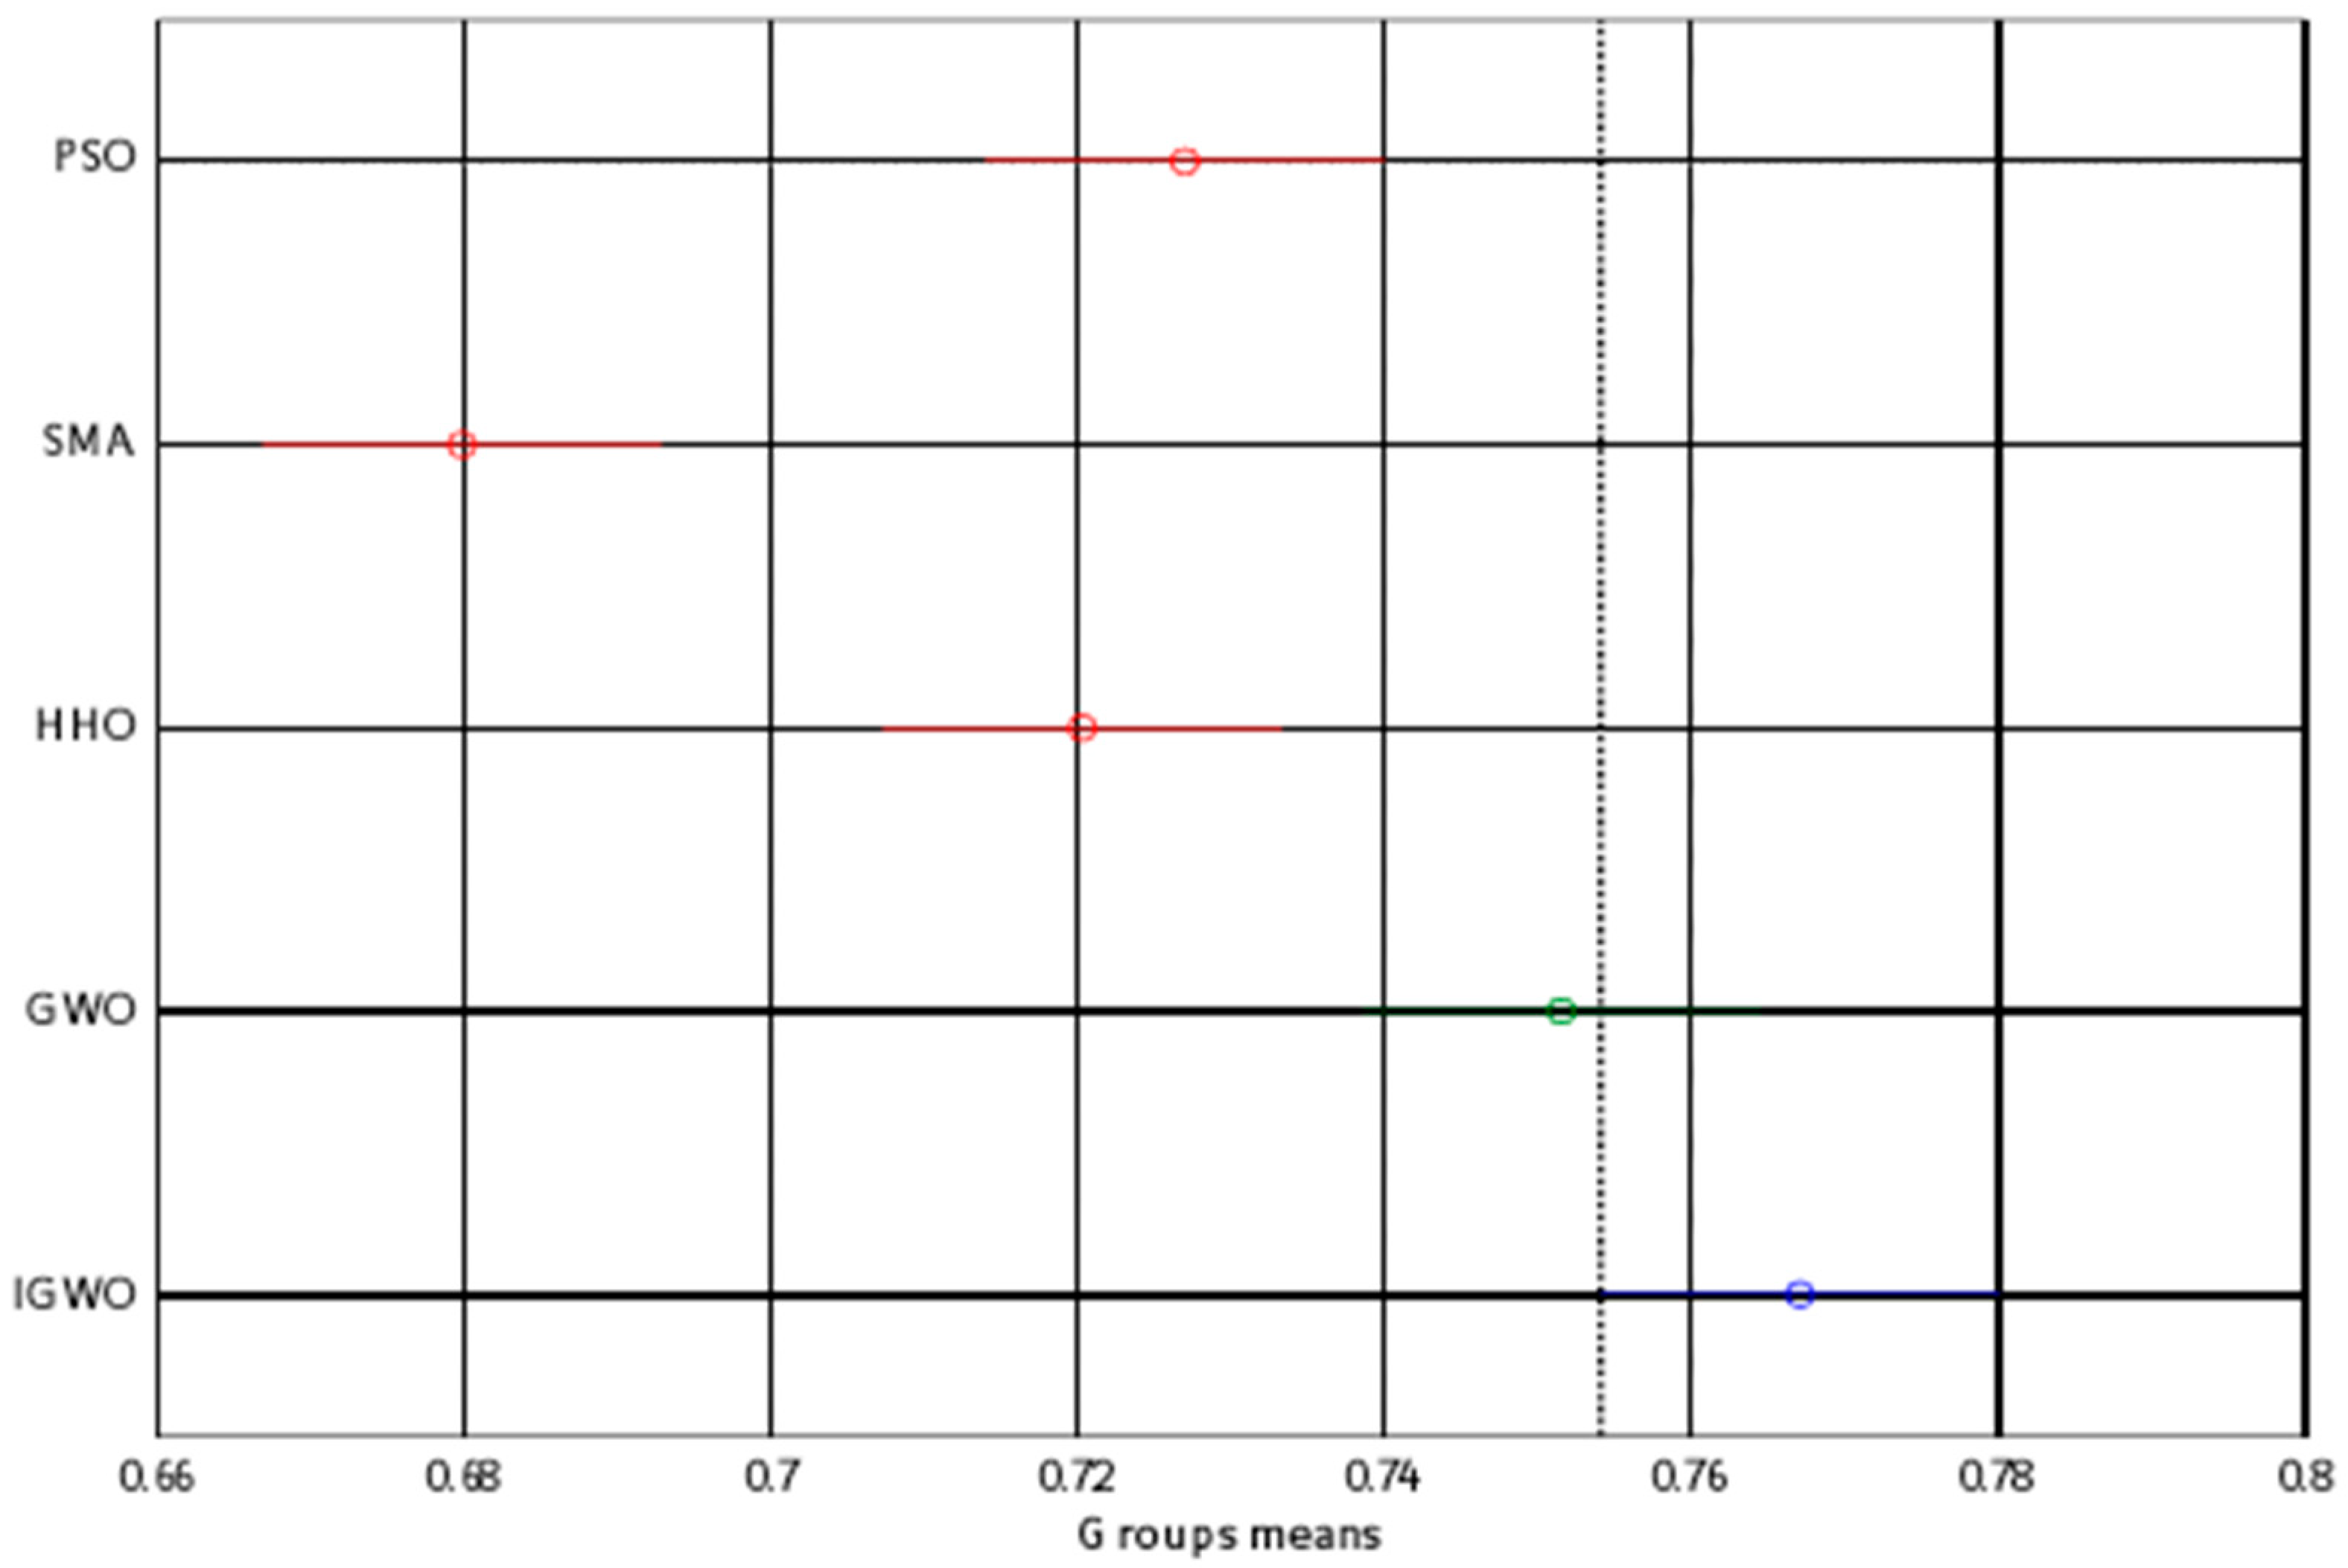
Table 5 displays the results of the ANOVA analysis conducted on the data set in this study, and their corresponding ranking is illustrated in Figure 10. The ANOVA technique was employed to compare the means of different groups to identify any significant differences between them. The p-value obtained from the ANOVA results is higher than the F-value, confirming the difference between the provided performances. The table reveals that there is a statistically significant difference between the means of the various groups based on the column variable, as evidenced by the high F-value and low p-value. The error row in the table represents the unexplained variability within each group, whereas the total row represents the overall variability in the data set. As illustrated in Figure 10, the IGWO algorithm can provide excellent performance compared to other competitive algorithms. The IGWO produced the lowest variation range with the highest mean fitness, which demonstrated its robustness and accuracy.
To confirm the high performance of the proposed IGWO algorithm, the Tukey honestly significant difference (HSD) test, that was used to validate the findings of each optimizer, was performed, and the results are presented in Figure 11. Similar to the findings of the ANOVA test, the IGWO provided a higher mean fitness. Thus, it can effectively solve this problem.

6. Recommendations for Policy Implementation

This approach is based on the premise that modeling outcomes are dependable only if the constructed model is trustworthy and resilient. Hence, an ANFIS-based AI technique was utilized to develop this model. Once the model was established, an optimization tool was applied to determine the optimal set of controlling parameters that maximized the output of the pre-built model. This approach enables accurate and efficient modeling outcomes, which can provide valuable insights for policy implementation. Using this methodology, policymakers can make informed decisions and implement effective policies that positively impact the system being studied. The proposed approach can also be applied in other fields, providing an innovative and robust solution for policy development and implementation.

7. Study Limitations and Future Works

In conclusion, this study provides valuable insights into the application of machine learning techniques for predicting the performance of a particular system. However, it is important to note that this study is hindered by two significant limitations that must be addressed in future research. The first limitation is the limited number of experimental data points, which negatively impacts the accuracy of the results. Although the available data were carefully selected and analyzed, a larger dataset would provide more information and help improve the accuracy of the predictions.
The second limitation is the premature convergence problem that arises during the optimization process, leading to suboptimal solutions. This issue could be addressed by adopting a more recent and advanced optimizer that can overcome this problem and achieve better results. Despite these limitations, this study demonstrated the potential of machine learning techniques for predicting system performance and can serve as a starting point for further research in this area.
To overcome these limitations in future research, it is imperative to conduct additional experiments to increase the amount of data and explore alternative modern and competitive optimizers. Expanding the modeling data samples would provide a more comprehensive understanding of the system, whereas exploring alternative optimizers would ensure the validity and robustness of the findings. In addition, other machine learning techniques could be explored to improve the accuracy of the predictions and enhance the overall performance of the system.
In summary, this study provides valuable insights into the application of machine learning techniques for predicting system performance. Although limitations exist, they can be addressed in future research by conducting additional experiments and exploring alternative optimizers. With these improvements, the use of machine learning techniques can be further enhanced to provide more accurate and reliable predictions for various systems.

8. Conclusions

Carbon dioxide absorption is one of the strategies that can significantly help in reducing the harmful effects of its emissions. In this context, the work in this paper addresses an effective methodology for increasing the percentage of CO2 absorption. The proposed approach is composed of two successive stages. The main task of the first stage is to build an ANFIS model of the mol fraction in terms of three controlling parameters such as the concentration of [TBP][MeSO3], temperature, and pressure of CO2. The resulting ANFIS model performed well based on the low RMSE values for both training and testing, which reached 0.0017 and 0.0229, respectively. Additionally, in both phases, the model’s predictions showed full tracking with their associated experimental samples. This was indicated by the high correlation values of the calculated R2 that reached 0.9996 and 0.9632 for both phases, respectively. Referring to ANOVA results, the RMSE and predicted R2 for the entire samples were 0.1174 and 0.8443, respectively. However, the ANFIS model yielded values of 0.0126 and 0.9758 for the same markers, respectively. This indicates that the RMSE is decreased by 9.32 times, and the signal tracking is increased by 15.58% when using the ANFSI instead of ANOVA. Based on this comparison, the ANFIS outperformed the classical ANOVA modeling techniques.
The second stage involves identifying the best values of the controlling parameters using a recent and qualitative optimizer, namely an improved grey wolf optimizer (IGWO). The results were compared with their corresponding four comparators, namely particle swarm optimization (PSO), slime mould algorithm (SMA), Harris Hawks optimization (HHO), as well as the original version of grey wolf optimizer (GWO). The lowest STD value of 0.00032 was obtained by IGWO, whereas the highest STD of 0.05486 was obtained using PSO. The best average cost function of 0.76585 was obtained using IGWO, whereas the worst mean cost function of 0.67981 was obtained using SMA. This proved the efficacy of the IGWO not only in obtaining the best optimal values but also in its particles which showed a better convergence curve during the optimization procedure. The best values were found to be 3.0933 wt%, 40.5 °C, and 30 bar, respectively, for the controlling parameter of concentration of [TBP][MeSO3], temperature, and pressure of CO2. Under these conditions, the combination of IGWO and ANFIS has increased the mol fraction from 0.67 to 0.76 by approximately 13.4% compared to the experimental data and the RSM approach. Consequently, the findings of this work can help in reducing the negative effects of CO2 emissions to retain a sustainable environment.
In conclusion, this paper highlighted the potential of integrating ANFIS as an AI tool and the IGWO as a recent and powerful optimizer to optimize the solubility of CO2. For future work, the paper suggests that further experiments need to be conducted to increase the available data points. Furthermore, different qualitative optimizers that overcome the premature convergence problem can also be applied.

Funding

This research was funded by the Deputyship for Research & Innovation, Ministry of Education in Saudi Arabia, project number (IF2/PSAU/2022/01/22030).

Institutional Review Board Statement

Not applicable.

Informed Consent Statement

Not applicable.

Data Availability Statement

Not applicable.

Acknowledgments

The authors extend their appreciation to the Deputyship for Research & Innovation, Ministry of Education in Saudi Arabia, for funding this research work through project number (IF2/PSAU/2022/01/22030).

Conflicts of Interest

The author declares no conflict of interest.

Nomenclature

List of Abbreviations
AIartificial intelligence
ANFISadaptive neuro-fuzzy inference system
ANNartificial neural network
ANOVAanalysis of variance
CCScarbon capture and storage
CO2carbon dioxide
dfdegrees of freedom
DIPAdiisopropanolamine
DLHlearning-based hunting
FLfuzzy logic
GDgradient descent
GWOgrey wolf optimizer
HHOHarris Hawks optimization
HSDhonestly significant difference
IGWOintelligent grey wolf optimizer
ILsionic liquids
LSEleast squares estimate
MDEAsmethyl diethanolamines
MEAsmonoethanolamines
MSmean square
PSOparticle swarm optimization
PZpiperazine
RMSEroot-mean-square deviation
SCsubtractive clustering
SMAslime mould algorithm
SMRsteam methane reforming
SSsum of squares
TEAstriethanolamines
[TBP][MeSO3] concentration of tetrabutylphosphonium methanesulfonate
List of symbols
A, BMFs of a and b
cfinal crisp output, output
Cparameter
C α , β , δ i k scalar variable
ddimension
D i , j k x i k , x j k Euclidean distance between the solutions x i k and x j k
f(.) cost function
f i output
jneighboring solution
kiteration
Ldlower limit
ntotal number of rules
n C O 2 a b s absorbed CO2 molecules
n C O 2 i initial moles of the CO2
Peqpressure at equilibrium
Rgas constant, radius
rrandom generator in the range [0 1]
R2coefficient of determination
r2, r3integer number
r 1 i k , r 2 i k random numbers associated to the ith solution at an iteration k
r i k random generated variable
Ttemperature of the reservoir
Udupper limit
Vresvolume of the reservoir
Vsvolume of the aqueous MEA-[TBP][MeSO3]
Wavgweighted average
W i   weight
xthree controlling parameters
( x i k + 1 ) D L H updated solutions using DLH
( x i k + 1 ) G W O updated solutions using GWO
x α , β , δ i k the ith solution update at an iteration k
x i d initial solution
x i k ith solution (wolf)
x i k ,   x i k + 1 current and updated positions of the ith solution at iteration k
x n k random selected neighbor solution
x p k   prey positions at an iteration k
x r k   solution selected randomly from the solutions’ pool
ZCO2compressibility of the CO2
Greek symbols
𝛼alpha (wolf position)
𝛽beta (wolf position)
𝛿delta (wolf position)
ωomega (remaining set of wolves)
a k scalar parameter

References

  1. Olabi, A.G.; Wilberforce, T.; Elsaid, K.; Sayed, E.T.; Maghrabie, H.M.; Abdelkareem, M.A. Large Scale Application of Carbon Capture to Process Industries–A Review. J. Clean. Prod. 2022, 362, 132300. [Google Scholar] [CrossRef]
  2. Jouhara, H.; Olabi, A.G. Industrial Waste Heat Recovery. Energy 2018, 160, 1–2. [Google Scholar] [CrossRef]
  3. Zacharczuk, W.; Andruszkiewicz, A.; Tatarek, A.; Alahmer, A.; Alsaqoor, S. Effect of Ca-Based Additives on the Capture of SO2 during Combustion of Pulverized Lignite. Energy 2021, 231, 120988. [Google Scholar] [CrossRef]
  4. Adaileh, W.; Alahmer, A. Reduction of the Spark Ignition Engine Emissions Using Limestone Filter. Can. J. Pure Appl. Sci. 2014, 8, 2761–2767. [Google Scholar]
  5. Jouhara, H.; Khordehgah, N.; Almahmoud, S.; Delpech, B.; Chauhan, A.; Tassou, S.A. Waste Heat Recovery Technologies and Applications. Therm. Sci. Eng. Prog. 2018, 6, 268–289. [Google Scholar] [CrossRef]
  6. Alsaqoor, S.; Alahmer, A.; Aljabarin, N.; Gougazeh, M.; Czajczynska, D.; Krzyzynska, R. Effects of Utilization of Solid and Semi-Solid Organic Waste Using Pyrolysis Techniques. In Proceedings of the 2017 8th International Renewable Energy Congress (IREC), Amman, Jordan, 21–23 March 2017; pp. 1–5. [Google Scholar]
  7. Aladayleh, W.; Alahmer, A. Recovery of Exhaust Waste Heat for ICE Using the Beta Type Stirling Engine. J. Energy 2015, 2015, 495418. [Google Scholar] [CrossRef] [Green Version]
  8. Brough, D.; Jouhara, H. The Aluminium Industry: A Review on State-of-the-Art Technologies, Environmental Impacts and Possibilities for Waste Heat Recovery. Int. J. Thermofluids 2020, 1, 100007. [Google Scholar] [CrossRef]
  9. Fierro, J.J.; Escudero-Atehortua, A.; Nieto-Londoño, C.; Giraldo, M.; Jouhara, H.; Wrobel, L.C. Evaluation of Waste Heat Recovery Technologies for the Cement Industry. Int. J. Thermofluids 2020, 7, 100040. [Google Scholar] [CrossRef]
  10. Beguedou, E.; Narra, S.; Afrakoma Armoo, E.; Agboka, K.; Damgou, M.K. Alternative Fuels Substitution in Cement Industries for Improved Energy Efficiency and Sustainability. Energies 2023, 16, 3533. [Google Scholar] [CrossRef]
  11. Egilegor, B.; Jouhara, H.; Zuazua, J.; Al-Mansour, F.; Plesnik, K.; Montorsi, L.; Manzini, L. ETEKINA: Analysis of the Potential for Waste Heat Recovery in Three Sectors: Aluminium Low Pressure Die Casting, Steel Sector and Ceramic Tiles Manufacturing Sector. Int. J. Thermofluids 2020, 1, 100002. [Google Scholar] [CrossRef]
  12. Sayed, E.T.; Abdelkareem, M.A.; Bahaa, A.; Eisa, T.; Alawadhi, H.; Al-Asheh, S.; Chae, K.-J.; Olabi, A.G. Synthesis and Performance Evaluation of Various Metal Chalcogenides as Active Anodes for Direct Urea Fuel Cells. Renew. Sustain. Energy Rev. 2021, 150, 111470. [Google Scholar] [CrossRef]
  13. Tanveer, W.H.; Abdelkareem, M.A.; Kolosz, B.W.; Rezk, H.; Andresen, J.; Cha, S.W.; Sayed, E.T. The Role of Vacuum Based Technologies in Solid Oxide Fuel Cell Development to Utilize Industrial Waste Carbon for Power Production. Renew. Sustain. Energy Rev. 2021, 142, 110803. [Google Scholar] [CrossRef]
  14. Alrbai, M.; Hayajneh, H.S.; Al-Dahidi, S.; Alahmer, A. Thermodynamics Analysis of a Lab Scale Humidification-Dehumidification Desalination System Employing Solar Energy and Fogging Approach. Sol. Energy 2022, 247, 397–407. [Google Scholar] [CrossRef]
  15. Olabi, A.G.; Wilberforce, T.; Sayed, E.T.; Shehata, N.; Alami, A.H.; Maghrabie, H.M.; Abdelkareem, M.A. Prospect of Post-Combustion Carbon Capture Technology and Its Impact on the Circular Economy. Energies 2022, 15, 8639. [Google Scholar] [CrossRef]
  16. Abdelkareem, M.A.; Lootah, M.A.; Sayed, E.T.; Wilberforce, T.; Alawadhi, H.; Yousef, B.A.A.; Olabi, A.G. Fuel Cells for Carbon Capture Applications. Sci. Total Environ. 2021, 769, 144243. [Google Scholar] [CrossRef] [PubMed]
  17. Silveira, B.H.M.; Costa, H.K.M.; Santos, E.M. Bioenergy with Carbon Capture and Storage (BECCS) in Brazil: A Review. Energies 2023, 16, 2021. [Google Scholar] [CrossRef]
  18. Liu, E.; Lu, X.; Wang, D. A Systematic Review of Carbon Capture, Utilization and Storage: Status, Progress and Challenges. Energies 2023, 16, 2865. [Google Scholar] [CrossRef]
  19. Podder, J.; Patra, B.R.; Pattnaik, F.; Nanda, S.; Dalai, A.K. A Review of Carbon Capture and Valorization Technologies. Energies 2023, 16, 2589. [Google Scholar] [CrossRef]
  20. Rufford, T.E.; Smart, S.; Watson, G.C.Y.; Graham, B.F.; Boxall, J.; Da Costa, J.C.D.; May, E.F. The Removal of CO2 and N2 from Natural Gas: A Review of Conventional and Emerging Process Technologies. J. Pet. Sci. Eng. 2012, 94, 123–154. [Google Scholar] [CrossRef]
  21. Ünveren, E.E.; Monkul, B.Ö.; Sarıoğlan, Ş.; Karademir, N.; Alper, E. Solid Amine Sorbents for CO2 Capture by Chemical Adsorption: A Review. Petroleum 2017, 3, 37–50. [Google Scholar] [CrossRef]
  22. Guo, Y.; Wang, Q.; Geng, M.; Peng, X.; Feng, J. Effects of Liquid Density on the Gas-Liquid Interaction of the Ionic Liquid Compressor for Hydrogen Storage. Energies 2023, 16, 3193. [Google Scholar] [CrossRef]
  23. Ali, S.A.; Mulk, W.U.; Ullah, Z.; Khan, H.; Zahid, A.; Shah, M.U.H.; Shah, S.N. Recent Advances in the Synthesis, Application and Economic Feasibility of Ionic Liquids and Deep Eutectic Solvents for CO2 Capture: A Review. Energies 2022, 15, 9098. [Google Scholar] [CrossRef]
  24. Cao, Y.; Mu, T. Comprehensive Investigation on the Thermal Stability of 66 Ionic Liquids by Thermogravimetric Analysis. Ind. Eng. Chem. Res. 2014, 53, 8651–8664. [Google Scholar] [CrossRef]
  25. Mezzetta, A.; Perillo, V.; Guazzelli, L.; Chiappe, C. Thermal Behavior Analysis as a Valuable Tool for Comparing Ionic Liquids of Different Classes. J. Therm. Anal. Calorim. 2019, 138, 3335–3345. [Google Scholar] [CrossRef]
  26. Aghaie, M.; Rezaei, N.; Zendehboudi, S. A Systematic Review on CO2 Capture with Ionic Liquids: Current Status and Future Prospects. Renew. Sustain. Energy Rev. 2018, 96, 502–525. [Google Scholar] [CrossRef]
  27. Yan, H.; Zhao, L.; Bai, Y.; Li, F.; Dong, H.; Wang, H.; Zhang, X.; Zeng, S. Superbase Ionic Liquid-Based Deep Eutectic Solvents for Improving CO2 Absorption. ACS Sustain. Chem. Eng. 2020, 8, 2523–2530. [Google Scholar] [CrossRef]
  28. Zainul Anuar, M.a.b.U.; Taha, M.F.; Md Yunus, N.M.; Mat Ghani, S.M.; Idris, A. An Optimization Study of Carbon Dioxide Absorption into the Aqueous Solution of Monoethanolamine and Tetrabutylphosphonium Methanesulfonate Hybrid Solvent Using RSM-CCD Methodology. Processes 2021, 9, 1186. [Google Scholar] [CrossRef]
  29. Rezk, H.; Mohammed, R.H.; Rashad, E.; Nassef, A.M. ANFIS-Based Accurate Modeling of Silica Gel Adsorption Cooling Cycle. Sustain. Energy Technol. Assessments 2022, 50, 101793. [Google Scholar] [CrossRef]
  30. Nassef, A.M.; Fathy, A.; Abdelkareem, M.A.; Olabi, A.G. Increasing Bio-Hydrogen Production-Based Steam Reforming ANFIS Based Model and Metaheuristics. Eng. Anal. Bound. Elem. 2022, 138, 202–210. [Google Scholar] [CrossRef]
  31. Alahmer, A.; Rezk, H.; Aladayleh, W.; Mostafa, A.O.; Abu-Zaid, M.; Alahmer, H.; Gomaa, M.R.; Alhussan, A.A.; Ghoniem, R.M. Modeling and Optimization of a Compression Ignition Engine Fueled with Biodiesel Blends for Performance Improvement. Mathematics 2022, 10, 420. [Google Scholar] [CrossRef]
  32. Mun, J.-H.; Shin, B.-J.; Kim, S.-M.; You, J.K.; Park, Y.C.; Chun, D.-H.; Lee, J.-S.; Min, B.-M.; Lee, U.; Kim, K.-M. Optimal MEA/DIPA/Water Blending Ratio for Minimizing Regeneration Energy in Absorption-Based Carbon Capture Process: Experimental CO2 Solubility and Thermodynamic Modeling. Chem. Eng. J. 2022, 444, 136523. [Google Scholar] [CrossRef]
  33. Kum, J.; Oh, H.-T.; Park, J.; Kang, J.-H.; Lee, C.-H. Techno-Economic Analysis and Optimization of a CO2 Absorption Process with a Solvent Looping System at the Absorber Using an MDEA/PZ Blended Solvent for Steam Methane Reforming. Chem. Eng. J. 2023, 455, 140685. [Google Scholar] [CrossRef]
  34. Nassef, A.M.; Rezk, H.; Alahmer, A.; Abdelkareem, M.A. Maximization of CO2 Capture Capacity Using Recent RUNge Kutta Optimizer and Fuzzy Model. Atmosphere 2023, 14, 295. [Google Scholar] [CrossRef]
  35. Ochedi, F.O.; Yu, J.; Yu, H.; Liu, Y.; Hussain, A. Carbon Dioxide Capture Using Liquid Absorption Methods: A Review. Environ. Chem. Lett. 2021, 19, 77–109. [Google Scholar] [CrossRef]
  36. Khan, S.N.; Hailegiorgis, S.M.; Man, Z.; Shariff, A.M.; Garg, S. Thermophysical Properties of Concentrated Aqueous Solution of N-Methyldiethanolamine (MDEA), Piperazine (PZ), and Ionic Liquids Hybrid Solvent for CO2 Capture. J. Mol. Liq. 2017, 229, 221–229. [Google Scholar] [CrossRef]
  37. Ren, J.; Li, Z.; Chen, Y.; Yang, Z.; Lu, X. Supported Ionic Liquid Sorbents for CO2 Capture from Simulated Flue-Gas. Chinese J. Chem. Eng. 2018, 26, 2377–2384. [Google Scholar] [CrossRef]
  38. Ivanova, A.S.; Brinzer, T.; Roth, E.A.; Kusuma, V.A.; Watkins, J.D.; Zhou, X.; Luebke, D.; Hopkinson, D.; Washburn, N.R.; Garrett-Roe, S. Eutectic Ionic Liquid Mixtures and Their Effect on CO2 Solubility and Conductivity. RSC Adv. 2015, 5, 51407–51412. [Google Scholar] [CrossRef]
  39. Lv, B.; Xia, Y.; Shi, Y.; Liu, N.; Li, W.; Li, S. A Novel Hydrophilic Amino Acid Ionic Liquid [C2OHmim][Gly] as Aqueous Sorbent for CO2 Capture. Int. J. Greenh. Gas Control 2016, 46, 1–6. [Google Scholar] [CrossRef]
  40. Zhou, Z.; Zhou, X.; Jing, G.; Lv, B. Evaluation of the Multi-Amine Functionalized Ionic Liquid for Efficient Postcombustion CO2 Capture. Energy Fuels 2016, 30, 7489–7495. [Google Scholar] [CrossRef]
  41. Zeng, S.; Zhang, X.; Bai, L.; Zhang, X.; Wang, H.; Wang, J.; Bao, D.; Li, M.; Liu, X.; Zhang, S. Ionic-Liquid-Based CO2 Capture Systems: Structure, Interaction and Process. Chem. Rev. 2017, 117, 9625–9673. [Google Scholar] [CrossRef]
  42. Salameh, T.; Sayed, E.T.; Olabi, A.G.; Hdaib, I.I.; Allan, Y.; Alkasrawi, M.; Abdelkareem, M.A. Adaptive Network Fuzzy Inference System and Particle Swarm Optimization of Biohydrogen Production Process. Fermentation 2022, 8, 483. [Google Scholar] [CrossRef]
  43. Alahmer, H.; Alahmer, A.; Alkhazaleh, R.; Alrbai, M. Exhaust Emission Reduction of a SI Engine Using Acetone–Gasoline Fuel Blends: Modeling, Prediction, and Whale Optimization Algorithm. Energy Rep. 2023, 9, 77–86. [Google Scholar] [CrossRef]
  44. Alahmer, H.; Alahmer, A.; Alkhazaleh, R.; Al-Amayreh, M.I. Modeling, Polynomial Regression, and Artificial Bee Colony Optimization of SI Engine Performance Improvement Powered by Acetone–Gasoline Fuel Blends. Energy Rep. 2023, 9, 55–64. [Google Scholar] [CrossRef]
  45. Mirjalili, S.; Mirjalili, S.M.; Lewis, A. Grey Wolf Optimizer. Adv. Eng. Softw. 2014, 69, 46–61. [Google Scholar] [CrossRef] [Green Version]
  46. Alahmer, H.; Alahmer, A.; Alkhazaleh, R.; Alrbai, M.; Alamayreh, M.I. Applied Intelligent Grey Wolf Optimizer (IGWO) to Improve the Performance of CI Engine Running on Emulsion Diesel Fuel Blends. Fuels 2023, 4, 35–57. [Google Scholar] [CrossRef]
  47. Nadimi-Shahraki, M.H.; Taghian, S.; Mirjalili, S. An Improved Grey Wolf Optimizer for Solving Engineering Problems. Expert Syst. Appl. 2021, 166, 113917. [Google Scholar] [CrossRef]
  48. Alahmer, A.; Alahmer, H.; Handam, A.; Rezk, H. Environmental Assessment of a Diesel Engine Fueled with Various Biodiesel Blends: Polynomial Regression and Grey Wolf Optimization. Sustainability 2022, 14, 1367. [Google Scholar] [CrossRef]
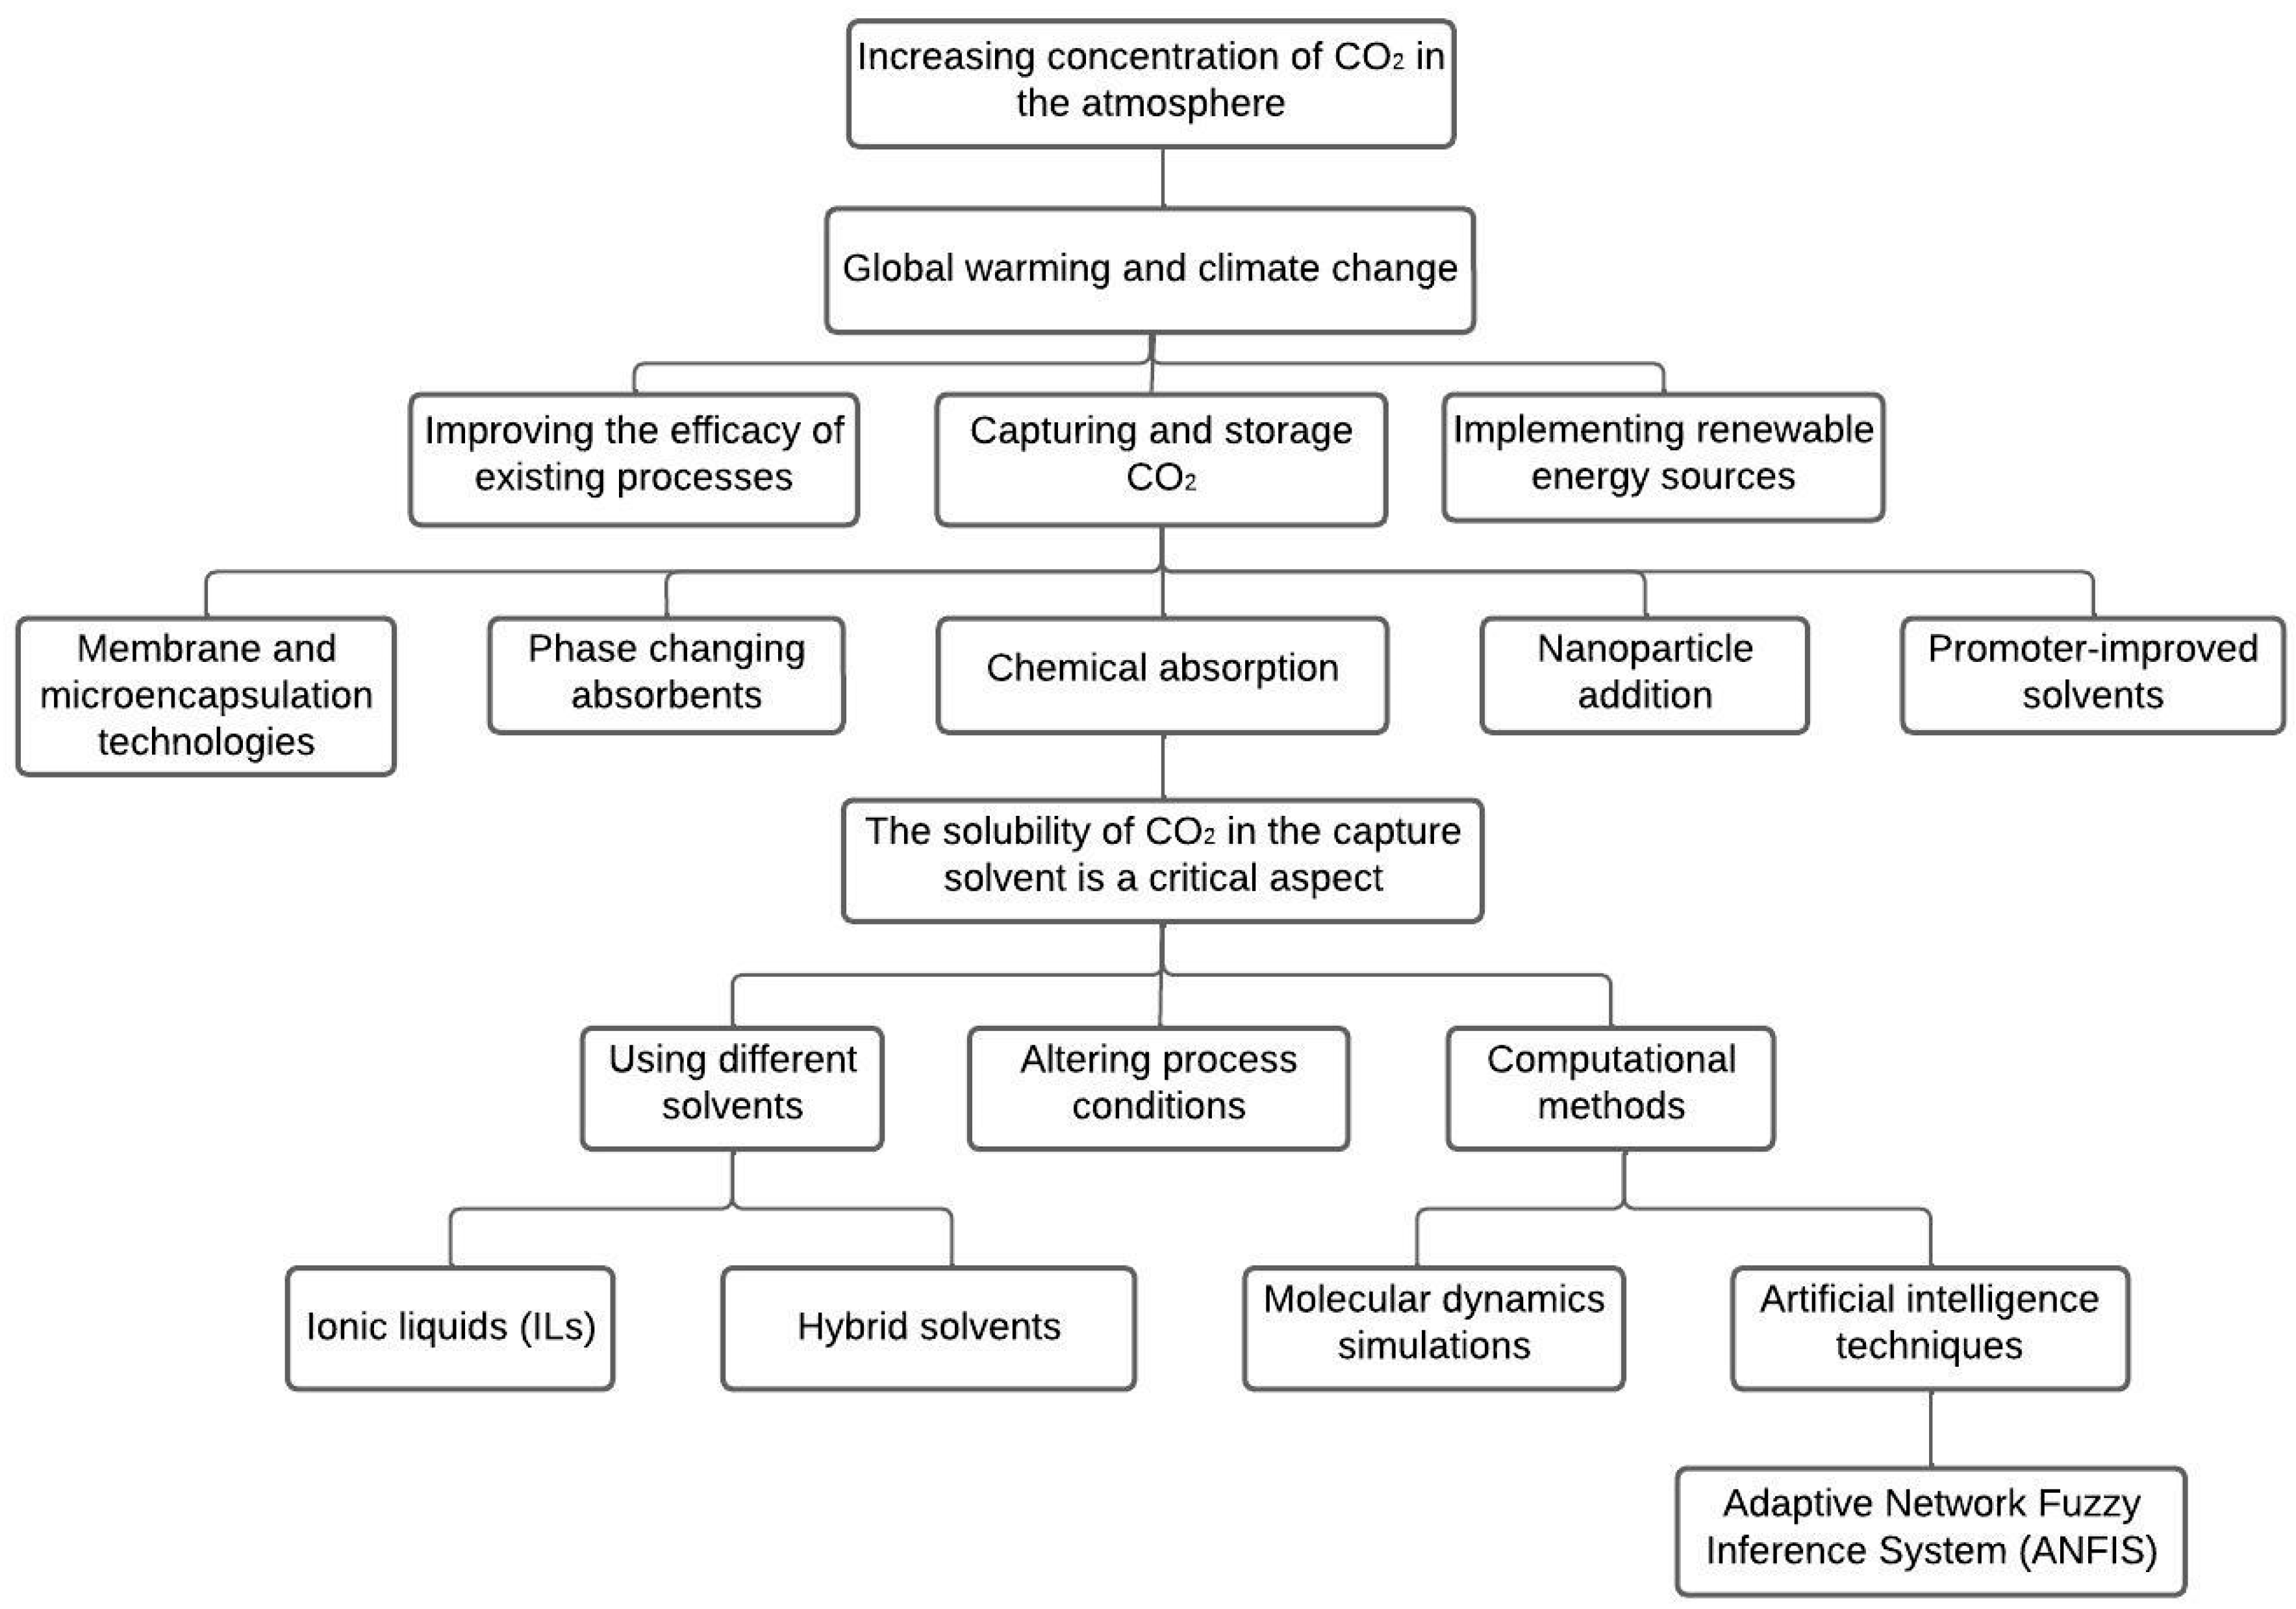
Figure 1. Visualizing CO2 capture: schematic representations of solubility-based technologies.
Sustainability 15 09512 g001
Figure 2. The proposed methodology.
Sustainability 15 09512 g002
Figure 3. Configuration of ANFIS-based model of mol fraction.
Sustainability 15 09512 g003
Figure 4. Inputs’ MFs of ANFIS-based model of mol fraction.
Sustainability 15 09512 g004
Figure 5. ANFIS-based model predictions of mol fraction versus experimental samples.
Sustainability 15 09512 g005
Figure 6. Predicted versus experimental data of ANFIS-based model of mol fraction.
Sustainability 15 09512 g006
Figure 7. The resulting 3-D surfaces that relate the mol fraction to every 2-input combination.
Sustainability 15 09512 g007
Figure 8. Optimization results; (a) best objective function variation using IGWO, (b) particle convergence of concentration of [TBP][MeSO3], (c) particle convergence of temperature, and (d) particle convergence of pressure of CO2.
Sustainability 15 09512 g008
Figure 9. Details of 30 runs; (a) SMA, (b) PSO, (c) IGWO, and (d) HHO.
Sustainability 15 09512 g009
Figure 10. ANOVA ranking.
Sustainability 15 09512 g010
Figure 11. Tukey test.
Sustainability 15 09512 g011
Table 1. Statistical evaluation of the ANFIS-based models.
Statistical Parameters of Different PhasesMSERMSECoefficient of Determination (R2)
Train2.8929 × 10−060.00170.9996
Test0.00050.02290.9632
All0.00020.01260.9758
Table 2. The optimal values set for the controlling variables using the addressed methods.
StrategyConcentration of [TBP][MeSO3] (wt%)Temperature (°C)Pressure of CO2 (bar)Mol Fraction
Experimental [28]230300.67
RSM [28]2.09330.3629.890.67
IGWO and ANFIS3.093340.50300.7674
Table 3. Statistical analysis for considered optimizers.
PSOSMAHHOGWOIGWO
Best value0.767390.764070.767390.767390.76734
Worst value0.620470.632530.626240.655290.76585
Average value0.726980.679810.720270.751510.76709
STD0.054860.033340.041820.027380.00032
Table 4. The cost function values during the 30-run optimization processes.
RunPSOSMAHHOGWOIGWORunPSOSMAHHOGWOIGWO
10.767380.660.742060.742060.76712160.766710.671960.650480.742010.76727
20.767130.632530.633540.767350.76714170.767380.658120.70240.767340.76729
30.767370.656130.767230.765660.76699180.65520.670.743650.767290.76719
40.767390.702110.726240.756920.76585190.767070.660050.742060.76360.7672
50.763370.708530.699920.767340.76709200.742040.737590.742060.767280.76703
60.655220.747110.742280.740460.76686210.766260.670.706430.767340.76721
70.742060.658070.742030.742020.76727220.767380.660170.628420.767170.76714
80.767380.660020.739880.767250.7673230.767320.660050.742060.767290.76729
90.654930.733020.73210.659520.7671240.655240.683950.626240.742050.76618
100.620650.659420.742060.763030.76733250.742050.730220.742060.767390.76719
110.620470.640950.767360.742020.76714260.764750.669690.742030.765880.767
120.655110.644410.742060.761850.76715270.767370.670.716070.747720.76696
130.633450.718190.73840.767330.76732280.767330.674970.63060.767340.76734
140.655230.659240.767390.741460.76732290.741450.660060.742060.655290.7672
150.767370.673670.741750.741670.76732300.76730.764070.727120.764490.76692
Table 5. ANOVA modelling results.
SourceSum of Squares
(SS)
Degrees of Freedom
(df)
(Mean Squared)
MS
Fp-Value > F
Columns0.1337340.0334324.411.8543 × 10−15
Error0.198561450.00173--
Total0.33232194---
Disclaimer/Publisher’s Note: The statements, opinions and data contained in all publications are solely those of the individual author(s) and contributor(s) and not of MDPI and/or the editor(s). MDPI and/or the editor(s) disclaim responsibility for any injury to people or property resulting from any ideas, methods, instructions or products referred to in the content.