Article

Use and Experience of Tourism Green Spaces in Ishigaki City before and during the COVID-19 Pandemic Based on Web Review Data

Graduate School of Horticulture, Chiba University, Chiba 271-8510, Japan
Sustainability 2023, 15(12), 9554; https://doi.org/10.3390/su15129554
Submission received: 7 May 2023 / Revised: 29 May 2023 / Accepted: 13 June 2023 / Published: 14 June 2023

Abstract

:
Urban Tourism Green Spaces (UTGSs) in Okinawa are the most frequented areas by tourists and are an important part of the area’s unique tourism image and brand value. This study selected 40 UTGSs in Ishigaki City, Okinawa, for comparative analysis before the COVID-19 pandemic (January 2009–December 2019) and during the strict control period (January 2020–December 2021). Data on tourist reviews were collected in Python. Correlations were collated through Pearson correlation tests. Text-mining methods were used to examine tourist reviews to characterise changes in tourists’ use and experience of UTGSs amid the extreme hardship experienced by tourist cities during the pandemic. Visitors expressed positive emotions towards the green space, particularly in post-pandemic times, despite disruptions and uncertainties caused by travel restrictions. Rather than focusing on water activities as before, visitors preferred exploring the island’s hinterland areas with low crowd density and seeking spiritual comfort in open public spaces. This highlights the potential of these areas to be developed as a new tourism resource. This study’s findings will provide valuable insights for urban planners and tourism operators in developing effective crisis response strategies and guiding the development of urban tourism areas towards more appealing and sustainable destinations.

1. Introduction

Ishigaki City is approximately 410 km southwest of Okinawa’s main island and 1900 km from Tokyo. It is the southernmost city in Japan [1,2]. Ishigaki Island, the city’s political, economic and transportation centre, has experienced a surge in tourism since 2013 when the new airport was built [3,4]. The number of tourists has exceeded one million per year [5]. Statistics show that the areas most frequented by residents and tourists fall under the Urban Tourism Green Spaces (UTGSs) category [6], including beaches, bays, parks, and traditional gardens in or around the city. These areas, with their rich diversity, relative accessibility, and distinctive geographical features, are among the most important factors in shaping the perception and brand value of tourism in Okinawa [7]. The public space with natural and managed vegetation is the primary tourist asset of Ishigaki. This city’s tourism image and value are also world-renowned owing to its unique regional attraction, the marine landscape, and the UTGSs [8]. Given that the COVID-19 pandemic is ongoing, Ishigaki, relying on the tourism industry as its main economic driver, faces significant challenges in the future recovery of tourism. Therefore, this study aimed to examine the changes in tourist behaviour by studying their utilisation of UTGSs during the crisis. The findings of this research will be particularly valuable for urban planners and tourism operators as the findings can inform the development of effective crisis response strategies and guide the sustainable development and attractiveness of urban tourism areas [9,10].
A series of negative factors at the tourism industry level emerged to control the spread of COVID-19, including immigration control policies in various countries, temporary closures of public places, policies restricting business activities, and public concerns about the safety of accessing public spaces [11,12,13,14]. Several studies have indicated that the impact of multiple extraordinary factors, such as reduced human activities during the pandemic, changes in the ecosystem, and the public’s willingness to seek relief from prolonged closure policies, has changed people’s use of green spaces in tourist cities [15,16]. As the vaccine became available and awareness of the COVID-19 pandemic grew, countries gradually began to lift the embargo, and the tourism industry began to recover [17]. During this period, the Japanese government introduced measures to promote GOTO tourism [4,18]. However, there have since been significant changes compared to past experiences [19]. The return to normal economic life under repeated pandemics in the future will inevitably differ from the period of strict restrictions in the last two years [20], constituting a completely new issue for the tourism industry to adapt to.
Visitors’ use of an area over time is characterised by their overall perceived preferences for it and its natural landscape [21]. Several studies have shown that the results of collecting and listening to a wide range of visitor-generated data, capturing the changing needs of visitors, and assessing the actual use of urban green spaces from a user’s perspective can directly reflect the effectiveness of the planning, design, and management of urban green spaces [22,23,24,25]. This study focuses on the urban tourism green areas that best represent the tourist image and value of Ishigaki City [26] and explores the changes in the use and causes of the tourism green areas from the tourist perspective before and after the COVID-19 pandemic. In 2019, there were 1.27 million annual visitors to Ishigaki City [27], and big data research is increasingly important for many tourists [28]. Tourism situational awareness based on big data provides a scientific reference for predicting tourists’ behavioural intentions, improving tourism satisfaction and optimising tourism green spaces in tourist cities [7].
As a new information environment consisting of open big data on the Internet gradually emerges, User-Generated Content (UGC) is increasingly regarded as a trusted form of information dissemination [29,30]. The study of UGC is publicly available on travel review platforms and is characterised by large sample size, timeliness, and diversity compared to traditional data. It is more advantageous in capturing individual behaviour, research depth, and trend prediction [31,32].
Research based on big data tools to understand tourists’ use and evaluation of urban green spaces is currently focused on obtaining web data of UGC. For example, Zhang and Zhang manually collected review data about Shanghai Chenshan Botanical Garden from Chinese tourism websites and built an IPA model to analyse tourists’ use of different areas within the botanical garden [33]. Zhu and Xu used Sina Weibo sign-in data based on correlation analysis to assess the use of urban green spaces in Beijing during COVID-19 [34]. Most studies of urban green spaces during the COVID-19 pandemic have explored the potential impact of urban green spaces on the physical and mental health of residents because of the pandemic closure policy. For example, Lopez et al. [35] analysed data from an online survey to demonstrate the use of urban green spaces in New York City during the pandemic and the health benefits they provided to residents. Jato-Espino et al. [36] used data from a questionnaire to conduct a correlation analysis to explore the beneficial social effects provided by green infrastructure during the strict Spanish embargo. Studies exploring the direction of urban green space planning in the post-pandemic era have stemmed from Li and Li’s [37] views on the need for prevention and control under the pandemic, such as zoning, route guidance, and planting special vegetation, and Fu et al.’s [38] views on the importance of public green space from the perspective of urban park management and planning accordingly. Most recent studies on urban green spaces focus on the special period of strict closure during the pandemic and lack studies on overall development. The use of questionnaires can often only capture data at that point, making it difficult to analyse changes in their characteristics over a longer timeline. Thus, future perspectives on UTGSs tend to focus on the need for pandemic prevention and crisis response and less on the normative needs of experience. Existing studies have shown that the most popular activities among urban residents in UTGS utilisation are sports and relaxation. Despite the travel restrictions imposed during the pandemic, residents have demonstrated an increased diversity in UTGS usage. Additionally, there is a clear preference for outdoor activities and a tendency to avoid densely populated areas [39,40]. However, the aforementioned studies primarily focus on the usage patterns of urban residents around green spaces and pay less attention to tourists’ perspectives. While countries are gradually lifting the restrictions imposed due to the pandemic, there remains a possibility of future outbreaks of COVID-19 or similar crises [20]. For tourism-dependent cities facing significant industry crises due to the impact of the pandemic, it is crucial to better understand the behavioural changes of tourists during crisis periods. This understanding will serve as an important foundation for future policy-making efforts. Understanding changes in tourist demands and preferences can guide crisis management, product development, marketing strategies, and sustainable development in the tourism industry [30,31]. Adapting strategies to boost tourist confidence; introducing safe travel products; exploring new destinations; targeting emerging interests in promotional efforts; promoting health, safety, and environmental certifications; and community involvement are essential for industry recovery [23,27]. Research findings provide crucial insights for decision making, ensuring safer and more sustainable tourism industry growth and preventing the complete standstill caused by crises, thus enhancing its sustainability.
Given the above background, this study chose Ishigaki City as a case study and collected online review data in Python, which contained information on the multiple uses of the tourism green space in Ishigaki City. We investigated the independence and relative change of the multiple-use status between different periods and the results of text mining of the reviews to understand the similarities and differences in tourists’ experience of the green space in Ishigaki City before and during the pandemic.

2. Materials and Methods

2.1. Subjects

This study selected the Nature & Parks sites in Ishigaki on the world’s largest travel review website, TripAdvisor, for 40 urban tourism green spaces. Based on research and statistics, TripAdvisor is the most popular travel website in Japan in terms of user activity and number of users. The Japanese tourism industry relies on TripAdvisor’s data for content planning, destination marketing, and decision making based on emerging trends. TripAdvisor has maintained its industry leadership by expanding its coverage of destinations and enhancing its localised user experience. To address issues such as duplicated posts by the same user across different platforms and statistical biases caused by varying user numbers on each platform, this study exclusively used TripAdvisor as the data source [41].
The TripAdvisor online platform is considered a large database of landscape reviews, accumulating a large amount of real and personal UGC from tourists worldwide [42]. Ishigaki City has recorded the biggest year-over-year increase in positive review ratings, searches, and booking growth in 2017. Moreover, it was first on the list of rising destinations for 2018, according to TripAdvisor [43].
Based on the UGC data, we covered 224 attractions in this study, most of which are difficult to cover with official visitor statistics. In addition, official visitor statistics are only available for a limited number of well-known attractions in the Okinawa region and do not comprehensively cover most free attractions. By utilising UGC data from TripAdvisor, this study could include almost all of the UTGSs, which would have been challenging to achieve solely through official visitor statistics. Therefore, using TripAdvisor as a data source in this study allowed us to indirectly assess visitor utilisation trends for these attractions, which is a more advantageous method with broader coverage of the study population versus using official visitor count statistics directly [44]. Thus, the selection of TripAdvisor as a data source for studying tourism green spaces in Ishigaki has the advantages of a large sample size, a wide audience, a large time span, a high degree of credibility, and quality information.

2.2. Data Collection

This research employed Python 3.7 for data crawling, following a specific four-step process. First, the Scrapy crawler framework was utilised to examine the source code of TripAdvisor web pages, identify the relevant data location related to the research subject, and analyse the structure of the web page’s source code. Second, the webpage data were transformed into structured data using the Python libraries requests and BeautifulSoup. Third, with the assistance of the PyMongo library, the data were read in a loop, and the page number range was divided into the database using the range function. A loop threshold was also set to control the crawling process [43]. Finally, the acquired data were de-duplicated, filtered, recognised in the text language, and generated into an Excel table. The data used above are generally public information, do not involve personal privacy, and do not affect the normal use of the site.

2.3. Independence Test Relative Change Statistics

The data statistics for this study were conducted using SPSS 25 and KH Coder 3. The raw data obtained were first sorted by date of visit. A bivariate correlation analysis of quantitative data was conducted using year-by-year counts of the raw data and the number of tourists entering the domain in Ishigaki City over the years [45]. This was conducted to determine whether the two could predict or explain each other and to verify the applicability of the raw data to the study of the overall tourist population [46].

2.4. Bivariate Relative Change Statistics

In bivariate correlation analysis, a Sig. (2-tailed) value at the 0.05 and 0.01 levels is considered a significant correlation between the two variables. The Pearson correlation coefficient is a statistic describing the degree and direction of correlation between two variables [47].
The time point of the pandemic in Japan was January 2020. This study selected January 2020 as the pre- and post-pandemic demarcation for two sets of raw data [48].
Based on the utilisation information contained in the raw data, such as rating, type of travel, date of travel, user location, review text, name of attraction, type of attraction, and so forth, the qualitative data typology of multiple utilisation status elements was conducted. These were rating, type of travel, time of travel, type of green space, and tourist travel experience. The rating, type of travel and time of travel are based on the original data, with ratings ranging from 1 to 5; type of travel including Solo, Couple, Friend, Family, and Business; and time of travel differentiated by 12 months. The type of green space is based on the classification of the composition of urban green space and natural scenery in Okinawa from Muranaka [49] and Chen [50]. It includes beach and water, park and garden, and mountain and forest caves based on the names and types of sites. Tourist travel experience is based on Helmus et al.’s [51] estimation of the distribution range of the data, and this is based on the total distance travelled by the users and using 27% of the data intervals before and after, which includes a small number of travellers (0–9606 km), medium travellers (9607–162,830 km) and large travellers (162,831–3,530,400 km).
Next, this study pioneered the hypothesis of independence between two pairs of utilisation status elements. Using two sets of data before and during the pandemic, a two-pair cross-tabulation table was created using SPSS for each of the six types of qualitative data mentioned above. A Pearson’s chi-squared test was conducted to determine whether the elements of utilisation status showed independence from each other.
The test was conducted by calculating Pearson’s chi-squared value (X2) as well as the degrees of freedom (df), comparing their corresponding chi-squared assigned critical value tables, specifying the asymptotic significance (sig), and inferring whether the null hypothesis can be rejected.
If the degree of freedom df = (r − 1)(c − 1) and asymptotic significance (sig) is less than or equal to 0.05, the hypothesis that the pair presents independence is rejected. Here, sig ≤ 0.05 can consider the pair correlation as significant; sig ≤ 0.01 considers the pair correlation as very significant [52].
Finally, for the two pairs that refuse to show independence in the above test, they can be considered correlated and can be analysed for specific patterns. Separate histogram groups are drawn to observe the specific interrelationship of the elements of the utilisation status.

2.5. Comment High-Frequency Words

This study employed the KH Coder 3 software for text mining and the processing of visitor reviews collected during the period before and during the pandemic prevention and control measures. The process included: (1) based on the rating of the review text in the same review message, it was divided into negative rating groups with a rating of 1–2, neutral rating groups with a rating of 3 and positive rating groups with a rating of 4–5, and the groups were imported into the software in succession to perform the word classification process; (2) to overview the word classification results, filter the lexical properties through the software and summarise the high-frequency words that represent the theme of the green space experience; (3) to map the co-occurrence network of the Ishigaki tourism green space experience through the software (set number of plots at 30 and cosine coefficient algorithm). In KH Coder 3, a Japanese word library within the software is used to extract and classify high-frequency words. The principle behind connecting high-frequency words in the generated co-occurrence network is based on their co-occurrence frequency in the text. Co-occurrence frequency refers to the number of times two words appear together in each corpus or text. If two words frequently appear in the same context, their co-occurrence frequency will be high. By calculating the co-occurrence frequency between all pairs of words, a co-occurrence matrix or graph can be created, where the edges between high-frequency words represent their co-occurrence relationships. Analysing the co-occurrence relationships between words can reveal potential semantic associations, topic relevance, or syntactic dependencies. Such connections can be used in various tasks such as word disambiguation, topic modelling, keyword extraction, and text classification in the fields of text mining, information retrieval, and natural language processing. Thus, they provide valuable information for text analysis and processing tasks [53].
This study compared the similarities and differences in high-frequency words among rating groups before and during the pandemic prevention and control period, analysed the distribution and connections of key elements in the co-occurrence network, and collated the differences in tourists’ use and experience of Ishigaki’s tourism green spaces before and during the pandemic. The results of this study may contribute to the recovery of the tourism industry in Ishigaki after the economic closure and provide a scientific reference for the planning and management of tourism green spaces in other tourist cities.

3. Results

3.1. Raw Data Acquisition Results

The raw data were collected from the earliest full year in which review information of the study subjects appeared on the TripAdvisor website to the full year in 2021 (January 2009 to December 2021), ensuring uniformity in the time-seasonal variables and spanning a total of 13 full years and 156 months. The post-2022 period can be considered as the post-pandemic recovery period for the tourism industry; therefore, the periods covered in this study are the pre-pandemic period (January 2009–December 2019) and the prevention and control period (January 2020–December 2021) [48].
A total of 5569 raw data were obtained through crawling, including 5348 and 231 pieces before and during the pandemic, respectively. The year-by-year counts of the raw data and the number of inbound tourists to Ishigaki City for each year are shown in Table 1. A bivariate correlation analysis was conducted using SPSS 25 for the year-by-year counts of the raw data and the number of tourists entering the area over the years in Ishigaki City, and the Sig. (2-tailed) value was calculated to be less than 0.01. Thus, the above bivariate correlation was significant. The amount of information and the overall number of tourists show a significant positive correlation.

3.2. Independence Test Results

The variables such as rating, type of travel, time of travel, type of green space, and tourist travel experience are likely to show some regular changes. During the pandemic, these regular patterns may also change in response to tourism policies, closure regulations, and security concerns [5].
This study is the first to put forward the hypothesis that the utilisation variables of tourists present independence among themselves. Based on the review information data before and during the pandemic [52], the two utilisation variables were crossed to establish the Pearson chi-square test (Appendix A and Appendix B). Their Sig. (two-tailed) values were calculated as shown in Table 2 and Table 3.
The test results showed that the Sig. (two-tailed) values between rating and type of travel, rating and time of travel, and type of green space and tourist travel experience for the above three groups of two variables before the pandemic were greater than 0.05. Thus, the hypothesis of independence cannot be rejected and cannot be judged to have regular variation.
As for rating and type of green space, rating and tourist travel experience, type of travel and time of travel, type of travel and type of green space, type of travel and tourist travel experience, type of green space and time of travel, tourist travel experience and time of travel, the Sig. (2-tailed) values between the two variables of the above seven groups were less than 0.01, demonstrating that they could be extremely correlated. Thus, the independence assumption could be overturned. The regular changes between the two elements of utilisation status could be observed using a histogram group.
In the period following the pandemic, the Sig. (2-tailed) values between the two variables of the following four groups were greater than 0.05: rating and type of travel, type of green space and type of travel, type of green space and tourist travel experience, tourist travel experience and time of travel. Thus, the hypothesis of independence cannot be rejected and cannot be judged to have regular variation.
The Sig. (2-tailed) values between rating and tourist travel experience were in the range of 0.05 and 0.01. The Sig. (2-tailed) values between the following five groups of two variables were less than 0.01, so they are considered highly correlated: rating and time of travel, rating and type of green space, type of travel and time of travel, type of green space and time of travel, type of travel, and tourist travel experience. Thus, the independence hypothesis can be overturned for these six groups of two variables. Observing the regular changes between the two elements of utilisation status is possible through a multi-linear line graph. The multi-linear line graph allows us to observe the regular changes between the two elements of the utilisation situation.

3.3. Results of the Relative Change Relationships and Analysis

The results of creating histogram groups for both combinations of the two utilising variables before and after the pandemic are shown in Figure 1 and Figure 2, and the regular changes are thus observed.

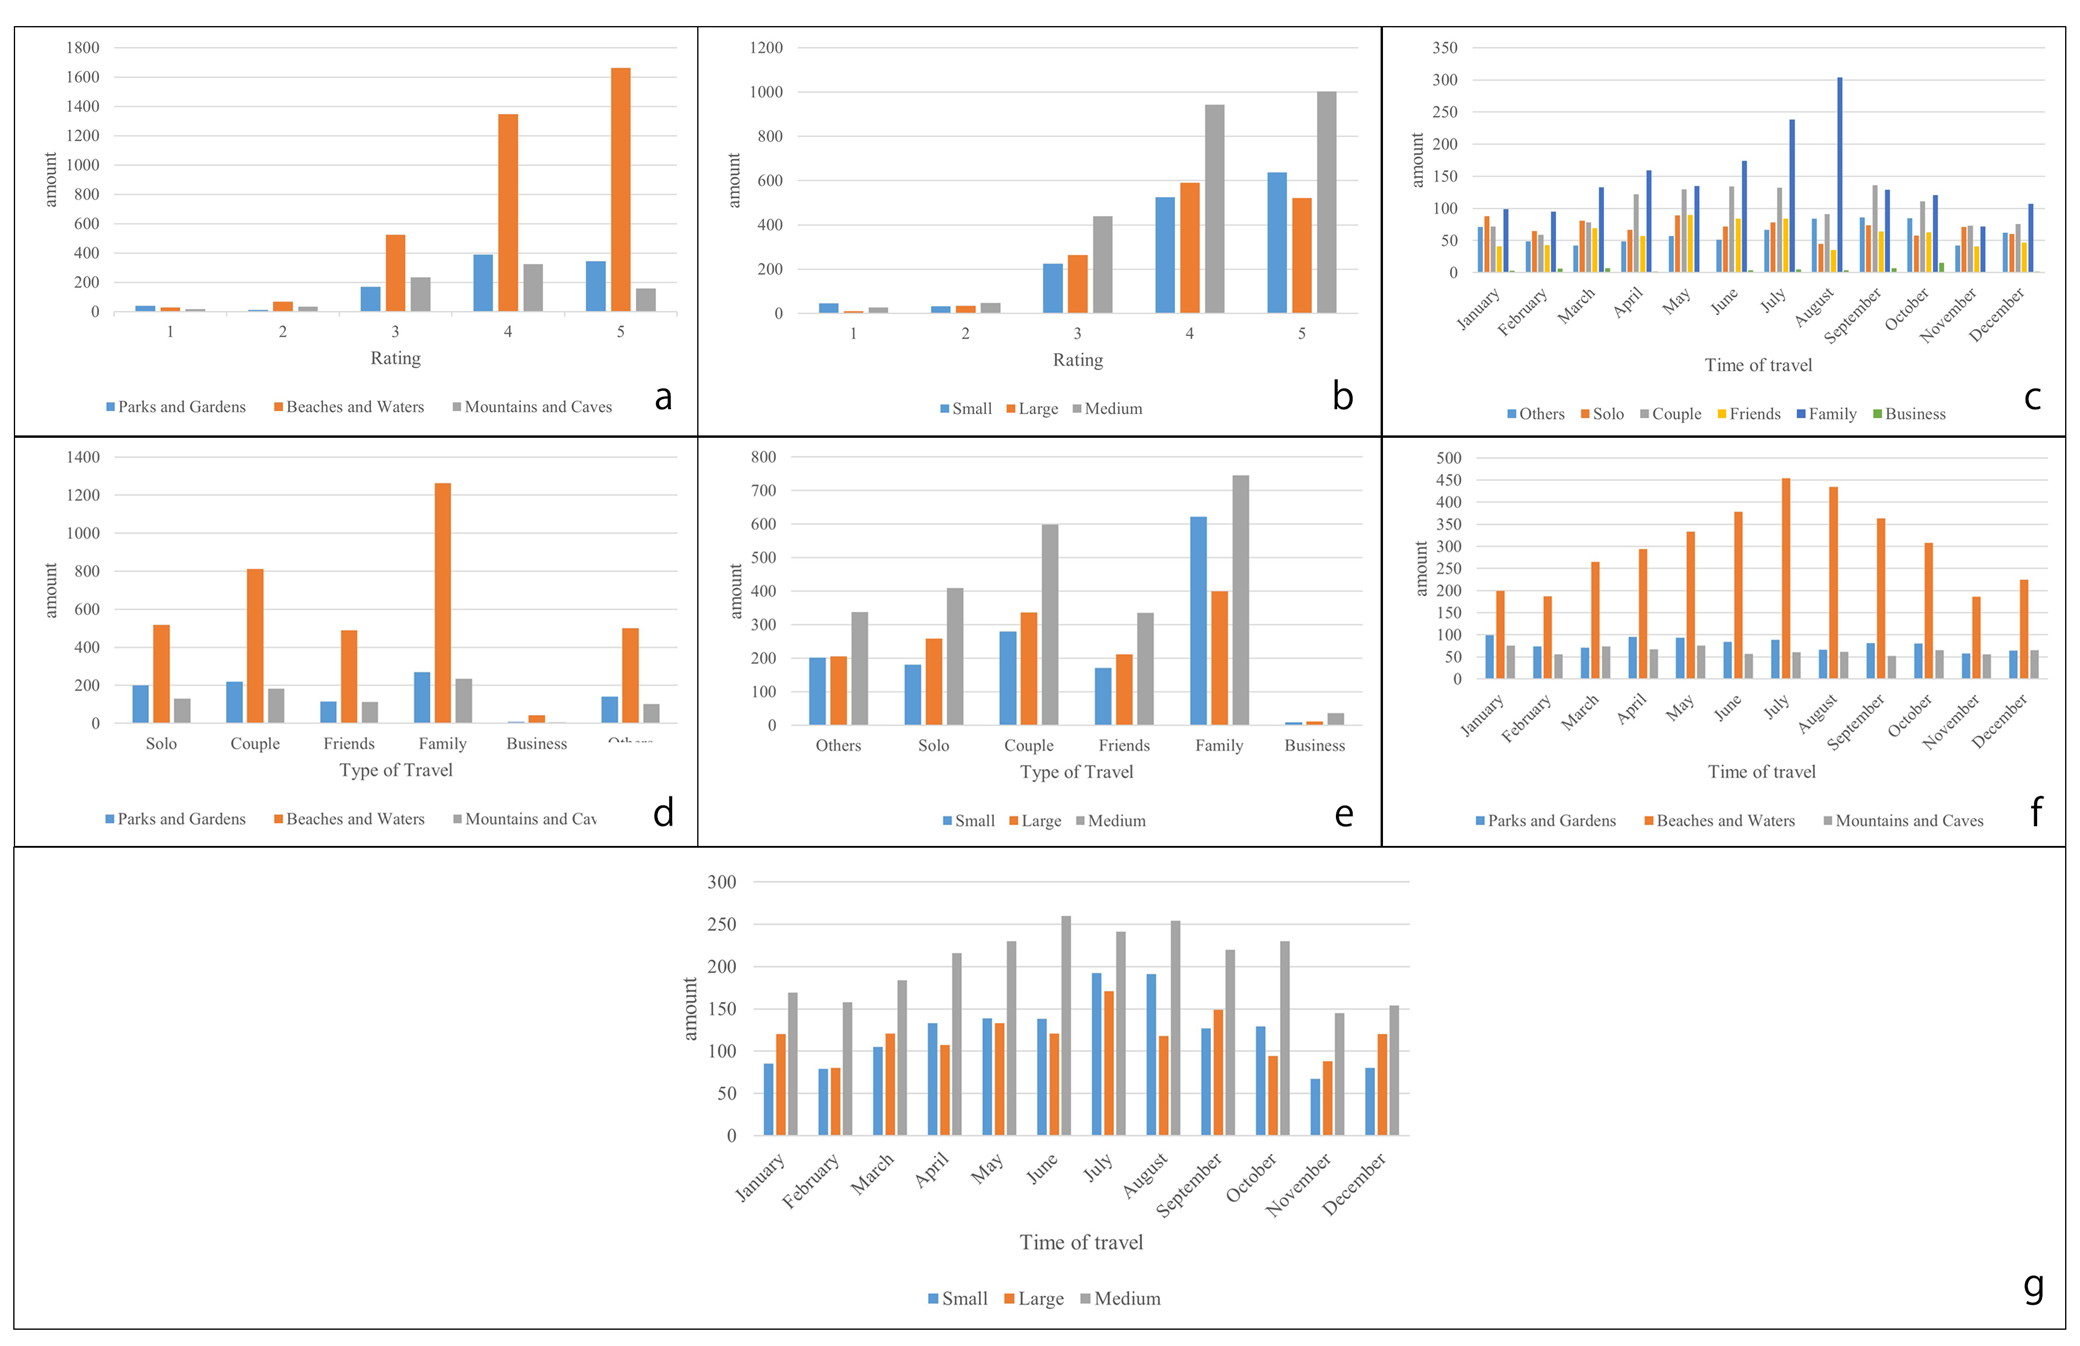
3.3.1. Before the Pandemic

Rating and type of green space: Figure 1a demonstrates that the number of visitors to Beaches and Waters before the COVID-19 pandemic was significant. Both Beaches and Waters and Parks and Gardens had a generally high level of satisfaction, with the highest percentage of positive ratings of 4–5 for Beaches and Waters (Beaches and Waters: 82.93%; Parks and Gardens: 76.83%; Mountains and Caves: 62.58%). Ratings for Mountains and Caves were mostly concentrated in the 3–4 range, with significantly lower satisfaction levels than the other two categories.
Rating and tourist travel experience: Figure 1b indicates that before the COVID-19 pandemic, a positive rating of 4–5 was predominant among tourists with different travel experiences with only those with high travel experience having a 5 count lower than 4. It is more difficult to obtain the ultimate satisfaction for the more experienced tourist group. This reflects a lack of uniqueness and professionalism in the area.
Type of travel and time of travel: Figure 1c shows that before the COVID-19 pandemic, the number of tourists travelling as a Family and Couple was significantly higher, while the number of commercial businesses was very low. The summer school holidays are in August in Japan, so there is a significant increase in the number of families travelling with children. Meanwhile, those who do not need to bring children presumably cancel their travel plans due to the increase in flight and hotel prices or the most uncomfortable climate in August.
Type of travel and type of green space: Figure 1d demonstrates that before the COVID-19 pandemic, all tourists showed a significant preference for Beaches and Waters as a tourist destination, with the number of tourists decreasing for each type of attraction in the order of Family, Couple, Solo, Friends and Business.
Type of travel and tourist travel experience: Figure 1e shows that before the COVID-19 pandemic, families accounted for the largest proportion of all tourists. However, as the tourist travel experience increased, the proportion of families significantly weakened. However, the proportion of families decreases for the higher tourist travel experience (low: 42.46%; medium: 30.27%; high: 28.06%). Meanwhile, the proportion of Solos increased (low: 12.35%; medium: 16.62%; high: 18.14%), and the distribution of different travel types became more balanced.
Type of green space and time of travel: Figure 1f displays that before the COVID-19 pandemic, the number of visitors choosing Beaches and Waters peaked in July, with a significant peak in the summer months (March–October). The distribution between Parks and Gardens and Mountains and Caves was more balanced across all periods.
Tourist travel experience and time of travel: Figure 1g demonstrates that before the COVID-19 pandemic, all visitors showed peak travel times during the summer months (March–October), with lows in February and November. High tourist travel experience tended to significantly differ from other tourists during the peak travel period in August.

3.3.2. During the Pandemic

Ratings and tourist travel experience: Figure 2a shows that after the COVID-19 pandemic, the proportion of negative ratings of 1–2 was significantly higher among tourists with low travel experience compared to those before the pandemic (before: 5.32%; after: 15%). The proportion of tourists with a full rating of 5 increased (before the pandemic: 36.71%; during the pandemic: 43.21%).
Rating and time of travel: Figure 2b shows that positive ratings of 4 and 5 were significantly higher in August, March, and January after the COVID-19 pandemic, with 3 ratings being the highest in March and 2 and 3 ratings being relatively high in November.
Rating and type of green space: Figure 2c demonstrates that the positive rating of 4–5 for Beaches and Waters was generally consistent after the COVID-19 pandemic compared to the pre-pandemic period (pre-pandemic: 82.93%; post-pandemic: 84.17%) with a significantly higher percentage of full 5 ratings (pre-pandemic: 45.80%; post-pandemic: 50.83%). The positive rating of 4–5 for Parks and Gardens decreased significantly (pre-pandemic: 76.83%; post-pandemic: 61.67%). Meanwhile, the positive rating of 4–5 for Mountains and Caves increased significantly (pre-pandemic: 62.58%; post-pandemic: 75.61%).
Type of travel and time of travel: Figure 2d shows that after the COVID-19 pandemic, Solo travel peaked in March, Couple travel peaked in March and August, and both Family and Friend travel peaked in August. March and August.
Type of green space and time of travel: Figure 2e displays that after the COVID-19 pandemic, Beaches and Waters showed a significant surge in visitors in August, Parks and Gardens in March, and Mountains and Caves in January. Beaches and Waters did not show a continuous peak period of visitation during the summer months (March–October) compared to the pre-pandemic period. Visits to Parks and Gardens and Mountains and Caves fluctuated significantly throughout the year.
Type of travel and tourist travel experience: Figure 2f indicates that after the COVID-19 pandemic, the proportion of Family travel was significantly lower for all tourists (low Pre-pandemic: 42.46%; low post-pandemic: 25%) compared to pre-pandemic (medium Pre-pandemic: 30.27%; medium Post-pandemic: 16%) (high Pre-pandemic: 28.06%; high Post-pandemic: 9.88%). The choice of Solo travel mode increased among those with medium travel experience and overtook the Family travel mode to reach the highest percentage. The Couple mode has surpassed the Family mode to reach the highest number of travellers with a high travel experience.

3.4. Text Mining Results and Analysis

The above-mentioned independence tests and bivariate analysis show that the years 2020–2021 were affected by the domestic emergency policy on pandemic control and restrictions on international tourist arrivals in Japan [48]. Moreover, the amount of data collected on the reviews of Overseas Visitors during the pandemic was minimal. To ensure the feasibility and reliability of the analysis and to avoid the bias caused by the extreme sample differences of Overseas Visitors during the pandemic prevention and control period, only the review texts of domestic Japanese tourists were used in this text-mining study. The KH Coder 3 software is currently the most widely used for Japanese text mining, and its results are trusted by a wide range of scholars [54].
The high-frequency nouns and adjectives of the green space experience themes before and during the pandemic are shown in Table 4, Table 5, Table 6, Table 7, Table 8 and Table 9. In the co-occurrence network, the keywords in the circles are connected by lines to illustrate the relevance. The larger the area of the circle, the more frequently the word appears in the source text, and the thicker the line connecting the two circles, the closer the relationship between the two subject words [55].

3.4.1. The 1–2 Point Negative Evaluation Group before and during the Pandemic

Comparing the high-frequency words for the green space experience theme (Table 4 and Table 5) for the 1–2-point negative evaluation group before and during the pandemic revealed a large difference, with three recurring high-frequency nouns and four high-frequency adjectives.
Before and during the pandemic, the term “stalactite cave” appeared predominantly, indicating that compared with other scenic spots, stalactite caves are more likely to cause negative emotions in tourists. Before the pandemic, there were more diverse scenes, such as “beach” and “glass boat”. Moreover, “animal” appeared in second place, indicating that animal-related experiential activities in the region caused serious negative emotions for visitors. During the pandemic, only one specific scene, “park”, appeared, indicating that pandemic prevention policies greatly restricted the development of tourism projects, causing extremely negative emotions for visiting tourists [56]. Regarding facilities and management, “pamphlets”, “signboards”, and “parking” appeared before the pandemic, while “abandoned” and “maintenance” appeared during the pandemic. This indicated that the region has long had deficiencies in guiding and signage. Concerning pricing, “entrance fee” appeared before the pandemic, and “worth” and “price” appeared during the pandemic. This indicated that before the pandemic, dissatisfaction with costs was mainly directed at ticket prices. In contrast, during the pandemic, negative thoughts focused on the overall value of the journey. Regarding emotional expression, more specific negative feelings were expressed about the environment during the pandemic, such as “horror” and “dark”.
Comparing the co-occurrence networks (Figure 3), before the pandemic, the negative reviews mainly focused on high entrance fees, as indicated by the connections between “stalactite cave”, “high”, “entrance fee”, and “Ishigaki”. There were also complaints about amusement activities that did not meet visitors’ expectations, as indicated by the connections between “disappointment”, “glass boat”, “Ishigaki Island”, and “pamphlet”, and unclear signage, as indicated by the connections between “parking”, “signboard”, and “entrance”.
During the pandemic, the negative reviews focused on the lack of child-friendly facilities, as indicated by the connections between “kid”, “child”, “horror”, “dark”, and “passageway”. There were also complaints about facilities being closed for maintenance or abandoned, as indicated by the connections between “maintenance”, “abandoned”, “deposition”, “store”, and “preliminary investigation”. Additionally, there were doubts about the overall value of the Ishigaki trip, as indicated by the connections between “map”, “funny story”, “Ishigaki Island”, and “worth”.

3.4.2. The 3-Point Neutral Evaluation Group before and during the Pandemic

Comparing the high-frequency words of the green space experience theme (Table 6 and Table 7) for the 3-point neutral evaluation group before and during the pandemic, the difference between the two groups was reduced compared to the negative evaluation group, with six recurring high-frequency nouns and three high-frequency adjectives.
Before and during the pandemic, certain locations such as “stalactite caves”, “beaches”, and “parks” appeared. Before the pandemic, aquatic scenes such as “glass boat” and “Kabira Bay” were present, while during the pandemic, “dam” and “square” emerged, with “park” ranking second. This suggests that the probability of tourists visiting unmanaged sites increased during the pandemic [57]. Regarding facilities and management, “parking” was repeatedly mentioned before and during the pandemic, while “maintenance” emerged during the pandemic. This indicates that parking has always been a concern for tourists, and closures and renovations during the pandemic received negative evaluations from tourists. Regarding emotional expressions, similar to the previous group, “disappointment” was mentioned before the pandemic, while “peace”, “nature”, and “view platform” emerged during the pandemic. This suggests that the tourism industry was less vibrant during the pandemic, and tourists could enjoy greater tranquillity in viewing natural scenery. However, some tourists did not respond positively to this.
Comparing the co-occurrence network (Figure 4), before the pandemic, neutral evaluations were most prominently reflected in the connections between “glass boat”, “disappointment”, “Kabira Bay”, “beach”, “pretty”, “scenery”, “park”, “wide”, “view platform”, and “site”. This represents the glass boat ride attraction, indicating that the surrounding ocean scenery was excellent.
During the pandemic, neutral evaluations were mainly reflected in the connections between “dam”, “prayer”, “peace”, “yaeyama”, “Ishigaki Island”, and “nature”, representing the natural mountainous environment around the dam that inspired awe in tourists. In addition, connections between “maintenance”, “installation”, “space”, “square”, “park”, and “wide” represented public spaces undergoing renovations, which generated widespread dissatisfaction among tourists.

3.4.3. The 4–5 Point Neutral Evaluation Group before and during the Pandemic

Comparing the high-frequency words for the green space experience theme (Table 8 and Table 9) for the 4–5-point positive rating group before and during the pandemic revealed a small difference, with eight recurring high-frequency nouns and five high-frequency adjectives.
Before the pandemic, “weather” appeared in the keywords, suggesting that due to the variety of tourism activities available, tourists were more susceptible to the impact of weather conditions [58]. Thus, they paid more attention to changes in weather. During the pandemic, “stalactite cave” appeared in the keywords, and the frequency of “park” significantly increased. Based on the previous set of ratings, it can be inferred that with the restrictions on tourism activities, there was a significant increase in the proportion of tourists visiting caves and public green spaces during the pandemic. Regarding emotional expression, “blue” and “transparent” were repeated in both sets of keywords, reflecting the seawater’s clearness.
Comparing the co-occurrence network (Figure 5), before the pandemic, positive evaluations were mainly reflected in the water-based entertainment activities, such as “glass boat”, “coral”, “Kabira Bay”, “sightseeing”, “pretty”, and “scenery”, which relied on the excellent marine landscape resources. During the pandemic, positive evaluations mainly revolved around the natural landscape viewing experience, centred around “Ishigaki Island” and “view platform” and connected around “sandy” and “Kabira Bay”. Compared to before the pandemic, the association between the “glass boat” water-based entertainment activity and other words weakened, indicating the uncertainty of entertainment activities due to the impact of pandemic prevention policies.

4. Discussion

The results show that the COVID-19 pandemic has led to a marked change in the status of tourists’ use and experience of Ishigaki’s tourism green spaces. Moreover, the pandemic prevention policy has led to a severe impact on global tourism and a reduction in tourism activities, and it has had an impact on tourist evaluation feedback.
Based on the results of the analysis of the data before the COVID-19 pandemic and during the prevention and control period in Japan, before the pandemic, tourists expressed high praise for the tourism green areas in Ishigaki City. Furthermore, tourists highly valued the natural beauty of Ishigaki Island such as the sea view, scenery, and beaches, and it received more extensive recognition from overseas tourists. The main areas of dissatisfaction during this period were the high entrance and parking fees. There was also a lack of clarity in the signage and much criticism from visitors regarding the ecology of the animals and human interaction. Although the weather is uncontrollable, providing prepared tours for visitors from far away in bad weather conditions should also be a future planning issue.
Visitors’ satisfaction remained high during the outbreak; this could be because of the psychological relief during the difficult period and because tourist programs were not as crowded and overly commercialised as before, allowing visitors to concentrate more on enjoying nature. The main areas of dissatisfaction during this period were the cancellation of tourist programs, the abandonment of facilities, and the lack of management services. Moreover, the huge psychological gap that some visitors experienced during this period may have affected the deterioration of their perception of the entire Okinawa tourism industry.
Most visitors travel in groups, with individual visits concentrated among experienced travellers. For experienced travellers, the area is still lacking in uniqueness and expertise. As most of the tourists are water sports-oriented, they visit the area during the warm period from March to October when they can comfortably visit the sea, with a surge in the number of tourists during the student holidays in August. However, other periods did not have a regular impact on the overall assessment. During the pandemic control period, the number of visitors peaked in March against the trend due to the occasional activity restriction policy. It remains to be seen whether this will be sustainable in the future.
With the mitigation of the COVID-19 pandemic and the gradual relaxation of control measures, several surveys have shown that the tourism industry is recovering rapidly and that Ishigaki’s tourism industry is facing an opportunity to rebuild and recover [59,60]. Beaches and Waters are not only the most popular type of green space, but also are receiving the best public ratings. Meanwhile, the Mountains and Caves area, which was previously undeveloped and unmanaged, has enjoyed a significant increase in visitor numbers and ratings. Many popular tourist destinations closed or limited the number of visitors to their planned trips, thus stimulating the possibility and opportunity for visitors to explore the island’s unique natural attractions independently. With the area’s unique mystique and commemorative significance fitting in with the prayerful mindset of the people during the pandemic, there is clear potential for greater use of the area’s tourism resources. In the future, it is possible to move beyond the marine perimeter and to consider maintaining and establishing safety measures and giving visitors a certain amount of freedom to explore the area without compromising the pleasure of experiencing nature.
Numerous studies have highlighted changes in the utilisation of urban green spaces across different regions during the pandemic. Surveys conducted in European cities have shown a high level of appreciation for urban green spaces, despite a reduction in visits due to government restrictions. The main motivations for visiting these spaces have been physical exercise and relaxation, with respondents in Italy and Lithuania also expressing an appreciation for nature observation. As an alternative, some people turned to streets and city gardens during the pandemic. The findings also emphasise the importance of greenery for the biophilic nature of urban dwellers and the need for a diverse range of urban green space types [40].
Furthermore, studies conducted in Guangzhou, China, which is in the same subtropical region as Ishigaki and shares the East Asian cultural sphere, have shown a more positive sentiment towards the use of urban green spaces during the COVID-19 epidemic. People tend to prefer urban green spaces with natural water or mountains and lower population density during a pandemic. There is also a tendency to visit green spaces on weekdays rather than weekends due to changes in lifestyles. Urban green spaces with a religious attribute, where residents are allowed to pray for their health, are also more popular than elsewhere [61].
Comparing the above studies reveals a common trend in the use of urban green spaces during the epidemic in European cities, Guangzhou, China, and Ishigaki, Okinawa. People prefer urban green spaces that are less densely populated and offer a good natural environment, with physical exercise, relaxation, and emotional comfort being the main motivations for visiting. European countries are more inclined to provide venues for achieving physical fitness, while people in East Asia tend to visit green spaces of a religious nature that provide psychological comfort. European cities and Guangzhou, China, have experienced high levels of urban development and actively sought urban alternatives to green spaces during the epidemic. However, Ishigaki’s island hinterland still has a large amount of undeveloped natural landscapes that can provide a new tourism experience during special circumstances.

5. Conclusions

In summary, the COVID-19 pandemic has led to a change in visitor perceptions of the use and experience of the Ishigaki tourism green space. In the aftermath of the pandemic, due to the timing of the pandemic prevention policy and the uncertainty of a successful tourism programme, the proportion of visitors visiting the area during periods when water activities were not suitable increased significantly. Visitors prefer to enjoy the types of green space within the island that were expected to have a low density of people, separated by natural mountains and forests, or open public spaces, rather than the extreme appreciation of the marine landscape and water activities of the past. During the pandemic, the psychologically comforting properties of tourism green spaces also influenced visitor use, with sites containing monumental facilities that offer prayers for good health becoming more popular. This suggests that during future crises, urban tourism green spaces can attract visitors by offering a safe, tranquil, and emotionally comforting environment. Furthermore, the research findings provide valuable insights for future tourism development. Inland areas of islands, natural mountains and forests with low population density, and open public spaces can become new tourism resources. These areas can offer unique tourism experiences that combine close interaction with nature and emotional fulfilment through proper planning and management. In future tourism development, emphasis can be placed on the enhancement and promotion of these areas to attract more visitors and foster sustainable tourism development. Additionally, the study found that overall, tourist satisfaction with green spaces was higher during the pandemic prevention and control period. This further confirms the positive impact of urban tourism green spaces on tourists’ psychological well-being and emotional solace. Therefore, it is important for urban planners and tourism management organisations to recognise and protect the value of urban tourism green spaces, providing comfortable and enjoyable environments for visitors. This will have a positive impact on enhancing sustainable tourism development and brand value in the industry.
Admittedly, neither the data crawling nor the text mining relying on the Japanese text database are perfect, and there is room for improvement. The accuracy of this study relies heavily on that of the data-crawling and text-processing algorithms. Due to the limitations of the author’s ability, the development of this part of the algorithm relies heavily on open-source software. The analysis is mostly based on reports and observational studies during the pandemic without a stable quantitative system. Furthermore, we will extensively collect ample data information after the end of pandemic restrictions. As a future research objective, we aim to evaluate the recovery status of the tourism industry after the conclusion of pandemic restrictions by leveraging integrated advanced modelling techniques, such as time-series models, and provide accurate predictions and insights for future tourism decision making.

Funding

This study was supported by a Grant-in-Aid for Scientific Research (No. 20K04884, Japan) and JST SPRING (No. JPMJSP2109, Japan).

Data Availability Statement

All data used are openly accessible to the public.

Acknowledgments

The author thanks Fuhao Sun, Shuhao Liu, Shiro Takeda, Junhua Zhang (Graduate School of Horticulture, Chiba University) and Jiarui Liu (School of Landscape Architecture, Beijing Forestry University) for their advice and support for this study.

Conflicts of Interest

The author declares no conflict of interest.

Appendix A

These tables represent the crosstabs between the utilisation status variables before the outbreak.
Table A1. Type of Travel and Rating (before the outbreak).
OthersSoloCoupleFriendsFamilyBusinessTotal
117819732184
212143419360115
312216920212529515928
4285342479261677152059
5309315480306726262162
Total74584812147181766575348
Table A2. Time of Travel and Rating (before the outbreak).
JanuaryFebruaryMarchAprilMayJuneJulyAugustSeptemberOctoberNovemberDecemberTotal
18564678101288284
23498121919169736115
37368767591741098374856060928
41511231551591892072452171841571191532059
51391171642102042122232372171961101332162
Total3743174104565025196045634964533003545348
Table A3. Type of Green Space and Tourist Travel Experience (before the outbreak).
Parks and GardensBeaches and WatersMountains and CavesTotal
Small23110262081465
Large2719442071422
Medium45216573522461
Total95436277675348
Table A4. Type of Green Space and Rating (before the outbreak).
Parks and Gardens Beaches and WatersMountains and CavesTotal
139271884
2126835115
3170524234928
438913473232059
534416611572162
Total95436277675348
Table A5. Tourist Travel Experience and Rating (before the outbreak).
SmallLargeMediumTotal
146112784
2323548115
3225263440928
45255919432059
563752210032162
Total1465142224615348
Table A6. Type of Travel and Time of Travel (before the outbreak).
OthersSoloCoupleFriendsFamilyBusinessTotal
January71887241993374
February49655943956317
March428178691337410
April4967122571592456
May5789130901351502
June5172134841744519
July6778132842385604
August844591353044563
September8674136641297496
October85581116312115453
November42717341721300
December626076471072354
Total74584812147181766575348
Table A7. Type of Green Space and Type of Travel (before the outbreak).
Parks and GardensBeaches and Waters Mountains and CavesTotal
Solo199519130848
Couple2208121821214
Friends116490112718
Family26912622351766
Business843657
Others142501102745
Total95436277675348
Table A8. Tourist Travel Experience and Type of Travel (before the outbreak).
SmallLargeMediumTotal
Others202205338745
Solo181258409848
Couple2803365981214
Friends171212335718
Family6223997451766
Business9123657
Total1465142224615348
Table A9. Type of Green Space and Time of Travel (before the outbreak).
Parks and GardensBeaches and Waters Mountains and CavesTotal
January9919976374
February7418756317
March7126574410
April9529467456
May9333376502
June8437857519
July8945461604
August6643562563
September8136352496
October8030865453
November5818656300
December6422565354
Total95436277675348
Table A10. Tourist Travel Experience and Time of Travel (before the outbreak).
SmallLargeMediumTotal
January85120169374
February7980158317
March105121184410
April133107216456
May139133230502
June138121260519
July192171241604
August191118254563
September127149220496
October12994230453
November6788145300
December80120154354
Total1465142224615348

Appendix B

These tables represent the crosstabs between the utilisation status variables during the pandemic.
Table A11. Type of Travel and Rating (during the pandemic).
OthersSoloCoupleFriendsFamilyBusinessTotal
11111105
26110109
32012212138
44491268079
5359131022190
Total106322918342221
Table A12. Type of Green Space and Type of Travel (during the pandemic).
Parks and GardensBeaches and Waters Mountains and CavesTotal
Solo1313632
Couple717529
Friends111618
Family822434
Business0202
Others315520106
Total6012041221
Table A13. Type of Green Space and Tourist Travel Experience (during the pandemic).
Parks and GardensBeaches and Waters Mountains and CavesTotal
Small922940
Large21471381
Medium305119100
Total6012041221
Table A14. Tourist Travel Experience and Time of Travel (during the pandemic).
SmallLargeMediumTotal
January991432
February312823
March5201843
April1078
May0549
June0033
July14712
August8111837
September0134
October35715
November57921
December57214
Total4081100221
Table A15. Tourist Travel Experience and Rating (during the pandemic).
SmallLargeMediumTotal
14105
22259
35112238
411323679
518353790
Total4081100221
Table A16. Rating and Time of Travel (during the pandemic).
12345Total
January104141332
February101101123
March1113151343
April005218
May001359
June000033
July0025512
August002161937
September000134
October0226515
November1572621
December1115614
Total59387990221
Table A17. Type of Green Space and Rating (during the pandemic).
Parks and Gardens Beaches and WatersMountains and CavesTotal
13025
24509
31614838
419402079
518611190
Total6012041221
Table A18. Type of Travel and Time of Travel (during the pandemic).
OthersSoloCoupleFriendsFamilyBusinessTotal
January173525032
February142312123
March2312701043
April6002008
May3110409
June0000303
July34212012
August191647037
September1102004
October72203115
November105123021
December31244014
Total106322918342221
Table A19. Type of Green Space and Time of Travel (during the pandemic).
Parks and GardensBeaches and WatersMountains and CavesTotal
January6131332
February413623
March2217443
April5128
May1809
June1203
July26412
August924437
September2204
October29415
November514221
December111214
Total6012041221
Table A20. Tourist Travel Experience and Type of Travel (during the pandemic).
SmallLargeMediumTotal
Others214936106
Solo262432
Couple3121429
Friends351018
Family1081634
Business1102
Total4081100221

References

  1. Tajima, Y.; Hashimoto, S.; Dasgupta, R.; Takahashi, Y. Spatial characterization of cultural ecosystem services in the Ishigaki Island of Japan: A comparison between residents and tourists. Ecosyst. Serv. 2023, 60, 101520. [Google Scholar] [CrossRef]
  2. Nguyen, D.N. An archipelagic tourism development model: The case of Okinawa Prefecture. Asian Geogr. 2017, 34, 39–57. [Google Scholar] [CrossRef]
  3. Kikuchi, K. The Agriculture-Food-Tourism Industry Cluster in Okinawa, Japan: The Key Role of an Airport in Clustering. In A Multi-Industrial Linkages Approach to Cluster Building in East Asia: Targeting the Agriculture, Food, and Tourism Industry; Springer: Berlin/Heidelberg, Germany, 2017; pp. 91–116. [Google Scholar] [CrossRef]
  4. Anzai, A.; Nishiura, H. ‘Go to travel’ campaign and travel-associated coronavirus disease 2019 cases: A descriptive analysis, July–August 2020. J. Clin. Med. 2021, 10, 398. [Google Scholar] [CrossRef] [PubMed]
  5. Tanaka, T.; Tiku, O.; Takashina, N. Empowering voluntary approaches for environmental sustainability and resilient communities: A case study from Okinawa, Japan. Discov. Sustain. 2022, 3, 27. [Google Scholar] [CrossRef]
  6. Environmental Status and Problems in Okinawa. Available online: https://www.pref.okinawa.jp/site/kankyo/seisaku/ (accessed on 26 May 2022).
  7. Shigetani, Y.; Kakutani, N. Labour productivity of tourism and hospitality industries in Japan: The case studies of hotel industry in Okinawa, Japan. Tour. Manag. 2022, 2, 12–29. [Google Scholar] [CrossRef]
  8. Nagahara, S.; Konoshima, M.; Nishimori, Y.; Ota, I. Basic experimental study on the optimal allocation of green space for aesthetic benefits in an urban area: A case study of Urasoe City, Okinawa. J. Environ. Inf. Sci. 2016, 30, 225–230. [Google Scholar] [CrossRef]
  9. Sugimoto, A.; Sugino, H.; Hori, J. How bountiful is the ocean? Participatory valuation of human–nature relationships in Yaeyama Islands, Okinawa, Japan. Sustain. Sci. 2022, 17, 879–898. Available online: https://link.springer.com/article/10.1007/s11625-021-00994-z (accessed on 1 July 2022). [CrossRef]
  10. Shimoda, K. Possible Articulations Between the Practices of Local Inhabitants and Academic Outcomes of Landscape History: Ecotourism on Ishigaki Island. In Coral Reef Science: Strategy for Ecosystem Symbiosis and Coexistence with Humans under Multiple Stresses; Springer: Berlin/Heidelberg, Germany, 2016; pp. 73–80. [Google Scholar] [CrossRef]
  11. Musselwhite, C.; Avineri, E.; Susilo, Y. Editorial JTH 16—The Coronavirus Disease COVID-19 and implications for transport and health. J. Transp. Health 2020, 16, 100853. [Google Scholar] [CrossRef]
  12. Pandit, L.; Fauggier, G.V.; Gu, L.; Knöll, M. How do people use Frankfurt Mainkai riverfront during a road closure experiment? A snapshot of public space usage during the coronavirus lockdown in May 2020. Cities Health 2021, 5 (Suppl. S1), S243–S262. [Google Scholar] [CrossRef]
  13. Da Silva Lopes, H.; Remoaldo, P.C.; Ribeiro, V.; Martín-Vide, J. Effects of the COVID-19 pandemic on tourist risk perceptions—The case study of Porto. Sustainability 2021, 13, 6399. [Google Scholar] [CrossRef]
  14. Scopelliti, M.; Pacilli, M.G.; Aquino, A. TV news and COVID-19: Media influence on healthy behavior in public spaces. Int. J. Environ. Res. Public Health 2021, 18, 1879. [Google Scholar] [CrossRef]
  15. Zhang, Y.; Van den Berg, A.E.; Van Dijk, T.; Weitkamp, G. Quality over quantity: Contribution of urban green space to neighborhood satisfaction. Int. J. Environ. Res. Public Health 2017, 14, 535. [Google Scholar] [CrossRef] [Green Version]
  16. Sigala, M. Tourism and COVID-19: Impacts and implications for advancing and resetting industry and research. J. Bus. Res. 2020, 117, 312–321. [Google Scholar] [CrossRef]
  17. Higgins-Desbiolles, F. Socialising tourism for social and ecological justice after COVID-19. Thuman Geogr. 2020, 22, 610–623. [Google Scholar] [CrossRef] [Green Version]
  18. Kanamori, R.; Kawakami, Y.; Nojiri, S.; Miyazawa, S.; Kuroki, M.; Nishizaki, Y. Changes in social environment due to the state of emergency and Go To campaign during the COVID-19 pandemic in Japan: An ecological study. PLoS ONE 2022, 17, e0267395. [Google Scholar] [CrossRef]
  19. Agostini, F.; Mangone, M.; Pierangela, R.U.I.U.; Paolucci, T.; Santilli, V.; Bernetti, A. Rehabilitation settings during and after COVID-19: An overview of recommendations. J. Rehabil. Med. 2021, 53, 2737. [Google Scholar] [CrossRef]
  20. Lapointe, D. Reconnecting tourism after COVID-19: The paradox of alterity in tourism areas. Tour. Geogr. 2020, 22, 633–638. [Google Scholar] [CrossRef]
  21. Kaußen, L. Landscape Perception and Construction in SocialMedia: An Analysis of User-generated Content. J. Digit. Landsc. Archit. 2018, 3, 373–379. Available online: https://gispoint.de/fileadmin/user_upload/paper_gis_open/DLA_2018/537642040.pdf (accessed on 1 July 2022).
  22. Cox, C.; Burgess, S.; Sellitto, C.; Buultjens, J. The role of user-generated content in tourists’ travel planning behavior. J. Hosp. Mark. Manag. 2009, 18, 743–764. [Google Scholar] [CrossRef]
  23. Yang, R.; Liu, S.; Zhao, J.; Takeda, S.; Zhang, J. Domestic and International Tourists’ Experiences with Shurijo Castle: Text Mining Travel Reviews. Pap. Environ. Inf. Sci. 2022, 36, 150–155. [Google Scholar] [CrossRef]
  24. Marine-Roig, E.; Clavé, S.A. Tourism analytics with massive user-generated content: A case study of Barcelona. J. Destin. Mark. Manag. 2015, 4, 162–172. [Google Scholar] [CrossRef]
  25. Cheung, M.L.; Leung, W.K.; Cheah, J.H.; Ting, H. Exploring the effectiveness of emotional and rational user-generated contents in digital tourism platforms. J. Vacat. Mark. 2022, 28, 152–170. [Google Scholar] [CrossRef]
  26. The Second Basic Plan for Tourism in Ishigaki City. Available online: https://www.city.ishigaki.okinawa.jp/soshiki/kanko_bunka/plan/3499.html (accessed on 12 May 2022).
  27. Numbers of Tourists in Okinawa. Available online: https://www.pref.okinawa.jp/site/bunka-sports/kankoseisaku/14734.html (accessed on 2 February 2023).
  28. Li, H.; Hu, M.; Li, G. Forecasting tourism demand with multisource big data. Ann. Tour. Res. 2020, 83, 102912. [Google Scholar] [CrossRef]
  29. Da Schio, N.; Phillips, A.; Fransen, K.; Wolff, M.; Haase, D.; Ostoić, S.K.; De Vreese, R. The impact of the COVID-19 pandemic on the use of and attitudes towards urban forests and green spaces: Exploring the instigators of change in Belgium. Urban For. Urban Green. 2021, 65, 127305. [Google Scholar] [CrossRef]
  30. Sultan, M.T.; Sharmin, F.; Badulescu, A.; Stiubea, E.; Xue, K. Travelers’ responsible environmental behavior towards sustainable coastal tourism: An empirical investigation on social media user-generated content. Sustainability 2020, 13, 56. [Google Scholar] [CrossRef]
  31. Akin, S.; Arora, N.; Zakeeruddin, S.M.; Graetzel, M.; Friend, R.H.; Dar, M.I. New strategies for defect passivation in high-efficiency perovskite solar cells. Adv. Energy Mater. 2020, 10, 1903090. [Google Scholar] [CrossRef]
  32. Morishita, S. The attractiveness of Japanese Ryokan to foreign visitors to Japan: Analysis of Japanese and English reviews of Tripadvisor’s “Japanese inns popular among foreigners”. JGTR 2022, 7, 21–26. [Google Scholar] [CrossRef]
  33. Zhang, R.; Zhang, J. Perception of Tourism Image of Chenshan Botanical Garden in Shanghai Based on Web Text Analysis and IPA model. Chin. Landsc. Archit. 2019, 35, 83. Available online: http://www.jchla.com/ch/reader/view_abstract.aspx?file_no=20190815&flag=1 (accessed on 1 July 2022).
  34. Zhu, J.; Xu, C. Sina microblog sentiment in Beijing city parks as measure of demand for urban green space during the COVID-19. Urban For. Urban Green. 2021, 58, 126913. [Google Scholar] [CrossRef]
  35. Lopez, B.; Kennedy, C.; Field, C.; McPhearson, T. Who benefits from urban green spaces during times of crisis? Perception and use of urban green spaces in New York City during the COVID-19 pandemic. Urban For. Urban Green. 2021, 65, 127354. [Google Scholar] [CrossRef]
  36. Jato-Espino, D.; Moscardó, V.; Vallina Rodríguez, A.V.; Lázaro, E. Spatial statistical analysis of the relationship between self-reported mental health during the COVID-19 lockdown and closeness to green infrastructure. Urban For. Urban Green. 2022, 68, 127457. [Google Scholar] [CrossRef]
  37. Li, J.; Li, M. Research on the Social Service Effectiveness of Central Park in High-Density City during the COVID-19 pandemic Prevention and Control—Taking the Macau Taipa Central Park as an Example. Mod. Manag. 2021, 11, 996. [Google Scholar] [CrossRef]
  38. Fu, F.; Purvis-Roberts, K.L.; Williams, B. Impact of the COVID-19 pandemic lockdown on air pollution in 20 major cities around the world. Atmosphere 2020, 11, 1189. [Google Scholar] [CrossRef]
  39. Zhang, W.; Li, J. A quasi-experimental analysis on the causal effects of COVID-19 on urban park visits: The role of park features and the surrounding built environment. Urban For. Urban Green. 2023, 82, 127898. [Google Scholar] [CrossRef]
  40. Ugolini, F.; Massetti, L.; Calaza-Martínez, P.; Cariñanos, P.; Dobbs, C.; Ostoić, S.K.; Sanesi, G. Effects of the COVID-19 pandemic on the use and perceptions of urban green space: An international exploratory study. Urban For. Urban Green. 2022, 56, 126888. [Google Scholar] [CrossRef]
  41. The Japanese Operation of the TripAdvisor. Available online: https://www.travelvoice.jp/20190826-136481 (accessed on 26 August 2019).
  42. Orea-Giner, A.; Fuentes-Moraleda, L.; Villacé-Molinero, T.; Munoz-Mazón, A.; Calero-Sanz, J. Does the implementation of robots in hotels influence the overall tripadvisor rating? A text mining analysis from the Industry 5.0 approach. Tour. Manag. 2022, 93, 104586. [Google Scholar] [CrossRef]
  43. El Asikri, M.S.; Knit, S.; Chaib, H. Using web scraping in a knowledge environment to build ontologies using python and scrapy. Eur. J. Mol. Clin. Med. 2020, 7, 2020. Available online: https://ejmcm.com/article_1525.html (accessed on 1 July 2022).
  44. Matsumoto, K. Research on Imagination about Travel an Examination of Technologically Simulated Trips. Tour. Stud. Rev. 2019, 7, 13–20. [Google Scholar] [CrossRef]
  45. Numbers of Tourists in Ishigaki. Available online: https://www.city.ishigaki.okinawa.jp/soshiki/kanko_bunka/survey_statistic/4166.html (accessed on 26 April 2023).
  46. Dinis, M.G.F.; Costa, C.M.M.; Pacheco, O.M.R. Similarities and correlation between resident tourist overnights and Google Trends information in Portugal and its tourism regions. Tour. Manag. Stud. 2017, 13, 15–22. [Google Scholar] [CrossRef] [Green Version]
  47. Marwan, N.; Kurths, J. Nonlinear analysis of bivariate data with cross recurrence plots. Phys. Lett. A 2002, 302, 299–307. [Google Scholar] [CrossRef] [Green Version]
  48. Measures against COVID-19. Available online: https://www.kantei.go.jp/jp/singi/novel_coronavirus/taisaku_honbu.html (accessed on 10 February 2023).
  49. Muranaka, M.; Uyema, K. Basic regional scenes experienced in the region of Okinawa, a part of Japan. Hist. Stud. Civ. Eng. 1996, 16, 335–344. [Google Scholar] [CrossRef]
  50. Chen, B.; Nakama, Y. A study on village forest landscape in small island topography in Okinawa, Japan. Urban For. Urban Green. 2010, 9, 139–148. [Google Scholar] [CrossRef]
  51. Helmus, L.M.; Kelley, S.M.; Frazier, A.; Fernandez, Y.M.; Lee, S.C.; Rettenberger, M.; Boccaccini, M.T. Static-99R: Strengths, limitations, predictive accuracy meta-analysis, and legal admissibility review. Psychol. Public Policy Law 2022, 28, 307. [Google Scholar] [CrossRef]
  52. Berrett, T.B.; Samworth, R.J. USP: An independence test that improves on Pearson’s chi-squared and the G-test. Proc. R. Soc. A 2021, 447, 20210549. [Google Scholar] [CrossRef]
  53. Hachiken, H.; Matsuoka, A.; Murai, A.; Kinoshita, S.; Takada, M. Quantitative Analyses by Text Mining of Journal Articles on Medical Pharmacy—A comparison between the Japanese Journal of Pharmaceutical Health Care and Sciences and the Journal of Japanese Society of Hospital Pharmacists. Iyakuhin Johogaku 2012, 13, 152–159. [Google Scholar] [CrossRef]
  54. Yang, R.; Su, C.; Zhao, J.; Zhang, J. Rural Landscape Perception from the Perspective of Internationalization: A Case Study of Onna Village, Okinawa, Japan. Landsc. Archit. 2022, 9, 107–112. [Google Scholar] [CrossRef]
  55. Rezvani, M.; Hashemi, S.M. Enhancing accuracy of topic sensitive PageRank using jaccard index and cosine similarity. In Proceedings of the 2012 IEEE/WIC/ACM International Conferences on Web Intelligence and Intelligent Agent Technology, Macau, China, 4–7 December 2012; Volume 1, pp. 620–624. [Google Scholar] [CrossRef]
  56. Reid, C.E.; Rieves, E.S.; Carlson, K. Perceptions of green space usage, abundance, and quality of green space were associated with better mental health during the COVID-19 pandemic among residents of Denver. PLoS ONE 2022, 17, e0263779. [Google Scholar] [CrossRef]
  57. Noszczyk, T.; Gorzelany, J.; Kukulska-Kozieł, A.; Hernik, J. The impact of the COVID-19 pandemic on the importance of urban green spaces to the public. Land Use Policy 2022, 113, 105925. [Google Scholar] [CrossRef]
  58. Okamoto, S. State of emergency and human mobility during the COVID-19 pandemic in Japan. J. Transp. Health 2022, 26, 101405. [Google Scholar] [CrossRef]
  59. Tomochi, M.; Kono, M. Does the sixth wave of COVID-19 break in Okinawa? J. Gen. Fam. Med. 2022, 23, 284–286. [Google Scholar] [CrossRef]
  60. Shinoda, S. Brief epidemiological consideration on the COVID-19 pandemic. J. Disaster Res. 2023, 18, 69–74. [Google Scholar] [CrossRef]
  61. Liu, S.; Su, C.; Yang, R.; Zhao, J.; Liu, K.; Ham, K.; Zhang, J. Using crowdsourced big data to unravel urban green space utilization during COVID-19 in Guangzhou, China. Land 2022, 11, 990. [Google Scholar] [CrossRef]
Figure 1. Correlation of utilisation variables before the pandemic ((ag) respectively depict the variations between pairs of utilising variables that are correlated in 7 groups).
Sustainability 15 09554 g001
Figure 2. Correlations of utilisation variables during the pandemic ((af) respectively depict the variations between pairs of utilising variables that are correlated in 6 groups).
Sustainability 15 09554 g002
Figure 3. The co-occurrence network of greenspace experience themes for the 1–2-point negative evaluation group before and during the pandemic.
Sustainability 15 09554 g003
Figure 4. The co-occurrence network of green space experience themes for the pre-and post-pandemic 3-point neutral evaluation groups.
Sustainability 15 09554 g004
Figure 5. The co-occurrence network for the green space experience theme for the 4–5-point positive evaluation group before and during the pandemic.
Sustainability 15 09554 g005
Table 1. Number of raw data and number of visitors to Ishigaki City over the years.
YearCountsTourist Arrivals
200958732,594
201079725,635
201192660,510
2012175713,058
2013399945,964
20146371,121,622
20159461,115,051
20167811,248,079
20178751,386,646
20187211,379,725
20195851,482,154
2020160651,747
202161552,430
Table 2. Sig. (2-tailed) values of Pearson’s chi-square test between utilisation variables before the pandemic.
Type of TravelRatingTime of TravelType of Green SpaceTourist Travel Experience
Type of Travel-0.0950.0000.0000.000
Rating0.095-0.0530.0000.000
Time of Travel0.0000.053-0.0000.000
Type of Green Space0.0000.0000.000-0.150
Tourist Travel Experience0.0000.0000.0000.150-
Table 3. Sig. (2-tailed) values of Pearson’s chi-square test between utilisation variables during the pandemic.
Type of TravelRatingTime of TravelType of Green SpaceTourist Travel Experience
Type of Travel-0.0520.010.2530.004
Rating0.052-0.0020.0030.020
Time of Travel0.0010.002-0.0010.128
Type of Green Space0.2530.0030.001-0.792
Tourist Travel Experience0.0040.0200.1280.792-
Table 4. High-frequency words on the theme of green space experience for the 1–2-point negative evaluation group before the pandemic.
NounFrequencyAdjectiveFrequency
stalactite cave161nice/good45
animal57disappointment26
sightseeing47bad19
Ishigaki Island47high17
beach46horror12
parking32
entrance fee29
glass boat24
pamphlet22
signboard19
Table 5. High-frequency words for the theme of green space experience in the 1–2-point negative evaluation group during the pandemic.
NounFrequencyAdjectiveFrequency
stalactite cave8horror5
park5nice/good3
kid/child5dark3
sightseeing4high3
entrance4bad3
abandoned3
worth3
Ishigaki Island3
maintenance3
price3
Table 6. High-frequency words on the theme of the greenfield experience in the 3-point neutral evaluation group before the pandemic.
NounFrequencyAdjectiveFrequency
stalactite cave286pretty288
beach265nice/good169
glass boat182disappointment81
sightseeing166wide72
Ishigaki Island145more71
parking142
park122
photograph97
weather84
Kabira Bay63
Table 7. High-frequency words on the theme of the greenfield experience in the 3-point neutral evaluation group during the pandemic.
NounFrequencyAdjectiveFrequency
dam21peace8
park10wide6
stalactite cave10pretty5
beach9nice/good4
sightseeing8nature4
Ishigaki Island8
parking7
maintenance6
view platform6
square6
Table 8. High-frequency words on the theme of green space experience for the 4–5 points positive evaluation group before the pandemic.
NounFrequencyAdjectiveFrequency
glass boat2116pretty806
beach897nice/good642
Ishigaki Island863beautiful516
parking765blue284
Kabira Bay747transparent263
sightseeing617
coral429
view platform509
park456
weather369
Table 9. High-frequency words on the theme of green space experience for the 4–5 points positive evaluation group during the pandemic.
NounFrequencyAdjectiveFrequency
glass boat40beautiful31
beach51pretty26
parking44nice/good28
Ishigaki Island41transparent16
stalactite cave37blue14
park35
coral15
view platform33
Kabira Bay33
spot26
Disclaimer/Publisher’s Note: The statements, opinions and data contained in all publications are solely those of the individual author(s) and contributor(s) and not of MDPI and/or the editor(s). MDPI and/or the editor(s) disclaim responsibility for any injury to people or property resulting from any ideas, methods, instructions or products referred to in the content.

