Article

Sustainable Low-Carbon Layout of Land around Rail Transit Stations Based on Multi-Modal Spatial Data

1
Business School, University of Shanghai for Science and Technology, 516 Jungong Road, Shanghai 200093, China
2
Computer Science Department, Community College, King Saud University, Riyadh 11437, Saudi Arabia
3
Intelligent Transportation Products Department, China Mobile Shanghai Information Communication Technology Co., Ltd., 735 Jingang Road, Shanghai 201206, China
4
Transportation Department, Zhejiang University Urban-Planning & Design Institute, Hangzhou 310023, China
*
Authors to whom correspondence should be addressed.
Sustainability 2023, 15(12), 9589; https://doi.org/10.3390/su15129589
Submission received: 15 March 2023 / Revised: 31 May 2023 / Accepted: 8 June 2023 / Published: 14 June 2023
(This article belongs to the Special Issue Sustainable Risk Assessment Based on Big Data Analysis Methods)

Abstract

:
With the ever-increasing demand for transport in modern cities, emissions from urban transport are rising. The proportion of carbon emissions in exhaust gas accounts for a large share of society’s total carbon emissions and is increasing. Therefore, urban transport has a sustainable responsibility to reduce carbon emissions. Investigating the factors that influence carbon emissions from transport has become an important practical issue that needs to be addressed. This paper adopts a “bottom-up” theoretical calculation method of transport carbon emissions and establishes the basic distribution model of inter-modal land use around rail transit stations. It clarifies the connection mode of rail transit stations and establishes the distribution model of carbon emission of stations under different building distribution modes, suggesting the planning of building distribution patterns around rail transit stations. This paper proposes a new method to analyze the influencing factors of carbon emissions at rail transit stations based on multi-modal spatial data in order to make full use of the dense characteristics of rail transit stations and reduce carbon emissions.

1. Introduction

Climate change caused by greenhouse gases has become the focus of global attention. Carbon emissions from fossil energy combustion are the main components of greenhouse gases. How to reduce carbon emissions is one of the most challenging problems in this era. Transportation is the foundation and forerunner of economic and social development and the leading field of modern economic systems. It consumes a large amount of energy and has become a globally recognized high-energy-consumption industry [1]. According to the International Energy Agency (IEA, 2019), the transport sector became the world’s second largest carbon emitter in 2018, accounting for 27% of total carbon emissions, and CO2 emissions are expected to increase to 41% by 2030 [2]. Academics in different countries are trying to reduce carbon emissions from different sectors of transport. Dr. Pedro Dorta Antequera et al. took islands connected to the outside world by air transportation as the research subject and analyzed the carbon footprint generated by tourists during the journey, so as to evaluate the carbon emissions generated by aviation [3]. Evert A. Bouman et al. reviewed 150 studies, reports, etc., on maritime emission reduction to provide a comprehensive overview of the potential for CO2 reduction and identify the most promising areas and approaches for maritime emission reduction [4]. Inmaculada Martinez-Zarzoso et al. used panel data to model the relationship between urbanization and carbon emissions in developing countries, suggesting that the impact of urbanization on CO2 emissions should be taken into account in future discussions of climate change policies [5]. China is a developing country. With the development of social economy, the demand for transportation in modern cities is increasing. The carbon emissions generated by road transportation are far greater than those of other modes of transportation, and the transportation sector is facing great pressure to control carbon emission.
In recent years, a TOD (transit-oriented development) policy has been promoted internationally. As an important part of the urban public transport system, China’s urban rail transit not only alleviates the contradiction between urban transport and land, but also directly and indirectly reduces transportation energy consumption, making great contributions to the construction of low-carbon cities. Compared with other modes of transportation, rail transit is more convenient and faster, but often passengers need to use other modes of transportation to connect. Due to the high intensity of development near rail transit stations and the large difference in urban spatial layout structure, some urban layout structures may even cause detours and other problems, which increases the connection time of rail transit and thus leads to the increase in carbon emissions. At present, most of the existing studies focus on the impact of the overall urban spatial structure on carbon emissions, without considering the particularity of rail transit. In addition, some emerging situations, such as the TOD model, new-energy buses, etc., are also rarely considered. Therefore, the influence of land layout structure around rail transit on the carbon emission generated by the connection mode has become an urgent issue to be discussed.
When building new or renovating existing buildings around stations, the intensive nature of rail transit stations can be fully exploited and combined with the TOD urban development model to create green, convenient and comfortable living spaces around rail transit stations [6,7,8,9]. In order to explore the impact of the building layout around rail transit stations on carbon emissions, this paper adopts different strategies to classify the distribution patterns of buildings around rail transit stations with reference to 5G network traffic analysis methods, and establishes corresponding multi-modal mathematical models to calculate the carbon emissions of connecting to rail transit under different building distribution patterns. The main contributions of this study are as follows:
  • First, the basic distribution patterns of buildings near rail transit stations are classified according to the plane layout and facade layout, and the relationship between each distribution pattern and the nature of land use is analyzed. The sustainable low-carbon layout near rail transit stations can be analyzed more comprehensively.
  • Second, combined with the agglomeration characteristics of different types of land use, the influence of different building distribution modes on the time of rail transit connection and distribution is analyzed. The time model of site gathering and distribution under different layout modes is established to establish the relationship between land-use distribution and carbon emission.
  • Third, simulated cases were used to analyze the impacts of different building layouts on carbon emissions from multiple perspectives to support policy design and decision-making.
The rest of this study is organized as follows: the second part reviews the development of the TOD mode and the research on carbon emission reduction in rail transit; the third part expounds the residents’ travel mode selection, gathering and distributing-time calculation as well as the carbon-emission calculation method near the battle point of rail transit; the fourth part introduces relevant parameters and analyzes and discusses the research results of this study. The Section Section 5 summarizes the main findings and makes policy recommendations.

2. Literature Review

The proposal of the dual carbon target has brought great challenges to the development of China’s transport. Carbon emissions from urban transport, as one of the main sources of carbon emissions, have attracted much attention, and carbon emissions from road transport, as an important part of urban transport carbon emissions, have been studied through the land-use layout and connection mode around rail transit stations. It is possible to analyze the influence of different land layout structures around rail transit on carbon emissions generated by the connection mode, so as to realize a sustainable low-carbon urban layout. The low-carbon and green transformation of transport will promote the construction of green cities and promote sustainable transport development in China.

2.1. Research on the Development of the TOD Model

In recent years, the international community has widely advocated the TOD strategy as a development strategy for compact and low-carbon cities [10]. The TOD model advocates bus travel, which is regulated through land use and transportation policies. It not only solves the traffic-flow problem caused by a large volume of traffic, but also reduces the demand for inter-regional shuttles; it not only alleviates the contradiction between urban traffic and land, but also directly and indirectly reduces the demand for transportation energy consumption, which is conducive to the development of low-carbon cities [11,12]. Some scholars used panel data models to discuss the relationship between urban compactness and energy-related per capita greenhouse gas emissions in different countries, and found that in terms of reducing carbon emissions, it is effective to build low-physical compact and high-use mixed cities. If the population density can be improved, land-use efficiency can be increased and per capita carbon emissions can be reduced [13]. Future urban TOD planning needs to provide suitable transportation mode types and combinations according to personnel activity locations, quantify and promote the benefits related to TOD and environmental construction through research, and develop comprehensive transportation with seamless multi-modal transport and station area integration, so as to promote carbon emission reduction [14].
Christian Holz-Rau believes that planning interventions in land use and transport supply can effectively promote the reduction in transport-related greenhouse gas emissions [15]. Konyo Mojito et al. studied the relationship between the urban form and CO2 emissions in urban areas of 50 Japanese cities, and concluded that the spatial index of the urban form was correlated with CO2 emissions in residential and passenger transport sectors [16]. In the domestic literature on urban spatial structure, Ye Yuyao et al. put forward the green transportation system development model (GTOD), pointing out that a compact urban form, effective land use and appropriate block size are the basic structural characteristics of low-carbon transportation cities [17]. To some extent, city size is related to population density, travel distance, traffic structure and other aspects. On this basis, Zhang Cong et al. compared the per capita carbon emissions of urban traffic in different levels of city size based on a calculation model of resident-travel carbon emissions, analyzed carbon emission factors, and proposed a series of traffic emission reduction measures [18].
The constant change in land use affects all aspects of residents’ life, which is also deeply related to carbon emissions. The rapid development of the economy also causes changes in all aspects of land use. It is also of great significance to explore the change in carbon emissions by analyzing the spatial–temporal characteristics of land-use-change trends [19]. The urban form and the urban layout have a non-negligible impact on transportation carbon emissions. On this basis, future urban construction will comprehensively consider transportation emission reduction and other aspects, and promote the realization of the “dual carbon” goal through the TOD urban development mode.

2.2. Research on Carbon Emissions of Urban Rail Transit

Generally speaking, most studies of carbon emissions from rail transit are based on the relationship between the size of the entire urban rail network and carbon emissions, but carbon emissions from connections between stations and residential or workplaces are also of some value and cannot be completely ignored [20,21]. Studying the connection between carbon emissions and rail transit stations can help to better understand the energy consumption of the rail transit system, thereby limiting carbon emissions and achieving low-carbon development. To this end, some scholars have carried out research on carbon emissions of micro-scale residents’ commuting [22,23], and on calculation models of urban-rail-transit emission reduction based on traffic mode transfers [24]. An urban-rail-transit emission reduction calculation model was established based on transportation-mode transfer [25,26,27]. Some scholars have compared and analyzed the factors influencing carbon emissions from various aspects by comparing the carbon emissions of residential commuting before and after the opening of rail transit [28]. Some scholars have also analyzed the relationship between employment accessibility and carbon emissions from rail transport by building an integrated model. It was found that public transport accessibility, the spatial relationship between employment and housing, the urban spatial form and land-use planning are the main factors affecting commuter carbon emissions [29,30,31,32,33]. Jiang Yang et al. combined the energy consumption factors of various modes of transport with the commuting patterns of residents, calculated transport energy consumption by distance travelled, and determined the influence of urban neighborhood form on residents’ travel energy consumption by analyzing the morphological characteristics of different neighborhoods [34]. Many scholars have found that the accessibility of public transport, the spatial relationship between jobs and housing, the urban spatial form and the land-mixing degree are the main factors affecting the carbon emissions of commuting transport [30,35]. According to Xiaopeng Shen, when the urban metro is completed, residents will switch from small cars and buses to low-cost, efficient and environmentally friendly rail transport. In the absence of urban rail transport, emission reductions can be measured by comparing the differences in emissions corresponding to passenger travel paths [36].
In summary, most macro studies of transport carbon emissions start with the urban scale and land use and focus on influencing factors such as population density and vehicle ownership. On the micro level, the carbon emissions of residents’ commuting are calculated by analyzing various factors, taking the characteristics of their travel behavior as the entry point. We can see that (1) most studies on carbon emissions of rail transit are based on the relationship between the scale of the entire urban rail network and carbon emissions, but ignore the carbon emissions generated by the connection between stations and residents or workplaces; (2) previous scholars compared and analyzed factors affecting carbon emissions from various aspects based on various models. However, they did not make full use of the characteristics of dense rail stations to study the different building layouts near the stations.

3. Methods

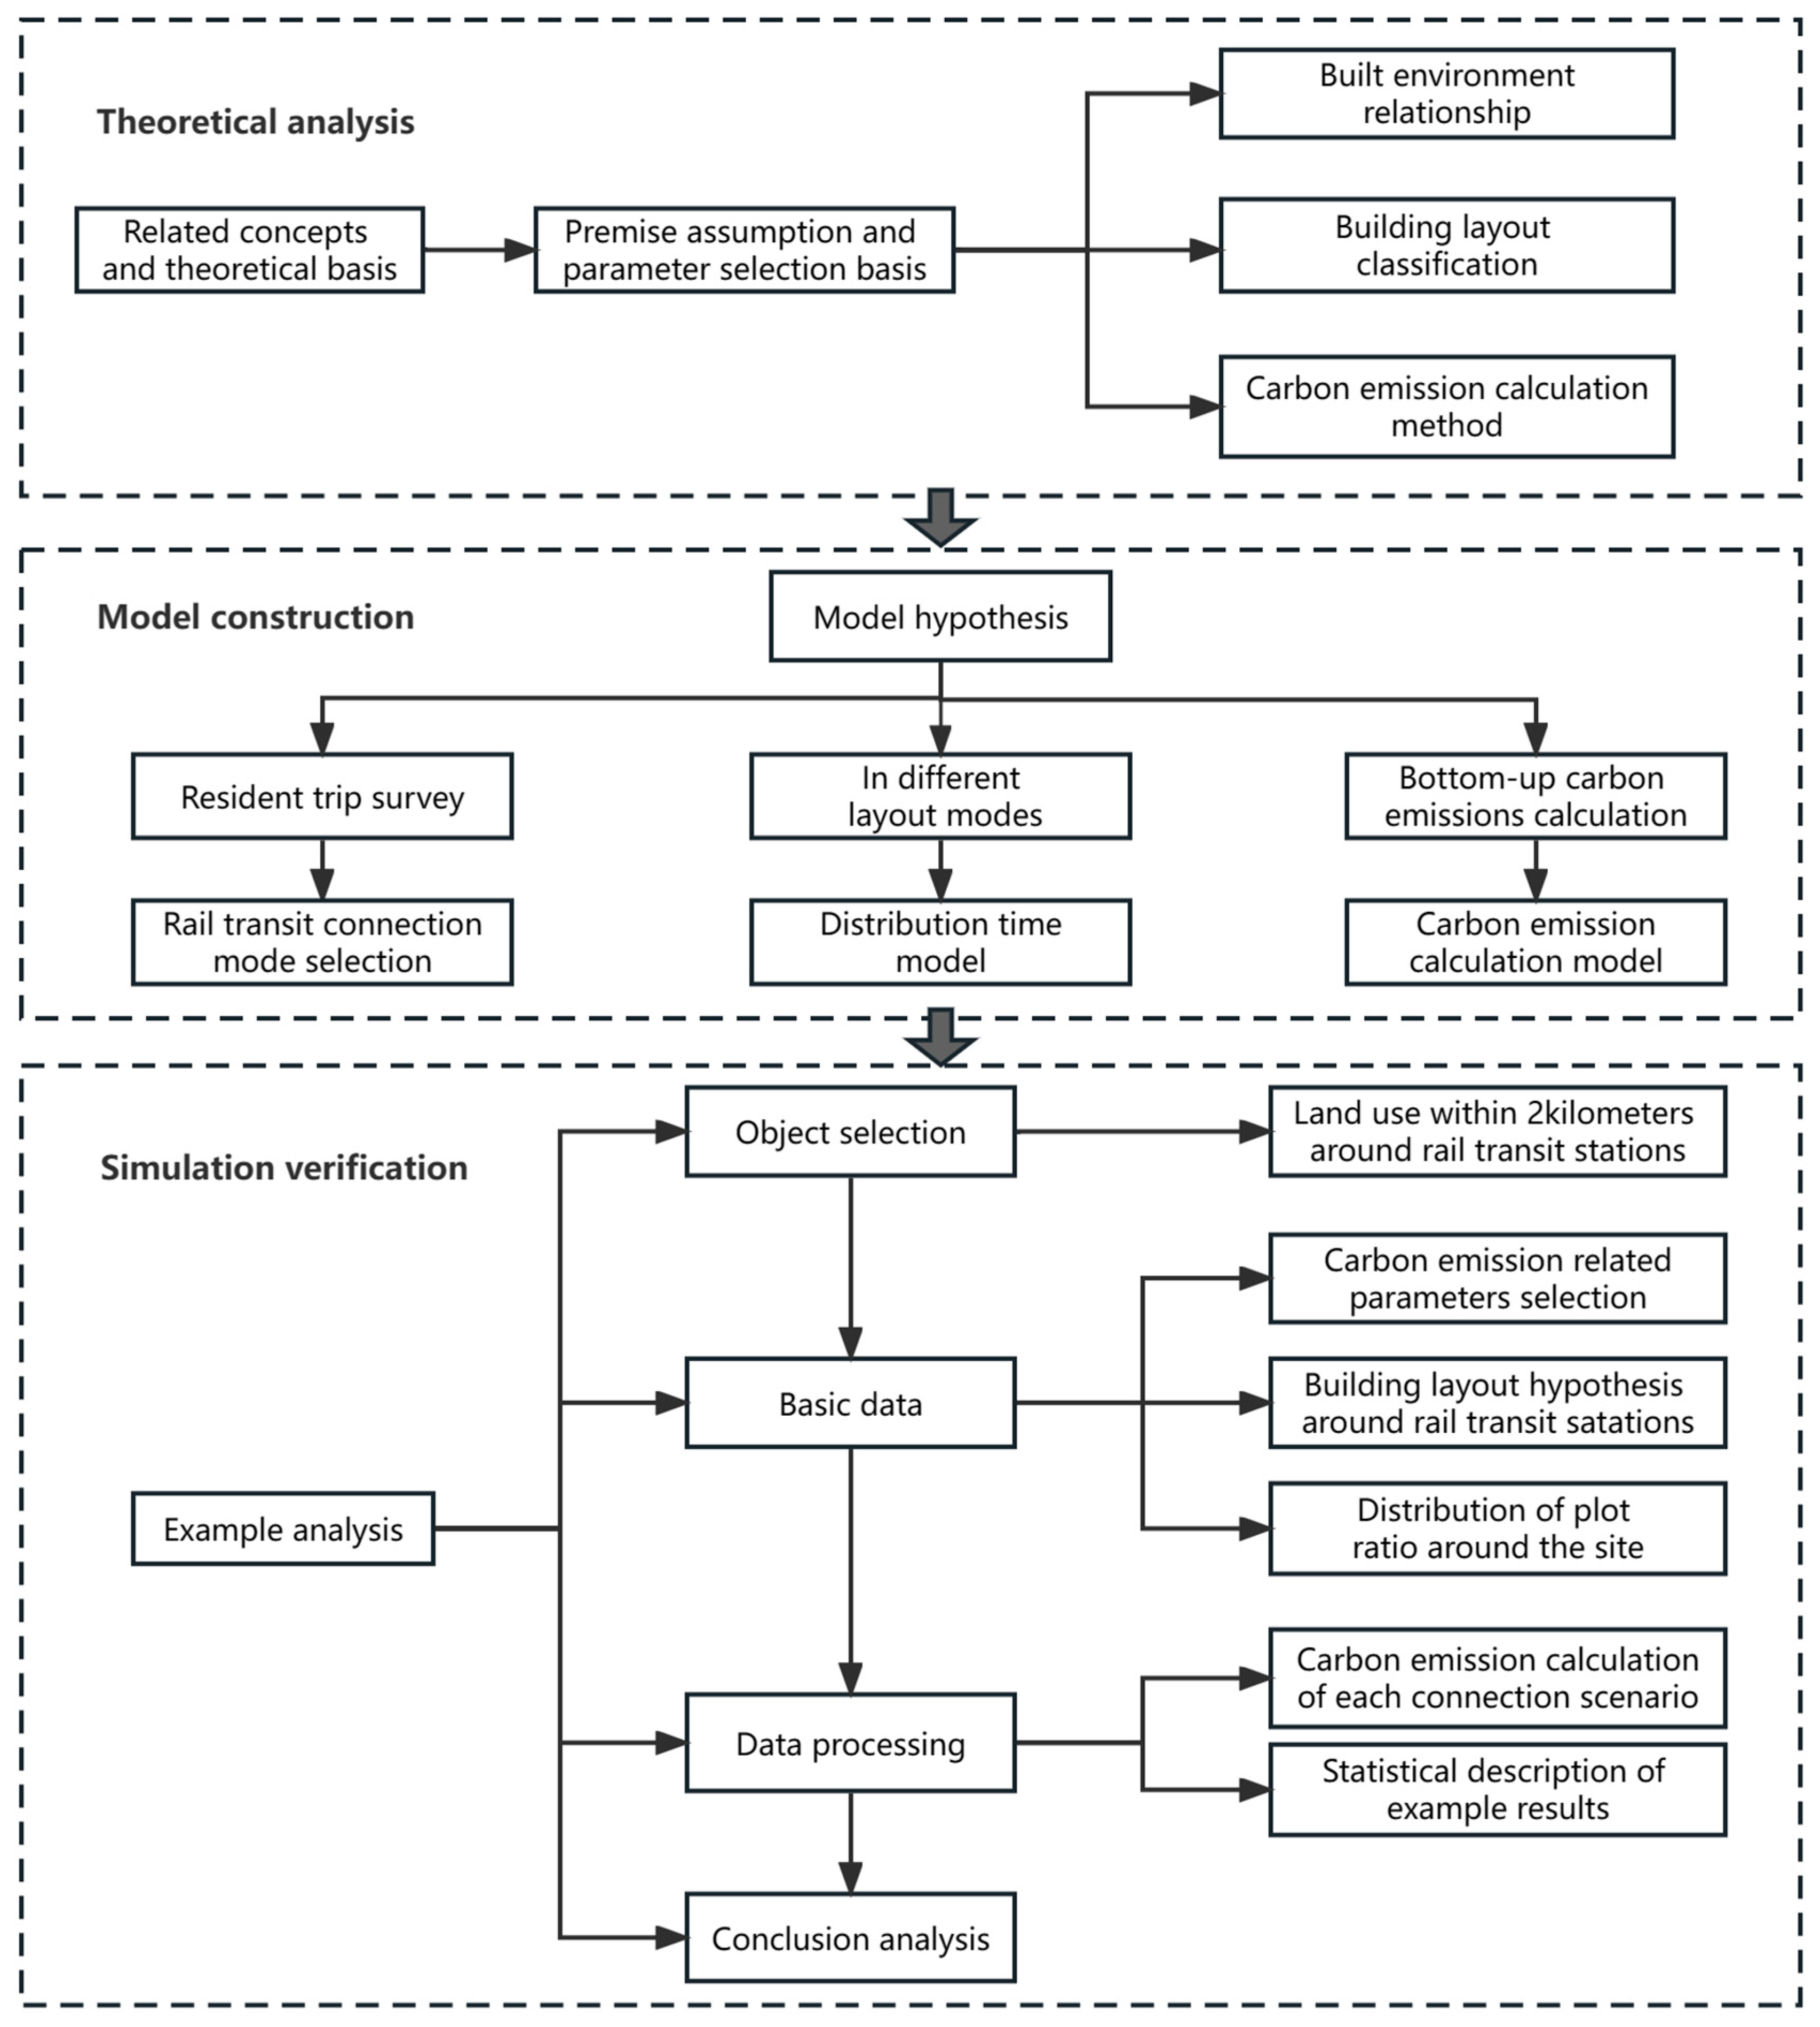
3.1. Research Framework

In order to explore the influence of building distribution around railway stations on carbon emissions, this paper uses the “bottom-up” theoretical calculation method of transport carbon emissions, analyzes the distribution of buildings around railway stations, classifies their distribution mode, clarifies the connectivity mode of railway stations and establishes the carbon emission models of stations under different building distribution modes. On the basis of the survey data, the proportion of residents’ contribution to the choice of connection mode is calculated, and finally the carbon emissions of rail transit connection under different building distribution modes are calculated. By carefully comparing the carbon emissions of connecting rail transit under different building distribution modes, the optimal carbon emission distribution mode of rail transit station is proposed. Corresponding policy suggestions are made to make full use of the intensive characteristics of rail transit stations and reduce carbon emissions. The research framework is shown in Figure 1.

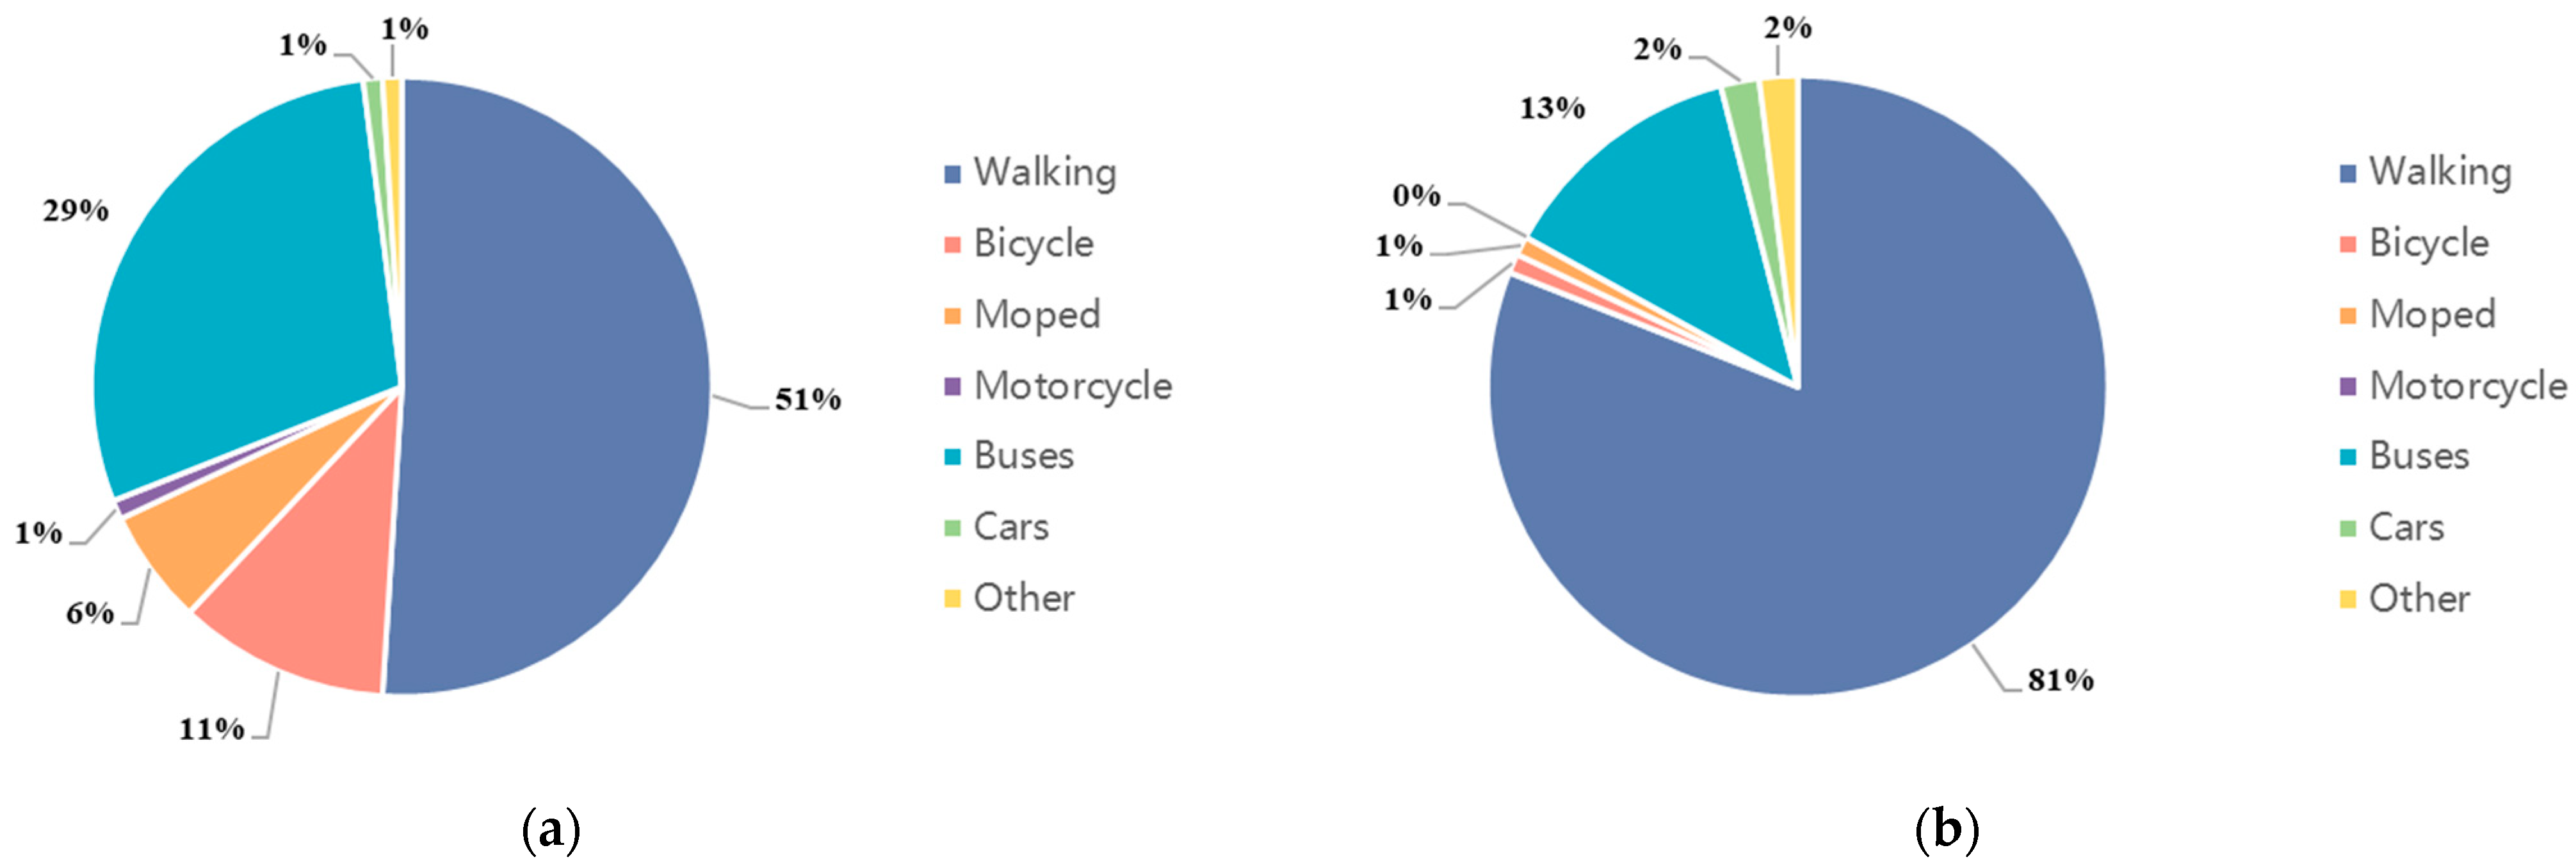
3.2. Traffic Mode Selection to Connect to Rail Transit Stations

(a)
Bus: Passengers are mainly a concentrated passenger flow, some passengers are not familiar with the regional situation and are carrying a lot of goods. In the center of the city, due to the large demand for public transport, they often form excessive congestions in the peak period, and because of the complex road conditions, the phenomenon of cross-car also occurs. Ordinary buses in the urban fringes have a limited passenger flow, large departure intervals and low efficiency. They not only waste transportation resources, but also cannot meet the needs of residents. The general community bus fare is low; except for the rush-hour passenger flow, when it is less, the operating loss is serious.
(b)
Car: In the center of the city it is more flexible than fixed-route transport such as buses because of the free choice of road sections, which allows to avoid congested areas. It can also greatly reduce the connection time but it is expensive. In the urban fringe areas, it is easy to operate more illegal vehicles, forming a larger security risk.
(c)
Non-motorized transport: The connection mode based on non-motorized transport is generally short in distance and passengers carry only a few items; this mode satisfies the shopping and leisure needs of travelers. Passengers tend to focus on road conditions and are susceptible to weather. Road safety, convenience and comfort are the main considerations for residents to travel slowly. Travel cost and time, travel habits and low carbon awareness are also influencing factors for residents to choose non-motorized transport.
For this paper we conducted a travel behavior survey at Zhongshan Park Station, Chifeng Road Station and Gongfu Xincun Station of the Shanghai rail transit system. Zhongshan Park Station is located at the intersection of Kaixuan Road and Changning Road, Changning District, south of Shanghai Zhongshan Park. It is a subway station under the jurisdiction of Shanghai Shentong Metro Co., Ltd. (Shanghai, China), and a transfer station for the Shanghai metro line 2, Shanghai metro line 3 and Shanghai metro line 4. The surrounding scenic spots include the Zhongshan Park, the Zhongshan Park Business Circle, the Shanghai International Gymnastics Centre, the Raffles Square in Changning, etc. Chifeng Road Station is located at the Chifeng intersection of Zhongshan North 1st Road in the Hongkou District of Shanghai. It is a stop of the Shanghai metro line 3 and is surrounded by the Shanghai International Studies University (Hongkou Campus), Shanghai University of Finance and Economics (Zhongshan North 1st Road Campus) and Tongji University (South Campus). Gongfu Xincun Station is located directly above the Wenchuan Road flyover in the Baoshan District, which is a station of the Shanghai metro line 1. Gongfu Xincun is the main building in the surrounding area. The buildings in the vicinity of the three rail transit stations are the main travel destinations for local residents.
The composition of their connecting modes is shown in Figure 2. The distance between railway stations is concentrated within 2000 m and the most common connection mode is walking (about 50% to 80%), followed by bus (about 13% to 29%).
According to the traffic survey data, the connection time between the two ends of the rail transit journey in Shanghai is 39.6 min, while the internal time of the rail transit system is only 30 min. The rail transit connection time is too long, as shown in Figure 3. In particular, the high density of the regular public transport network in the central area of Shanghai can better meet the needs of rail transit travelers, but the regular public transport system in the peripheral areas is very underdeveloped, which makes it difficult to meet the daily travel needs of residents.

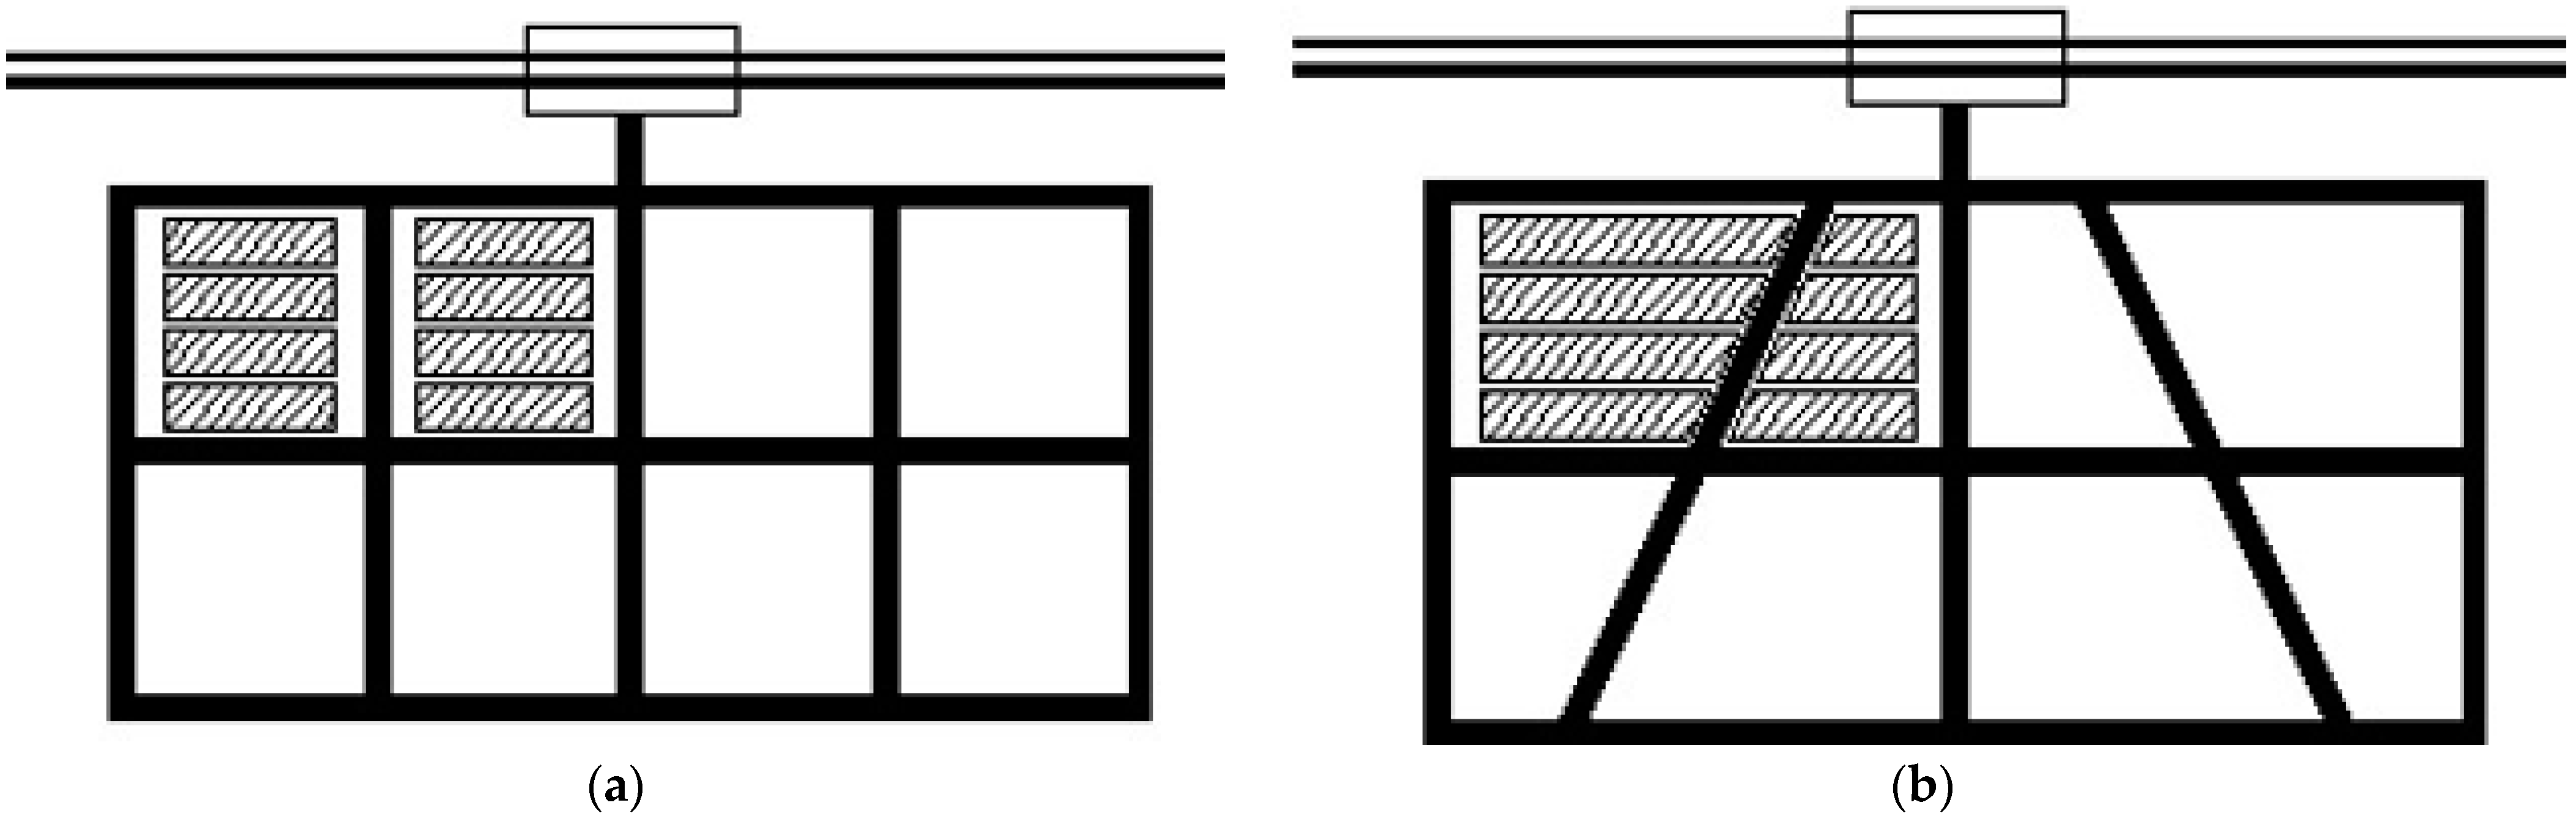
3.3. Basic Mode of Building Distribution around Rail Transit Stations

The distribution pattern of buildings in the vicinity of railway stations can be divided into two types: the plane layout and the vertical layout. Plane layout refers to the characteristics of the plane distribution of buildings around the station. It is mainly determined by the structure of the road network, especially in the development of new urban areas. Vertical layout refers to the characteristics of the vertical distribution of buildings around the station, and the main characteristic is the height distribution of buildings.
In general, the rail distance is about 4–5 bus stops away and the metro-stop spacing is about 1 km, so the connection coverage area is not the conventional circular range. The city center is even more densely covered by stations, and the connection distance is often less than 1 km. The impact of one station is considered in the case of the periphery of the city-center area and with a relatively long station spacing. Therefore, this paper focuses on a circular area of a 2 km radius with the center of the rail station as the origin. Assume that the basic layout pattern of buildings around the rail transit station is divided into a grid pattern (Type A) and a radial type (Type B), as shown in Figure 4a,b.
The design of building facades is mainly controlled and influenced by economic factors, such as the price of land, accessibility by road, accessibility by rail, commercial potential and so on. Land prices are also influenced by many factors, such as location, traffic conditions, topography and urban planning. Rail transit mainly influences land prices along and near the site.
According to the principle of TOD, in an ideal state, the land development pattern around rail transit should be the closer to the site it is, the more high-density the development, which is exactly consistent with pattern III, which can be called a TOD-type land-use pattern. Patterns I and IV are similar to the TOD-type land-use pattern, and pattern II is a non-TOD-type land-use pattern.
The basic combination of plane and facade can divide the buildings around the site into eight categories: AI, AII, AIII, AIV, BI, BII, BIII and BIV. Different combination forms form different volume ratios, and, due to the different nature of land, form different development intensities. The distribution time gap of different architectural forms is large, and the travel costs of residents are also different. The eight architectural patterns around the site are shown in Figure 5.

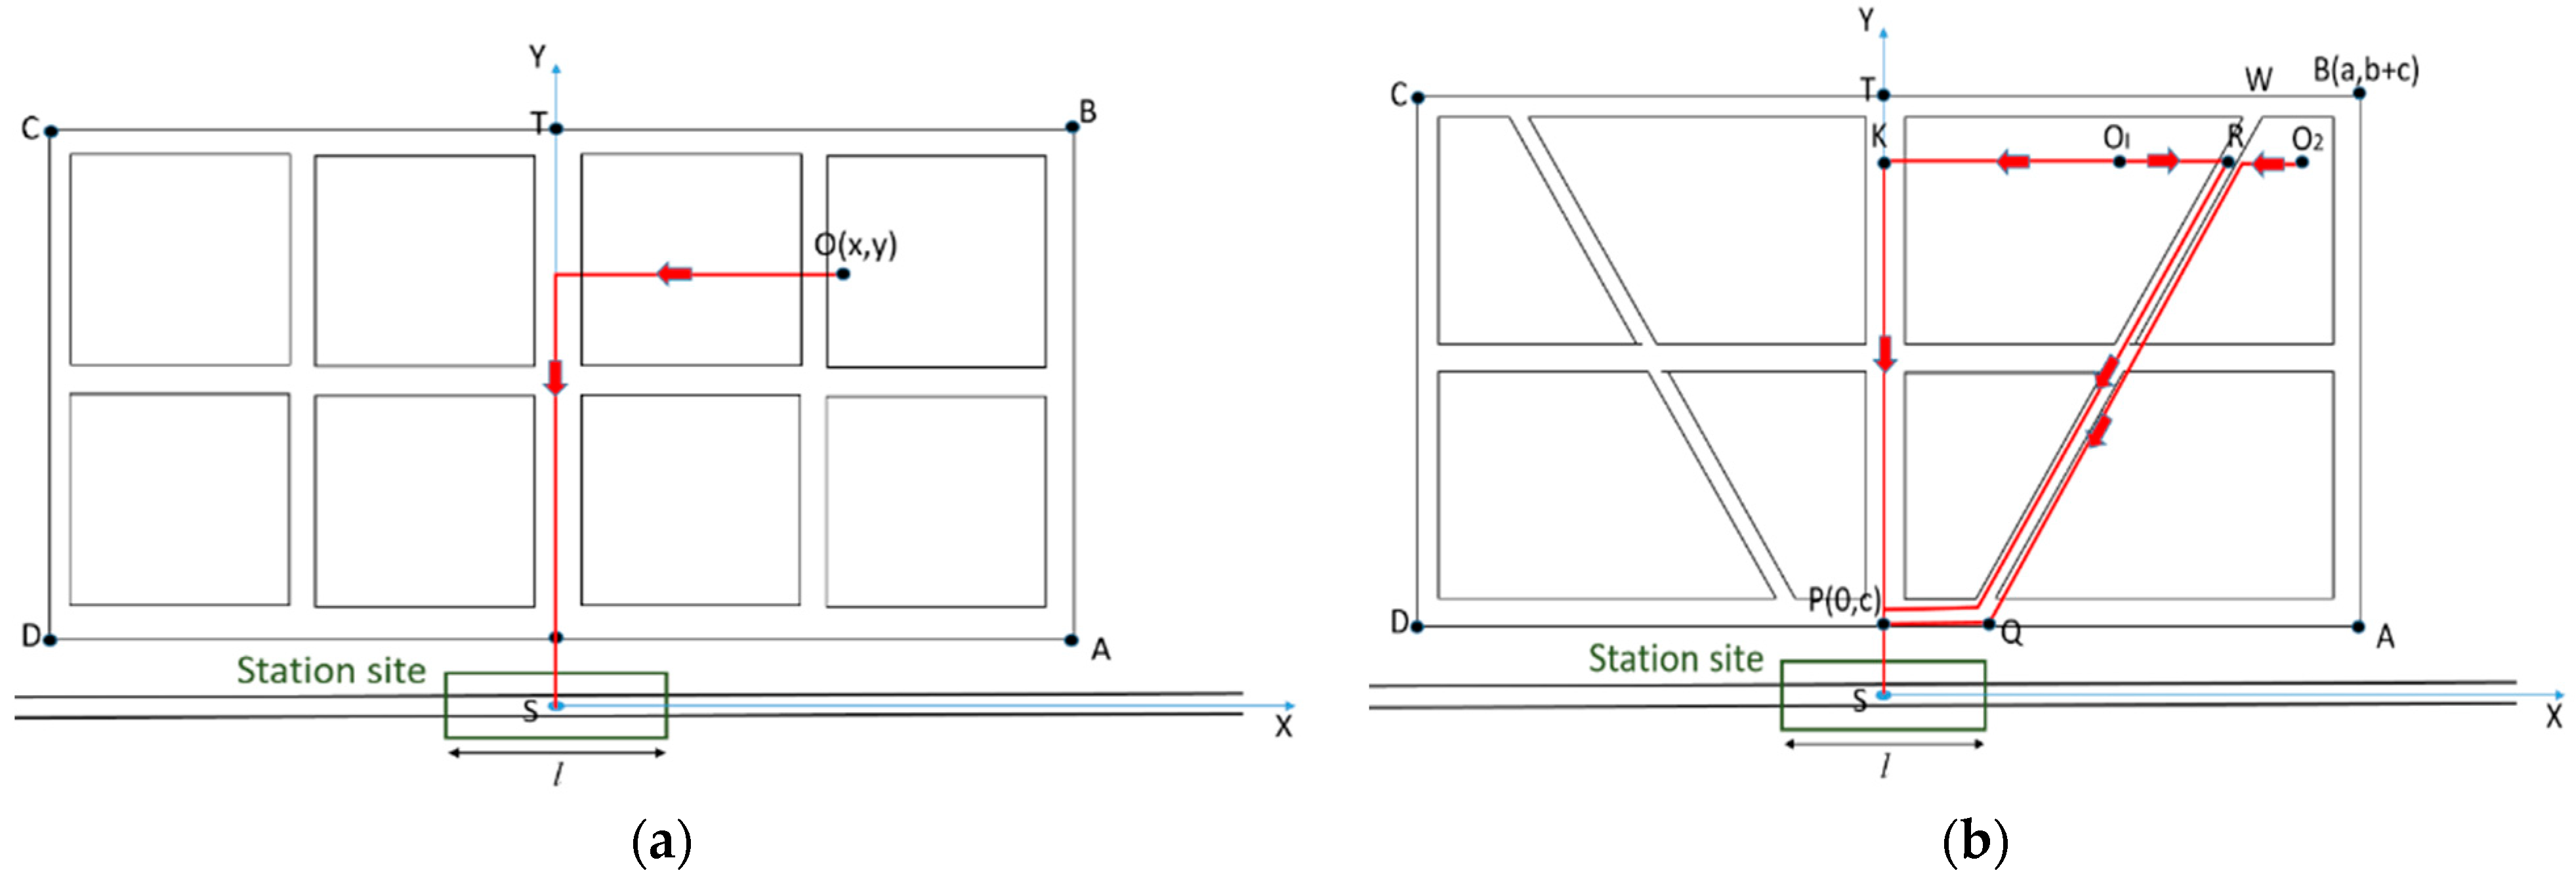
3.4. Shortest Distance between Residential Point and Rail Transit Station

In fact, there are four quadrants around the station, in which the station distribution distance of each quadrant is symmetrical. Therefore, only one quadrant should be considered in modeling, and the first quadrant XSY was selected here. For ease of discussion, assume that each walkway in the diagram is interlinked. For the Type A layout mode, regardless of the pedestrian path, the shortest distance from any point O (x, y) to the station center is x + y; for the Type B layout mode, the shortest distance from any point O (x, y) to the station center is related to the path. The distribution path diagrams of Type A and Type B are shown in Figure 6a,b.
For any point O (x, y) in the grid pattern (A) layout mode, the distance D to the station site can be expressed as
D = x + y
The shortest distance from any point to the station in the radial type (Type B) layout mode will be analyzed and calculated in conjunction with Figure 6. Here, l is the length of the station, satisfying  P Q = W B = 0.5 l ; a is the longitudinal influence length, satisfying  P A = T B = P D = T C = a ; b is the transverse influence width, satisfying  A B = C D = P T = b .
The shortest path from left  O 1  of walkway  W Q  to station center S is indefinite, and it needs to be selected between path  O 1 K P S  and  O 1 R Q P S  according to the specific location of  O 1 , and its shortest length is set as  l 1 x , y , namely  l 1 = m i n O 1 K P S , O 1 R Q P S ; the shortest path from the right  O 2  of walkway  W Q  to the station center S is determined as  O 2 R Q P S , denoted as  l 2 x , y .
According to the variables and geometric relations in Figure 5, we can calculate
l 1 x , y = min x + y , ( a l ) 2 + b 2 b y c + a l b y c x + l + c
l 2 x , y = x a l b y c + ( a l ) 2 + b 2 b y c + c

3.5. Site Distribution Time under Different Plane Layout Patterns

Assuming that the per capita residential building area around the site is u, the per capita travel speed is v, and the floor area ratio at any point O (x, y) in the plane is  ρ x , y , the distribution time under the two different planes, layout grid pattern (Type A) and radial type (Type B), is calculated regardless of the influence of building height on the distribution time.
Grid pattern (Type A): Point O around the unit area with residents’ travel time  d t :
d t = 1 u v ρ x , y x + y d x d y
Then the distribution time of cars  T A  of all residents in the four quadrants around the site for one round trip to the site is:
T A = 4 u v c b + c 0 a ρ x , y x + y d x d y
Radial type (Type B): The position of any point O (x, y) should be discussed for the radial type (Type B), as shown in Figure 6. Let the equation of QW in Figure 5 be x = g (y), and g (y) be a linear function.
Then the travel time of residents in the area element around point O1 is  d t 1 :
d t 1 = 1 u v ρ x , y l 1 x , y d x d y
Then the travel time of residents in the area element around point O2 is  d t 2 :
d t 2 = 1 u v ρ x , y l 2 x , y d x d y
The distribution time of cars is  T B :
T B = 4 u v c b + c 0 g y ρ x , y min x + y , ( a l ) 2 + b 2 b y c + a l b y c x + l + c d x d y + 4 u v c b + c { g y a ρ x , y x a l b y c + ( a l ) 2 + b 2 b y c + c d x } d x d y

3.6. Carbon Emission under Different Building Distribution Modes

If the fuel consumption per kilometer of connecting modes in the area around the station is Q, the mileage is L, the conversion coefficient of petroleum standard coal is B, the carbon emission coefficient of petroleum energy is C and the carrying coefficient is Z, the carbon emission of the traffic mode is E, and can be calculated as:
E = Q × L × B × C ÷ Z = Q × V × T × B × C ÷ Z
In order to study the effect of urban layout on the carbon emissions produced in the process of rail transit connection, the mileage is represented by gathering and distributing time and driving speed; the mileage is
L = V × T
Rail transit connection modes are divided into buses, cars and non-motorized traffic. In the following, conventional bus and private cars are used to represent buses and cars, respectively, while non-motorized traffic is all regarded as non-carbon-emission traffic.
E b = Q b × V b × T b × B b × C b × P b ÷ Z b
E c = Q c × V c × T c × B c × C c × P c ÷ Z c
E m = 0
Bus carbon emissions are  E b  (Unit t); car carbon emissions are  E c  (Unit t); carbon emissions from non-motorized traffic are  E m  (Unit t).
The carbon emissions of electric vehicles are calculated as follows:
E = W × C Q × T × V ÷ Z
By sorting out the relationship between the formulas, the total carbon emission model of the residents around the rail transit stations in different urban layouts is obtained, in which buses and cars share a certain proportion, so the distribution time of different connection modes is determined by the sharing proportion of the connection modes.
Among them, as the bus travel path is determined by the stop location and the travel time is relatively fixed, the bus distribution time  T b  cannot be simply brought into the distribution time model, but is determined by the average connecting mileage, the average bus speed, the stop time of the bus station and so on. The distributed time  T c  of cars can be obtained by substituting the average speed of cars into the distributed time model under different layout modes.
If the average mileage of the bus is  l b , the connection time of each bus is  l b / V b . If all residents are connected, a total of N buses are needed and the bus distribution time is
T b = ( l b ÷ V b ) × N
After sorting out the relevant data, it is concluded that the average connecting mileage of buses in the grid type is about 5 km, which is about the distance of five stations. The average connecting mileage of radial buses is about 3 km, with a distance of about three stations.

4. Results and Discussion

4.1. Parameter Settings

Based on the above model, the example in this section divides the basic types of distribution patterns of buildings around the site into the following eight types: AI, AII, AIII, AIV, BI, BII, BIII and BIV, and calculates the carbon emissions of these eight basic models for comparative analysis. Some model parameters and function forms are set below, as shown in Table 1.
Type I: ρ (x, y) = f (y) = 2.4, equivalent to a floor area ratio of 2 km × 2 km of residential quarters averaging 15 stories. (Floor spacing, distance from side to street, etc., reasonably arranged in accordance with existing architectural design regulations.)
Type II: ρ (x, y) near-low far-high, equivalent to the first row being 12 stories high, the last row being 18 stories high, of the 2 km × 2 km plot volume rate. (Rows of buildings can be different from type I, floor spacing, side and street distance according to the existing building design regulations.)
Type III: ρ (x, y) near-high far-low, equivalent to the first row being 18 stories high, the last row being 12 stories, of the 2 km × 2 km plot volume rate. (Building rows can be different from type I, floor spacing, side and road distance according to the existing building design regulations and reasonable arrangement.)
Type IV: ρ (x, y) high in the middle, low at both ends, equivalent to the first row and the last row being 12 stories high, the middle being 18 stories, of the 2 km × 2 km plot volume rate. (The rows of buildings can be different from the type I, the distance between floors, the distance between sides and the distance between roads according to the existing building design regulations and reasonable arrangement).
According to the previous classification, Type III belongs to the TOD land-use pattern, Type IV and Type I are similar to the TOD land-use pattern, and Type II belongs to the non-TOD land-use pattern. The distribution of the specific volume ratios is shown in Figure 7. Among them, the district footpath is divided by 0.4 km, 1.2 km, 2 km from the station center. If u = 30 m2/person, each community (quadrant) can accommodate 320,000 people. Around the station, four quadrants can accommodate 1280,000 people.
There is a relationship between public transport carbon emissions and volume ratio. The volume ratio is the ratio of floor area per unit area to ground area of urban buildings, and is an important indicator of urban land-use intensity. The higher the volume ratio, the higher the density of urban buildings, the greater the demand for public transport and therefore the corresponding increase in carbon emissions from public transport.
In the case of Shanghai, a major global city, the impact of floor-area ratio on public transport carbon emissions is complex and varied. The following are some of the specific factors that may affect the carbon emissions of public transport in Shanghai.
(a)
Quality and efficiency of public transport services: The quality and efficiency of public transport services in Shanghai are relatively high, but could be further improved, for example by increasing the number of public transport routes and enhancing the interchange experience, in order to increase the public’s use of public transport and reduce carbon emissions.
(b)
Traffic congestion and congestion: Shanghai has a relatively high level of traffic congestion and congestion, which can reduce the efficiency and quality of public transport services and lead to increased carbon emissions.
(c)
Public transport fares: Public transport fares in Shanghai are relatively low, but they are likely to rise gradually under growing economic pressures, which could have an impact on the public’s willingness to use them, leading to an increase in carbon emissions.
(d)
Urban planning and traffic management: Shanghai needs to develop appropriate urban planning and traffic management policies based on population density and traffic demand to ensure the efficient operation and quality of service of the public transport system.
(e)
New-energy public transport: As the promotion of new-energy vehicles and public transport in Shanghai continues to intensify, the usage rate and market share of new-energy public transport will gradually increase, which will help reduce carbon emissions.
Therefore, a multiple regression analysis of plot ratio and residential transport energy consumption revealed a U-shaped curve relationship between plot ratio of urban residential land and residential transport energy consumption per capita. Referring to a study by Xie Yang et al. in 2017 [37], when the plot ratio is approximately equal to 1.01, the corresponding per capita residential transport energy consumption is the lowest. The average floor-area ratio is calculated for the four facade layouts, and the regression equation is used as a reference value to derive the parameters of the impact of urban facade layout on carbon emissions as shown in Table 2 below.
This paper takes 2 km around the rail station as the study area, where the maximum value of the shortest path of the square layout is 4 km and the maximum value of the shortest path of the radial layout is about 3 km. A distance of 1 km is used as a segment (driving distance, not straight-line distance) to divide the areas of different service ranges, and the area ratio of the rail station corresponding to different radiation ranges can be derived. Assuming that the population in the region is proportional to the area, the total number of people using each mode of transport is obtained by multiplying the population in the region with the proportion of each mode of transport in the region, thus calculating the proportion of each mode of transport in the study area.
At the same time, the layout of the facade also has an impact on the connection and travel structure of residents in the study area. Based on actual traffic cases and relevant data such as the literature and the national statistical yearbook, the proportion of traffic-mode selection and vehicle-type structure under different elevation layouts is obtained, as shown in Table 3 and Table 4.
According to the industrial energy statistical yearbook and other related data, the calculation parameters of different traffic connection modes are shown in Table 5 below.

4.2. Results and Discussion

The above parameters are substituted into the previous formula to calculate the carbon emissions of different access modes under different building distributions of railway stations.
It can be seen from Figure 8 that for the plane layout of the building distribution type around the rail transit station, independent of it being a grid pattern or radial type, when the vertical layout is of the near-high far-low type (Type III), the carbon emissions of buses are the lowest. The reason for the slightly higher carbon emissions of electric buses compared to fuel buses is the higher share of electric buses. Similarly, based on the parameters in Table 5, the carbon emissions of cars under different building distributions can be obtained.
It can be seen fromFigure 9 that for the distribution types of buildings around railway stations, the facade layout has little effect on the carbon emissions of cars. Compared to the grid pattern, the radial layout has fewer carbon emissions and is more beneficial for carbon emission reduction. In practice, most of the connection modes for cars are generated at a distance from the rail transit stations. Poor accessibility in the network layout leads to a relatively long connecting distance and a long connecting time, thus producing more carbon emissions.
By comparing the carbon emission of cars and buses in Figure 10, it was found that the carbon emissions of cars were significantly higher than those of buses. The main reason is that compared with buses, most connections of cars take place far away from stations, so the total carbon emission value is higher. Additionally, the country’s new-energy buses are constantly developing, and the buses have a large transport capacity. Compared to small cars, the emission reduction effect is significant.
The carbon emissions of buses and cars are added together to obtain the total carbon emissions of residential connections under different building distributions, as shown in Table 6 and Figure 11 below. The differences of total carbon emissions under different land layouts can be visually seen in the histogram.
To sum up, the total carbon emission of the radial type layout is lower than that of the grid type layout, and the radial type layout near-high far-low (BIII) has the lowest carbon emissions; the elevation layout near-high far-low (III) belongs to the TOD layout, and the radial type plane layout has better accessibility than the grid type. By selecting the connection mode under the combination of the two, the connection and distribution time can be better optimized, which can effectively reduce the carbon emissions caused by rail transit connections.

5. Conclusions and Policy Implications

This paper takes rail-transit-connection carbon emission as the starting point to explore the relationship between urban layout and connection carbon emission. Through collation and collection of relevant research results and method summary in domestic and foreign fields, based on a bottom-up carbon emission calculation method, a time model of rail transit connection calculation under different urban layouts is established, and carbon emissions under different urban layouts and connection methods are simulated and calculated, and the rule is finally summarized. The main findings are as follows:
(1)
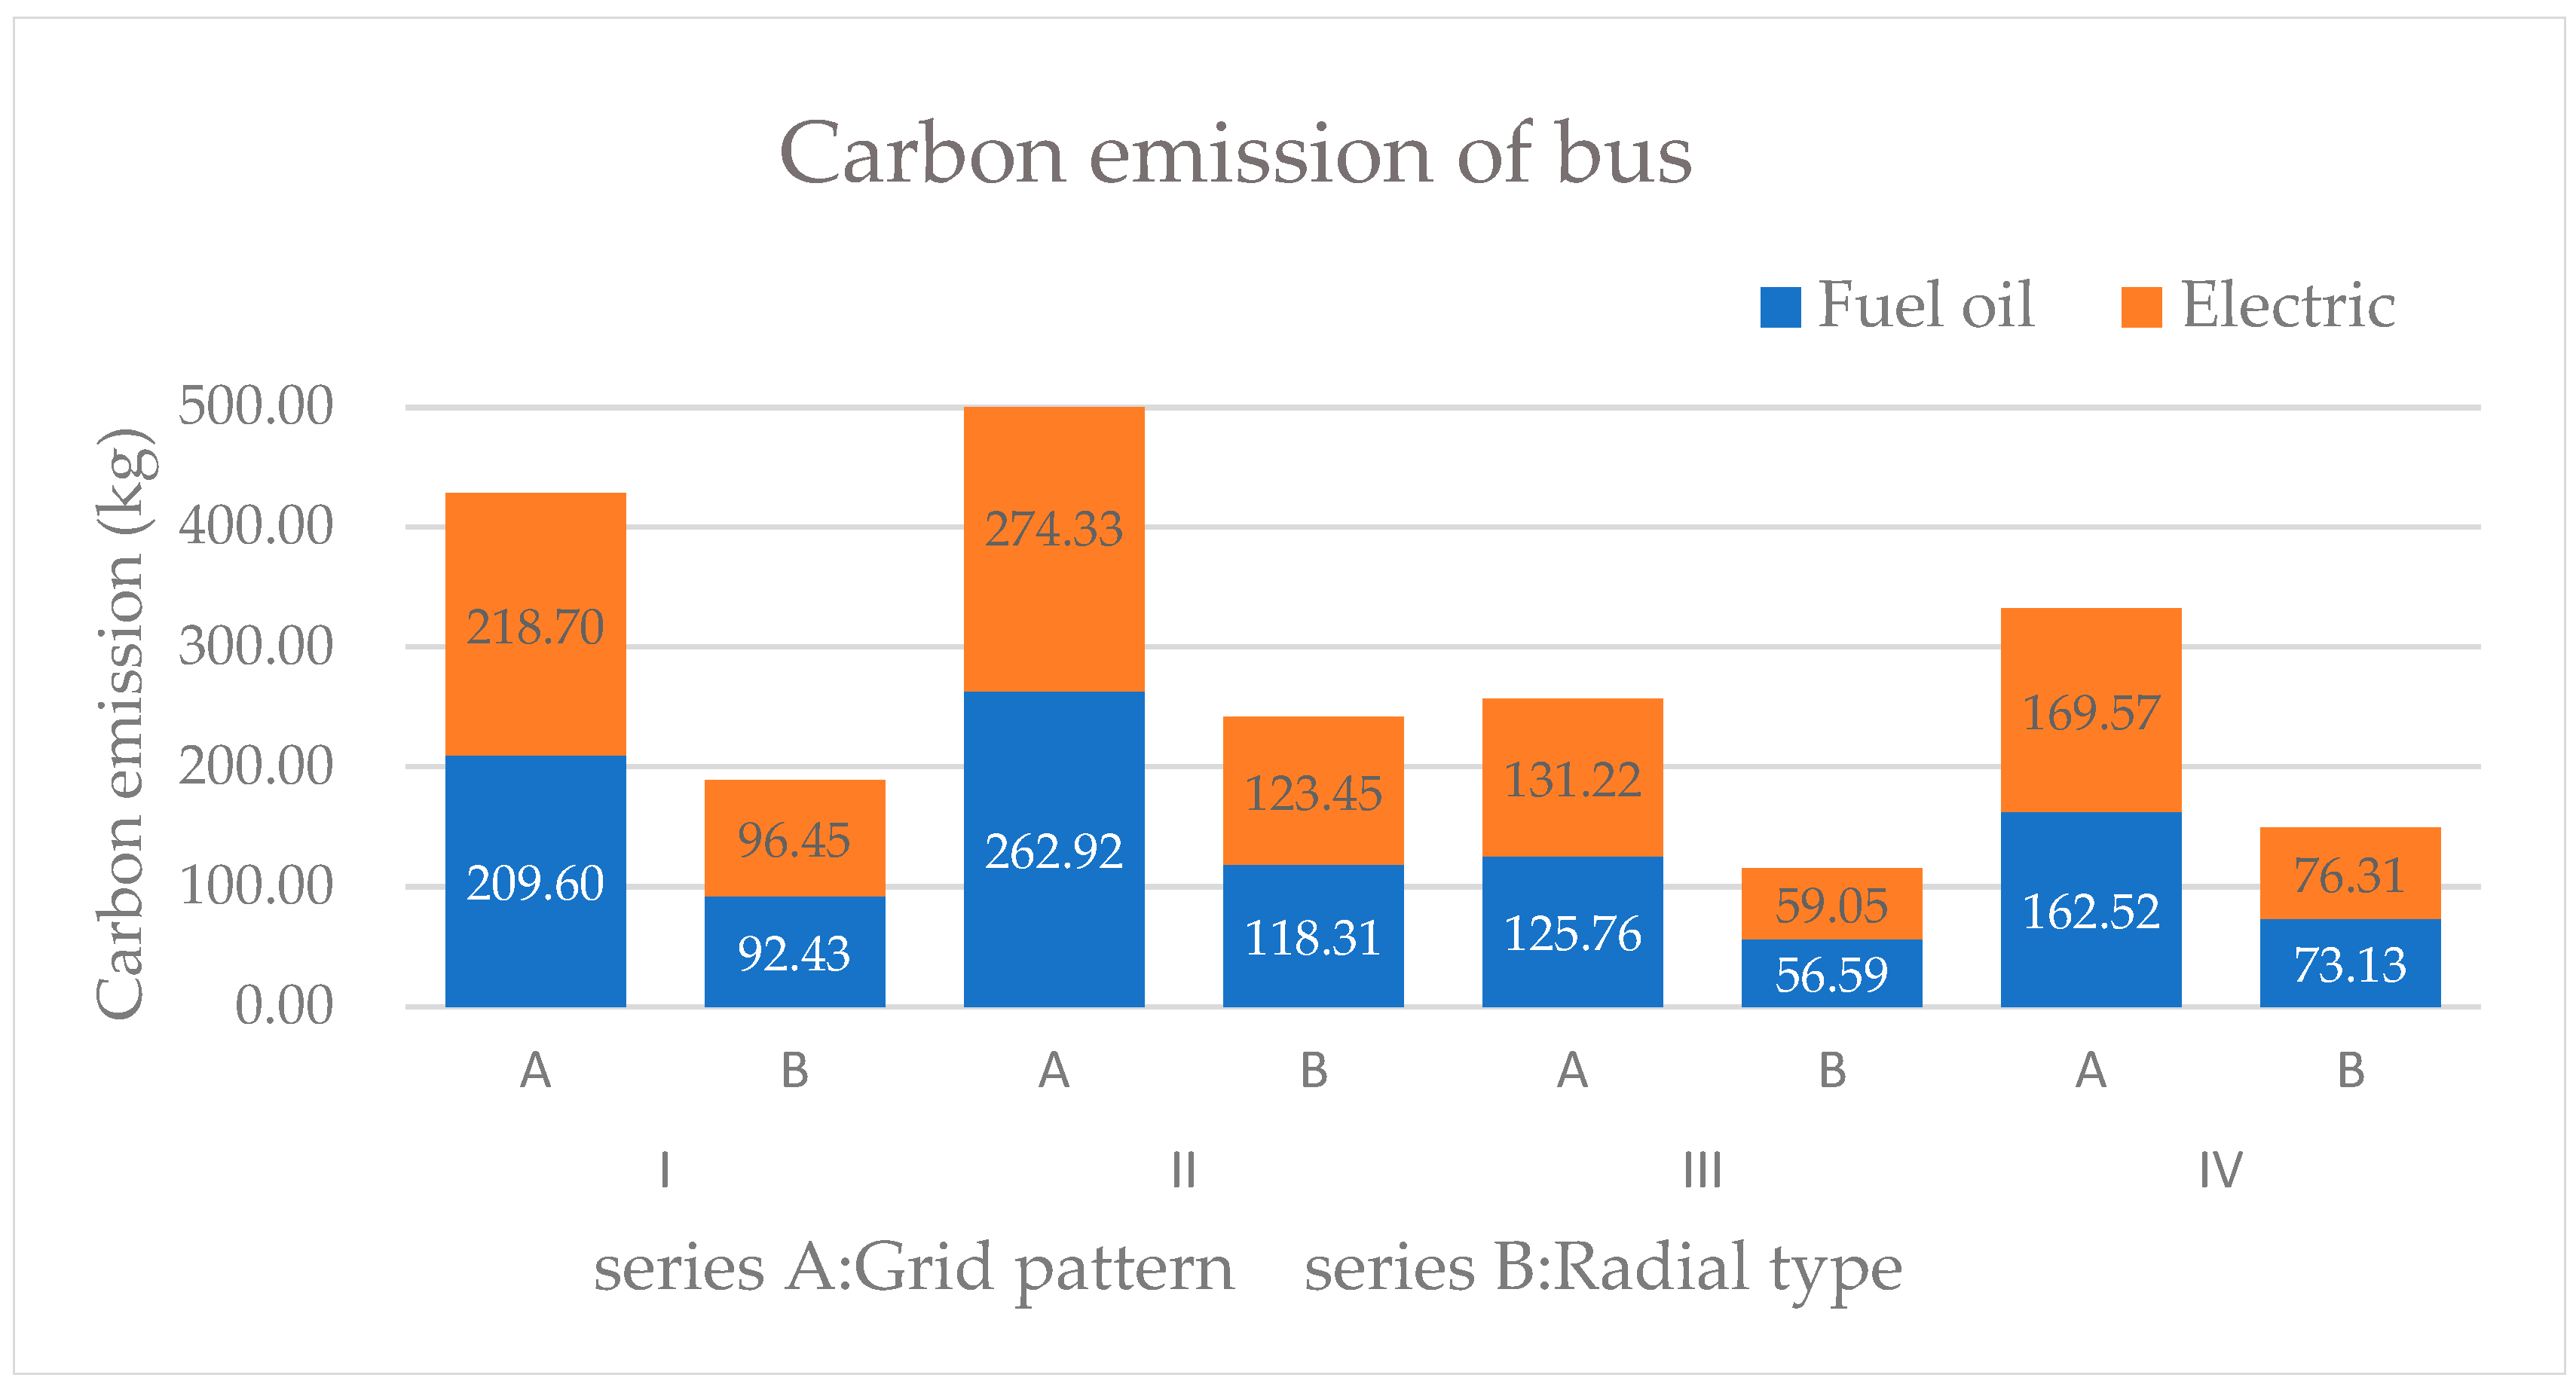
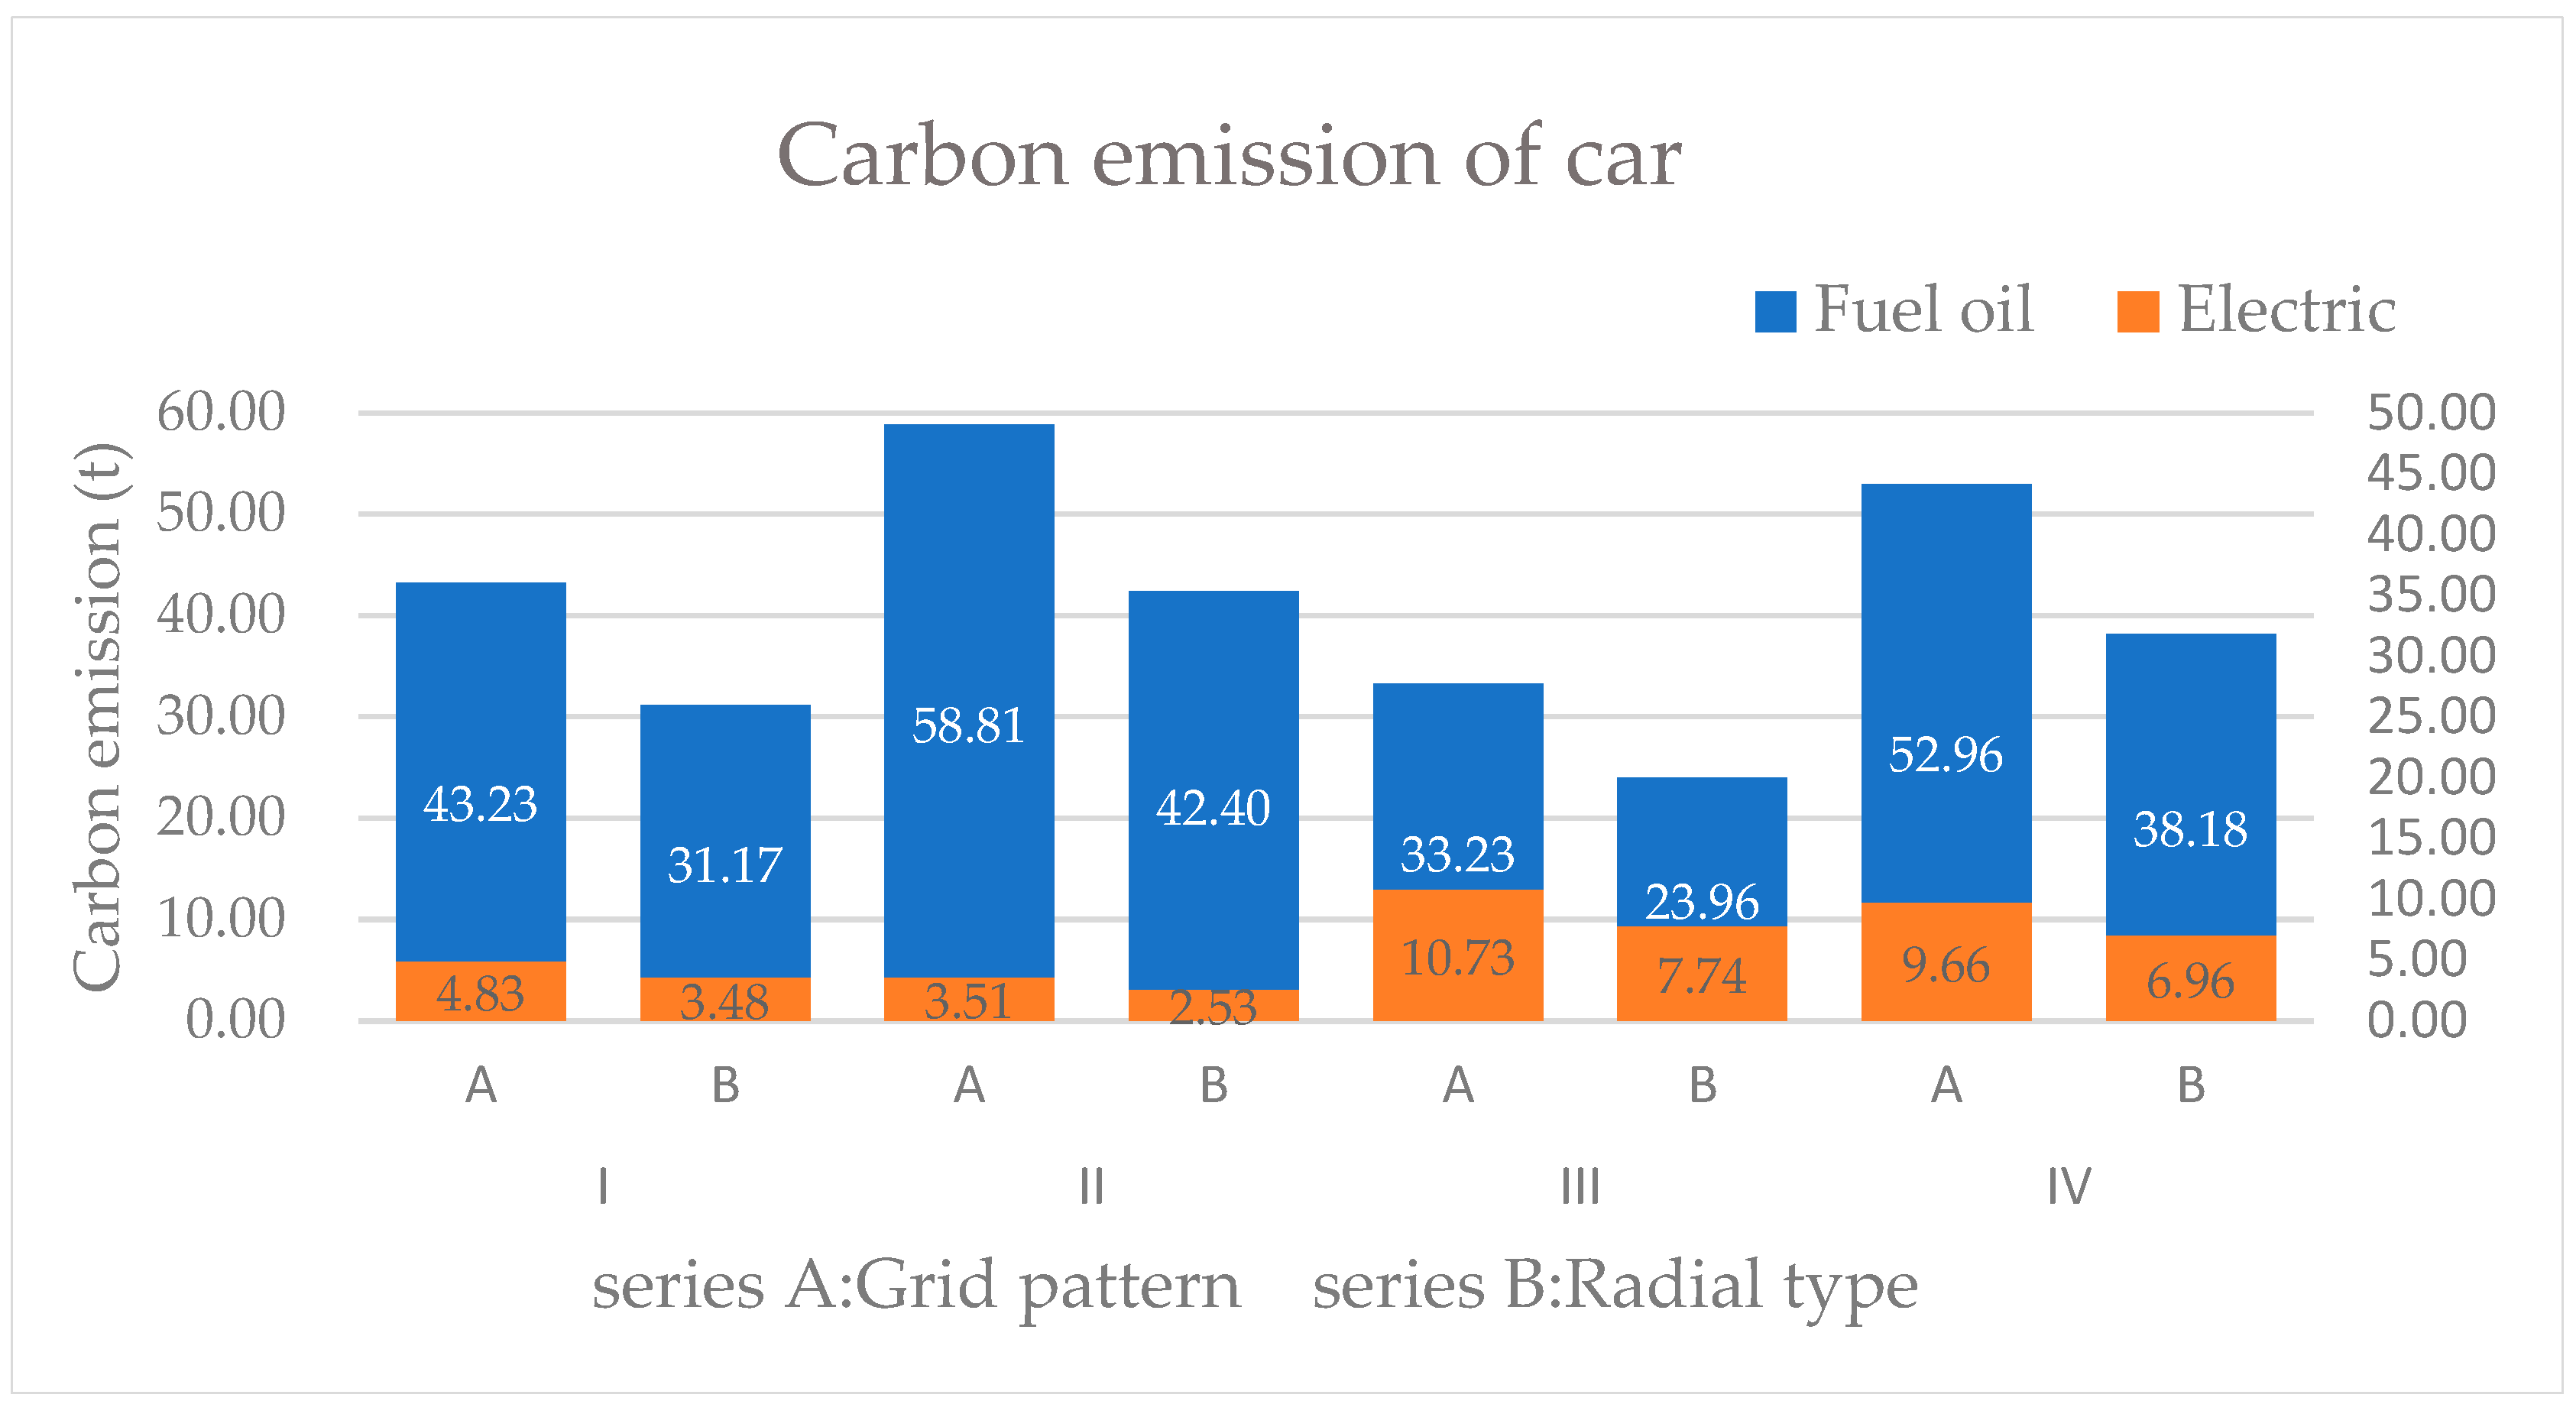
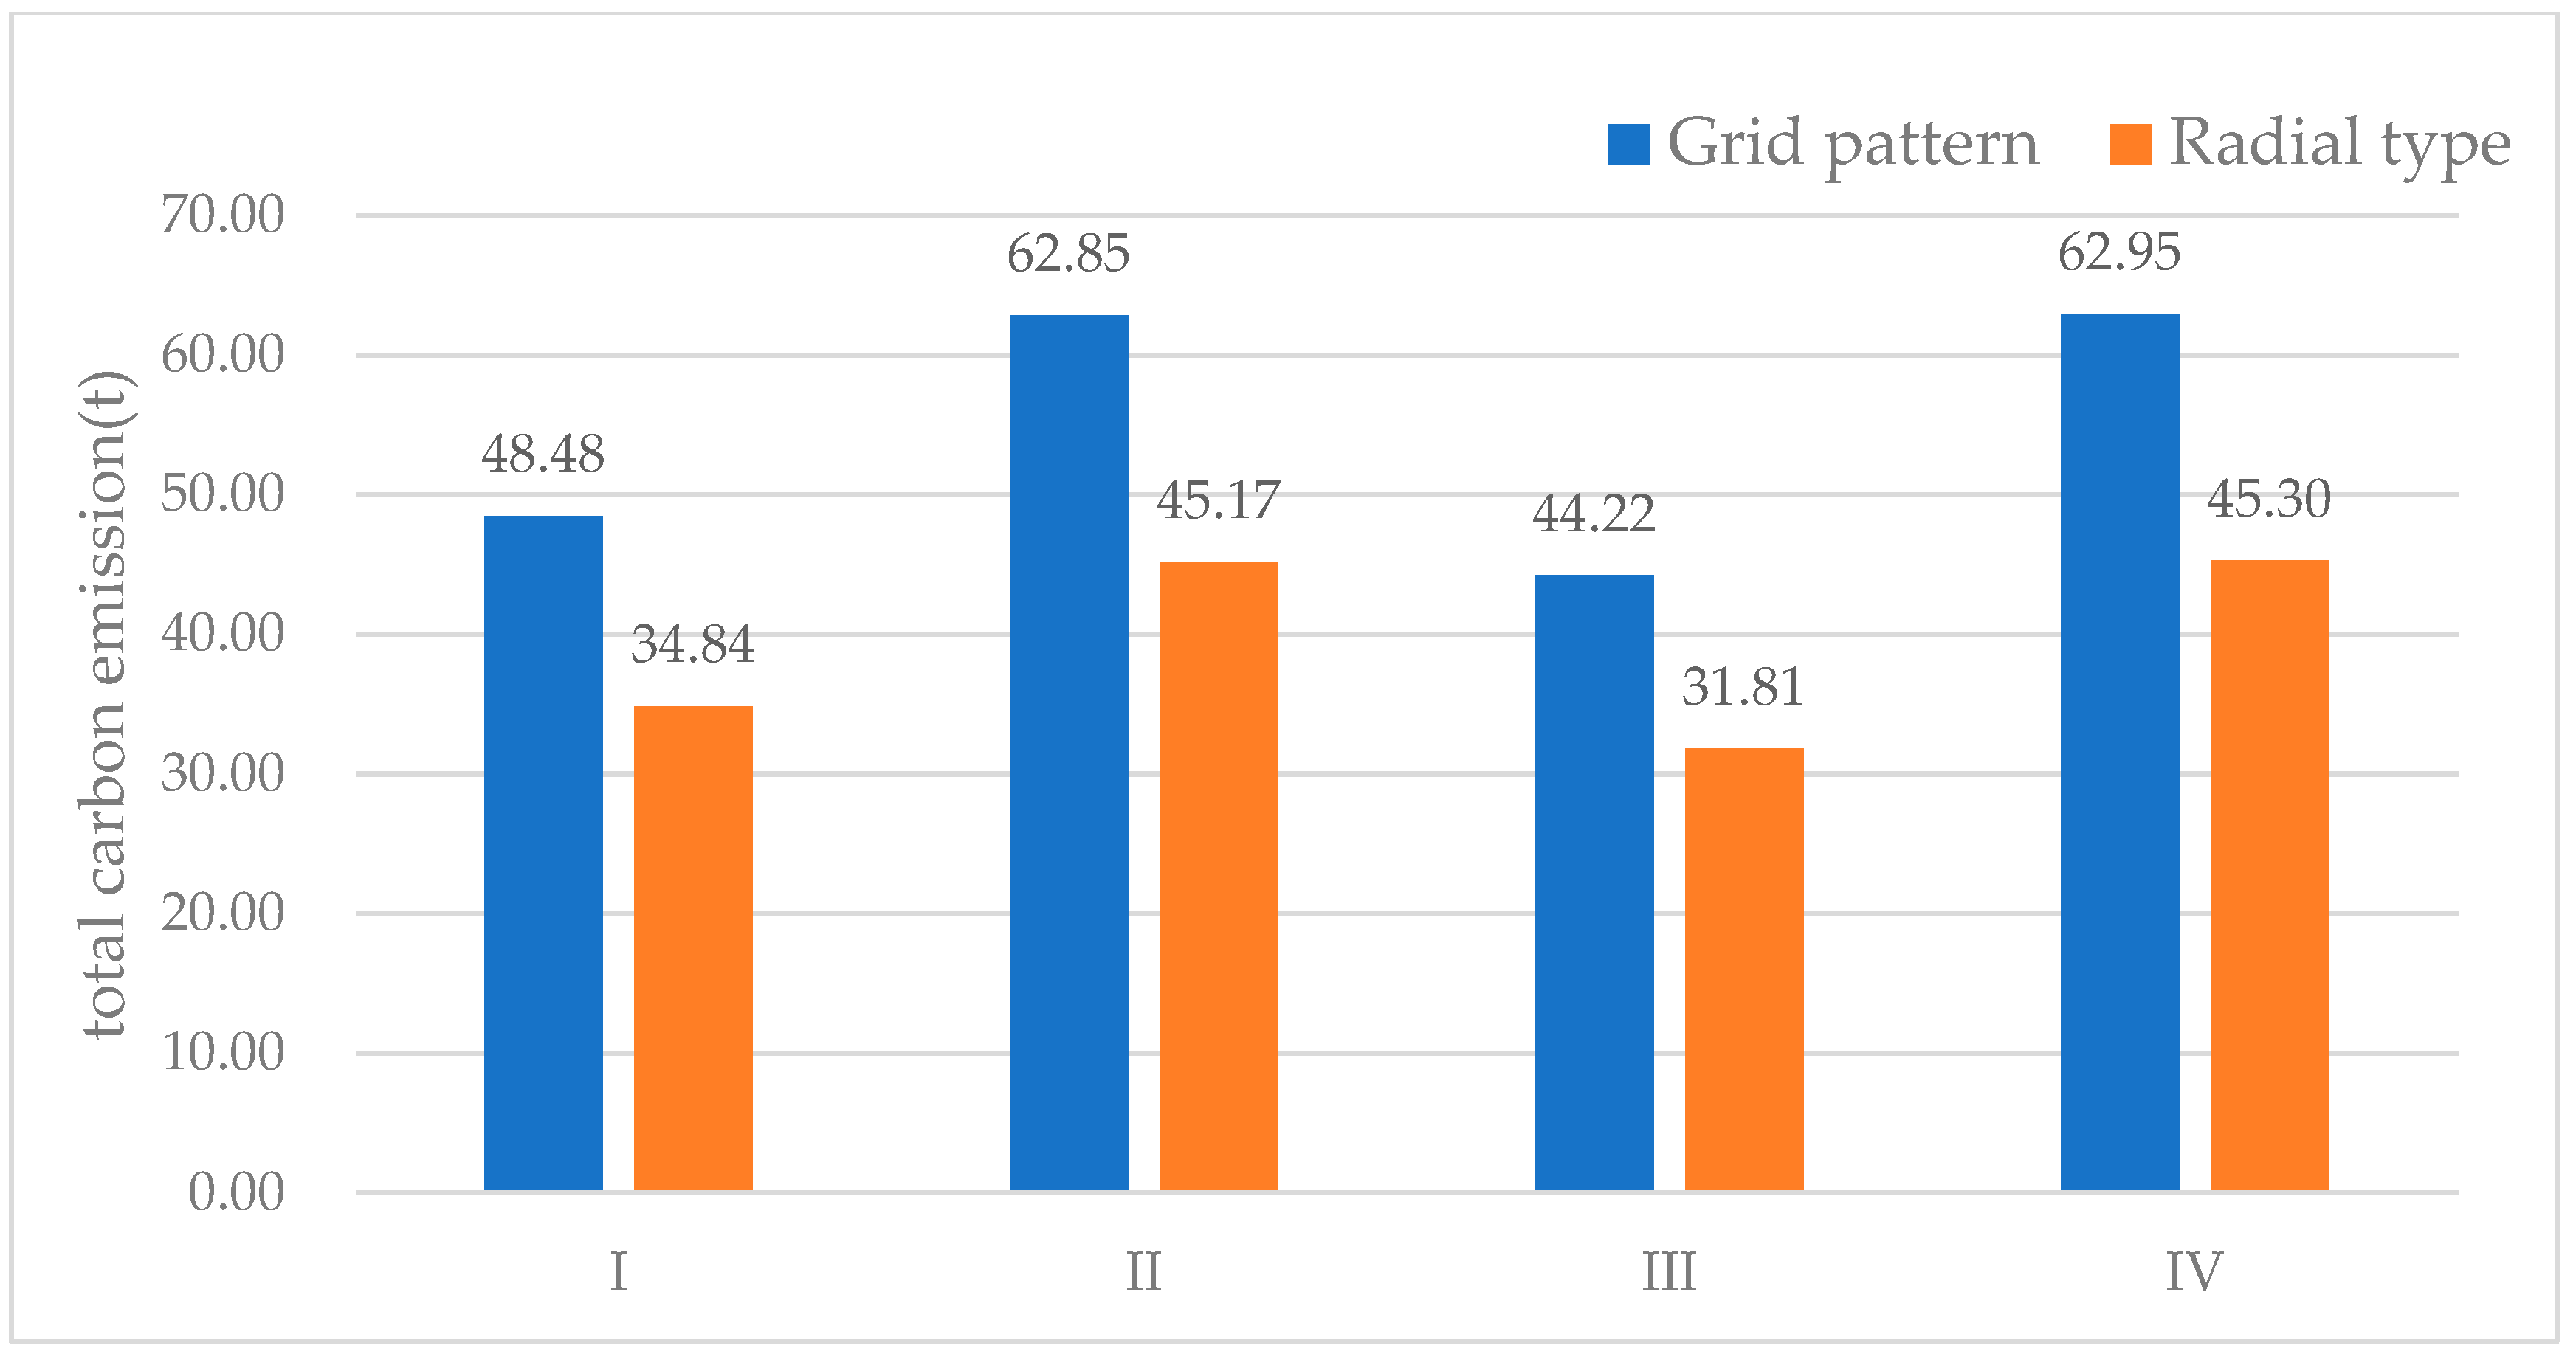
From the point of view of plane layout, the radial type (Type B) produces relatively fewer carbon emissions than the grid pattern (Type A). The reason is that the accessibility of the grid pattern is relatively poor, the traffic organization at the intersection is easy, and the nearby land is mostly residential land, with more slow traffic. The radial type facilitates bus trunk wiring and organization, shortening the distance to the city center.
(2)
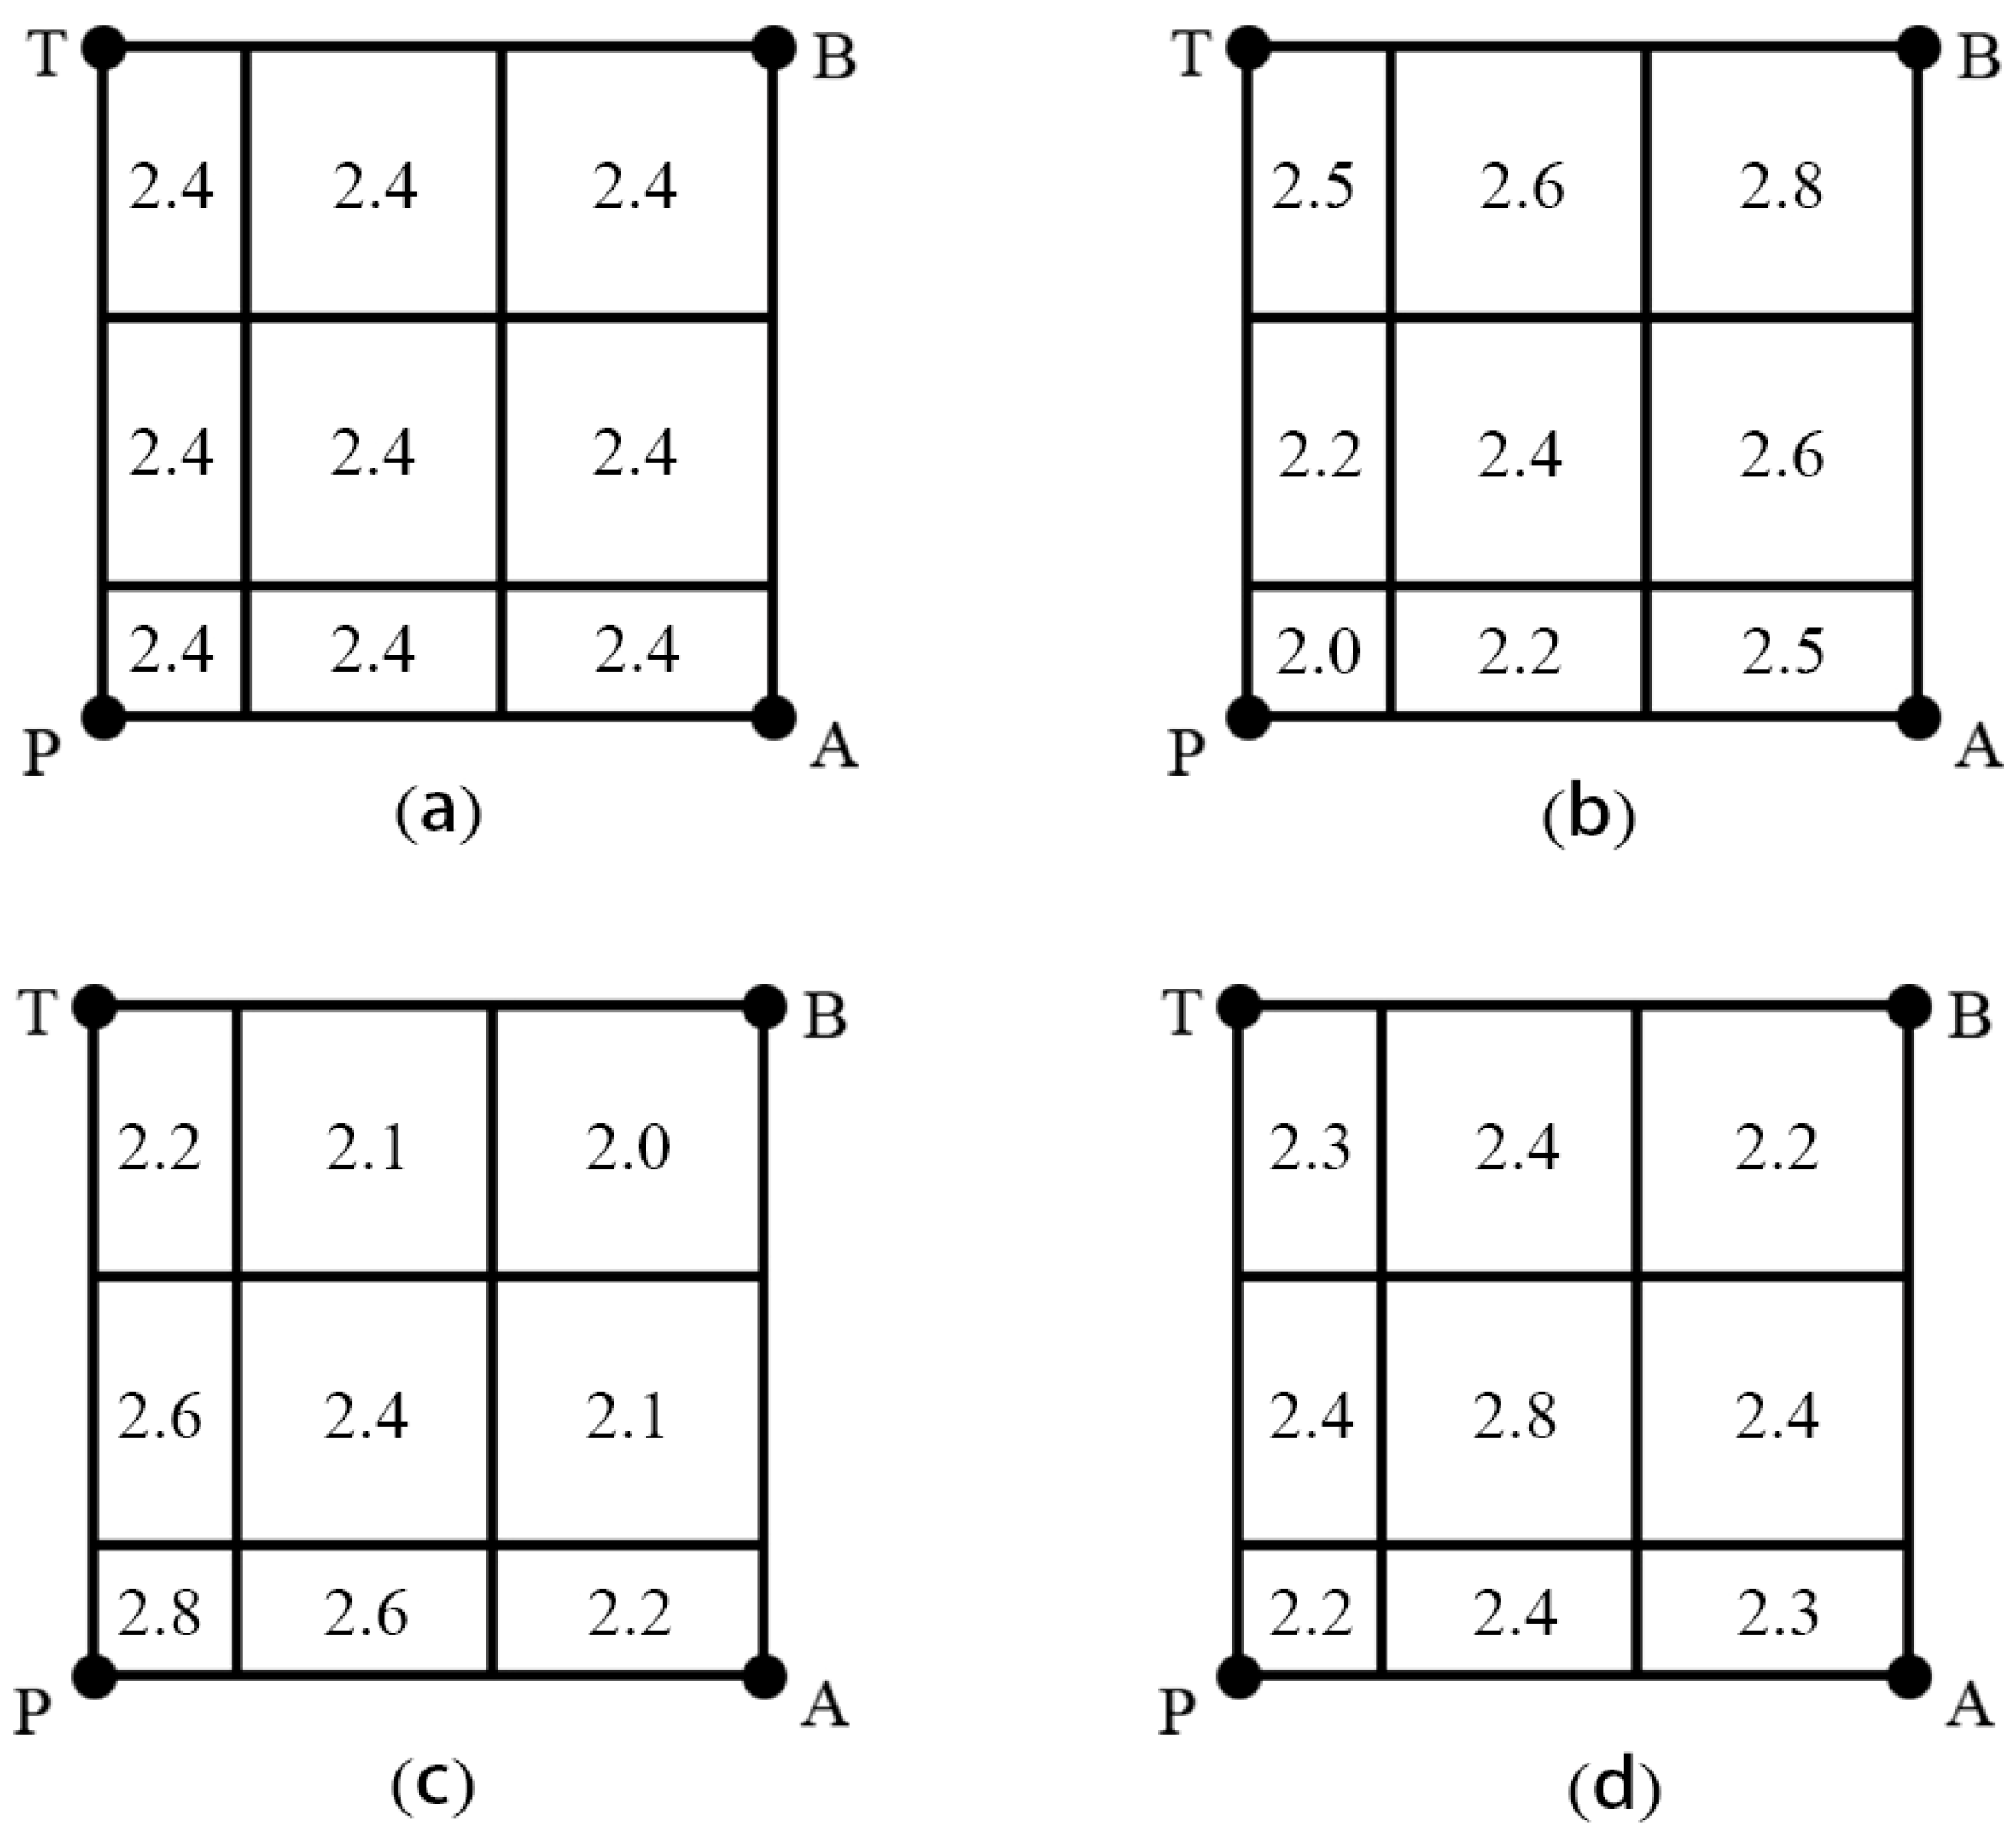
From the perspective of vertical layout, the near-high far-low type (Type III) has the lowest carbon emissions, while the near-low far-high type (Type II) has the highest carbon emissions. It shows that the land development pattern around the station plays a direct role in the carbon emission of rail transit connections.
(3)
From the perspective of connection mode, the total carbon emissions generated by automobiles are much higher than those generated by buses. The construction of TOD cities will make the urban bus system more perfect and convenient. Under the condition that the development intensity around the site is getting higher and higher, this can not only facilitate the connection and travel of residents, but also effectively reduce the use of cars and reduce the carbon emissions of transportation.
The above research results also provide a certain policy significance for the government to connect rail transit stations under the goal of carbon dioxide emission reduction and carbon neutrality in China. Specific policy recommendations are as follows:
(1) Suggestions on urban space planning and construction.
In the process of planning construction or reconstruction, a radial layout can be designed to increase the accessibility of the road network. The distribution of residential areas should be near-high and far-low to reduce the time of connection and distribution. On the premise of not conflicting with urban cultural construction, green landscape, political and economic requirements, the distribution mode of the TOD mode is adopted to make full use of the intensive characteristics of rail transit stations.
(2) Suggestions on land-use planning.
Land-use distribution has a profound impact on transportation carbon emissions. In the future, urban construction can develop compact cities, increase the diversity of land use, highlight the degree of mixed land development, improve the construction of various infrastructures, facilitate the daily life of residents, but also reduce the traffic demand; a variety in facilities constructed also promotes the development of social economy and culture.
(3) Suggestions on TOD urban development and slow-traffic construction.
In order to improve residents’ willingness to travel slowly, the first step is to ensure the environment for slow traffic. Special roads, greening, shops along the road and so on are the factors that attract residents to walk slowly. Therefore, in the future urban construction, more consideration should be given to the construction of slow travel facilities, combined with the TOD land-use model and urban layout, to improve residents’ willingness to walk, reduce travel with high carbon emissions, and form a green and environmentally friendly living atmosphere.
This study also has some limitations. The first is the standardization of layout classification. In actual situations, the urban layout is affected by many factors, so it will not be as neat as the example, but the overall trend should be similar. The standardized layout classification can hardly represent the actual layout of the city. Secondly, in the process of example simulation, in order to exclude the influence of other factors, only different connection modes and different plane and elevation layout classification are considered. Residents’ travel behavior is a very complex behavior mode, and it is difficult to summarize the law of eigenvalue. Finally, due to the limitations of the data, the model calculates the gathering and distributing time with the floor-area ratio and the shortest circuit within the building area, without taking into account the road conditions. The gathering and distributing times are also based on the fact that all residents make one round trip to the station as a reference, which may lead to some deviation between the calculated results and the reality. These limitations should be further addressed in future studies.

Author Contributions

Methodology, W.L. and J.D.; data curation, J.Z. and L.J.; writing—original draft preparation, O.A. and A.T.; writing—review and editing, Q.W. and Y.H. All authors have read and agreed to the published version of the manuscript.

Funding

This study was sponsored by the National Natural Science Foundation of China (Grant No: 52002244) and the Researchers Supporting Project Number (RSP2023R102), King Saud University, Riyadh, Saudi Arabia.

Institutional Review Board Statement

The paper belongs to the investigation of urban traffic and does not involve human or animal studies.

Informed Consent Statement

Informed consent was obtained from all subjects involved in the study.

Data Availability Statement

Not applicable.

Conflicts of Interest

The authors declare no conflict of interest.

References

  1. Van Fan, Y.; Perry, S.; Klemeš, J.J.; Lee, C.T. A review on air emissions assessment. Transportation 2018, 194, 673–684. [Google Scholar]
  2. International Energy Agency. 2019. Available online: https://www.iea.org/news/railways-could-provide-much-greater-benefits-for-energy-and-the-environment-according-to-iea-report. (accessed on 30 January 2019).
  3. Dorta Antequera, P.; Díaz Pacheco, J.; López Díez, A.; Bethencourt Herrera, C. Tourism, Transport and Climate Change: The Carbon Footprint of International Air Traffic on Islands. Sustainability 2021, 13, 1795. [Google Scholar] [CrossRef]
  4. Bouman, E.A.; Lindstad, E.; Rialland, A.I.; Stromman, A.H. State-of-the-art technologies, measures, and potential for reducing GHG emissions from shipping—A review. Transp. Res. Part D-Transp. Environ. 2017, 52, 408–421. [Google Scholar] [CrossRef]
  5. Wu, T.; Yan, J.W. Analysis on the influence of rail transit station Accessibility on travel choice. Archit. Cult. 2015, 10, 146–147. [Google Scholar]
  6. Zhang, N.Y.; Zhang, S.; Gao, Z.; Lu, G.; Li, J.; Jin, T.S. The influence of urban building layout on the diffusion characteristics of traffic pollutants in blocks. Environ. Sci. Technol. 2019, 12, 105–111+122. [Google Scholar]
  7. Rong, C. A Preliminary study on the development of Land Intensive Use around Chengdu Rail Transit TOD Station: A case study of the tracking evaluation of Luxiao Station. Mod. Urban Rail Transit 2021, 5, 7–12. [Google Scholar]
  8. Zhao, C.Q.; Ma, C.G.; Yu, Z.L.; Zhang, H.T. Research on the comprehensive development mode of land around rail transit station based on the concept of green Development: A case study of Zhichuang Eco-City in Guangyang Bay, Chongqing. Urban Archit. Space 2022, 6, 74–78. [Google Scholar]
  9. Wang, J.; Han, H.; Li, H.; He, S.M. Pradip Kumar Sharma, Lydia Chen, Multiple Strategies Differential Privacy on Sparse Tensor Factorization for Network Traffic Analysis in 5G. IEEE Trans. Ind. Inform. 2022, 18, 1939–1948. [Google Scholar] [CrossRef]
  10. Hu, Y.D.; Tao, S. The Evolution, Classification and Enlightenment of TOD Models in the U.S. Urban Transp. China 2018, 16, 34–42. [Google Scholar]
  11. Asriana, N.; Koerniawan, M.D. TOD Model through Low Carbon City Concept in Urban Design (case study: Palembang, Indonesia). IOP Conf. Ser. Earth Environ. Sci. 2020, 532, 012017. [Google Scholar] [CrossRef]
  12. Yi, D.; Luo, X.; Liang, D. An empirical study on transit-oriented low-carbon urban land use planning. Exploratory Spatial Data Analysis (ESDA) on Shanghai, China. Habitat Int. 2016, 53, 379–389. [Google Scholar]
  13. Xu, C.; Haase, D.; Su, M.; Yang, Z. The impact of urban compactness on energy-related greenhouse gas emissions across EU member states: Population density vs. physical compactness. Appl. Energy 2019, 254, 113671. [Google Scholar] [CrossRef]
  14. Loo, B.P.; du Verle, F. Transit-oriented development in future cities: Towards a two-level sustainable mobility strategy. Int. J. Urban Sci. 2017, 21, 54–67. [Google Scholar] [CrossRef]
  15. Holz-Rau, C.; Scheiner, J. Land-use and transport planning—A field of complex cause-impact relationships. Thoughts on transport growth, greenhouse gas emissions and the built environment. Transp. Policy 2019, 74, 127–137. [Google Scholar] [CrossRef]
  16. Makido, Y.; Dhakal, S.; Yamagata, Y. Relationship between urban form and CO2 emissions: Evidence from fifty Japanese cities. Urban Clim. 2012, 2, 55–67. [Google Scholar] [CrossRef] [Green Version]
  17. Wang, X.Q.; Shao, C.F.; Yin, C.Y.; Dong, C.J. Exploring the effects of the built environment on commuting mode choice in neighborhoods near public transit stations: Evidence from China. Transp. Plan. Technol. 2021, 44, 111–127. [Google Scholar] [CrossRef]
  18. Ye, Y.Y.; Zhang, H.O.; Xu, X.Q.; Wu, Q.T. Urban spatial structure for low-carbon transportation: Theory, model and case. Urban Plan. Forum. 2012, 5, 37–43. [Google Scholar]
  19. Zhang, C.; Jia, F.J. Urban Transportation carbon emission characteristics and energy-saving emission reduction strategies based on resident travel. Traffic Transp. 2020, 36, 76–79. [Google Scholar]
  20. Li, Y.M.; Shen, Y.S.; Wang, S.H. Spatial and temporal characteristics and effects of terrestrial carbon emissions based on land use change in Anhui Province. J. Soil Water Conserv. 2022, 36, 182–188. [Google Scholar] [CrossRef]
  21. Zhang, J.Y.; Zhong, S.Q.; Wang, T. Blockchain-Based Systems and Applications: A Survey. J. Internet Technol. 2020, 21, 1–14. [Google Scholar]
  22. Wang, J.; Yang, Y.Q.; Wang, Y.; Sherratt, S.; Zhang, J.Y. Big Data Service Architecture: A Survey. J. Internet Technol. 2020, 21, 393–405. [Google Scholar]
  23. Rong, P.J.; Zhang, L.J.; Liu, L.Z. Study on spatial differentiation of daily travel carbon emissions of urban households in Kaifeng. Resour. Sci. 2018, 40, 1307–1318. [Google Scholar]
  24. Wang, H.H.; Zeng, W.H. Revealing Urban Carbon Dioxide (CO2) Emission Characteristics and Influencing Mechanisms from the Perspective of Commuting. Int. J. Syst. Sci. 2019, 11, 385. [Google Scholar] [CrossRef] [Green Version]
  25. Shen, X.P. Calculation Theory and Application of Carbon Emission Reduction in Urban Rail Transit: A Case Study of Beijing. Ph.D. Thesis, Beijing Jiaotong University, Beijing, China, 2018. [Google Scholar]
  26. Zhao, R.Q.; Fan, Y.; Zhang, Z.J. Impact of urban subway on carbon emission of commuter traffic of residents along the line—A case study of Zhengzhou City. Areal Res. Dev. 2021, 40, 151–155. [Google Scholar]
  27. Suresh, J.; Vaishnavi, B. Health impact assessment of auto rickshaw and cab drivers due to exposure to vehicular pollution in Delhi: An integrated approach. Environ. Sci. Pollut. Res. Int. 2021, 29, 5124–5133. [Google Scholar]
  28. Hafezi, M.H. Modelling transport-related pollution emissions for the synthetic baseline population of a large Canadian university. Int. J. Urban Sci. 2019, 23, 519–533. [Google Scholar] [CrossRef]
  29. Tan, X.C.; Tu, T.Q.; Gu, B.H. Assessing CO2 Emissions from Passenger Transport with the Mixed-Use Development Model in Shenzhen International Low-Carbon City. Land 2021, 10, 137. [Google Scholar] [CrossRef]
  30. Wang, H.H.; Yu, H.Q.; Zeng, W.H. Research on the potential of traffic carbon emission reduction in Beijing based on the adjustment of separation of work and residence. China Popul. Resour. Environ. 2018, 28, 41–51. [Google Scholar]
  31. Sun, Y. Relationship between Urban Form and Carbon Emissions: A Cross-Sectional Empirical Study of 282 Prefecture-Level Cities in China. Master’s Thesis, Zhejiang University, Zhejiang, China, 2021. [Google Scholar]
  32. Man, Z.; Zhao, R.Q.; Yuan, Y.C. Influence of land mixing degree around urban residential areas on carbon emission from commuter traffic—A case study of typical residential areas in Jiangning District, Nanjing. Hum. Geogr. 2018, 33, 70–75. [Google Scholar]
  33. Dai, L.D.; Zhou, R.; Zhang, F.E. Study on the impact of urban land use on residents' commuting carbon emission. Resour. Environ. Yangtze Basin 2016, 25, 68–77. [Google Scholar]
  34. Song, L.L.; Monteil, J.; Ygnace, J.-L.; Rey, D. Incentives for Ridesharing: A Case Study of Welfare and Traffic Congestion. J. Adv. Transp. 2021, 2021, 6627660. [Google Scholar] [CrossRef]
  35. Jiang, Y.; He, D.Q. ZEGRAS Christopher. Study on the impact of urban block shape on residential travel energy consumption. Urban Commun. Commun. 2011, 9, 21–29+75. [Google Scholar] [CrossRef]
  36. Man, C.; Zhao, R.Q.; Yuan, Q.C.; Feng, D.X.; Yang, Q.L.; Wang, S.; Yang, W.J. Effects of land mixing degree on commuting traffic carbon emission: A case study of Jiangning District, Nanjing. Humanit. Sci. 2018, 1, 70–75. [Google Scholar] [CrossRef]
  37. Xie, Y.; Chen, X.J.; Zhang, J. Study on the Optimal plot ratio of urban Residential Land from the perspective of energy conservation. In China Society of Urban Planning, Dongguan Municipal People's Government. Rational Planning for Sustainable Development, Proceedings of the 2017 China Urban Planning Annual Conference; Urban Planning Society of China, Ed.; China Building and Construction Press: Beijing, China, 2017; pp. 26–36. [Google Scholar]
Figure 1. Research framework.
Sustainability 15 09589 g001
Figure 2. The composition of the connecting transport mode. (a) Convergence stage; (b) diverting stage.
Sustainability 15 09589 g002
Figure 3. Average time consumption of urban rail transit in Shanghai.
Sustainability 15 09589 g003
Figure 4. Two grid patterns. (a) Grid pattern (Type A); (b) radial type (Type B).
Sustainability 15 09589 g004
Figure 5. The eight architectural patterns. (a) Grid pattern of equal-height type; (b) grid pattern of near-low far-high type; (c) grid pattern of near-high far-low type; (d) grid pattern of parabola type; (e) radial type of equal-height distribution; (f) radial type of near-low far-high distribution; (g) radial type of near-high far-low distribution; (h) radial type of parabola distribution.
Sustainability 15 09589 g005
Figure 6. Distribution path diagrams. (a) Grid pattern (Type A); (b) radial type (Type B).
Sustainability 15 09589 g006
Figure 7. The specific volume ratio distribution. (a) Distribution of plot volume ratio (Type I); (b) distribution of plot volume ratio (Type II); (c) distribution of plot volume ratio (Type III); (d) distribution of plot volume ratio (Type IV).
Sustainability 15 09589 g007
Figure 8. Carbon emissions of buses under different building distributions (kg).
Sustainability 15 09589 g008
Figure 9. Total carbon emissions of residents under different building distributions (t).
Sustainability 15 09589 g009
Figure 10. Carbon Emissions of different connection modes under different building distribution types (t).
Sustainability 15 09589 g010
Figure 11. Total carbon emissions connected by residents under different building distributions (t).
Sustainability 15 09589 g011
Table 1. Model parameter selection.
Parametera (km)b (km)c (m)l (m)u (m2/person)v (km/h)
Value22251203040
Table 2. Influencing factors of distribution time.
Type IType IIType IIIType IV
11.40.60.9
Table 3. Share of residents’ connection modes under different vertical layouts.
Type IType IIType IIIType IV
Walk47%22%75%50%
Bicycle33%53%18%37%
Bus14%16%5%8%
Car6%9%2%5%
Table 4. Share of vehicle structure under different vertical layouts.
Vehicle StructureType IType IIType IIIType IV
BusFuel oil35%35%35%35%
Electric65%65%65%65%
CarFuel oil86%92%68%79%
Electric14%8%32%21%
Table 5. Calculation parameters of different traffic connection modes.
Traffic ModeFuel TypeLayout
Format
Unit Energy
Consumption
Carbon Emission CoefficientOil Conversion CoefficientSpeedShare
Ratio
Carrying Coefficient
BusFuel oil Q b ( L / km ) C b ( t C O 2 / tce ) B b ( tce / L ) V b ( km / h ) P b ( % ) Z b
Grid pattern0.42.135831.15 × 10−3201215
Radial type9
Electric W
(KWh/km)
C Q ( Kg C O 2 KWh ) / V b ( km / h ) P b ( % ) Z b
Grid pattern0.60.92/201215
Radial type9
CarFuel oil Q c ( L / km ) C c ( t C O 2 / tce ) B c ( tce / L ) V c ( km / h ) P c ( % ) Z c
Grid pattern0.0882.135831.07 × 10−3404.51.2
Radial type3.7
Electric W
(KWh/km)
C Q ( Kg C O 2 KWh ) / V c ( km / h ) P c ( % ) Z c
Grid pattern0.150.92/404.51.2
Radial type3.7
Table 6. Total carbon emissions from residential connections under different building distributions (t).
Carbon Emissions of Buses (t)Carbon Emission Category
Land Use Mode
GridpatternRadial Type
AIAIIAIIIAIVBIBIIBIIIBIV
Fuel oil0.210.260.130.160.090.120.060.07
Electric0.220.270.130.170.100.120.060.08
Total0.430.540.260.330.190.240.120.15
Carbon Emissions of Cars (t)Carbon Emission Category
Land Use Mode
GridpatternRadial Type
AIAIIAIIIAIVBIBIIBIIIBIV
Fuel oil43.2358.8133.2352.9631.1742.4023.9638.18
Electric4.833.5110.739.663.482.537.746.96
Total48.0662.3243.9662.6234.6544.9331.6945.15
Disclaimer/Publisher’s Note: The statements, opinions and data contained in all publications are solely those of the individual author(s) and contributor(s) and not of MDPI and/or the editor(s). MDPI and/or the editor(s) disclaim responsibility for any injury to people or property resulting from any ideas, methods, instructions or products referred to in the content.

