
Identifying Key Indicators for Monitoring Water Environmental Services Payment Programs—A Case Study in Brazil

 and
and 
Abstract
:1. Introduction
2. Materials and Methods
2.1. Water Quality
2.2. Soil Quality
2.3. Vegetation Cover Quality
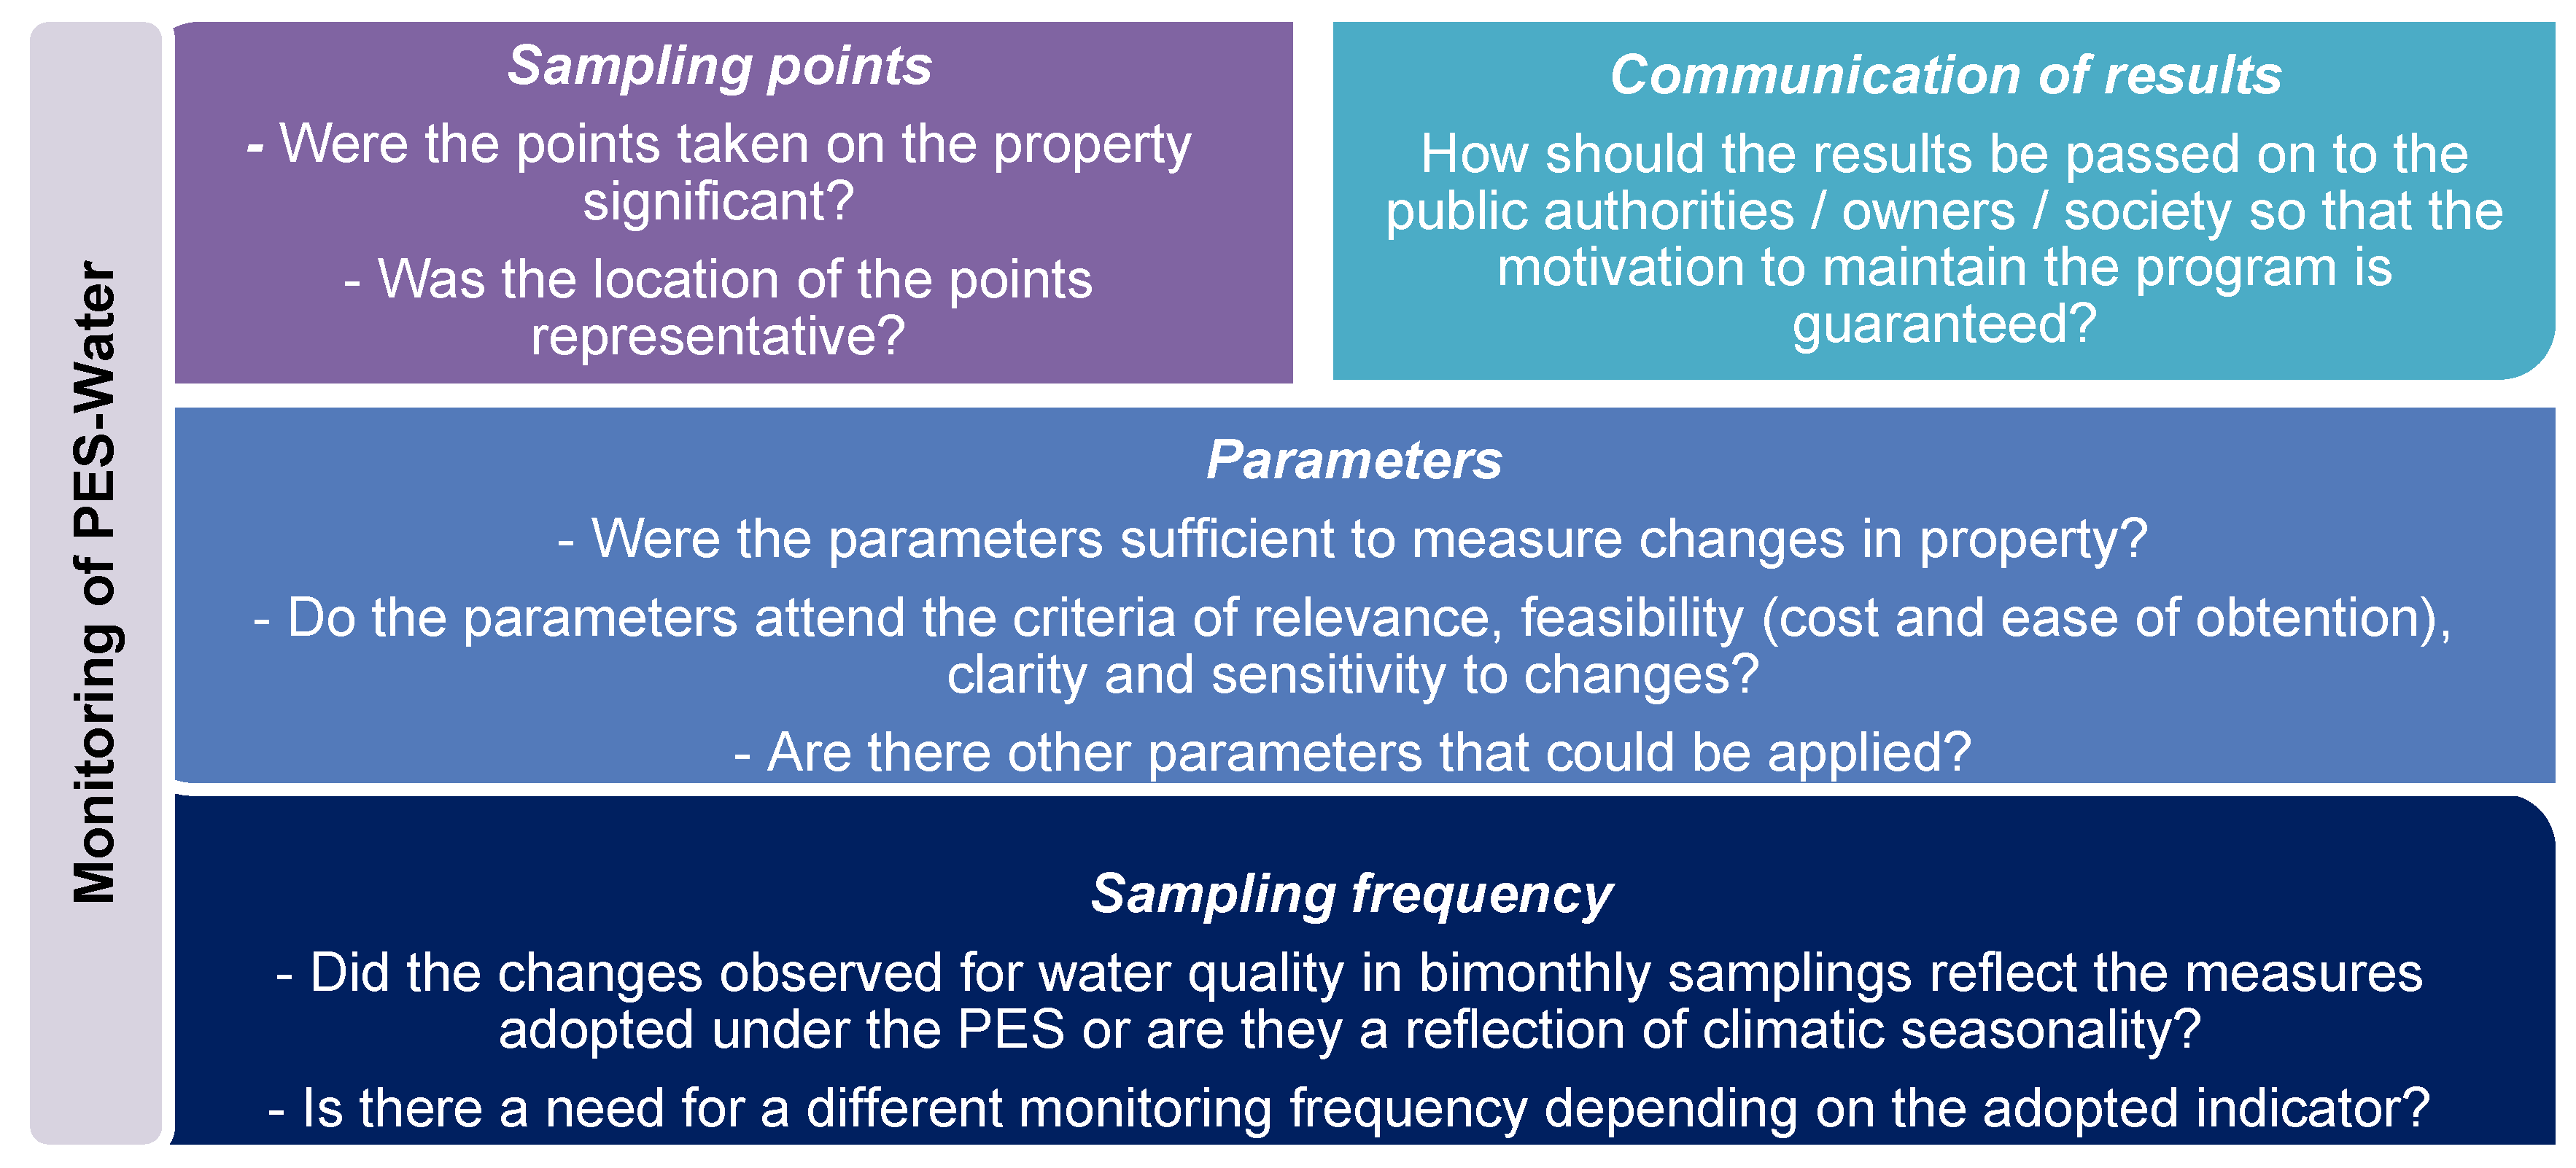
2.4. PES-Water Monitoring Plan
3. Results
3.1. Spatial–Temporal Variation of Water Quality Indicators
3.2. Spatial Variation of Soil Properties and Vegetation Cover
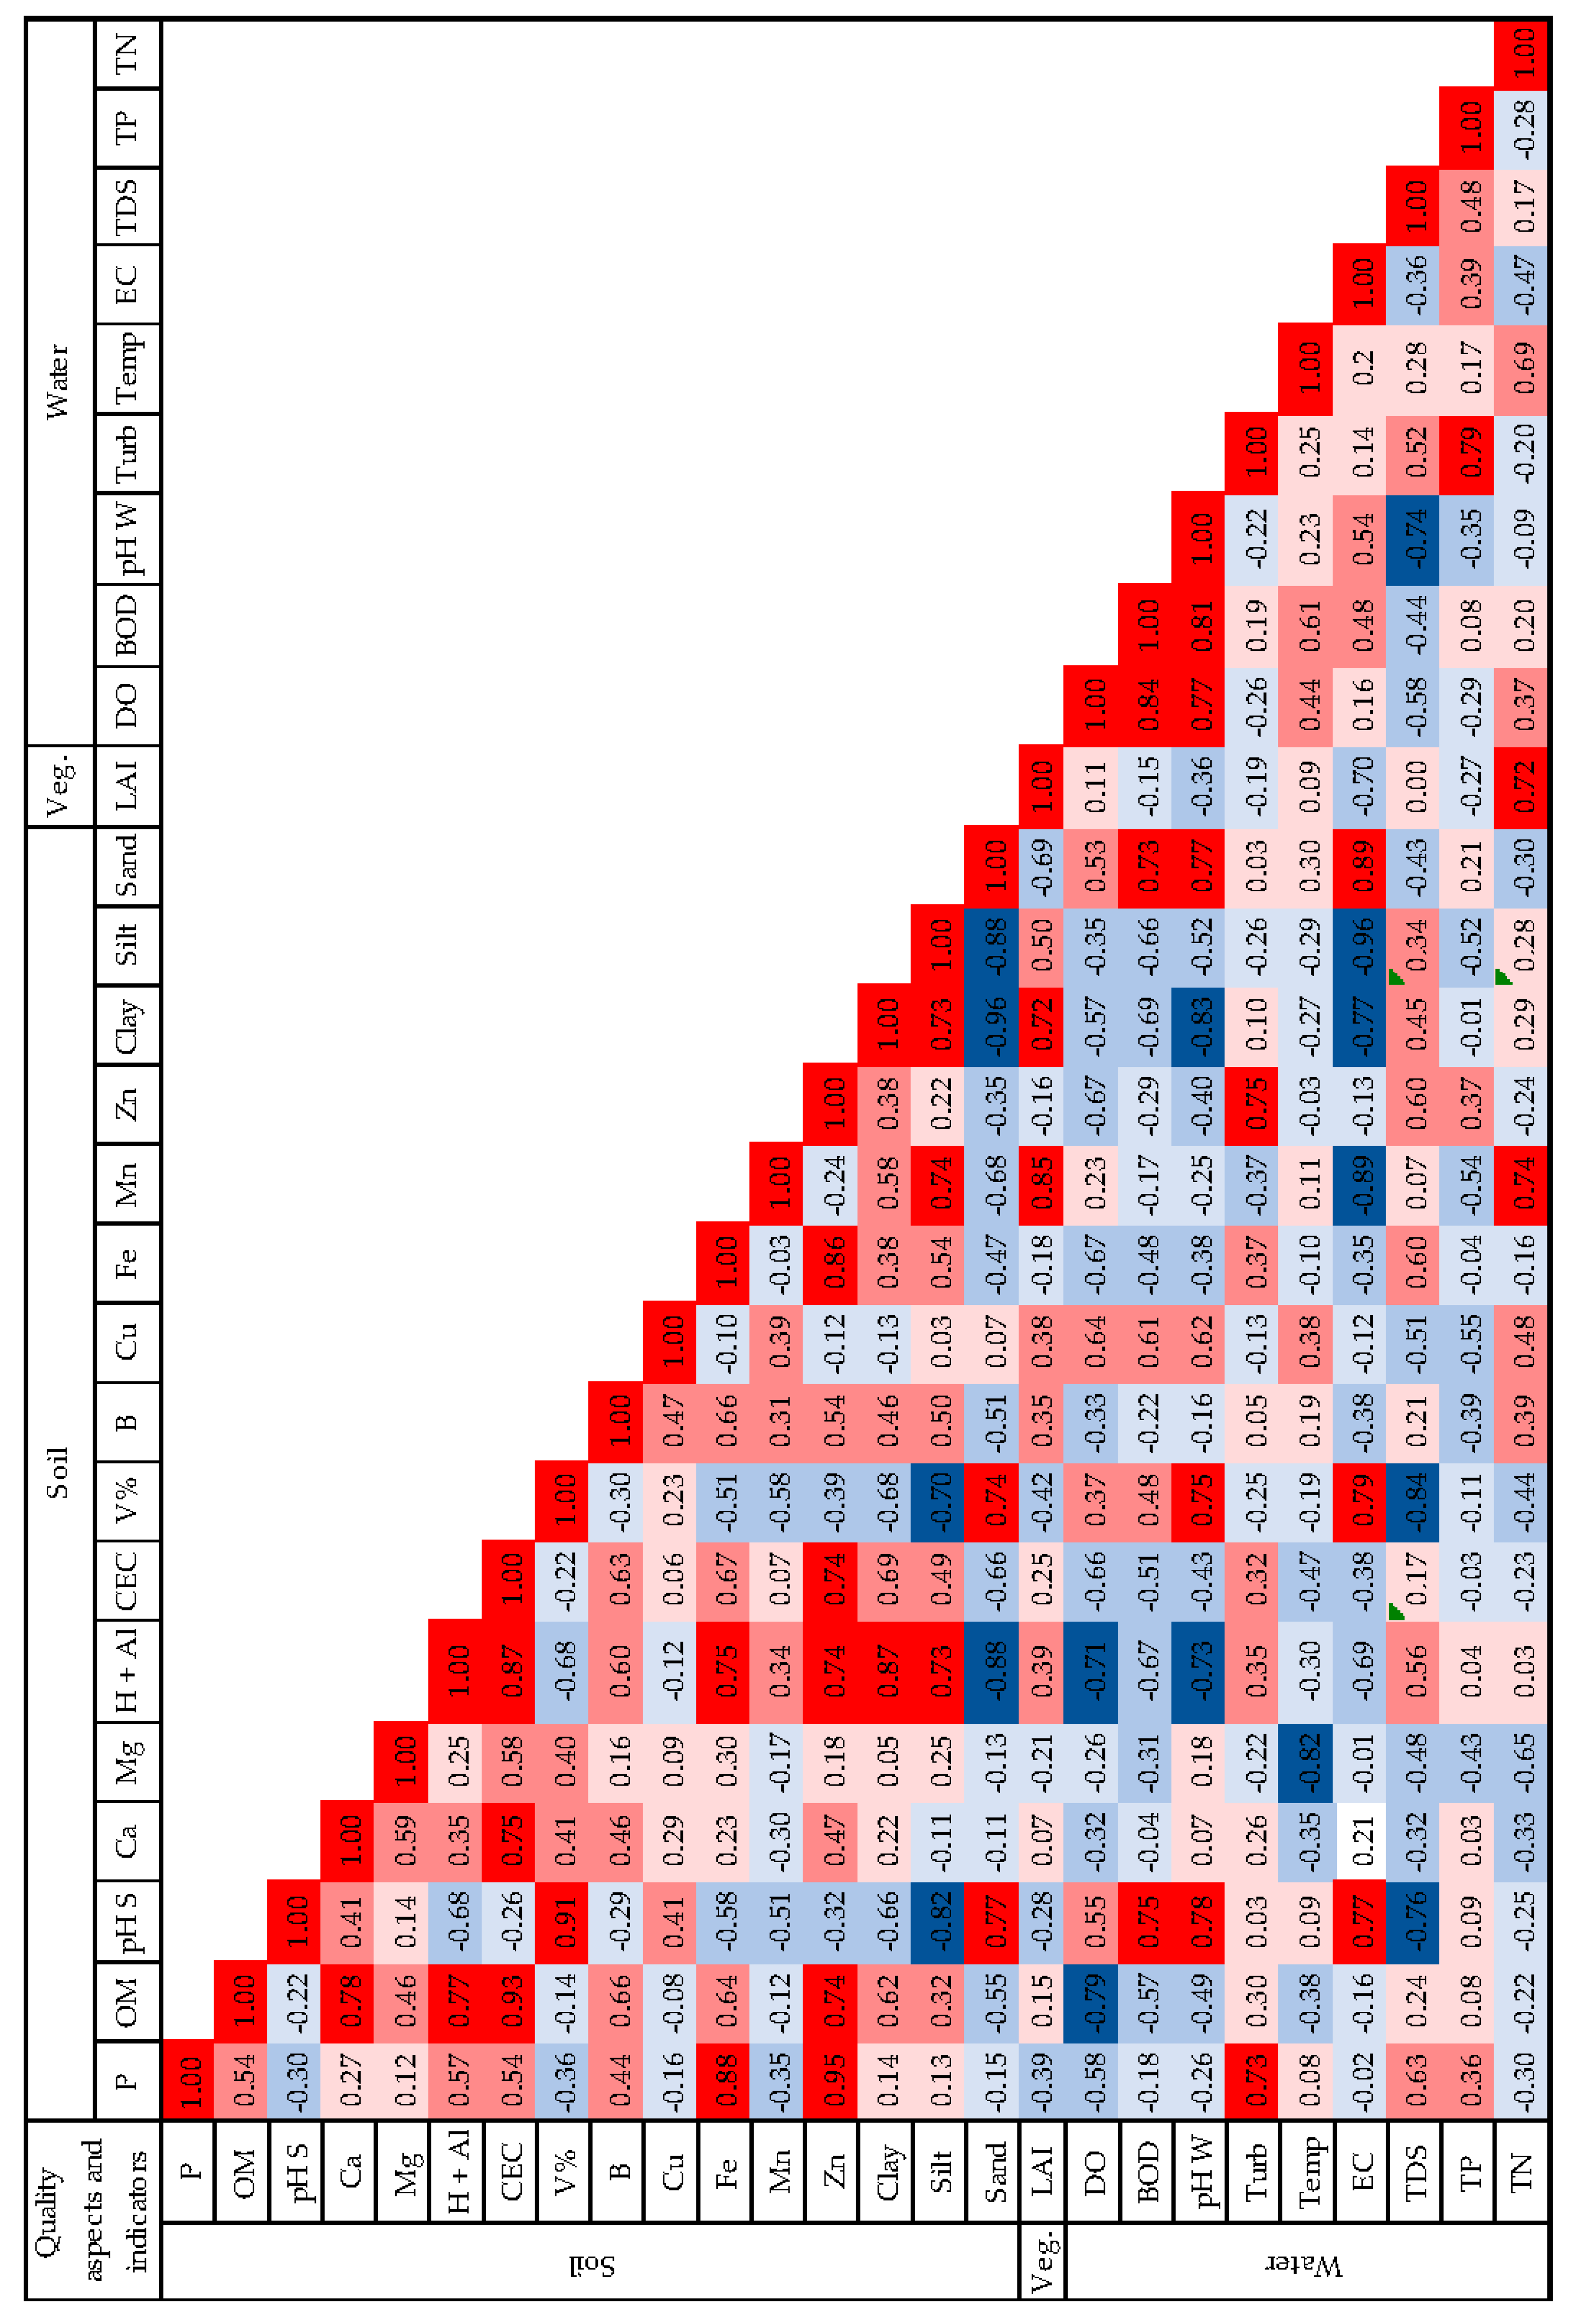
3.3. Correlation between Water, Soil, and Vegetation Characteristics
3.4. PES-Water Monitoring Program Proposal
4. Discussion
4.1. Spatial–Temporal Variation of Water Quality Indicators
4.2. Spatial Variation of Soil Properties and Vegetation Cover
4.3. Correlation between Water, Soil, and Vegetation Characteristics
4.4. PES-Water Monitoring Program Proposal
- The case of PES Curator of the Waters (Conservador das Águas) in Extrema (Brazil): in a publication referring to the program’s twelve years of existence, there are reports that in that period more than 1.3 million trees were planted and over 125 springs were protected, joining forces for the production of billions of liters of water [50];
- The reports of owners participating in the Oasis Apucarana (Oásis Apucarana) project in Paraná, who observed, after five years of implementation of the program in the municipality, the reappearance of springs thanks to the restoration of 64 ha of degraded areas and the protection of springs with fences to prevent cattle trampling on them [51];
- A study of the Guariroba basin in Campo Grande, Mato Grosso do Sul, which found that the environmental practices encouraged by the PES program Living Source (Manancial Vivo) provided an increase in the base flow, which supports the total flow throughout the year. Although a reduction of approximately 1 mm in monthly precipitation was reported in the period between 2012 and 2016, the authors found an increase in the base flow of approximately 0.018 m3/s [52].
5. Conclusions
Author Contributions
Funding
Institutional Review Board Statement
Informed Consent Statement
Data Availability Statement
Acknowledgments
Conflicts of Interest
References
- Farley, J.; Costanza, R. Payments for ecosystem services: From local to global. Ecol. Econ. 2010, 69, 2060–2068. [Google Scholar] [CrossRef]
- Gutman, P. Ecosystem services: Foundations for a new rural–urban compact. Ecol. Econ. 2007, 62, 383–387. [Google Scholar] [CrossRef]
- Díaz, S.; Demissew, S.; Carabias, J.; Joly, C.; Lonsdale, M.; Ash, N.; Larigauderie, A.; Adhikari, J.R.; Arico, S.; Báldi, A.; et al. The IPBES conceptual framework—Connecting nature and people. Curr. Opin. Environ. Sustain. 2015, 14, 1–16. [Google Scholar] [CrossRef] [Green Version]
- IUCN. Facilitating Conservation through the Establishment of Protected Areas as a Basis for Achieving Target 11 of the Strategic Plan for Biodiversity 2011–2020; IUCN: Gland, Switzerland, 2010. Available online: https://portals.iucn.org/library/sites/library/files/resrecfiles/WCC_2012_RES_35_EN.pdf (accessed on 13 November 2020).
- European Commission. Our Life Insurance, Our Natural Capital: An EU Biodiversity Strategy to 2020; European Commission: Brussels, Belgium, 2011. [Google Scholar]
- Executive Office of the President of the United States. Incorporating Ecosystem Services into Federal Decision Making; (M-16-01); US Government: Washongton, DC, USA, 2015.
- Campanha, M.M.; Pedreira, B.C.C.G.; Fidalgo, E.C.C.; Parron, L.M.; Prado, R.B.; Bergier, I.; Monteiro, J.M.G.; Ferraz, R.P.D.; Turetta, A.P.D.; Tonucci, R.G.; et al. Serviços ecossistêmicos: Histórico e evolução. In Marco Referencial em Serviços Ecossistêmicos; Embrapa: Brasília, Brazil, 2019; pp. 37–58. [Google Scholar]
- Pan, X.; Xu, L.; Yang, Z.; Yu, B. Payments for ecosystem services in China: Policy, practice, and progress. J. Clean. Prod. 2017, 158, 200–208. [Google Scholar] [CrossRef]
- Taffarello, D.; Srinivasan, R.; Mohor, G.S.; Guimarães, J.L.B.; do Carmo Calijuri, M.; Mendiondo, E.M. Modeling freshwater quality scenarios with ecosystem-based adaptation in the headwaters of the Cantareira system, Brazil. Hydrol. Earth Syst. Sci. 2018, 22, 4699–4723. [Google Scholar] [CrossRef] [Green Version]
- Wunder, S.; Engel, S.; Pagiola, S. Taking stock: A comparative analysis of payments for environmental services programs in developed and developing countries. Ecol. Econ. 2008, 65, 834–885. [Google Scholar] [CrossRef]
- Bernardes, A.C. Pagamento por serviços ambientais: Experiências brasileiras relacionadas à água. Encontro Nac. Anppas 2010, 5, 4–7. [Google Scholar]
- Reed, M.S.; Moxey, A.; Prager, K.; Hanley, N.; Skates, J.; Bonn, A.; Evans, C.D.; Glenk, K.; Thomson, K. Improving the link between payments and the provision of ecosystem services in agri-environment schemes. Ecosyst. Serv. 2014, 9, 44–53. [Google Scholar] [CrossRef] [Green Version]
- Calvet-Mir, L.; Corbera, E.; Martin, A.; Fisher, J.; Gross-Camp, N. Payments for ecosystem services in the tropics: A closer look at effectiveness and equity. Curr. Opin. Environ. Sustain. 2015, 14, 150–162. [Google Scholar] [CrossRef] [Green Version]
- Ola, O.; Menapace, L.; Benjamin, E.; Lang, H. Determinants of the environmental conservation and poverty alleviation objectives of Payments for Ecosystem Services (PES) programs. Ecosyst. Serv. 2019, 35, 52–66. [Google Scholar] [CrossRef]
- Lima, A.P.M.; Prado, R.B.; Schuler, A.E.; Fidalgo, E.C.C. Metodologias de monitoramento de Programas de Pagamento por Serviços Ambientais Hídricos no Brasil. In Simpósio Brasileiro de Recursos Hídricos; Associação Brasileira de Recursos Hídricos: Porto Alegre, Brazil, 2015. [Google Scholar]
- Llambí, L.; Becerra, M.T.; Peralvo, M.; Avella, A.; Baruffol, M.; Díaz, L.J. Monitoring biodiversity and ecosystem services in Colombia’s High Andean Ecosystems: Toward an integrated strategy. Mt. Res. Dev. 2020, 39, 8–20. [Google Scholar] [CrossRef] [Green Version]
- Martínez, R.Q. Guía Metodológica Para Desarrollar Indicadores Ambientales y de Desarrollo Sostenible em Países de América Latina y el Caribe; CEPAL: Santiago, Chile, 2009; 130p. [Google Scholar]
- Young, C.E.F.; Bakke, R.L.B. Payments for ecosystem services from watershed protection: A methodological assessment of the oasis project in brazil. Nat. Conserv. 2014, 12, 71–78. [Google Scholar] [CrossRef] [Green Version]
- Balvanera, P.; Quijas, S.; Karp, D.S.; Ash, N.; Bennett, E.M.; Boumans, R.; Brown, C.; Chan, K.M.A.; Chaplin-Kramer, R.; Halpern, B.S.; et al. Ecosystem Services. In The GEO Handbook on Biodiversity Observation Networks; Springer: Cham, Switzerland, 2017. [Google Scholar]
- Cord, A.F.; Brauman, K.A.; Chaplin-Kramer, R.; Huth, A.; Ziv, G.; Seppelt, R. Priorities to Advance Monitoring of Ecosystem Services Using Earth Observation. Trends Ecol. Evol. 2017, 32, 416–428. [Google Scholar] [CrossRef] [PubMed]
- Martin-Ortega, J.; Ojea, E.; Roux, C. Payments for Water Ecosystem Services in Latin America: A literature review and conceptual model. Ecosyst. Serv. 2013, 6, 122–132. [Google Scholar] [CrossRef]
- Chen, H.L.; Lewison, R.L.; An, L.; Tsai, Y.H.; Stow, D.; Shi, L.; Yang, S. Assessing the effects of Payments for Ecosystem Services programs on forest structure and species biodiversity. Biodivers. Conserv. 2020, 29, 2123–2140. [Google Scholar] [CrossRef] [Green Version]
- Lima, G. Aplicação de Simulação Computacional na Análise dos Conflitos Entre os Usos Múltiplos da Água na Bacia do Rio Atibaia no Estado de São Paulo. Master’s Thesis, Universidade de São Paulo, São Carlos, Brazil, 2002. [Google Scholar]
- Oliveira, F.L. A Percepção Climática No Município de Campinas-SP. Master’s Thesis, Universidade Estadual de Campinas, Campinas, Brazil, 2005. [Google Scholar]
- CIIAGRO. Centro Integrado de Informações Agrometeorológicas. Available online: http://www.ciiagro.sp.gov.br/ciiagroonline/ (accessed on 20 October 2020).
- Baio, F.H.R.; da Silva Faraun, R.; Teodoro, P.E.; da Silva, A.F.; Neves, D.C.; Azevedo, G.B. Correlations and Principal Components Analysis for Defining Management Zones in Cotton. Braz. J. Dev. 2020, 6, 7393–7407. [Google Scholar] [CrossRef]
- Raij, B.; Andrade, J.C.; Cantarella, H.; Quaggio, J.A. Análise Química Para Avaliação da Fertilidade de Solos Tropicais; Instituto Agronômico: Campinas, Brazil, 2001; 285p. [Google Scholar]
- Galvani, E.; Lima, N.G.B. Fotografias hemisféricas em estudos microclimáticos: Referencial teórico-conceitual e aplicações. Ciência Nat. 2014, 36, 215–221. [Google Scholar] [CrossRef] [Green Version]
- Oliveira, T.H.; Oliveira, J.S.; Machado, C.C.; Rodrigues, G.T.; Galvíncio, J.D.; Pimentel, R.M. Avaliação espaço-temporal do Índice de área foliar e impacto das atividades antrópicas na Reserva Ecológica Estadual Mata São João da Várzea, Recife—PE. Simpósio Bras. Sens. Remoto 2011, 15, 2105–2112. [Google Scholar]
- Figueiredo Filho, D.B.; Silva Júnior, J.A. Desvendando os mistérios do coeficiente de correlação de Pearson. Rev. Política Hoje 2009, 18, 115–146. [Google Scholar]
- Paranhos, R.; Figueiredo Filho, D.B.; da Rocha, E.C.; da Silva Júnior, J.A.; Neves, J.A.B.; Santos, M.L.W.D. Desvendando os Mistérios do Coeficiente de Correlação de Pearson: O Retorno. Leviathan 2014, 8, 66–95. [Google Scholar] [CrossRef] [Green Version]
- Vicini, L. Análise Multivariada da Teoria à Prática; Monografia; Especialização em Estatística e Modelagem Quantitativa, Universidade Federal de Santa Maria: Santa Maria, Brazil, 2005. [Google Scholar]
- Liu, C.W.; Lin, K.H.; Kuo, Y.M. Application of factor analysis in the assessment of groundwater quality in a Blackfoot disease área in Twain. Sci. Total Environ. 2003, 313, 77–89. [Google Scholar] [CrossRef] [PubMed]
- Medeiros, G.A.; Tresmondi, A.C.C.L.; Queiroz, B.P.V.; Fengler, F.H.; Rosa, A.H.; Fialho, J.M.; Lopes, R.S.; Negro, C.V.; Santos, L.F.; Ribeio, A.I. Water quality, pollutant loads, and multivariate analysis of the effects of sewage discharges into urban streams of Southeast Brazil. Energ. Ecol. Environ. 2017, 2, 259–276. [Google Scholar] [CrossRef] [Green Version]
- Ouyang, Y. Evaluation of river water quality monitoring stations by principal component analysis. Water Res. 2005, 39, 2621–2635. [Google Scholar] [CrossRef] [PubMed]
- Ronquim, C.C. Conceitos de Fertilidade do Solo e Manejo Adequado Para as Regiões Tropicais; EMBRAPA Monitoramento por Satélite: Campinas, Brazil, 2010; 26p. [Google Scholar]
- Salvador, J.O.; Moreira, A.; Malavolta, E. Cleusa Pereira Cabral, C.P. Boron and manganese influence on growth and mineral composition on young guava plants. Ciência Agrotecnol. 2003, 27, 325–331. [Google Scholar] [CrossRef]
- Fidalgo, E.C.C.; Prado, R.B.; Turetta, A.P.D.; Schuler, A.E. Manual para Pagamento por Serviços Ambientais Hídricos: Seleção de Áreas e Monitoramento; Embrapa: Brasília, Brazil, 2017. [Google Scholar]
- Bortoloti, K.C.S.; Melloni, R.; Marques, P.S.; de Carvalho, B.M.F.; Andrade, M.C. Microbiological quality of natural waters on the resistance profile of heterotrophic bacteria to antimicrobials. Eng. Sanitária Ambient. 2018, 23, 717–725. [Google Scholar] [CrossRef]
- Brasil Ministério da Saúde; Secretaria de Vigilância em Saúde. Inspeção Sanitária em Abastecimento de Água; Série A: Normas e Manuais Técnicos; Ministério da Saúde: Brasília, Brazil, 2007. [Google Scholar]
- Santos, E.P.P.; Veiga, W.A.; Gonçalves, M.R.S.; Thomé, M.P.M. Coliformes Totais e Termotolerantes em água de nascentes utilizadas para o consumo humano na zona rural do município de Varre-Sai, RJ. Sci. Plena 2015, 11, 052401. [Google Scholar]
- Scapin, D.; Rossi, E.M.; Oro, D. Microbiological quality of water used for human consumption in the extreme western region of Santa Catarina, Brazil. Rev. Inst. Adolfo Lutz 2012, 71, 593–596. [Google Scholar]
- Silva, C.O.F.; Goveia, D. Evaluation of environmental quality of urban water bodies using multivariate analysis. Interações 2019, 20, 947–958. [Google Scholar] [CrossRef]
- Shrestha, S.; Kazama, F. Assessment of surface water quality using multivariate statistical techniques: A case study of the Fuji River basin, Japan. Environ. Model. Softw. 2007, 22, 464–475. [Google Scholar] [CrossRef]
- Villar, M.L.P. Manual de Interpretação de Análise de Plantas e Solos e Recomendação de Adubação; EMPAER: Cuiabá, Brazil, 2007; 182p. [Google Scholar]
- Villani, F.T. Dinâmica da Matéria orgânica e Fertilidade do Solo em Sistemas Agroflorestais e Outras Coberturas Vegetais em Comunidades Indígenas do Alto Solimões Amazonas. Ph.D. Thesis, Federal University of Amazonas, Manaus, Brazil, 2009. [Google Scholar]
- Garcia, J.M.; Longo, R.M. Análise de impactos ambientais em Área de Preservação Permanente (APP) como instrumento de gestão em rios urbanos. Cerrados 2020, 18, 107–128. [Google Scholar] [CrossRef]
- Bambi, P. Variação Sazonal do Índice da Área Foliar e Sua Contribuição na Composição da Serapilheira e Ciclagem de Nutrientes na Floresta de Transição no Norte do Mato Grosso. Master’s Thesis, Universidade Federal de Mato Grosso, Cuiabá, Brazil, 2007. [Google Scholar]
- Pedralino, F.O.; Barbosa, B.S.; Cabral, I.F.; Souza, L.A.C.; Coringa, E.A.O. Indicadores ambientais de solos do Instituto Federal de Mato Grosso, Campus Cuiabá-Bela Vista. In Proceedings of the Congresso Brasileiro De Gestão Ambiental, 2013; IBEAS: Salvador, Brazil, 2013; Volume 4. [Google Scholar]
- Pereira, P.H. Conservador das Águas: 12 Anos; Prefeitura de Extrema, Secretaria Municipal de Meio Ambiente: Extrema, Brazil, 2017. [Google Scholar]
- Pagiola, S.; Von Glehn, H.C.; Taffarello, D. Experiências de Pagamentos por Serviços Ambientais no Brasil; SMA/CBRN: São Paulo, Brazil, 2013. [Google Scholar]
- Sone, J.S.; Gesualdo, G.C.; Zamboni, P.A.P.; Vieira, N.O.M.; Mattos, T.S.; Carvalho, G.A.; Rodrigues, D.B.B.; Sobrinho, T.A.; Oliveira, P.T. Water provisioning improvement through payment for ecosystem services. Sci. Total Environ. 2019, 655, 1197–1206. [Google Scholar] [CrossRef] [PubMed]
- Carneiro, M.A.C.; de Souza, E.D.; dos Reis, E.F.; Pereira, H.S.; de Azevedo, W.R. Physical, chemical and biological properties of cerrado soil under different land use and tillage systems. Rev. Bras. Ciência Solo 2009, 33, 147–157. [Google Scholar] [CrossRef] [Green Version]
- Portugal, A.F.; Juncksh, I.; Schaefer, C.E.; Neves, J.C.L. Aggregate stability in an ultisol under different uses, compared with forest. Rev. Ceres 2010, 57, 545–553. [Google Scholar] [CrossRef] [Green Version]
- Favaretto, N.; Cogo, N.P.; Bertol, O.J. Uso, manejo e conservação do solo e da água: Aspectos agrícolas e ambientais. In Diagnóstico e Recomendações de Manejo do Solo: Aspectos Teóricos e Metodológicos; UFPR/Setor de Ciências Agrarias: Curitiba, Brazil, 2006; pp. 293–341. [Google Scholar]
- Guedes, F.B.; Seehusen, S.E. Pagamentos por Serviços Ambientais na Mata Atlântica: Lições Aprendidas e Desafios; MMA: Brasília, Brazil, 2011. [Google Scholar]


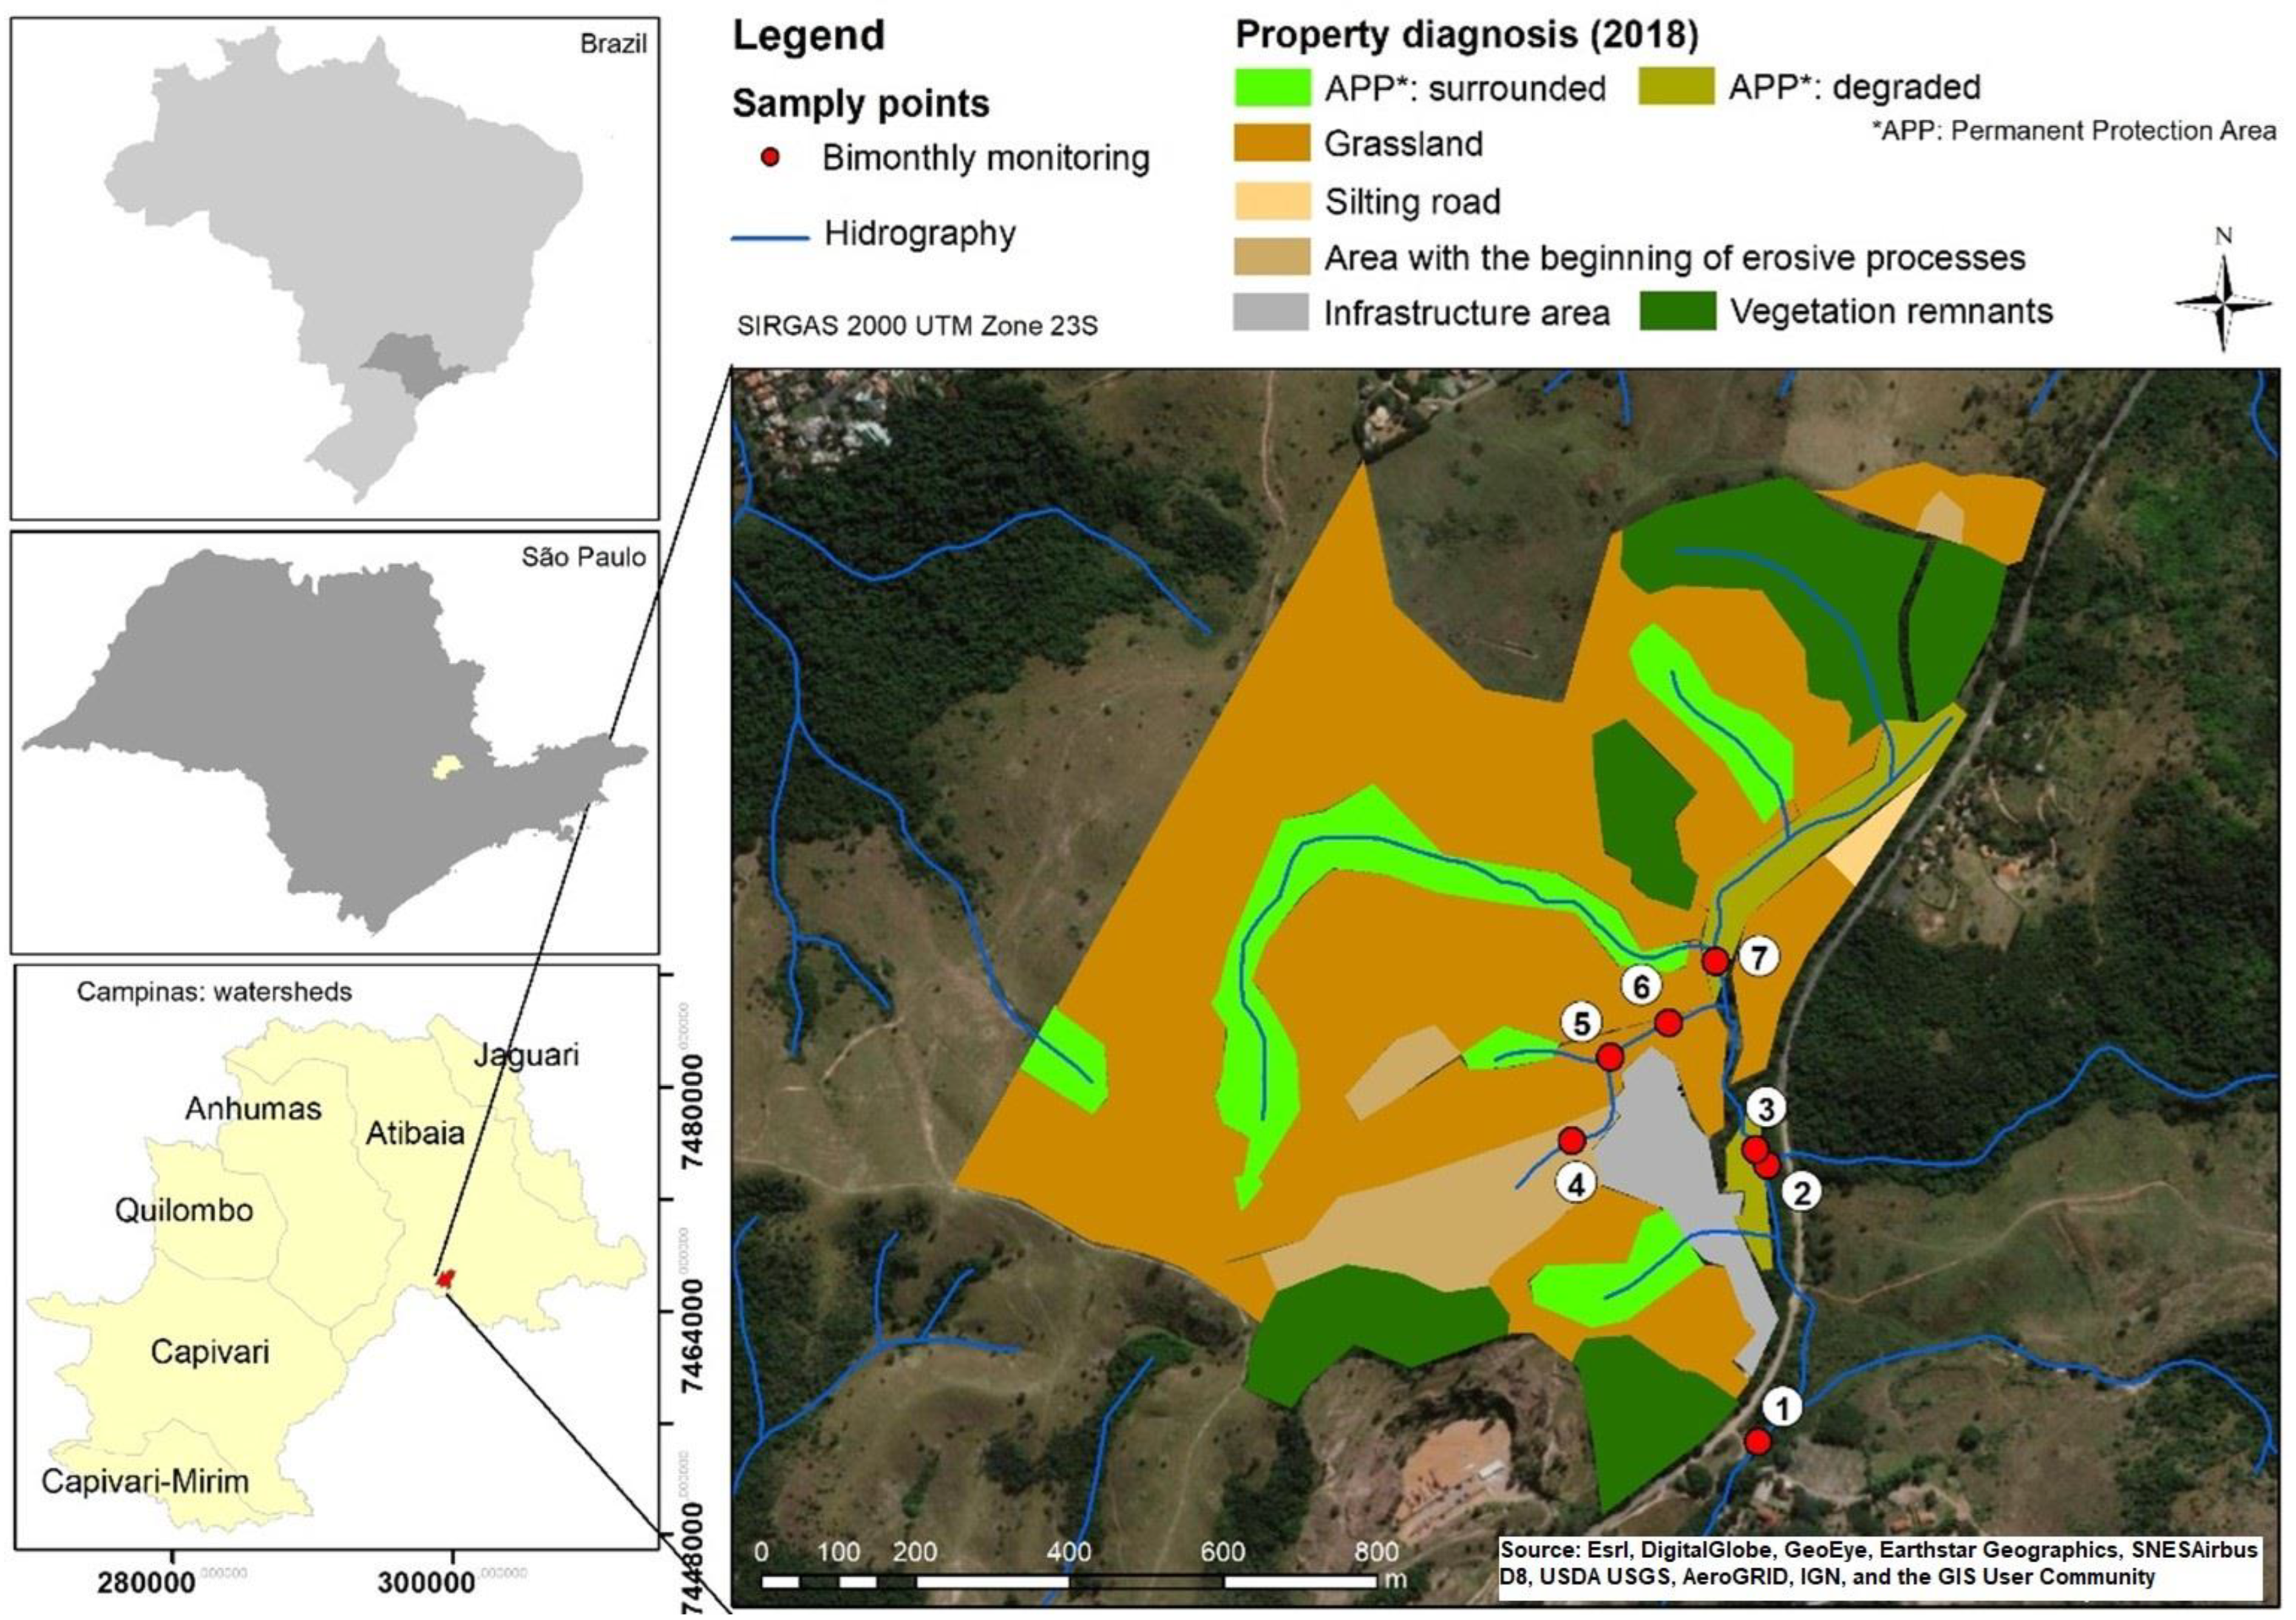
| Point | Description | Spatial Representation |
|---|---|---|
| 1 | Downstream property External point Quality of water leaving the property Unpaved road |  |
| 2 | Test Pit Forest remnant External course Access way PES planting |  |
| 3 | Sewer amount Before the treatment system and external course Higher water flow |  |
| 4 | Erosive process Conservation practices Low water density Burlap |  |
| 5 | Consumption—nascent Spring displacement Livestock amount Fencing |  |
| 6 | Livestock interference Cattle trampling PES surrounding Downstream planting |  |
| 7 | Property amount Prior to improvements Siltation Drainage work |  |
| Parameters | Determination | |
|---|---|---|
| Micronutrients (mg/dm3) | Copper (Cu) | DTPA |
| Iron (Fe) | DTPA | |
| Manganese (Mn) | DTPA | |
| Zinc (Zn) | DTPA | |
| Boron (B) | Hot Water | |
| Macronutrients (mg/dm3 for P) (mmolc/dm3 for Ca and Mg) | Calcium (Ca) | Resin |
| Magnesium (Mg) | Resin | |
| Phosphorus (P) | Resin | |
| Cation exchange capacity—CEC (mmolc/dm3) | Calculation according to IAC methodology [27] | |
| Base saturation | V% | Calculation according to IAC methodology [27] |
| Acidity | Active − pH | CaCl2 |
| Total − H + AL (mmolc/dm3) | Calculation according to IAC methodology [27]) | |
| Particle size distribution (g/Kg) | Clay | HMFS + NaOH |
| Silt | HMFS + NaOH | |
| Total sand | HMFS + NaOH | |
| Organic matter (g/dm3) | Oxidation | |
| Dissolved Oxygen (mg/L) | Biochemical Oxygen Demand (mg/L) | pH | Turbidity (NTU) | |||||||||
|---|---|---|---|---|---|---|---|---|---|---|---|---|
| Point | Average | SD | CV (%) | Average | SD | CV (%) | Average | SD | CV (%) | Average | SD | CV (%) |
| 1 | 6.61 b | 1.38 | 20.91 | 3.39 d | 1.27 | 37.50 | 7.35 d | 0.26 | 3.49 | 16.29 c | 8.75 | 53.76 |
| 2 | 6.53 b | 1.85 | 28.36 | 3.18 bc | 1.59 | 49.92 | 7.26 c | 0.41 | 5.70 | 19.43 d | 22.85 | 117.57 |
| 3 | 6.21 a | 1.76 | 28.42 | 3.08 b | 1.52 | 49.17 | 7.20 bc | 0.33 | 4.54 | 8.73 b | 5.06 | 57.93 |
| 4 | 5.65 d | 1.69 | 29.88 | 2.91 a | 1.44 | 49.32 | 7.04 a | 0.24 | 3.35 | 39.44 f | 28.41 | 72.02 |
| 5 | 5.18 c | 1.36 | 26.21 | 2.55 e | 1.09 | 42.60 | 7.09 a | 0.26 | 3.66 | 23.29 e | 8.01 | 34.39 |
| 6 | 6.22 a | 1.92 | 30.83 | 3.30 cd | 1.56 | 47.39 | 7.18 b | 0.22 | 3.02 | 48.92 g | 17.24 | 35.24 |
| 7 | 6.18 a | 1.69 | 27.41 | 2.78 a | 1.30 | 46.65 | 7.07 a | 0.24 | 3.44 | 7.09 a | 5.54 | 78.10 |
| Temperature (°C) | Electrical Conductivity (µs/cm) | Total Dissolved Solids (mg/L) | Total Phosphorus (mg/L) | |||||||||
| Point | Average | SD | CV (%) | Average | SD | CV (%) | Average | SD | CV (%) | Average | SD | CV (%) |
| 1 | 20.68 c | 0.69 | 3.31 | 101.81 a | 7.48 | 7.35 | 141.30 c | 43.34 | 30.67 | 0.03 a | 0.02 | 63.95 |
| 2 | 19.18 a | 0.51 | 2.67 | 101.56 a | 26.48 | 26.07 | 160.80 d | 56.08 | 34.88 | 0.06 b | 0.07 | 114.05 |
| 3 | 21.06 d | 0.44 | 2.11 | 108.55 f | 8.68 | 8.00 | 210.00 b | 52.22 | 24.87 | 0.06 b | 0.05 | 96.62 |
| 4 | 20.03 b | 0.36 | 1.80 | 98.50 e | 7.35 | 7.46 | 226.40 a | 76.78 | 33.91 | 0.09 e | 0.12 | 131.65 |
| 5 | 18.95 a | 0.23 | 1.22 | 95.02 c | 5.75 | 6.06 | 235.90 a | 54.52 | 23.11 | 0.05 c | 0.03 | 57.37 |
| 6 | 21.73 e | 0.28 | 1.28 | 96.29 d | 7.46 | 7.75 | 269.50 e | 63.48 | 23.55 | 0.08 d | 0.04 | 48.51 |
| 7 | 20.27 b | 0.48 | 2.38 | 75.17 b | 18.74 | 24.93 | 227.80 ab | 73.76 | 32.38 | 0.03 a | 0.02 | 50.91 |
| Total Nitrogen (mg/L) | Total Coliforms (NMP/100 mL) | |||||||||||
| Point | Average | SD | CV (%) | Average | SD | CV (%) | ||||||
| 1 | 25.67 a | 18.30 | 71.30 | 1600.00 a | - | - | ||||||
| 2 | 13.52 a | 19.58 | 144.78 | 1600.00 a | - | - | ||||||
| 3 | 25.12 a | 33.70 | 134.17 | 1600.00 a | - | - | ||||||
| 4 | 22.33 a | 16.15 | 72.30 | 1600.00 a | - | - | ||||||
| 5 | 13.10 a | 15.48 | 118.25 | 1600.00 a | - | - | ||||||
| 6 | 25.17 a | 16.41 | 65.20 | 1600.00 a | - | - | ||||||
| 7 | 33.12 a | 43.27 | 130.64 | 1600.00 a | - | - | ||||||
| April 2019 | July 2019 | September 2019 | |||||||
|---|---|---|---|---|---|---|---|---|---|
| Comp. | Initial Eigenvalues | Initial Eigenvalues | Initial Eigenvalues | ||||||
| Total | % Var. | % Accum. | Total | % Var. | % Accum. | Total | % Var. | % Accum. | |
| F1 | 2.82 | 31.33 | 31.33 | 3.27 | 36.39 | 36.388 | 4.07 | 45.17 | 45.17 |
| F2 | 2.23 | 24.78 | 56.10 | 2.81 | 31.18 | 67.564 | 2.15 | 23.89 | 69.06 |
| F3 | 1.29 | 14.38 | 70.48 | 1.56 | 17.38 | 84.945 | 1.42 | 15.73 | 84.79 |
| F4 | 1.07 | 11.90 | 82.38 | 0.70 | 7.81 | 92.761 | 0.90 | 10.05 | 94.84 |
| F5 | 0.74 | 8.25 | 90.64 | 0.29 | 3.25 | 96.016 | 0.28 | 3.09 | 97.93 |
| F6 | 0.47 | 5.27 | 95.91 | 0.22 | 2.49 | 98.506 | 0.12 | 1.35 | 99.28 |
| F7 | 0.32 | 3.60 | 99.51 | 0.08 | 0.85 | 99.360 | 0.05 | 0.52 | 99.81 |
| F8 | 0.03 | 0.32 | 99.83 | 0.04 | 0.44 | 99.804 | 0.01 | 0.15 | 99.95 |
| F9 | 0.01 | 0.17 | 100.00 | 0.02 | 0.20 | 100.00 | 0.004 | 0.05 | 100.00 |
| November2019 | January 2020 | ||||||||
| Comp. | Initial eigenvalues | Initial eigenvalues | |||||||
| Total | % Var. | % Accum. | Total | % Var. | % Accum. | ||||
| F1 | 3.17 | 35.28 | 35.28 | 3.77 | 41.90 | 41.90 | |||
| F2 | 2.75 | 30.56 | 65.84 | 2.08 | 23.08 | 64.98 | |||
| F3 | 1.48 | 16.45 | 82.29 | 1.17 | 12.99 | 77.97 | |||
| F4 | 1.19 | 13.20 | 95.49 | 0.952 | 10.58 | 88.55 | |||
| F5 | 0.33 | 3.70 | 99.19 | 0.52 | 5.78 | 94.33 | |||
| F6 | 0.03 | 0.32 | 99.51 | 0.45 | 4.95 | 99.29 | |||
| F7 | 0.02 | 0.22 | 99.74 | 0.04 | 0.40 | 99.69 | |||
| F8 | 0.02 | 0.17 | 99.91 | 0.02 | 0.26 | 99.95 | |||
| F9 | 0.01 | 0.09 | 100.00 | 0.005 | 0.05 | 100.00 | |||
| Parameters | April 2019 | July 2019 | September 2019 | |||||||
|---|---|---|---|---|---|---|---|---|---|---|
| F1 | F2 | F3 | F4 | F1 | F2 | F3 | F1 | F2 | F3 | |
| DO | −0.682 | 0.698 | 0.125 | 0.048 | −0.871 | 0.430 | 0.125 | 0.704 | −0.100 | −0.672 |
| BOD | −0.530 | 0.774 | 0.186 | −0.258 | −0.551 | 0.734 | 0.186 | 0.909 | 0.049 | −0.308 |
| pH | −0.439 | −0.259 | −0.261 | 0.210 | −0.521 | 0.726 | −0.261 | 0.860 | −0.247 | 0.360 |
| Turb | 0.728 | 0.586 | 0.260 | −0.303 | 0.734 | 0.498 | 0.260 | −0.099 | 0.753 | 0.557 |
| Temp | 0.123 | 0.634 | −0.236 | 0.273 | 0.219 | 0.879 | −0.236 | 0.692 | 0.586 | −0.283 |
| EC | 0.205 | 0.271 | 0.799 | −0.214 | 0.204 | 0.428 | 0.799 | 0.539 | −0.696 | 0.367 |
| TDS | 0.765 | −0.182 | −0.257 | −0.049 | 0.868 | 0.163 | −0.257 | 0.863 | −0.060 | 0.413 |
| TP | 0.801 | 0.466 | 0.512 | 0.593 | 0.566 | 0.190 | 0.512 | 0.566 | 0.009 | 0.195 |
| TN | −0.254 | 0.086 | −0.597 | −0.159 | 0.490 | 0.537 | −0.597 | 0.400 | 0.824 | 0.075 |
| Parameters | November 2019 | January 2020 | ||||||||
| F1 | F2 | F3 | F4 | F1 | F2 | F3 | ||||
| DO | −0.104 | 0.828 | 0.199 | −0.238 | −0.746 | 0.062 | 0.466 | |||
| BOD | −0.762 | 0.043 | 0.248 | 0.589 | −0.833 | 0.295 | 0.341 | |||
| pH | 0.538 | 0.608 | −0.130 | 0.560 | 0.833 | −0.281 | 0.268 | |||
| Turb | 0.102 | −0.294 | 0.870 | 0.364 | −0.149 | −0.706 | −0.336 | |||
| Temp | −0.039 | 0.645 | 0.597 | −0.417 | 0.034 | 0.879 | −0.053 | |||
| EC | 0.664 | 0.609 | −0.346 | 0.239 | −0.797 | 0.238 | −0.241 | |||
| TDS | 0.868 | −0.343 | 0.186 | −0.288 | 0.867 | 0.375 | −0.154 | |||
| TP | 0.916 | 0.164 | 0.308 | 0.136 | 0.320 | 0.659 | −0.280 | |||
| TN | −0.499 | 0.822 | −0.002 | −0.072 | 0.561 | 0.078 | 0.699 | |||
| --------Micronutrients (mg/dm3)------- | -------Macronutrients------- | pH | H + Al | V% | CEC (mmolc/dm3) | |||||||
| Point | Cu | Fe | Mn | Zn | B | P | Ca | Mg | ||||
| 1 | 2.80 | 264.00 | 28.00 | 8.20 | 0.94 | 25.00 | 32.00 | 12.00 | 4.90 | 31.00 | 60.00 | 78.30 |
| 2 | 1.50 | 108.00 | 17.20 | 3.50 | 0.62 | 11.00 | 20.00 | 12.00 | 4.80 | 26.00 | 57.00 | 60.40 |
| 3 | 1.30 | 140.00 | 12.00 | 2.30 | 0.75 | 11.00 | 15.00 | 7.00 | 4.70 | 20.00 | 54.00 | 43.90 |
| 4 | 1.40 | 242.00 | 19.60 | 13.00 | 0.82 | 34.00 | 31.00 | 9.00 | 4.70 | 45.00 | 49.00 | 88.20 |
| 5 | 1.20 | 620.00 | 11.20 | 17.20 | 0.91 | 68.00 | 28.00 | 14.00 | 4.50 | 50.00 | 48.00 | 96.10 |
| 6 | 1.80 | 460.00 | 21.80 | 16.20 | 0.84 | 71.00 | 18.00 | 7.00 | 4.60 | 39.00 | 42.00 | 67.70 |
| 7 | 1.90 | 312.00 | 74.00 | 5.80 | 0.88 | 12.00 | 16.00 | 9.00 | 4.40 | 46.00 | 38.00 | 74.10 |
| Particle Size Distribution (g/Kg) | Textural Class | Organic Matter (g/dm3) | LAI (m2/m2) | |||||||||
| Point | Sand (%) | Clay (%) | Silt (%) | |||||||||
| 1 | 728.00 | 149.00 | 123.00 | Loamy sand | 16.00 | 1.48 | ||||||
| 2 | 751.00 | 132.00 | 117.00 | Loamy sand | 8.00 | 0.57 | ||||||
| 3 | 773.00 | 123.00 | 104.00 | Loamy sand | 9.00 | 0.57 | ||||||
| 4 | 630.00 | 250.00 | 120.00 | Sandy clay loam | 21.00 | 2.00 | ||||||
| 5 | 623.00 | 212.00 | 165.00 | Sandy clay loam | 23.00 | 0.32 | ||||||
| 6 | 711.00 | 161.00 | 128.00 | Sandy loam | 12.00 | 0.68 | ||||||
| 7 | 542.00 | 263.00 | 195.00 | Sandy clay loam | 13.00 | 2.82 | ||||||
Disclaimer/Publisher’s Note: The statements, opinions and data contained in all publications are solely those of the individual author(s) and contributor(s) and not of MDPI and/or the editor(s). MDPI and/or the editor(s) disclaim responsibility for any injury to people or property resulting from any ideas, methods, instructions or products referred to in the content. |
© 2023 by the authors. Licensee MDPI, Basel, Switzerland. This article is an open access article distributed under the terms and conditions of the Creative Commons Attribution (CC BY) license (https://creativecommons.org/licenses/by/4.0/).
Share and Cite
Longo, R.M.; Garcia, J.M.; Gomes, R.C.; Nunes, A.N. Identifying Key Indicators for Monitoring Water Environmental Services Payment Programs—A Case Study in Brazil. Sustainability 2023, 15, 9593. https://doi.org/10.3390/su15129593
Longo RM, Garcia JM, Gomes RC, Nunes AN. Identifying Key Indicators for Monitoring Water Environmental Services Payment Programs—A Case Study in Brazil. Sustainability. 2023; 15(12):9593. https://doi.org/10.3390/su15129593
Chicago/Turabian StyleLongo, Regina Marcia, Joice Machado Garcia, Raissa Caroline Gomes, and Adélia Nobre Nunes. 2023. "Identifying Key Indicators for Monitoring Water Environmental Services Payment Programs—A Case Study in Brazil" Sustainability 15, no. 12: 9593. https://doi.org/10.3390/su15129593