
A Modified Process Analysis Method and Neural Network Models for Carbon Emissions Assessment in Shield Tunnel Construction


Abstract
:1. Introduction
2. Calculation Method and Boundary
2.1. Calculation Method
2.2. CO2 Emission Source in Tunnel Construction
2.2.1. Shield Machine Parts
- 1.
- Manufacturing of shield machine partsIncluding raw material processing, manufacturing, transportation, and processing equipment energy consumption;
- 2.
- Transportation and installation of shield machine partsThe energy consumption of processing equipment and the oil consumption during transportation are included in the calculation;
- 3.
- Transportation and debugging of the shield machine;
- 4.
- Running and maintenance of the shield machineThe energy consumption during the operation of the shield machine and the maintenance equipment are considered;
- 5.
- Demolition and recycling of the shield machine.
- The manufacturing of shield machine parts;
- Transportation and installation of shield machine parts.
2.2.2. Tunnel Building Materials
- No consideration of climate or environmental impact;
- No consideration of building material recovery factors;
- No consideration of construction equipment depreciation;
- Building material transport distance is a fixed value.CO2 emissions resources for reinforced concrete precast segments can be represented as follows.
- CO2 generated by non-carbon energy. The main non-carbon energy used in the production of reinforced concrete precast segments is electrical energy. In the case of mainly thermal power generation, it is necessary to calculate the CO2 emissions generated.
- CO2 is generated by energy-consuming substances. The dissipation substances used in the production are materials, such as concrete, steel reinforcement, etc. The production of these materials consumes energy and generates CO2.
- CO2 is generated by direct combustion of carbonaceous energy. Carbonaceous energy is mainly released by the combustion of fuels, such as in transportation, and maintenance steam is also obtained by burning carbonaceous energy.
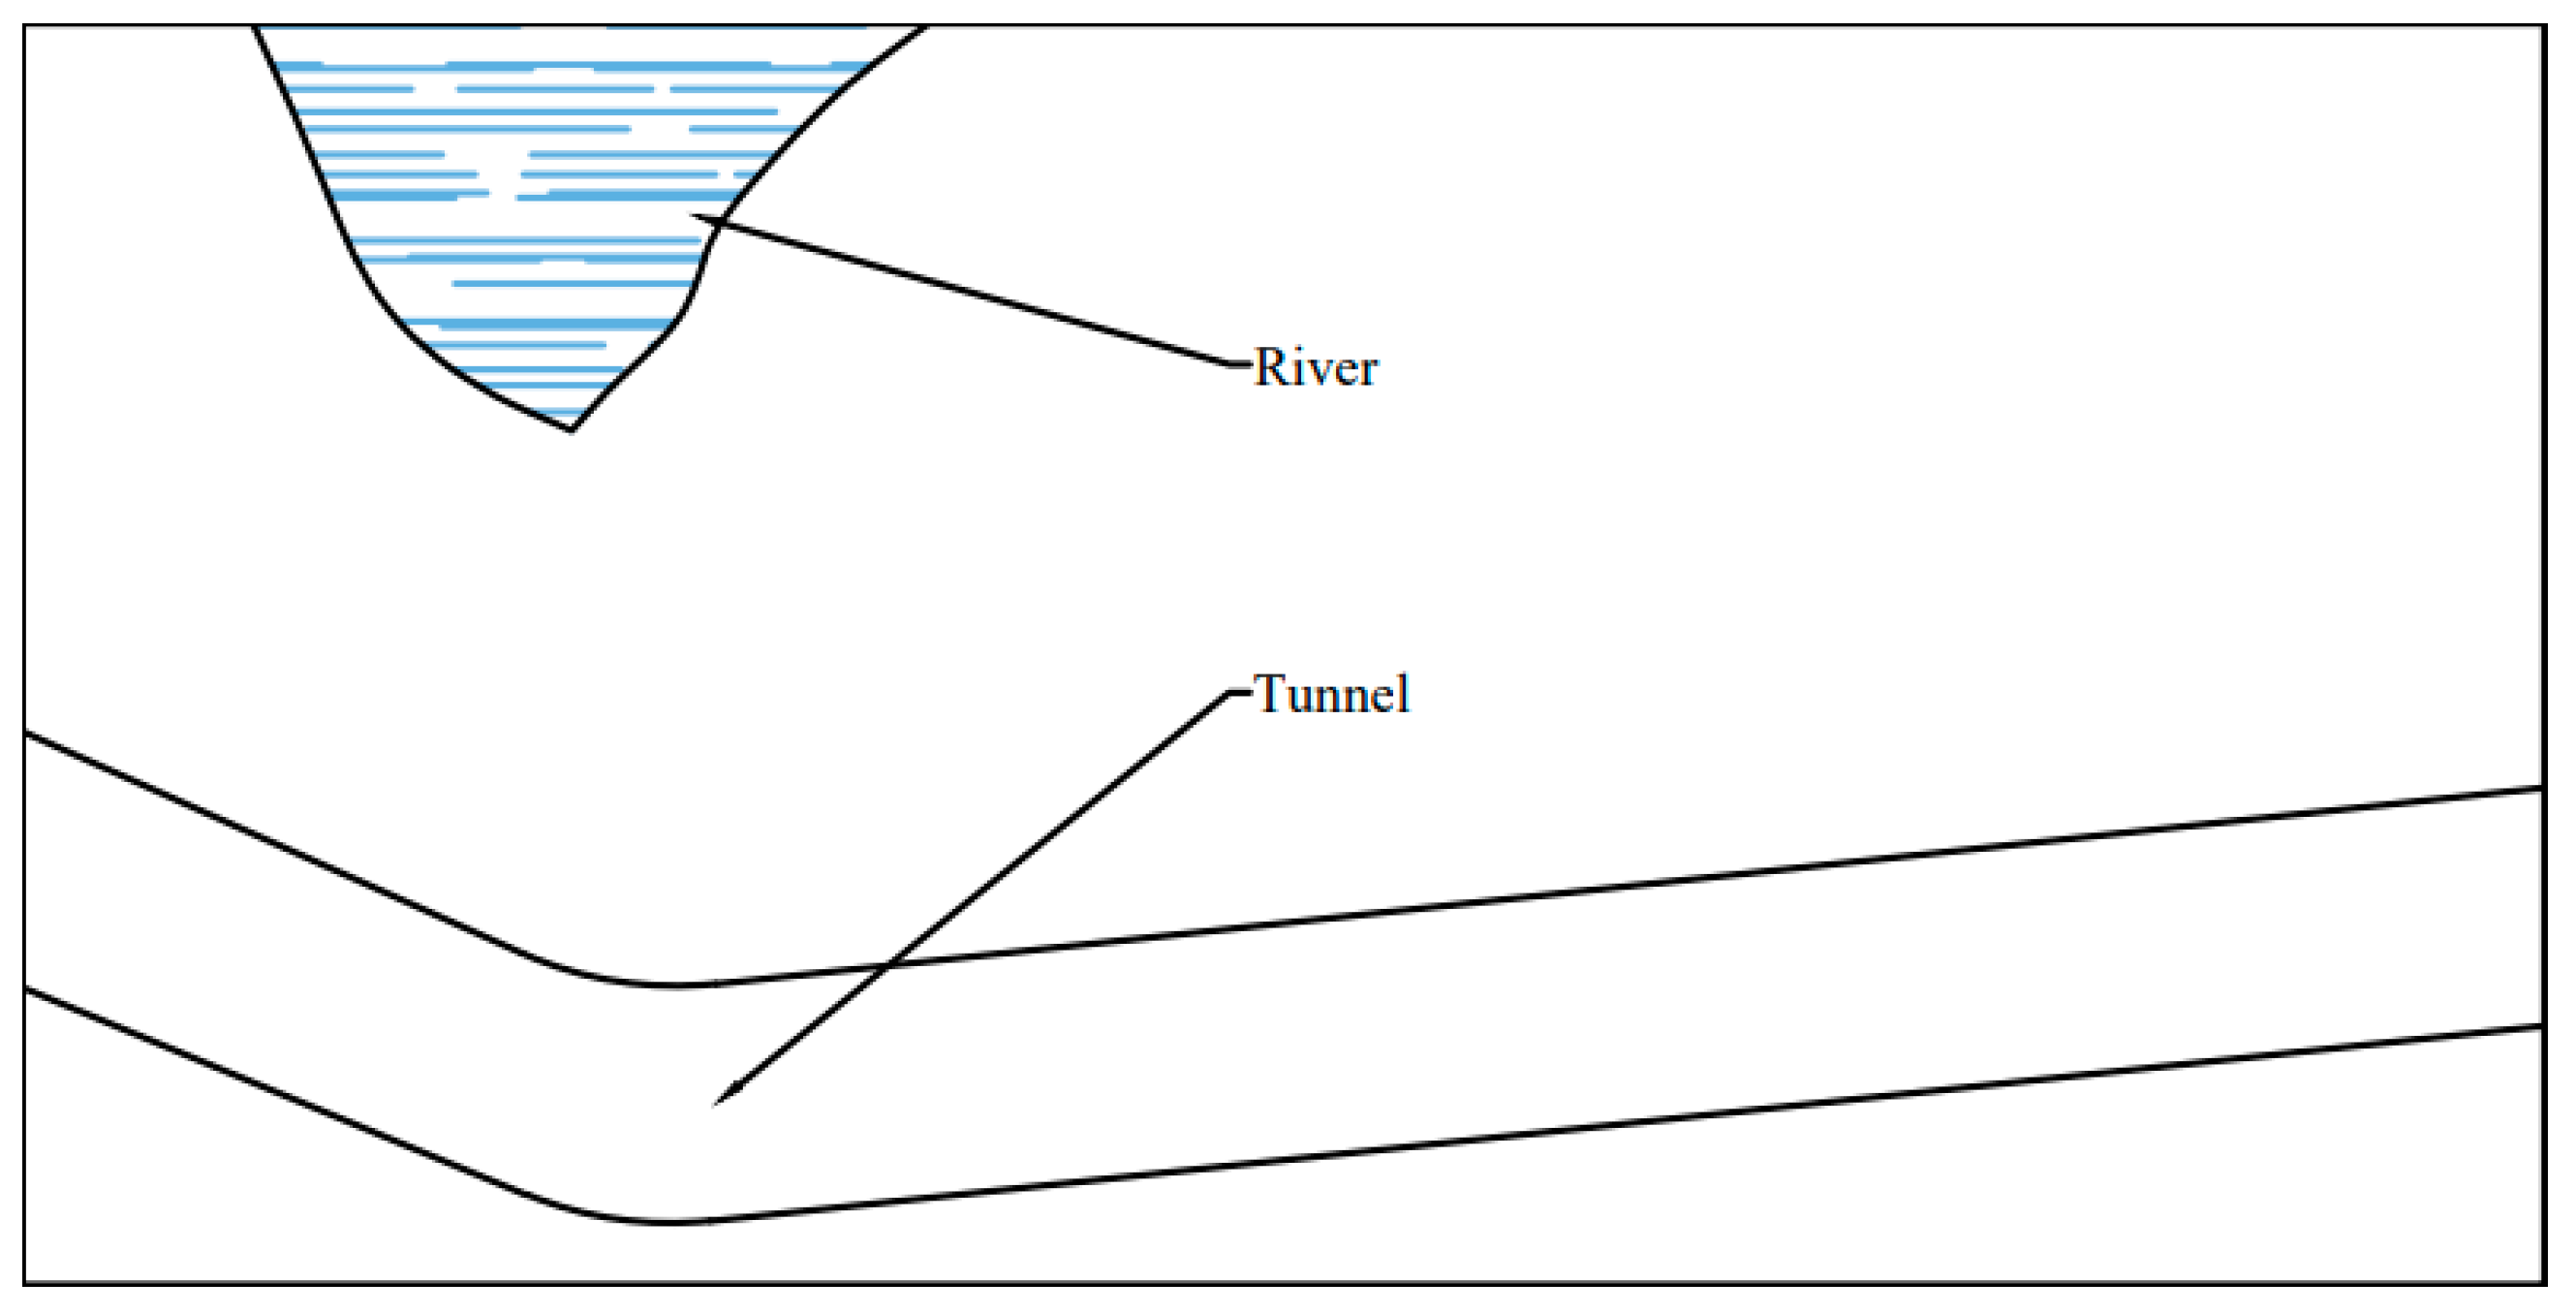
2.2.3. Shield Tunneling
2.3. Calculation Boundary
- For the steel, iron and steel making and steel processing are included in the calculation boundary.
- For the cement, raw material preparation, clinker burning, and production packaging are included in the calculation boundary.
- For the sand aggregate, the excavation, mining, and screening process must be considered.
- For the concrete, the mixing process is selected as the calculation content.
- For the material transportation process and construction equipment, the calculation boundary only includes carbon emissions from the working period of the machine equipment, but the carbon emissions from the manufacturing, maintenance, and recycling phases of mechanical equipment are not included in the calculation boundary.
3. CO2 Emissions from Shield Tunnel Construction
3.1. Project Introduction
3.2. CO2 from Tunnel Construction
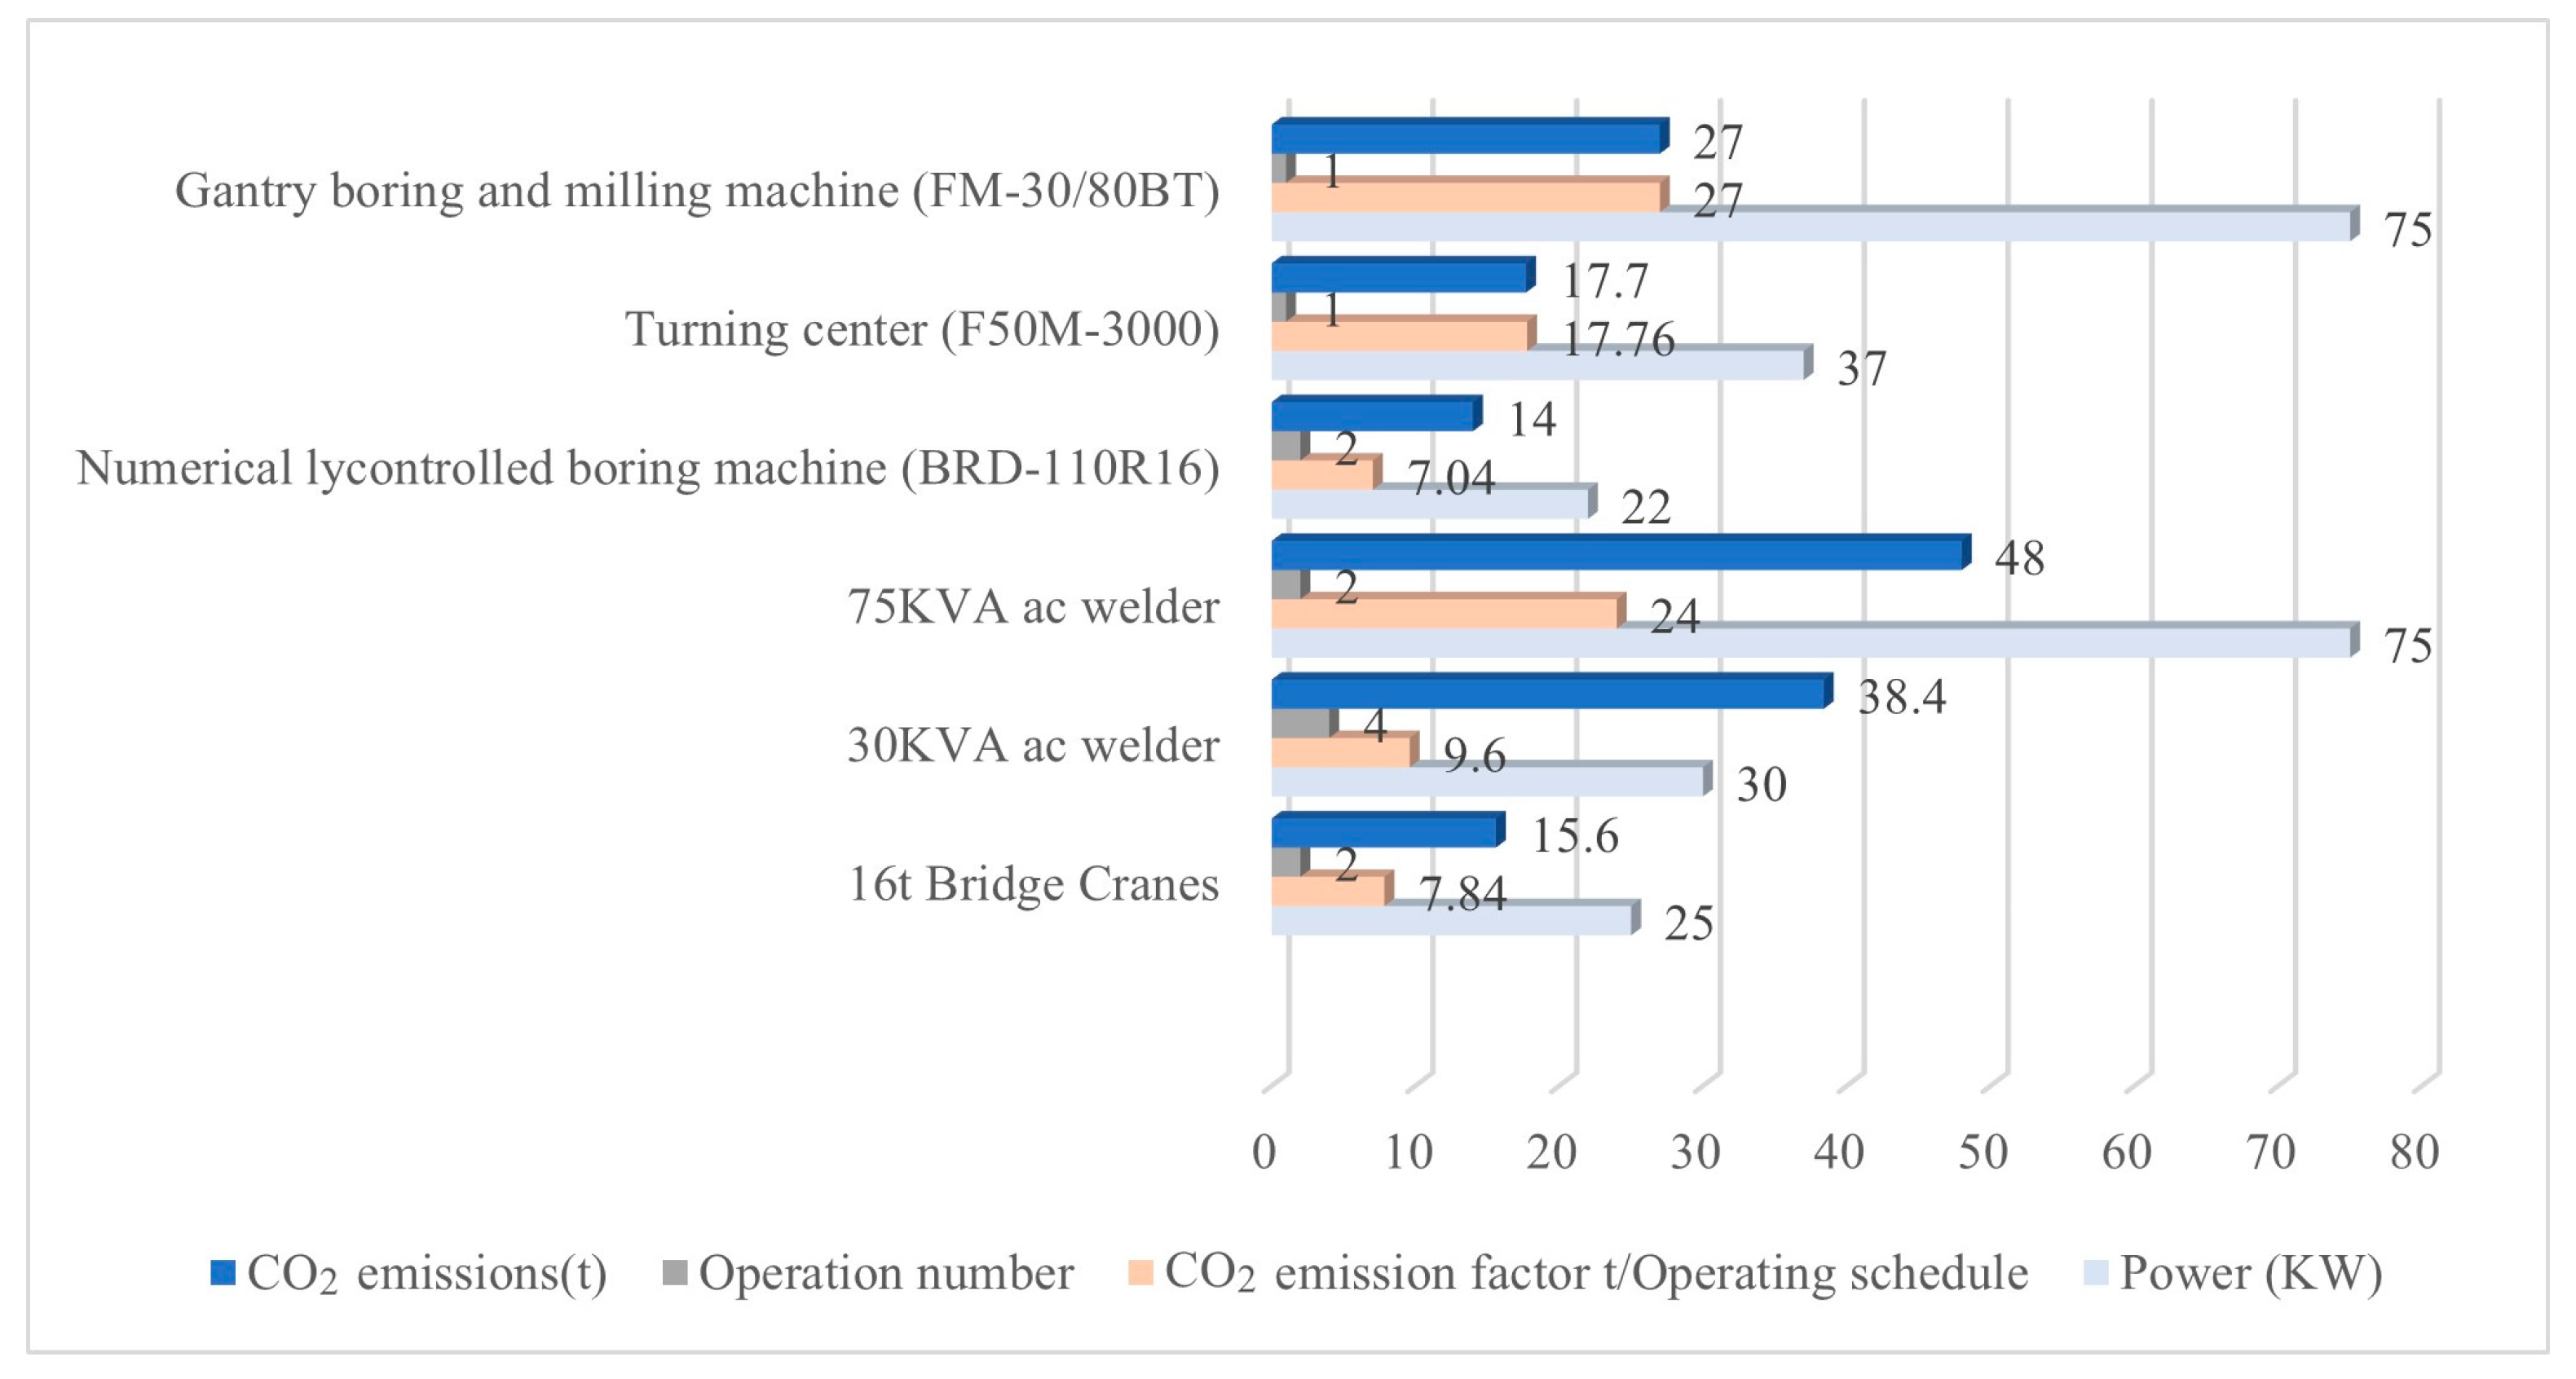
3.2.1. Shield Machine
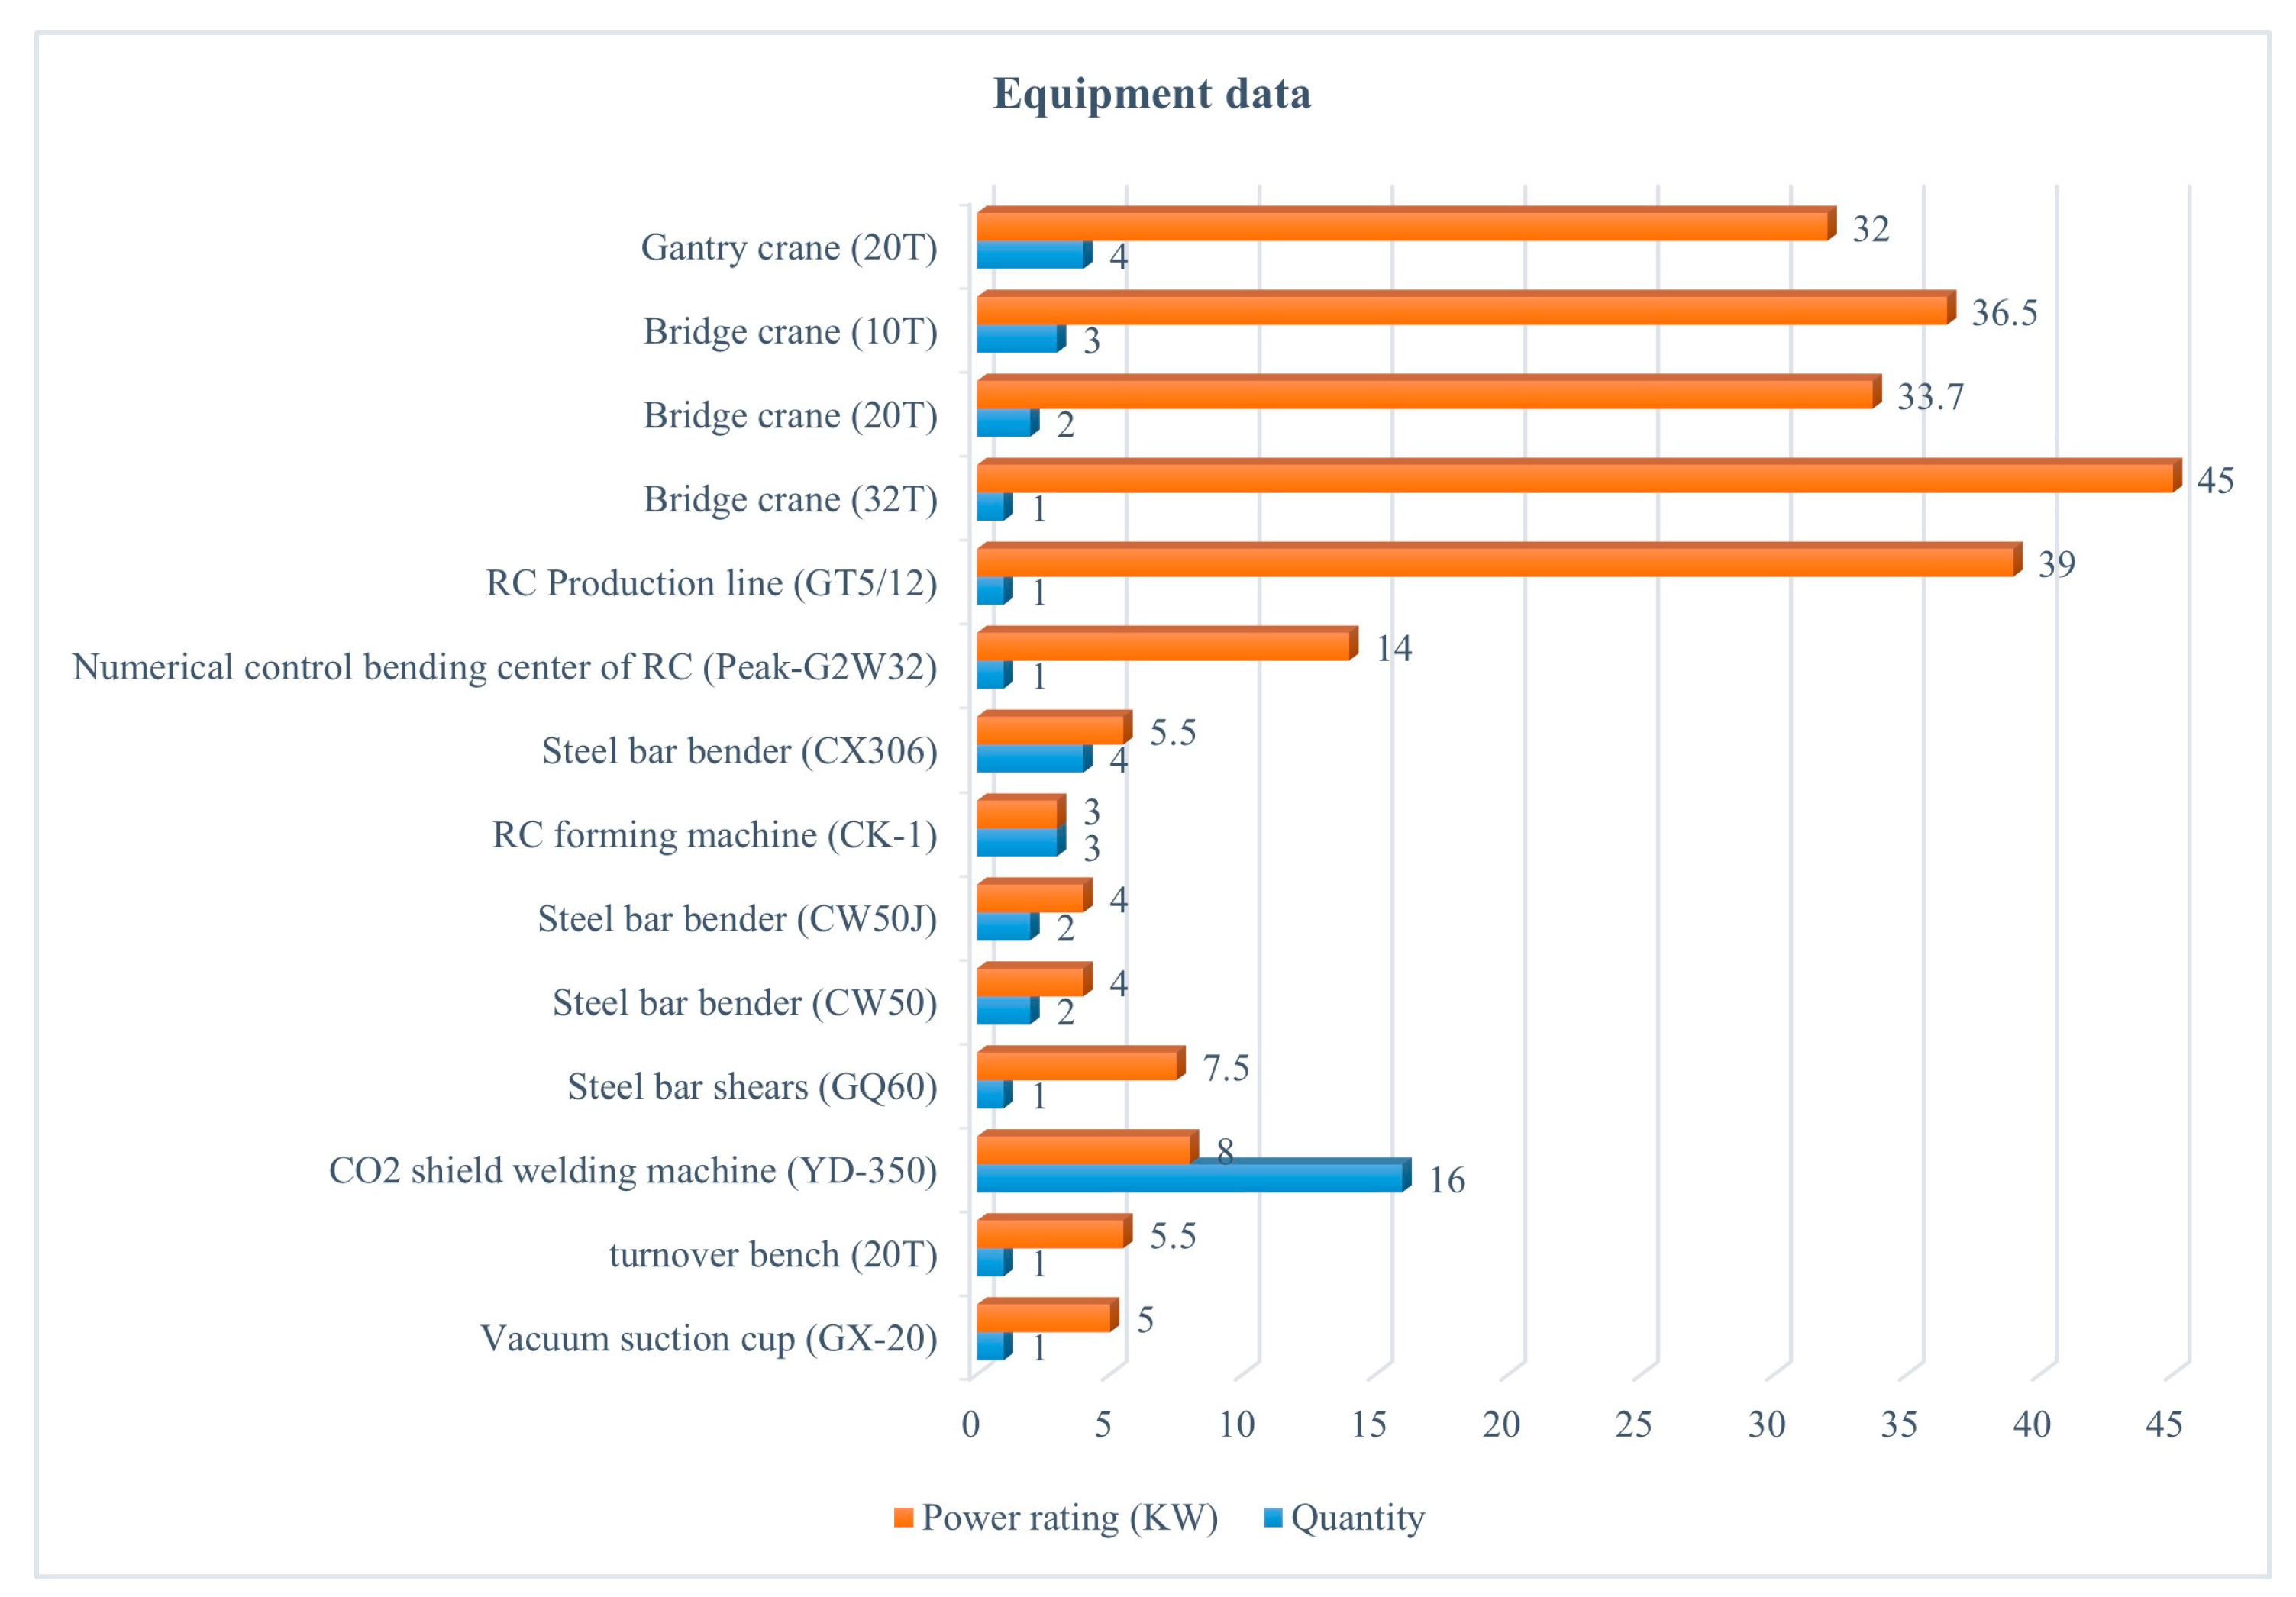
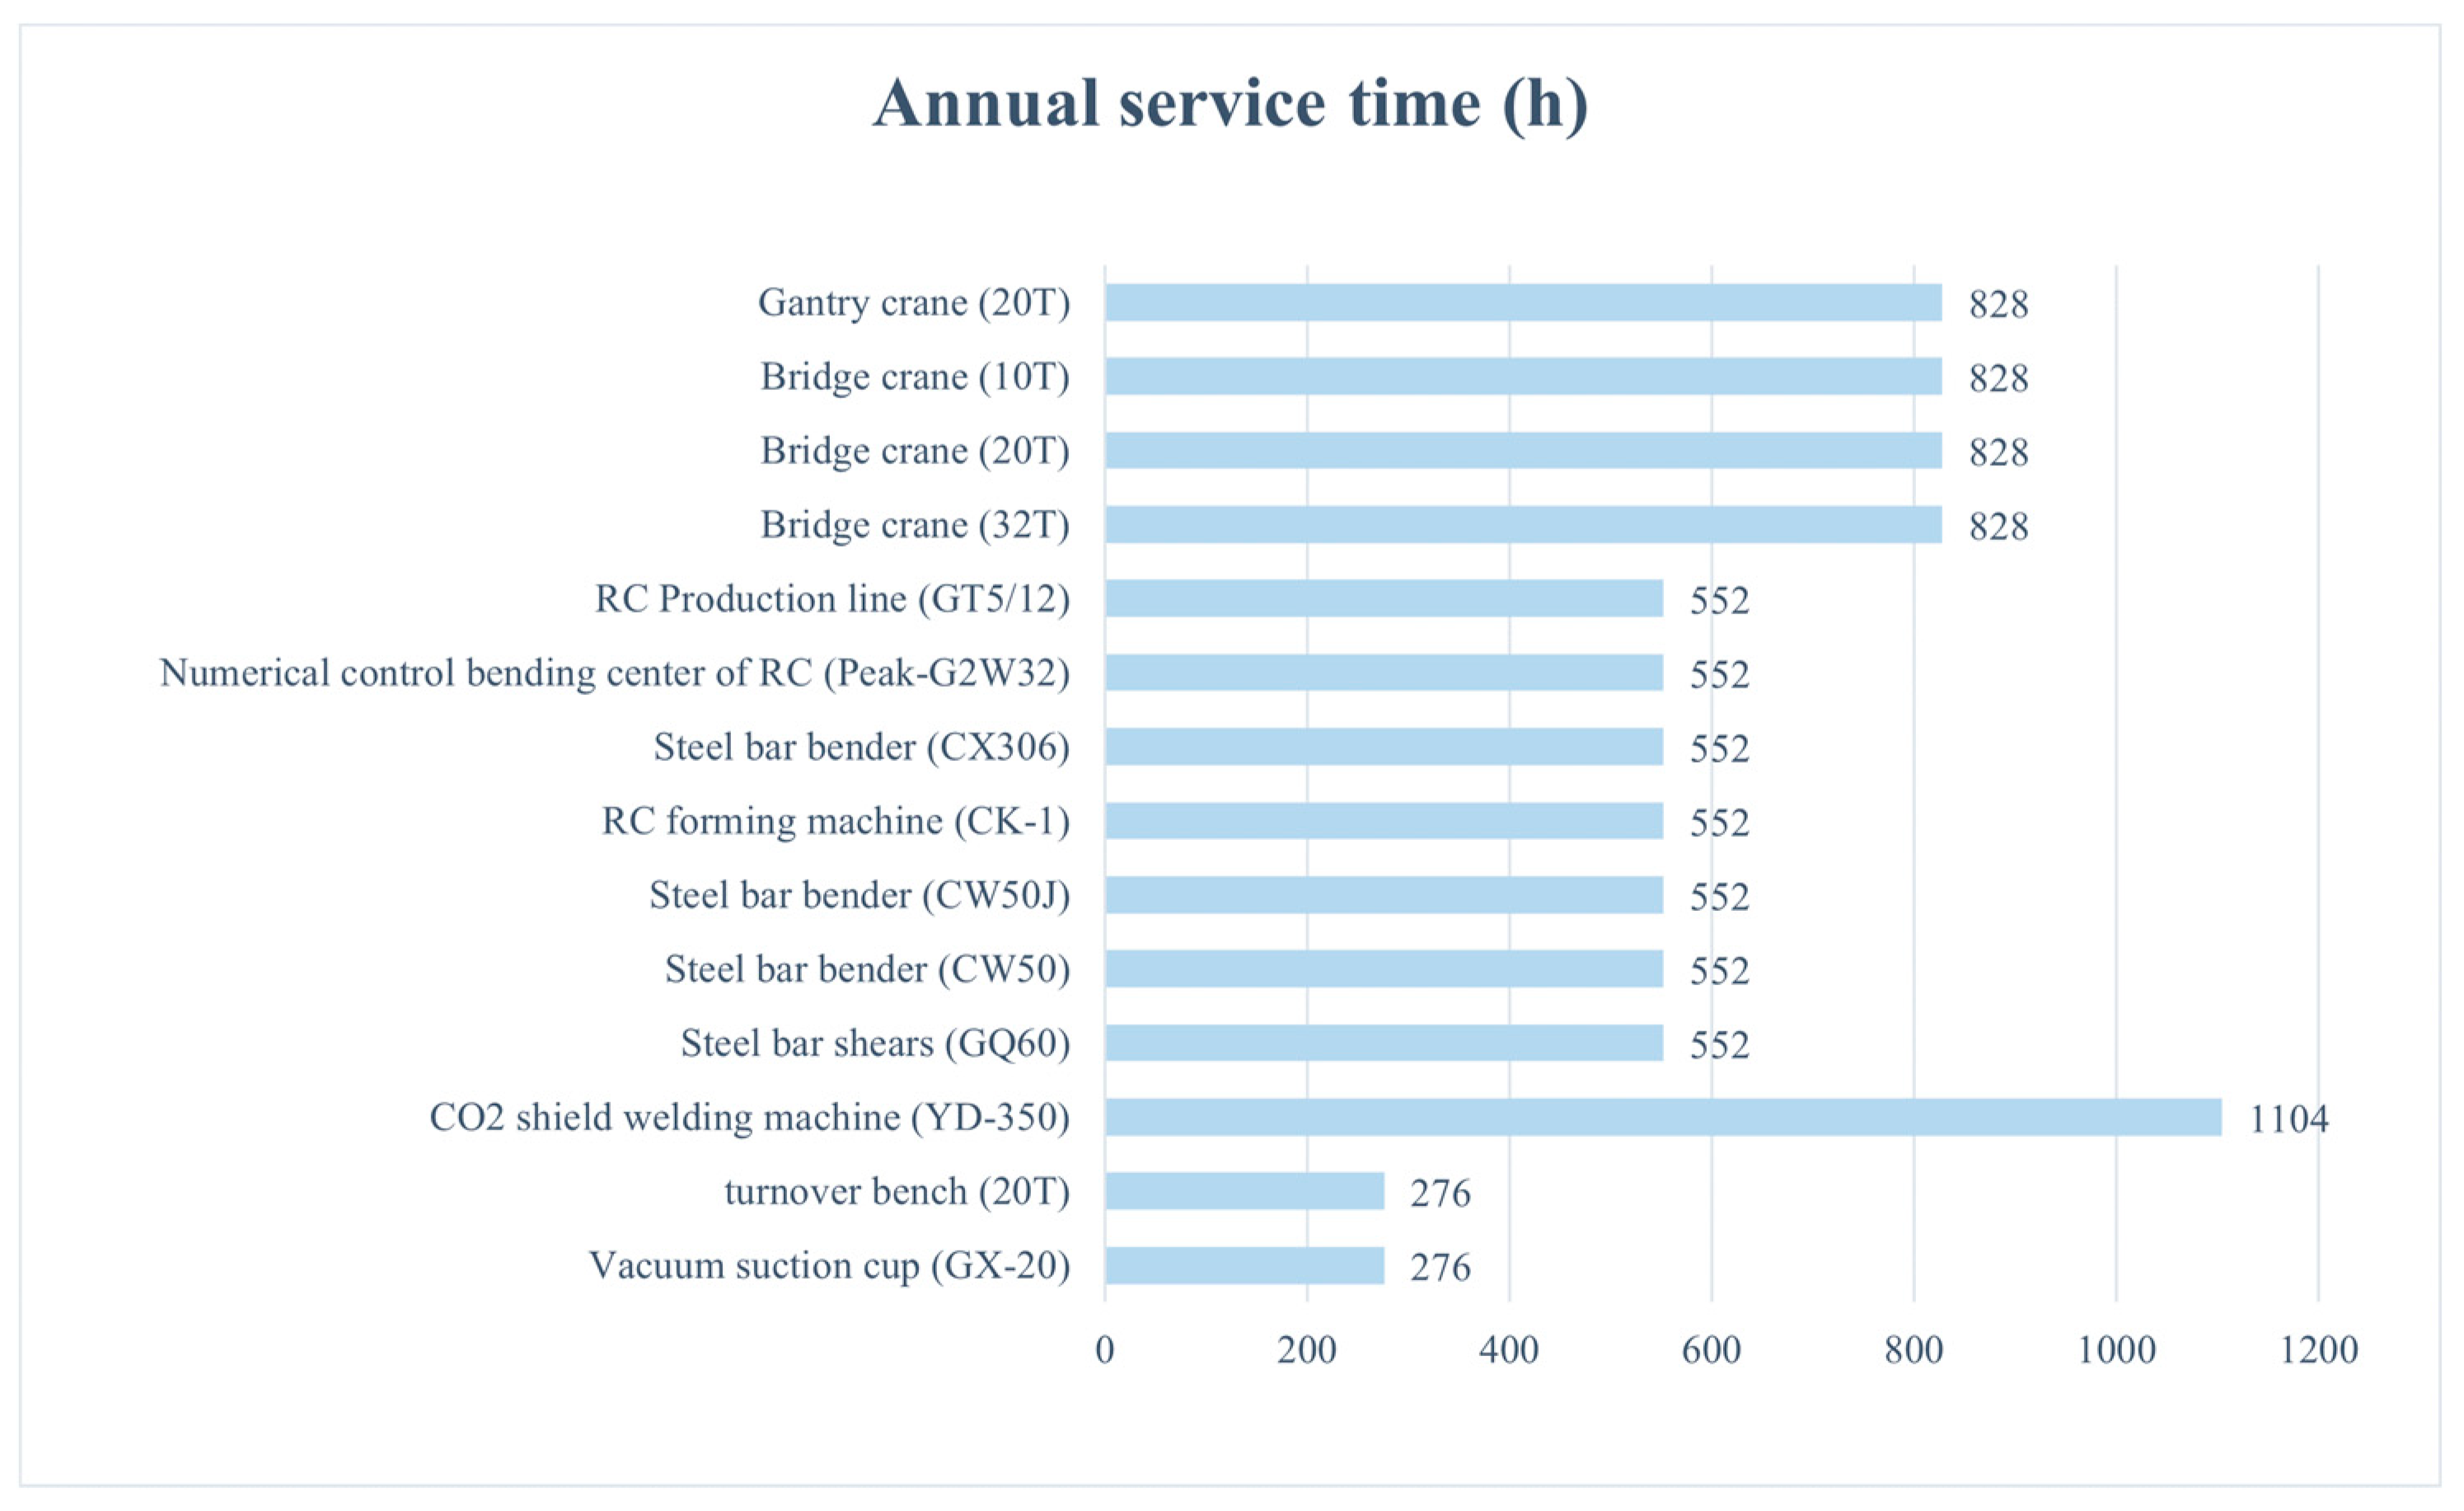
3.2.2. Reinforced Concrete Precast Segments
3.2.3. Shield Tunneling
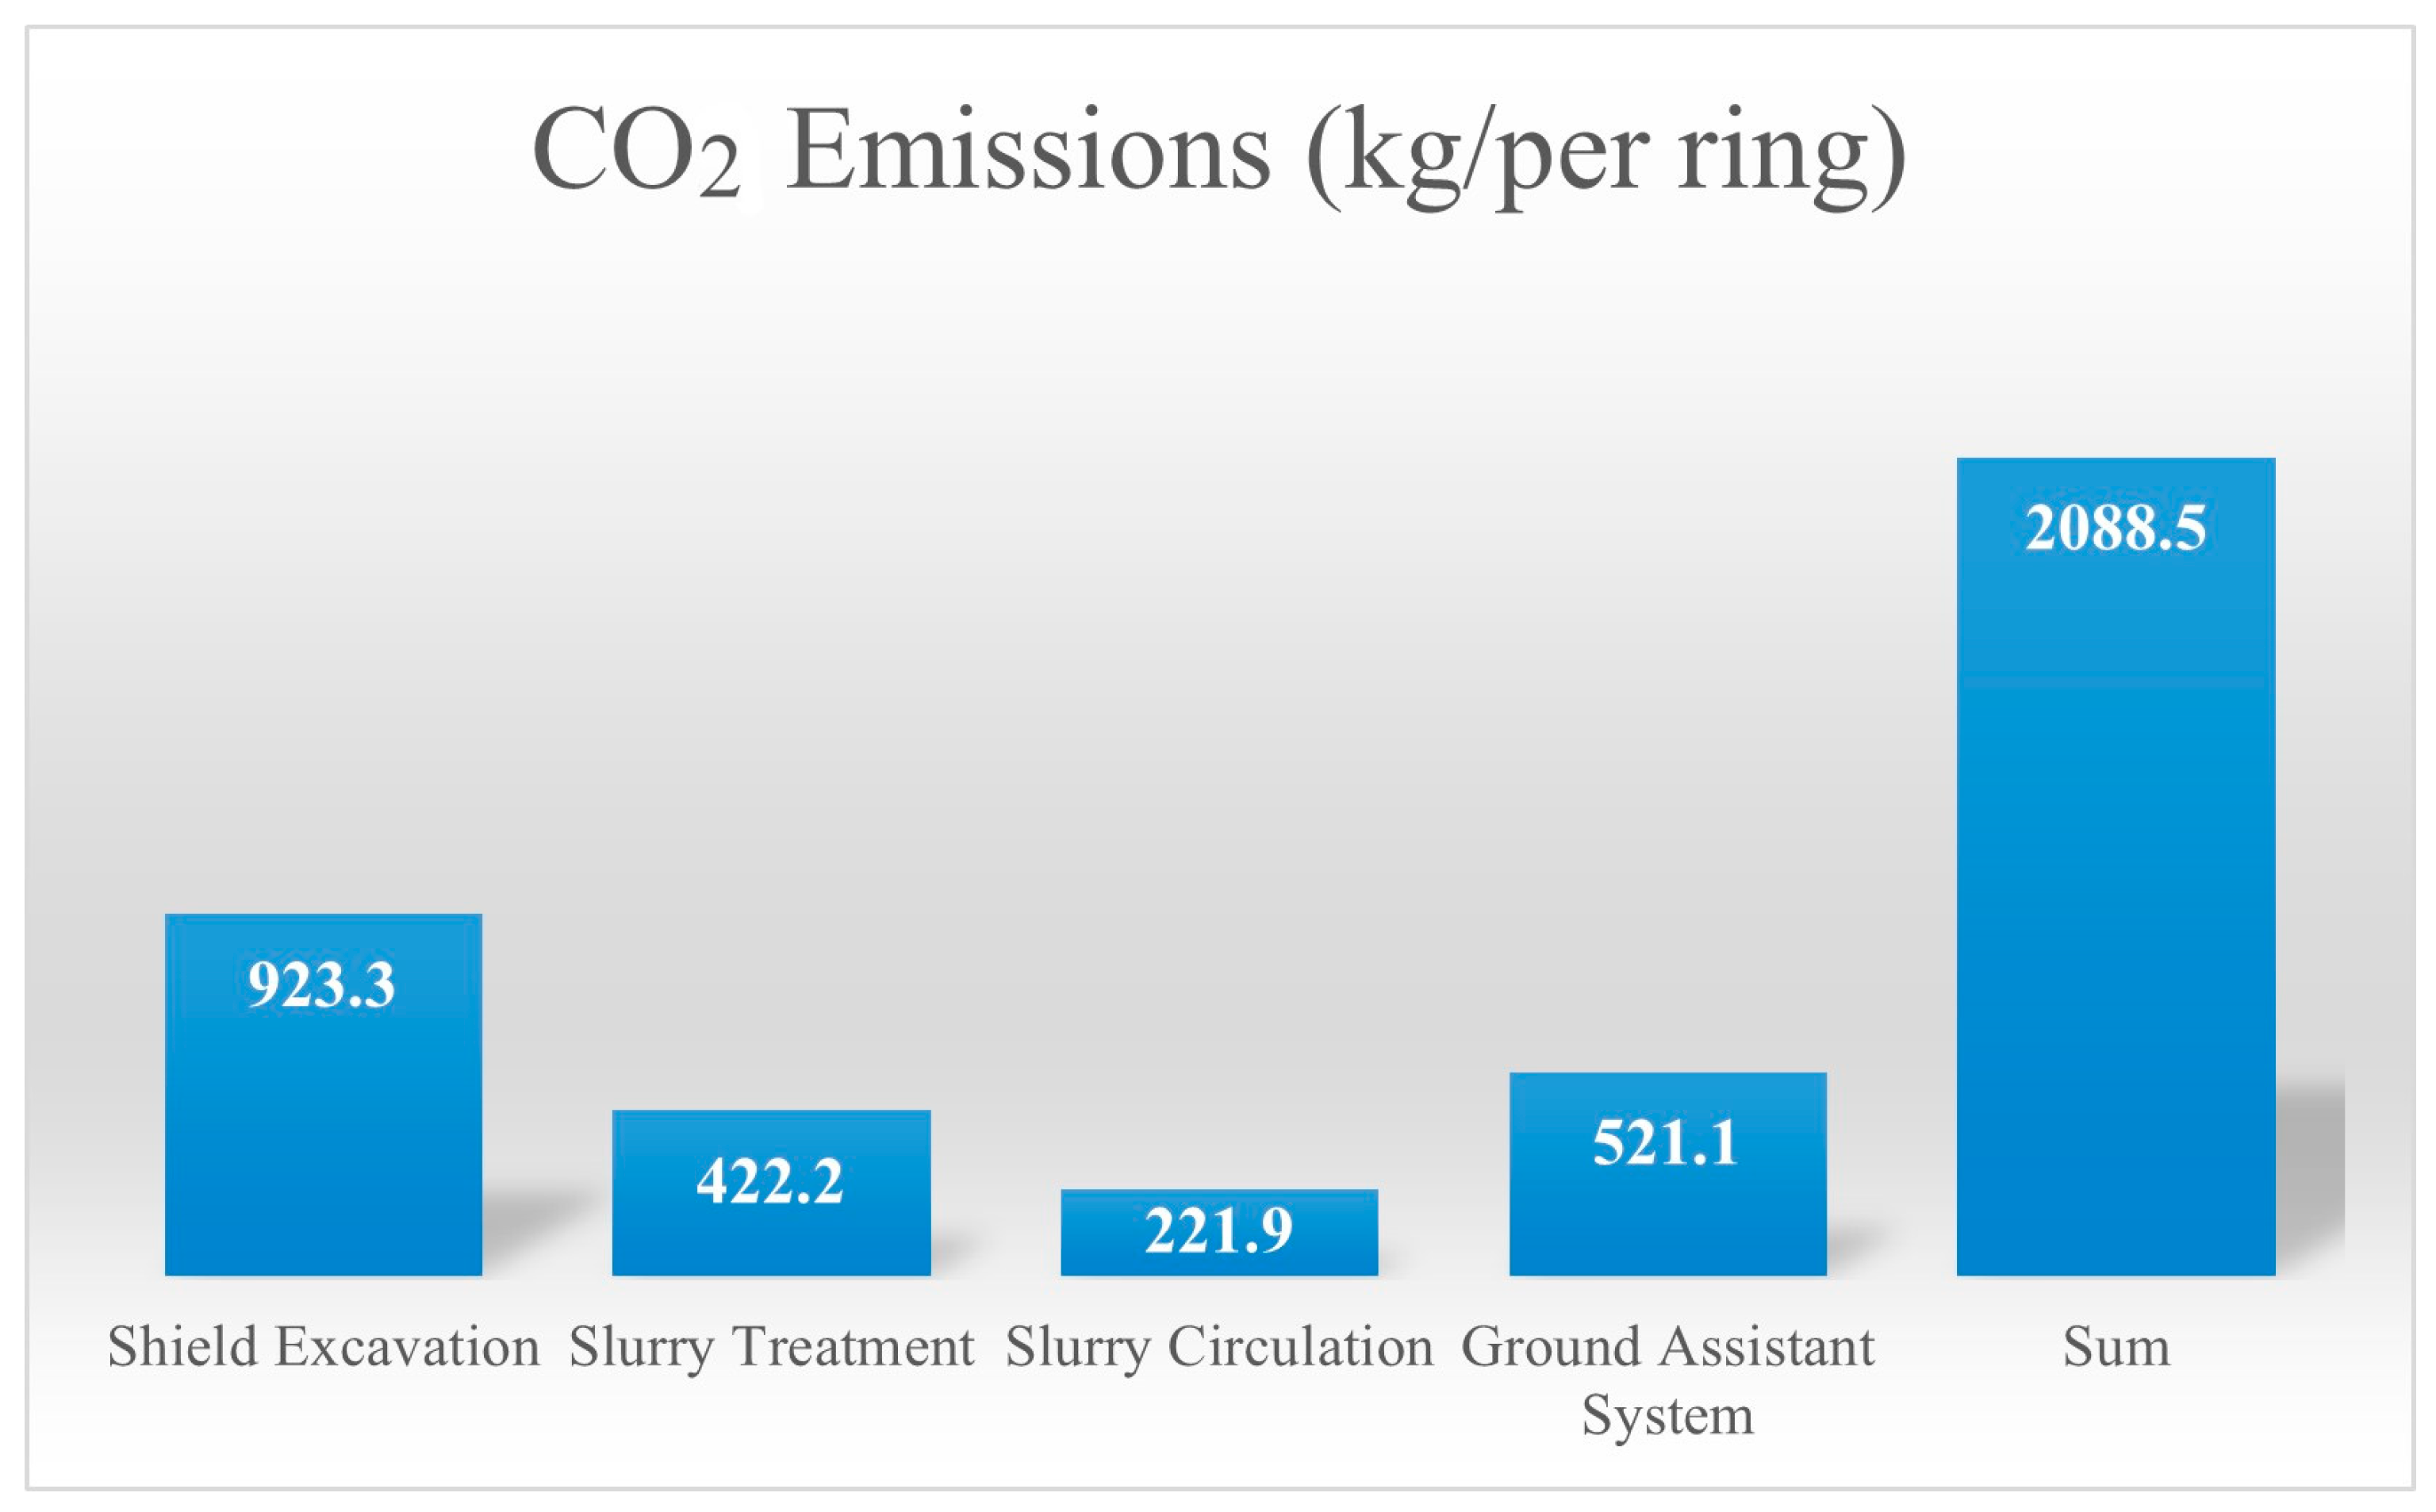
3.3. Results
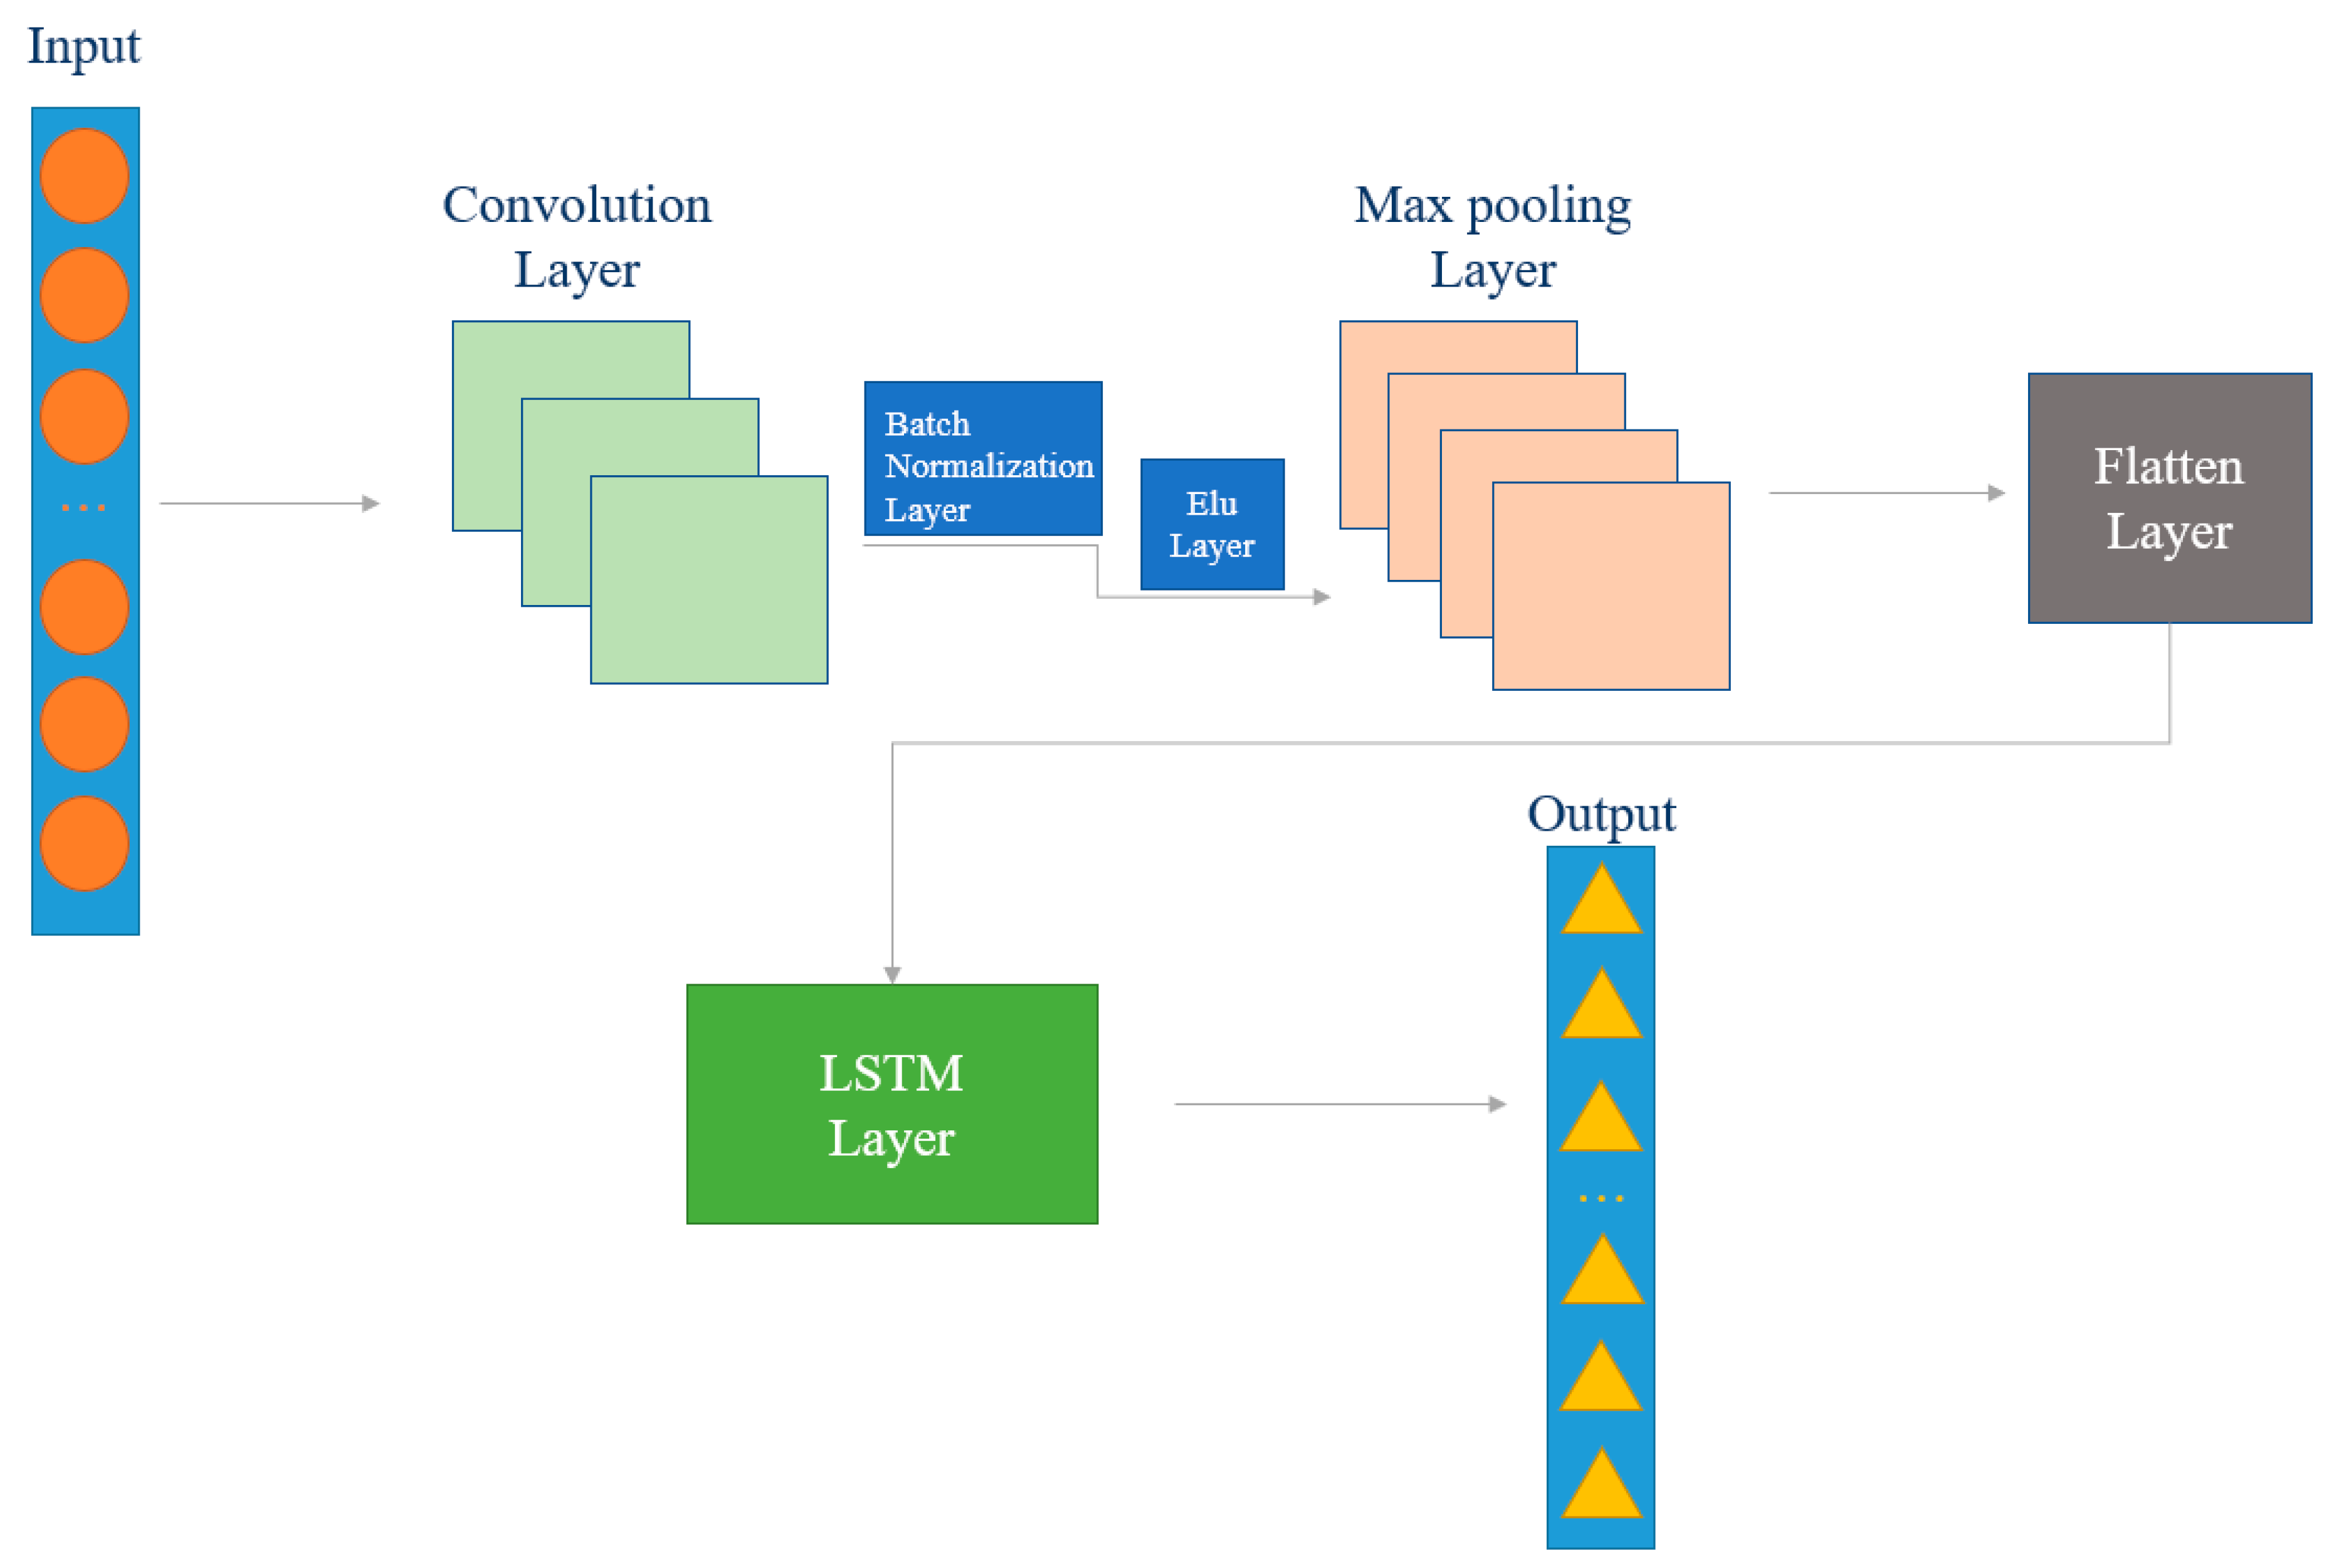
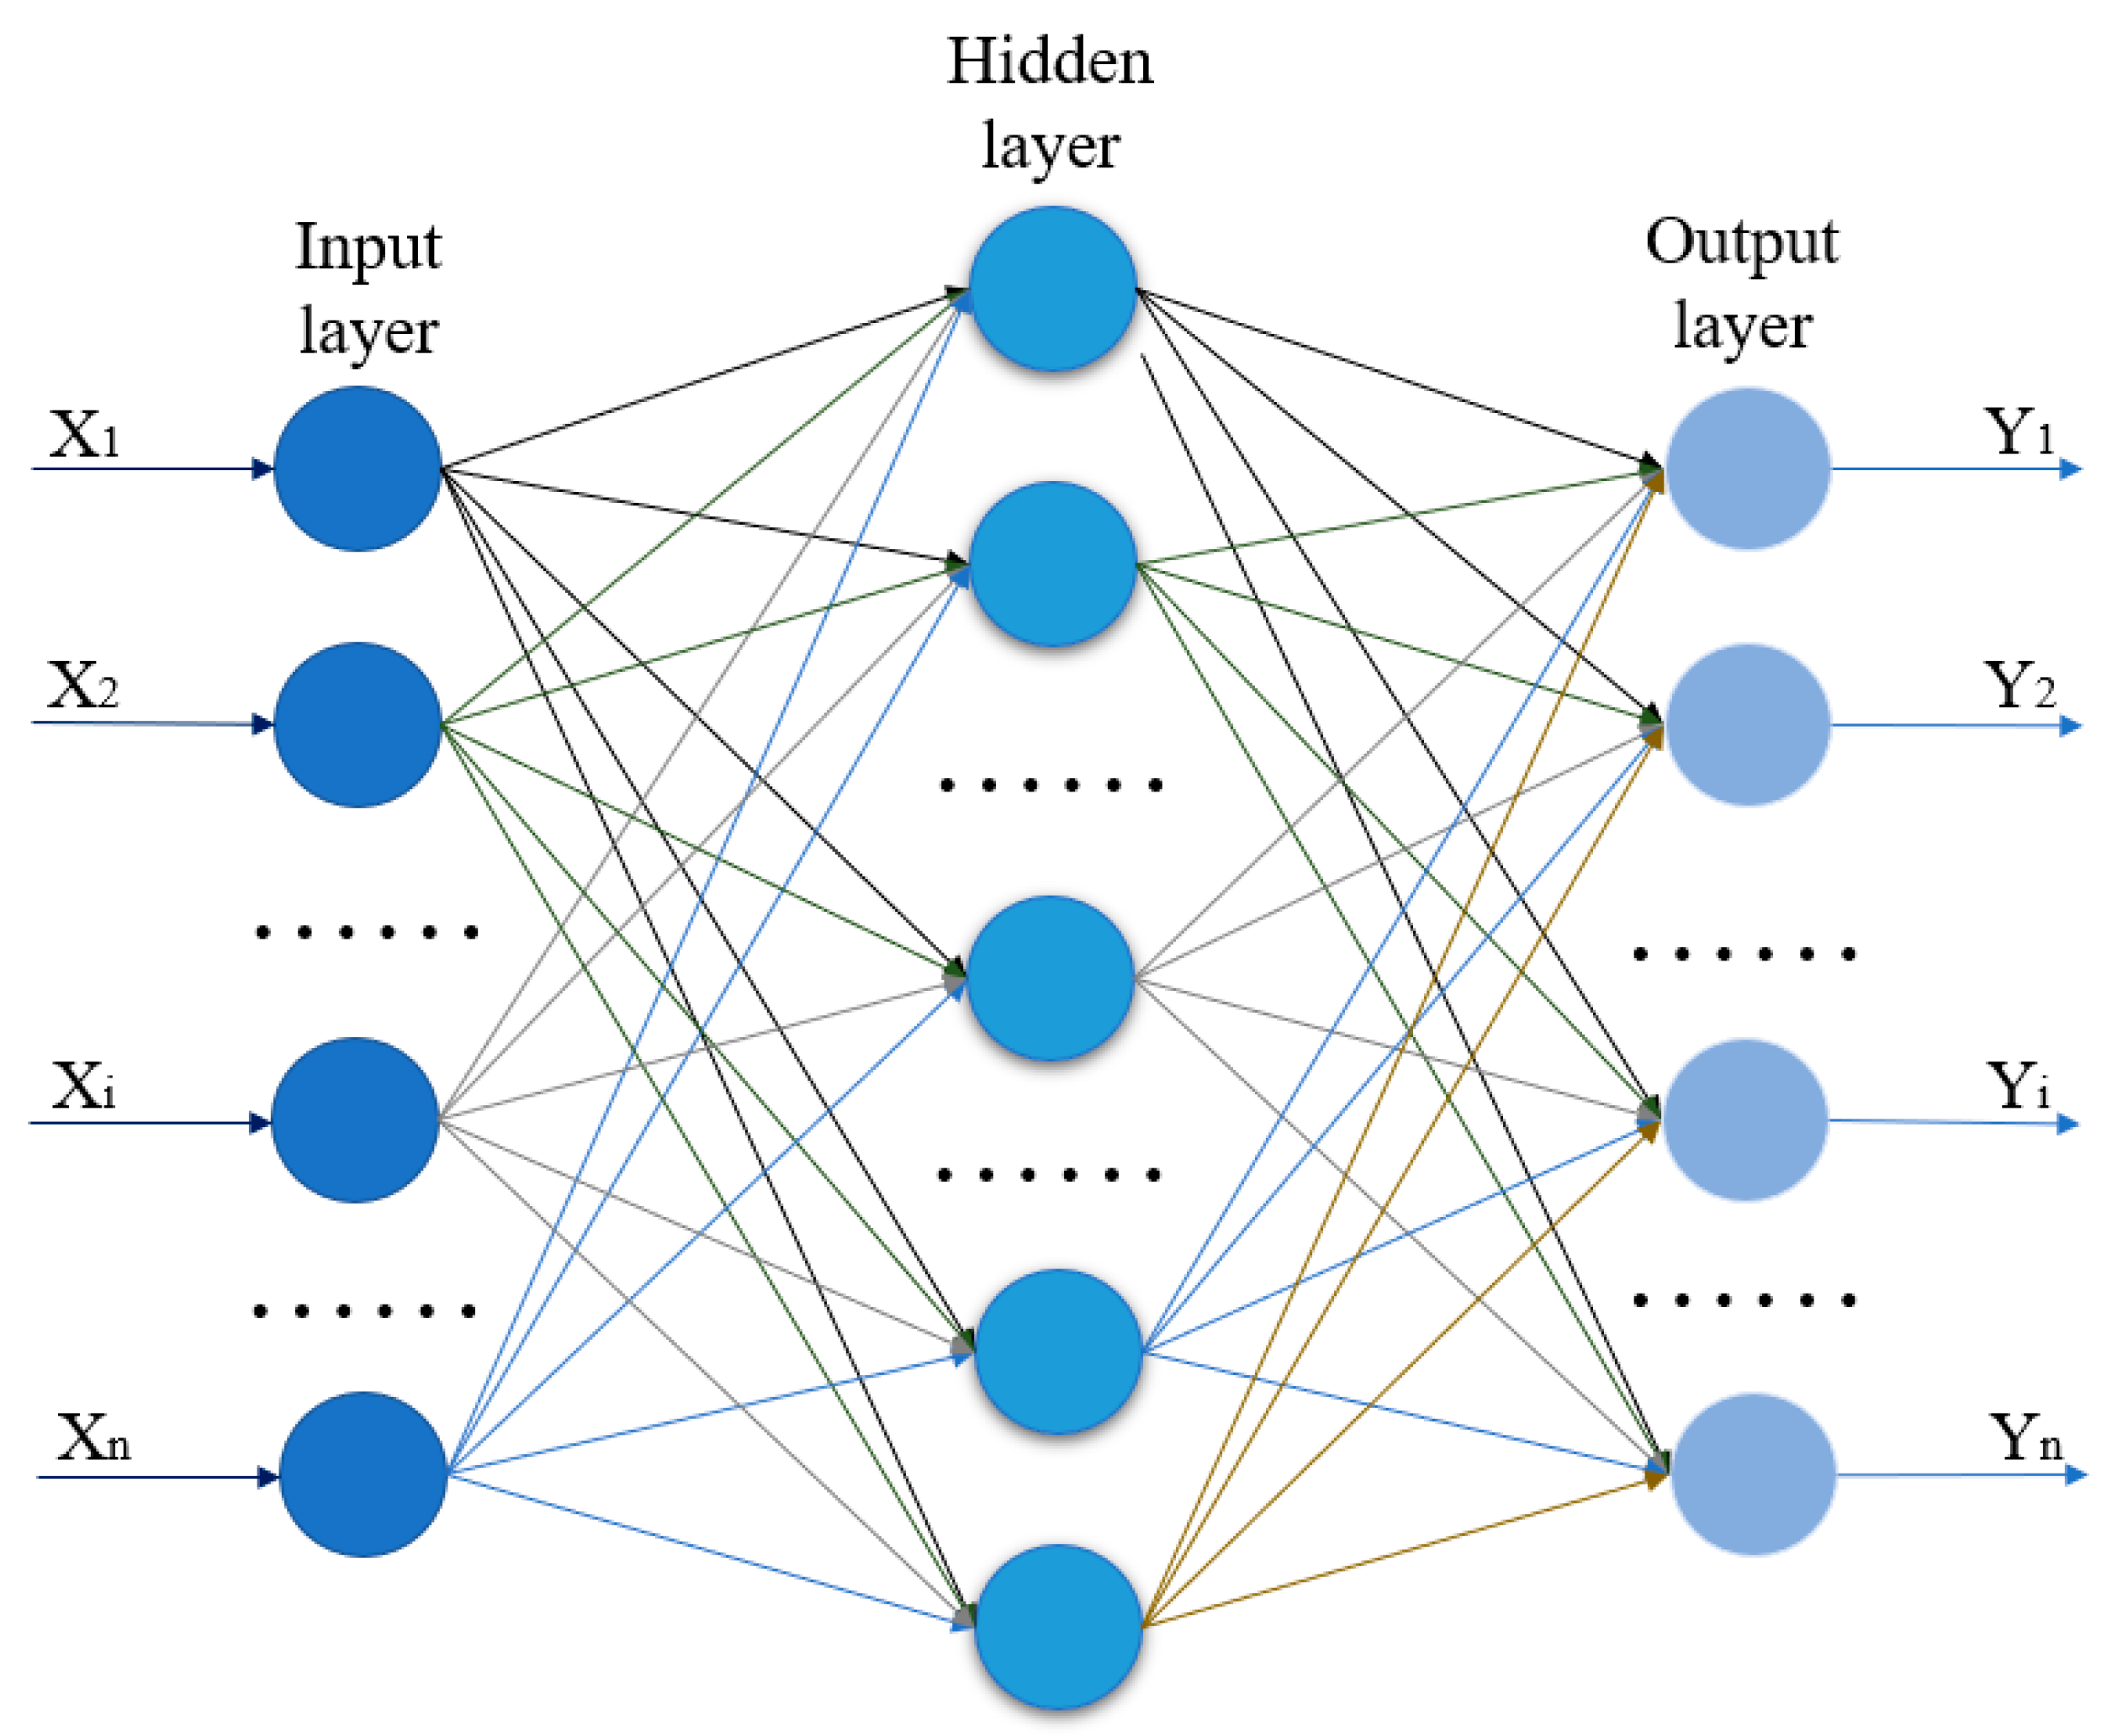
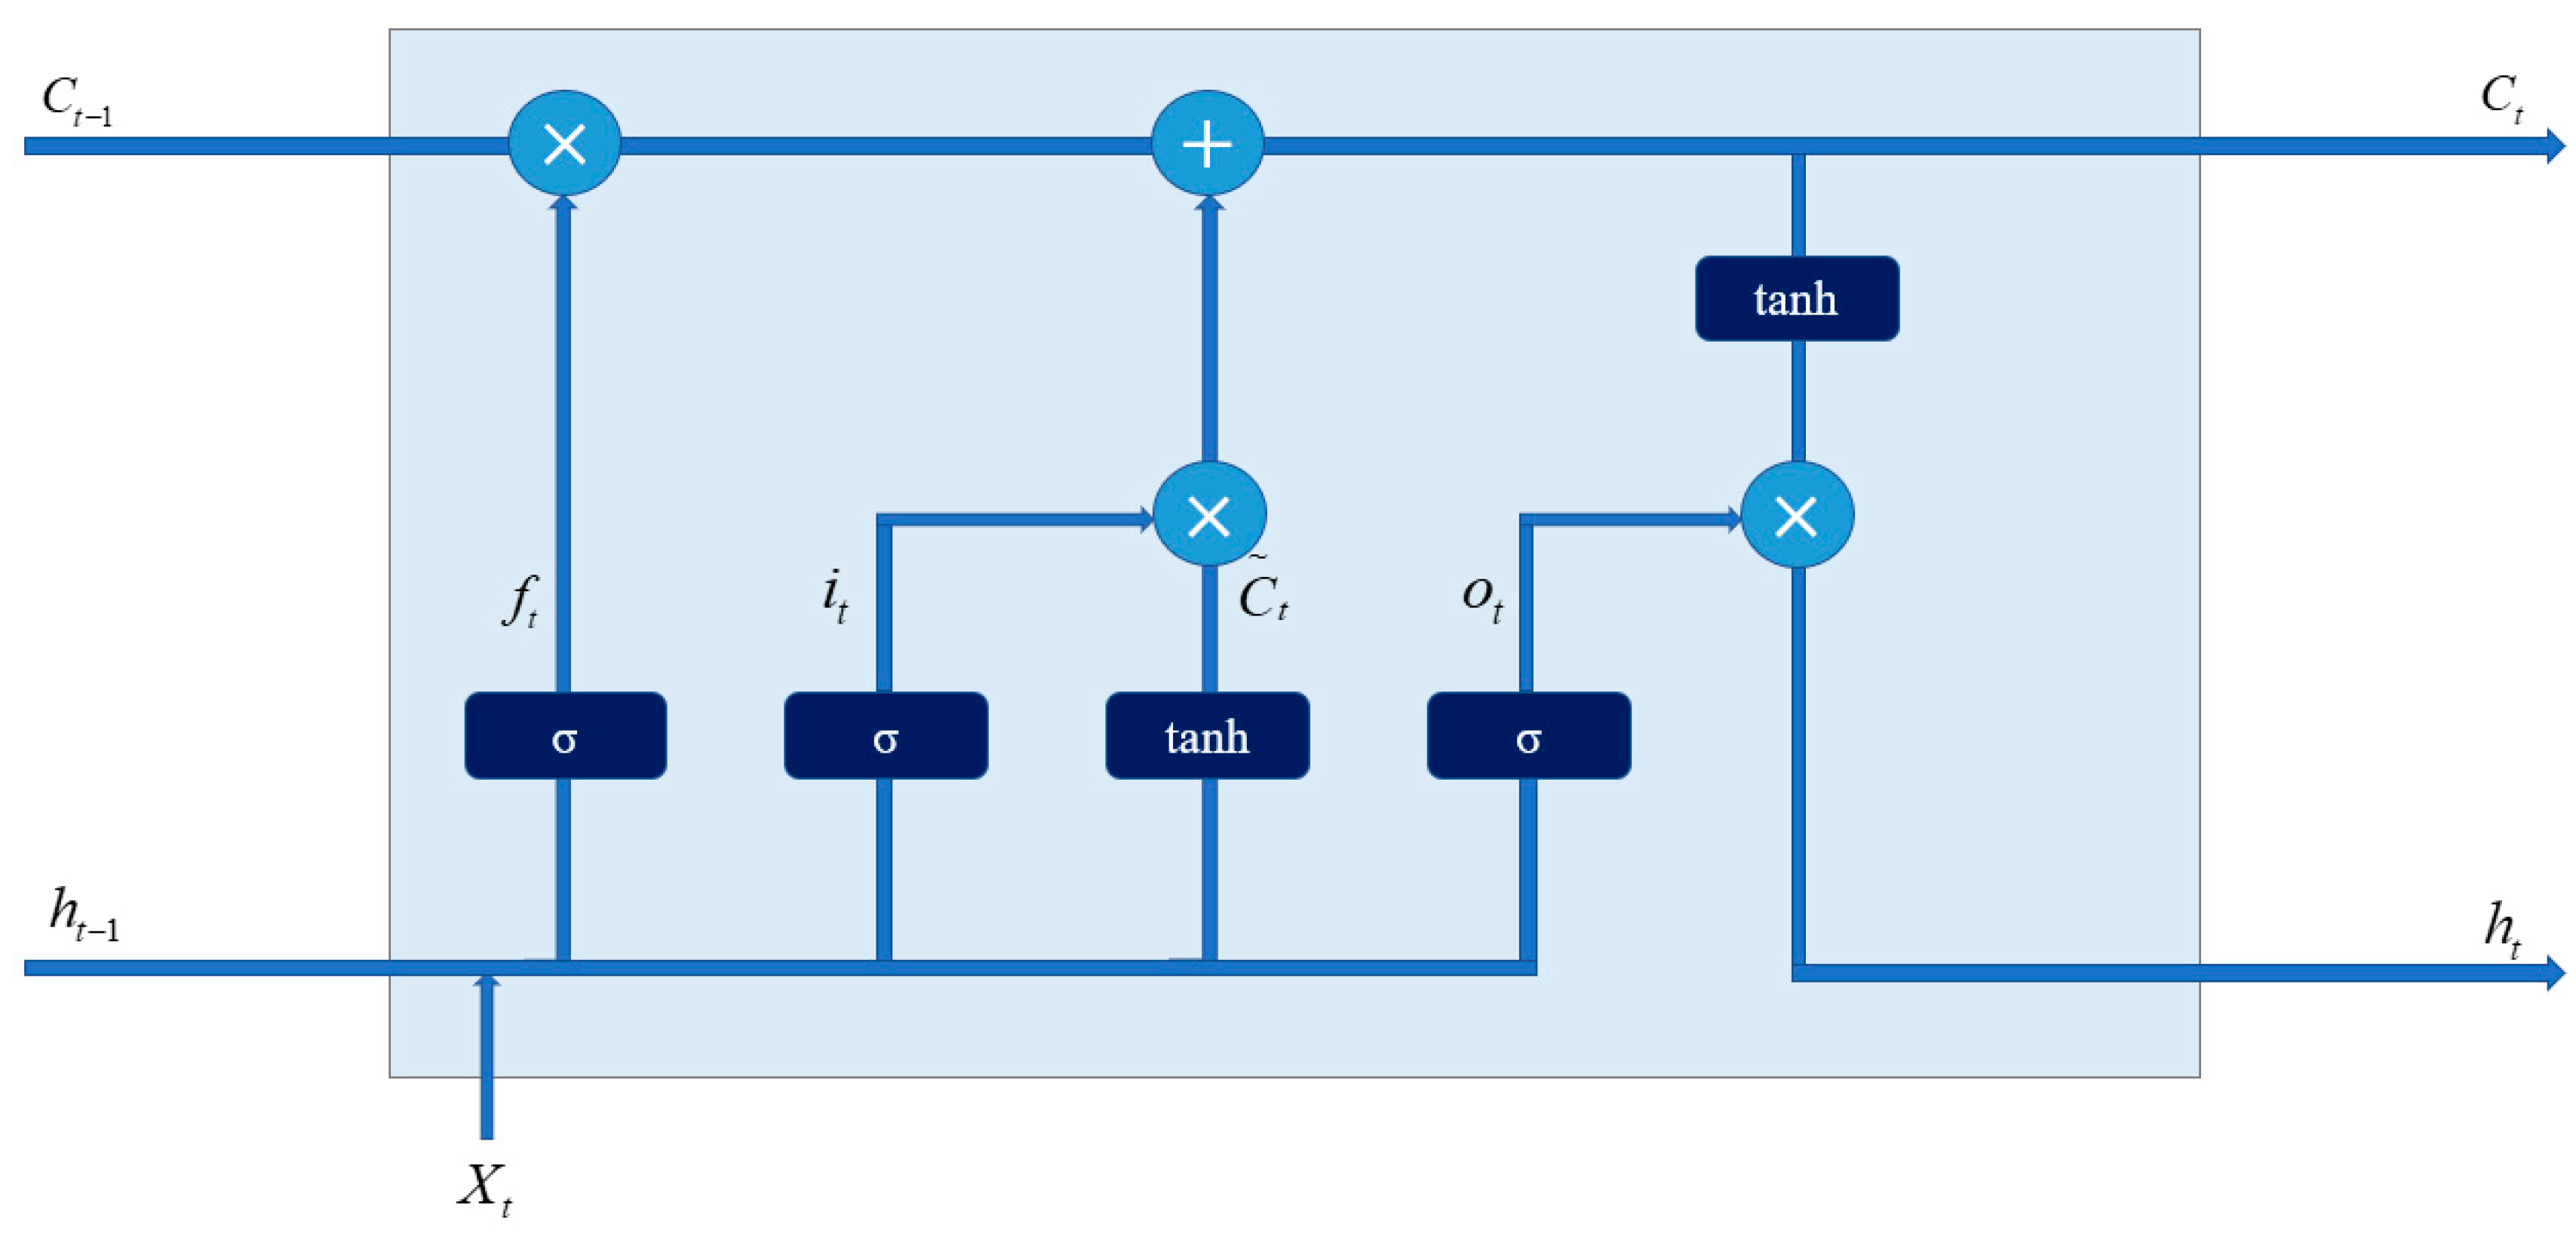
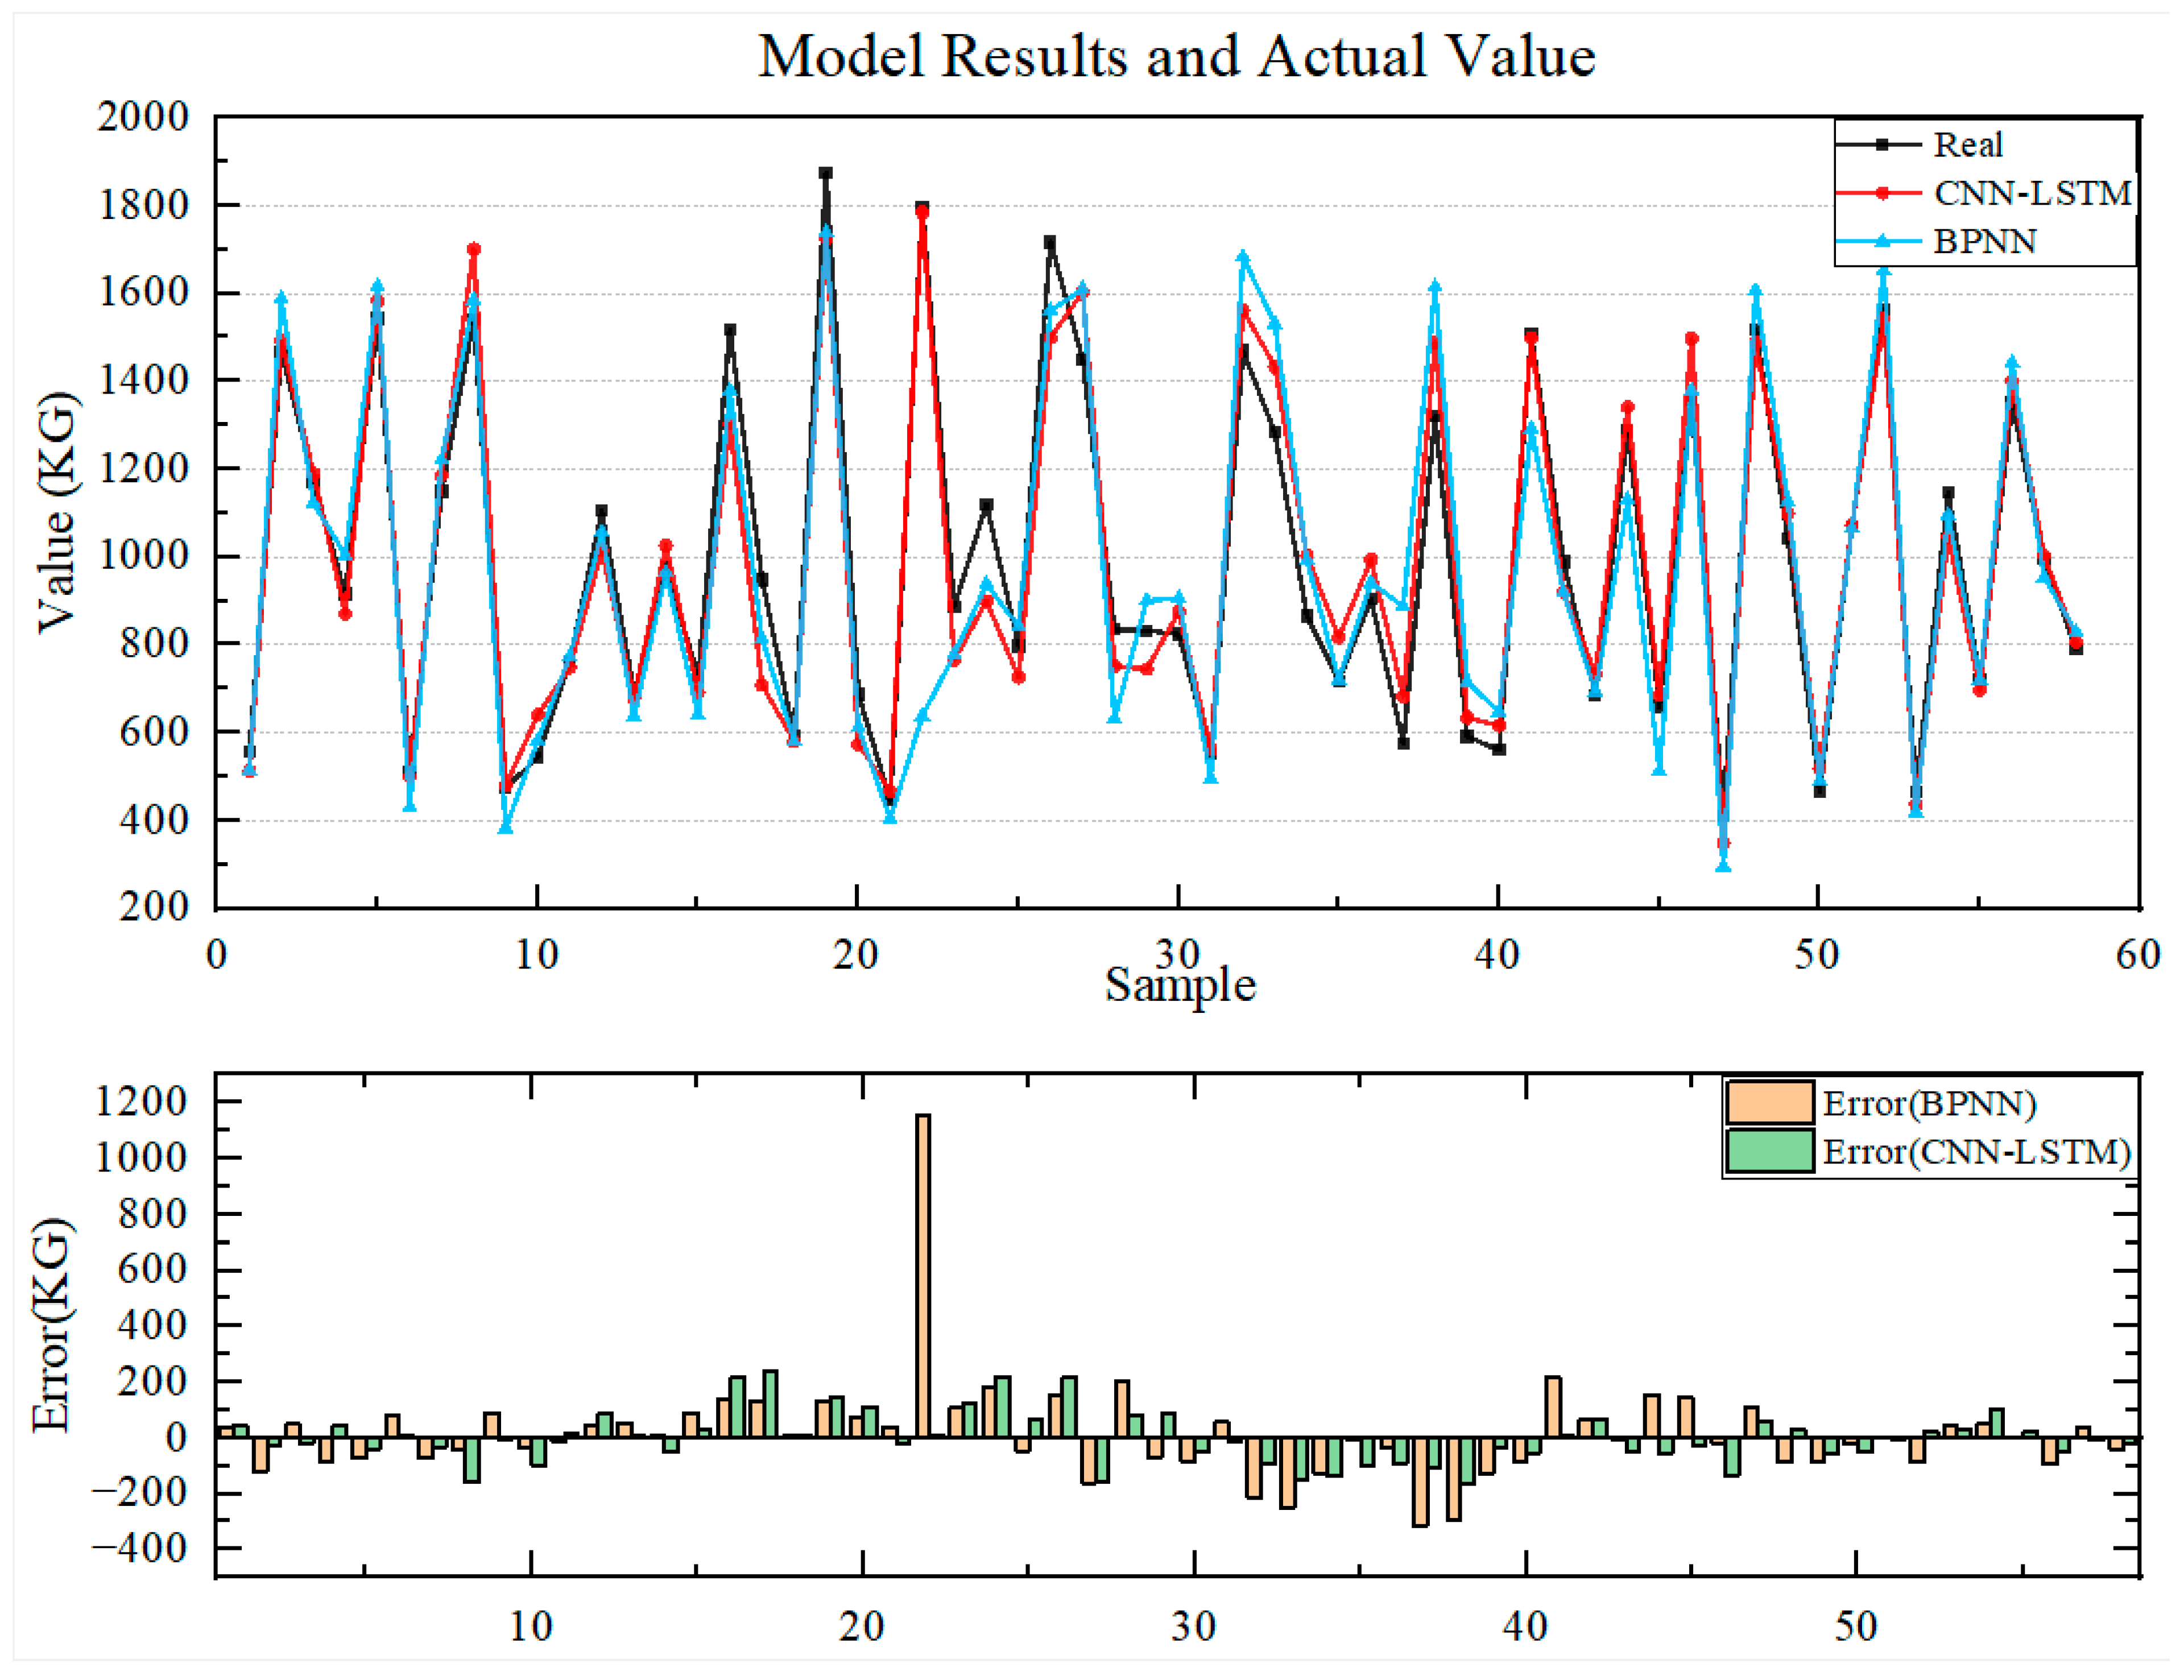
3.4. Neural Network
4. Conclusions
Author Contributions
Funding
Data Availability Statement
Conflicts of Interest
References
- Khan, H.; Weili, L.; Khan, I. Environmental innovation, trade openness and quality institutions: An integrated investigation about environmental sustainability. Environ. Dev. Sustain. 2021, 24, 3832–3862. [Google Scholar] [CrossRef]
- Dong, F.; Bian, Z.; Yu, B.; Wang, Y.; Zhang, S.; Li, J.; Su, B.; Long, R. Can land urbanization help to achieve CO2 intensity reduction target or hinder it? Evidence from China. Resour. Conserv. Recycl. 2018, 134, 206–215. [Google Scholar] [CrossRef]
- Liu, X.; Bae, J. Urbanization and industrialization impact of CO2 emissions in China. J. Clean. Prod. 2018, 172, 178–186. [Google Scholar] [CrossRef]
- Xu, B.; Lin, B. How industrialization and urbanization process impacts on CO2 emissions in China: Evidence from nonparametric additive regression models. Energy Econ. 2015, 48, 188–202. [Google Scholar] [CrossRef]
- Huang, L.; Krigsvoll, G.; Johansen, F.; Liu, Y.; Zhang, X. Carbon emission of global construction sector. Renew. Sustain. Energy Rev. 2017, 81, 1906–1916. [Google Scholar] [CrossRef] [Green Version]
- Zhang, Z.; Wang, B. Research on the life-cycle CO2 emission of China’s construction sector. Energy Build. 2016, 112, 244–255. [Google Scholar] [CrossRef]
- Seo, M.-S.; Kim, T.; Hong, G.; Kim, H. On-Site Measurements of CO2 Emissions during the Construction Phase of a Building Complex. Energies 2016, 9, 599. [Google Scholar] [CrossRef] [Green Version]
- Chen, J.; Shen, L.; Song, X.; Shi, Q.; Li, S. An empirical study on the CO2 emissions in the Chinese construction industry. J. Clean. Prod. 2017, 168, 645–654. [Google Scholar] [CrossRef]
- Choi, S.W.; Oh, B.K.; Park, J.S.; Park, H.S. Sustainable design model to reduce environmental impact of building construction with composite structures. J. Clean. Prod. 2016, 137, 823–832. [Google Scholar] [CrossRef]
- Kim, T.H.; Chae, C.U.; Kim, G.H.; Jang, H.J. Analysis of CO2 Emission Characteristics of Concrete Used at Construction Sites. Sustainability 2016, 8, 348. [Google Scholar] [CrossRef] [Green Version]
- Feng, W.; Wang, Y.; Sun, J.; Tang, Y.; Wu, D.; Jiang, Z.; Wang, J.; Wang, X. Prediction of thermo-mechanical properties of rubber-modified recycled aggregate concrete. Constr. Build. Mater. 2022, 318, 125970. [Google Scholar] [CrossRef]
- Tang, Y.; Wang, Y.; Wu, D.; Liu, Z.; Zhang, H.; Zhu, M.; Chen, Z.; Sun, J.; Wang, X. An experimental investigation and machine learning-based prediction for seismic performance of steel tubular column filled with recycled aggregate concrete. Rev. Adv. Mater. Sci. 2022, 61, 849–872. [Google Scholar] [CrossRef]
- Xu, J.; Guo, C.; Chen, X.; Zhang, Z.; Yang, L.; Wang, M.; Yang, K. Emission transition of greenhouse gases with the surrounding rock weakened–A case study of tunnel construction. J. Clean. Prod. 2018, 209, 169–179. [Google Scholar] [CrossRef]
- Xu, J.; Guo, C.; Yu, L. Factors influencing and methods of predicting greenhouse gas emissions from highway tunnel construction in southwestern China. J. Clean. Prod. 2019, 229, 337–349. [Google Scholar] [CrossRef]
- Rodríguez, R.; Pérez, F. Carbon foot print evaluation in tunneling construction using conventional methods. Tunn. Undergr. Space Technol. 2021, 108, 103704. [Google Scholar] [CrossRef]
- Kaewunruen, S.; Sresakoolchai, J.; Yu, S. Global Warming Potentials Due to Railway Tunnel Construction and Maintenance. Appl. Sci. 2020, 10, 6459. [Google Scholar] [CrossRef]
- Guo, C.; Xu, J.; Yang, L.; Guo, X.; Liao, J.; Zheng, X.; Zhang, Z.; Chen, X.; Yang, K.; Wang, M. Life cycle evaluation of greenhouse gas emissions of a highway tunnel: A case study in China. J. Clean. Prod. 2018, 211, 972–980. [Google Scholar] [CrossRef]
- Sun, H.; Park, Y. CO2 Emission Calculation Method during Construction Process for Developing BIM-Based Performance Evaluation System. Appl. Sci. 2020, 10, 5587. [Google Scholar] [CrossRef]
- Ren, F.; Long, D. Carbon emission forecasting and scenario analysis in Guangdong Province based on optimized Fast Learning Network. J. Clean. Prod. 2021, 317, 128408. [Google Scholar] [CrossRef]
- Cabeza, L.F.; Rincón, L.; Vilariño, V.; Pérez, G.; Castell, A. Life cycle assessment (LCA) and life cycle energy analysis (LCEA) of buildings and the building sector: A review. Renew. Sustain. Energy Rev. 2014, 29, 394–416. [Google Scholar] [CrossRef]
- Chau, C.-K.; Leung, T.M.; Ng, W.Y. A review on Life Cycle Assessment, Life Cycle Energy Assessment and Life Cycle Carbon Emissions Assessment on buildings. Appl. Energy 2015, 143, 395–413. [Google Scholar] [CrossRef]
- Kloepffer, W. Life cycle sustainability assessment of products. Int. J. Life Cycle Assess. 2008, 13, 89–95. [Google Scholar] [CrossRef]
- Matthews, H.S.; Hendrickson, C.T.; Weber, C.L. The Importance of Carbon Footprint Estimation Boundaries. Environ. Sci. Technol. 2008, 42, 5839–5842. [Google Scholar] [CrossRef] [PubMed] [Green Version]
- Li, Q.S.; Li, L.; Bai, Y. CO2 emissions during the construction of a large diameter tunnel with a slurry shield TBM. In Proceedings of the WTC/ITA, Swiss Tunnelling Society, Geneva, Switzerland, 31 May–7 June 2013. [Google Scholar]
- Peng, W.; Sui Pheng, L. Managing the Embodied Carbon of Precast Concrete Columns. J. Mater. Civ. Eng. 2011, 23, 1192–1199. [Google Scholar] [CrossRef]
- Jin, Z. Method of analysis on energy consumption in construction period of Baihetan Hydropower Station. Water Resour. Hydropower Eng. 2013, 11, 34–36. [Google Scholar] [CrossRef]
- IPCC. 2006 IPCC Guidelines for National Greenhouse Gas Inventories; IPCC: Geneva, Switzerland, 2006; Volume 3, pp. 1–40. [Google Scholar]
- Fang, H.; Zhao, P.; Zhang, C.; Pan, W.; Yu, Z.; Cai, K.; Wang, C.; Wang, J.; Du, M.; He, W.; et al. A cleaner polyurethane elastomer grouting material with high hardening strain for the fundamental rehabilitation: The comprehensive mechanical properties study. Constr. Build. Mater. 2021, 318, 125951. [Google Scholar] [CrossRef]
- He, W.D.; Zhang, C. Research on Carbon Emission Evaluation of China’s Iron and Steel Industry. In Proceedings of the 4th International Conference on Industrial Economics System and Industrial Security Engineering (IEIS 2017), Kyoto, Japan, 24–27 July 2017. [Google Scholar]
- Zhao, J.; Kou, L.; Jiang, Z.; Lu, N.; Wang, B.; Li, Q. A novel evaluation model for carbon dioxide emission in the slurry shield tunnelling. Tunn. Undergr. Space Technol. 2022, 130, 104757. [Google Scholar] [CrossRef]
- Kim, T.-Y.; Cho, S.-B. Predicting residential energy consumption using CNN-LSTM neural networks. Energy 2019, 182, 72–81. [Google Scholar] [CrossRef]
- Pak, U.; Ma, J.; Ryu, U.; Ryom, K.; Juhyok, U.; Pak, K.; Pak, C. Deep learning-based PM2.5 prediction considering the spatiotemporal correlations: A case study of Beijing, China. Sci. Total. Environ. 2020, 699, 133561. [Google Scholar] [CrossRef]
- Huang, C.J.; Kuo, P.H. A Deep CNN-LSTM Model for Particulate Matter (PM2.5) Forecasting in Smart Cities. Sensors 2018, 18, 2220. [Google Scholar] [CrossRef] [Green Version]
- Matias, T.; Souza, F.; Araújo, R.; Antunes, C.H. Learning of a single-hidden layer feedforward neural network using an optimized extreme learning machine. Neurocomputing 2014, 129, 428–436. [Google Scholar] [CrossRef]


| Construction Processes | Equipment Names | Power (KW) |
|---|---|---|
| Shield excavation | Main drive of shield cutter | 3750 |
| Cooling blower | 4.4 | |
| Cooling water | 107 | |
| Jacks | 200 | |
| Hydraulic system | 148 | |
| Segment erector | 265 | |
| Synchronous grouting | 448 | |
| Air compressor | 207 | |
| Ventilation system | 60 | |
| Bridge cranes | 70 | |
| Flue sheet installation | 15 t bridge cranes | 45 |
| Ground assistant system | 20 t bridge cranes | 105 |
| 32 t bridge cranes | 77 | |
| Tunnel lighting | 40 | |
| Repair room | 70 | |
| Drainage pump | 62 | |
| Ground lighting | 54 | |
| Ventilation system | 154 | |
| Slurry circulation | P1.1(mud pump) | 1000 |
| P2.1(sludge pump) | 1000 | |
| P2.2–P2.6 pump (relay pump) | 1000 | |
| Slurry treatment | Shakespeare system | 1241 |
| Roller screen | 15 | |
| Washing and spraying | 154 | |
| Industrial pumps | 97 | |
| Shear pump | 55 |
| Model | MAE | MAPE | RMSE |
|---|---|---|---|
| CNN-LSTM | 90.1911 | 0.1031 | 115.7520 |
| BPNN | 110.1934 | 0.1310 | 190.1546 |
Disclaimer/Publisher’s Note: The statements, opinions and data contained in all publications are solely those of the individual author(s) and contributor(s) and not of MDPI and/or the editor(s). MDPI and/or the editor(s) disclaim responsibility for any injury to people or property resulting from any ideas, methods, instructions or products referred to in the content. |
© 2023 by the authors. Licensee MDPI, Basel, Switzerland. This article is an open access article distributed under the terms and conditions of the Creative Commons Attribution (CC BY) license (https://creativecommons.org/licenses/by/4.0/).
Share and Cite
Wang, Y.; Kou, L.; He, X.; Li, W.; Liang, H.; Shi, X. A Modified Process Analysis Method and Neural Network Models for Carbon Emissions Assessment in Shield Tunnel Construction. Sustainability 2023, 15, 9604. https://doi.org/10.3390/su15129604
Wang Y, Kou L, He X, Li W, Liang H, Shi X. A Modified Process Analysis Method and Neural Network Models for Carbon Emissions Assessment in Shield Tunnel Construction. Sustainability. 2023; 15(12):9604. https://doi.org/10.3390/su15129604
Chicago/Turabian StyleWang, Yibo, Lei Kou, Xiaoyu He, Wuxue Li, Huiyuan Liang, and Xiaodong Shi. 2023. "A Modified Process Analysis Method and Neural Network Models for Carbon Emissions Assessment in Shield Tunnel Construction" Sustainability 15, no. 12: 9604. https://doi.org/10.3390/su15129604