1. Introduction
During the operation of solar power plants, dust and pollutants deposited on the surface of solar cells are an increasing problem. The effects of contaminants are multi-layered. On the one hand, it causes a shaded effect; hence, the electricity production of the panel is reduced due to the opacity. On the other hand, the internal resistance of the affected cell increases due to the shadow effect. As the resistance increases, the current flowing through it generates a Joule of heat, thus, heating the cell. Some contaminants have thermal-insulation properties; hence, the heat generated on the contaminated cells cannot be transferred to the environment. The temperature of shaded, contaminated cells can be up to 40–50 °C higher than that of clean cells, which can cause fire accidents [
1,
2]. This research examined the concentration at which each pollutant can cause a temperature rise and the extent to which the lifespan of permanently polluted panels decreases. Our previous studies were performed under laboratory conditions [
2]. The reduction in service life caused by permanent pollution was investigated using material testing and analysis of solar cells and pollutants from a functioning solar power plant.
Employees at the power plant reported that the production shortfall was consistently above 10%. It was even more observable when fuel preparation was taking place in the area adjacent to the solar power plant. Kazem et al. [
3] report that a photovoltaic (PV) system can lose more than 10% of its energy production ability if not cleaned monthly. The novelty of this study is that it presents the condition assessment of a large solar power plant, which works with 260 Wp panels of which more than a thousand solar cells have been dismantled and examined. We chose this power plant as the basis of the study because many similar power plants were built in Hungary in recent years, and it is essential to examine them to maintain their continuous, reliable operation in the future.
1.1. Presentation of the Power Plant and the Surface Contamination
The 10.044 MWp solar park in Hungary was built in the autumn of 2015 and connected to the grid in the spring of 2016. The power plant was built with 38,632 standard-sized (1.6 m
2) 260 Wp solar panels. In less than five years since its handover, it has been continuously observed that the performance of solar panels is greatly reduced. Based on the results of the electrical measurements, it was found that a solar panel numbering in the order of hundreds failed [
2]. Defective solar panels have been detected using flying drone [
4] and replaced after that. In addition to thermal camera measurements, flash tests and electroluminescence tests were performed on the dismantled panels to detect defects. The latter tests were performed on 1063 panels. All panels selected using thermography came from the area of the power plant that was close to the industrial park and the mixed fuel power plant. The purpose of the tests was to reveal the causes of the failure. During the operation of the power plant, it is also observed that a thick layer of dust is deposited on the surface of the solar cells. It is a basic assumption that the deposited dust layer reduces the service life of the solar cells, i.e., it causes/has resulted in the failure of the solar cells.
Figure 1 shows the environment of the affected solar park. It is well-observed that there is a thermal power plant in the immediate vicinity of the solar park, which increases the dust concentration of the ambient atmosphere through the emitted flue gas. In addition to the solar power plant, there is also an area with a dirt road and agricultural cultivation as well as an area used for the storage and processing of fuel for the thermal power plant. Agricultural cultivation, fuel storage and processing, and pollination of the road in daily use also increase the level of air pollution.
Figure 2a, taken on 29 October 2020, clearly shows the thermal power plant operating in the background, with the smoke it emits. As a result of the fuel change in the thermal power plant over the past decade, two biomass-fired plants are operated: one boiler is heated using wood chips and the other using baled herbaceous agricultural by-products. Baled herbaceous agricultural by-products are handled and stored directly next to the solar power plant, as shown in
Figure 2b (29 October 2020). If we look at the schematic image (
Figure 1), it also shows the dimensions of the area where the straw bales are handled. The storage direction is perpendicular to the rows of solar panels, which is very important for the wetting of solar panels. After all, the characteristic wind direction points from the bales to the solar cells; hence, the dust particles are blown towards the solar cells by the wind [
3,
5].
1.2. Damage to Solar Panels
There are three main factors that affect the loss of solar cells and the faster-than-natural reduction in their lifespan. These factors are, on the one hand, construction losses, on the other hand, design and installation problems, and, thirdly, operational problems.
In addition to the maximum efficiencies caused by technology and material use, external factors during the use of finished solar cells can also reduce the efficiency of the modules. Contaminated cells, temperature, and load can be classified under these environmental conditions.
Solar modules require almost no maintenance, but the efficiency and longevity-reducing effect of surface contamination during their operation cannot be neglected. The annual electricity loss can be significant, reaching a global average of 17%, and in extreme pollution (e.g., desert environments) up to 50–70% [
3,
5]. The temperature of the solar cells can increase significantly due to the Joule heat generation caused by the temporary increase in resistance and the contaminant acting as a thermal insulation layer. Characterizing the process is not easy as it is influenced by many factors. In the following sections, the paper presents the most important parameters that give a correlation between the surface contamination of the solar cell and the deterioration of the efficiency and the reduction of the service life.
2. Forms of Deposits on the Surface of the Solar Cell
The effect of local contamination (e.g., bird droppings) on the performance of solar cells should not be neglected. In the case of crystalline solar cells, the existence of this type of contamination is even more critical as the efficiency of a unit consisting of cells connected in series is significantly reduced by the spot-like contamination of a cell [
6].
The most common pollutants in nature:
Bird droppings;
Dust, pollen, sand, and soil particles;
Leaves, stems of plant origin, and pieces of material adhering to the surface of the solar cell.
Surface impurities due to human activities:
Deposition of air pollutants during the operation of industrial plants;
Soot and fly ash from residential heating;
Dust from agricultural or other human activities;
Dirt from road traffic (for example, rubber debris and soot).
Dust or other contaminants covering the entire surface of the solar cell also have a detrimental effect on the proper operation of the solar cell. These deposits can accumulate on top of each other due to improper cleaning, forming an increasingly thick and durable “cover” layer over the useful surface of the solar cell over the years, and over time it can incorporate and diffuse into the surface of the solar panel glass, changing its structure.
Accumulation of contaminants can be particularly significant in the corners as the cleaning effect of rain and wind [
3] is not sufficiently pronounced on these surfaces. Thick deposits can also cause cells to overheat because they act as thermal insulators. If a cell is damaged, the cells connected in series with it can also lose power, reducing the efficiency and life of the solar cell.
As the dust deposited on the surface of the solar cell comes into direct physical contact with the solar cell, in addition to the shadow effect, it also raises thermal insulation problems that are not precisely known in advance and change dynamically and are, therefore, difficult to quantify [
7]. The real effects can determined experimentally in the first place.
The most common pollutant in Hungary is particulate matter. Approaching the Equator, desert sand is the biggest problem, while in big cities, air pollutants from traffic are the biggest problem. Occasionally, the so-called transports also appear to be a problem. As there are significant differences in the particle size, density, and light transmittance of each pollutant source, their effects on solar cell production also vary widely. In Europe, pollution can cause up to 5–20% production loss per year. In a desert environment, after a sandstorm, the productivity of solar panels can decrease by 75–90%.
Some contaminants, such as sand, also exert a scratching, abrasive effect on the surface of the solar cell in terms of shape and hardness, resulting in a change in surface structure and a permanent loss of efficiency. It is not advisable to remove them using dry cleaning methods. For such contaminants, the use of water or special cleaning fluid is recommended [
3].
In addition to electrostatically adhering to the surface of the solar cell, soft particulate materials are able to diffuse into the structure of the glass or resin covering the solar cell. As a result, the surface grooves may disappear, but this may also cause the glass sheet to discolor. A significant amount of dust is drained from the surface of the solar cell after rain. However, it can become congested at the corners of the solar cell and form a muddy layer. This can lead to further problems, primarily overheating. Flying dust is a bigger problem for plant-derived residues, such as tree leaves, and animal products, such as bird droppings. If only a small part of the solar cell becomes dirty and the whole cell is not shaded, the bypass diodes will not activate, and the hotspot phenomenon may develop, causing irreversible damage to the solar cell in the long run.
As the cell exposed to the shadow acts as a heating resistor during shielding, the current flowing through it generates additional (Jolule) heat. The contaminant blocks the emission of this heat; therefore, the cell overheats [
7,
8]. Local overheating can cause the cells to burn out, affecting the operation of the entire solar panel. The current, voltage, and power of the panel are reduced along with its efficiency and, of course, its lifespan [
9].
If more than one cell inside a panel burn out, it can lead to panel failure, and its replacement is inevitable. Therefore, it is advisable to remove these contaminants as soon as possible. Removing bird droppings is the most difficult task. They can only be removed effectively using solar cell cleaning fluid or high-pressure softened water. Very hard water leaves limescale stains on the surface of the solar cell after drying, which can also reduce panel performance. The cleaning of the solar cell is not always ensured by the rain. Usually, precipitation of less than 9–10 mm only smears the pollutants, which is why different methods have been developed for cleaning the solar cells depending on the size of the power plant [
3,
7]. These range from small robots to cleaning vehicles [
3]. Although it has been calculated that mechanized cleaning of solar cells is more costly than the loss of revenue due to loss of production caused by dusty solar cells, it may be necessary to periodically carry out mechanized cleaning depending on the environmental conditions of the installation in order to avoid a reduction in service life.
Experience has shown that the particle size, density, and composition of the pollutant are relevant to the change inefficiency. The following section provides examples of the effects created by each substance.
3. Materials and Methods
It was important to create the proper lighting conditions to perform the measurement. The light spectrum and irradiance and distribution of natural light are very difficult to simulate. Lighting can be divided into different classes according to the homogeneity of the light intensity distribution, which is defined in IEC 60 904-9 (Sun Simulator Performance Requirements). A tolerance of up to ±10% is allowed for type C devices. Under normal lighting conditions, the irradiance in nature is between 900 and 1100 W/m
2 [
10,
11]. The reflectors available with us did not meet the criteria required by the standard; therefore, the spectral energy density deviations were taken into account with a constant factor. We are currently working on the development of a new type of simulator for more accurate measurements.
In the measurement setup: the maximal intensity E
max = 1168 W/m
2, the minimal intensity E
min = 583 W/m
2, and the inhomogeneity of illumination ΔE = 48.1%. The median intensity is 896 W/m
2, and the modus intensity is 1000 W/m
2. The power of the light is 1440 W [
12,
13].
The significant inhomogeneity is caused by the drastic reduction in the light intensity in the corners of the illuminated surface. However, let us look at the light intensity distribution exhibited. It is clear that this surface is a tiny fraction of the effective surface; therefore, the homogeneity of the light intensity distribution is more satisfactory for the remainder of the solar panel.
The average light intensity per solar panel (integrated mean value) can be calculated according to the value of the light intensity per cell and the area of one cell from the previously determined real light intensity distribution matrix elements [
12].
In the measurement setup, the average intensity is E
average = 921 W/m
2. This is slightly below the maximum 1000 W/m
2 in nature. This light intensity value corresponds to the value of light intensity on a slightly cloudy day. The spectral composition of the halogen sun simulator significantly differs from that of natural sunlight [
14]. The constant of the difference in the light spectral composition is 0.532 [
12,
13]. With a halogen reflector solar simulator compared to natural sunlight, the measured current is 53.2% of the real one. This must be taken into account for the measured current values.
The solar panel (Renesola, JC250M-24/Bb, Renesola Co., Ltd., Changzhou city, China) was placed on a table of the same size as during the measurement.
Figure 3 depicts the composition measurements.
Table 1 shows the parameters of the solar panel. The voltage and current of the solar panel were measured at the same time using a METRIX MX-59HD digital multimeter.
The new polycrystalline solar panel was tested during the laboratory measurements, which charged a battery and was controlled by maximal power point tracker (MPPT). This panel was illuminated by twenty-six halogen reflectors, which cause a significant heating effect. Before the investigations, the surface temperature of the panel increased from 23 °C to 70 °C in 20 min. This warming up process eliminated the effect of the temperature transient phenomenon. After that, the tests could begin in 20 min. In the next step, the concentration of the dust on the surface was increased in 2 g portions up to 32 g/panel (19.6 g/m
2) concentration (
Figure 4). Before the start of the test, the impurities were ground and sieved to the same grain size. This was necessary to make it possible to compare the various pollutants as easily as possible and to compare them as closely as possible with the real deposits. Contaminant doses were measured with a Voltcraft PS-200B jewelry scale. Four materials were tested: soil, sawdust, leaves, and straw. Details of the applied pollutants are given in
Table 2. Our basic assumption is that the small and low density contaminants will result in higher coverage, resulting in a greater loss of solar cell production because it is more easily transported by air movement. Furthermore, the temperature increase is expected to be more significant for materials with high-heat capacity and low-thermal conductivity. The maximum particle size for all pollutants was less than 0.5 mm.
4. Results
4.1. Laboratory Tests to Detect the Direct Effect of Contaminants
The temperature of the solar panel’s surface was measured using a two-piece four-channel YC-747D digital thermometer. The eight sensors were placed on eight different parts of the solar panel.
Figure 5 shows the changes in the average of the eight values as a function of the concentration of different contaminants. The ambient temperature on average was 22 °C. Overall, it can be observed that all contaminants resulted in an increase in temperature. Straw and sawdust contaminants increased the temperature to a greater extent than soil and leaves. We attempted to replicate the dirt deposition pattern observed in the power plant. The thickness of the dirt layer was the same as the grain size, and in some places, there was a build-up on the glass surface and in the corner with a thickness of 1–2 mm.
Figure 6 shows the heating effect of the surface contamination. Hotspots occur under the deposited dirt. The thermal insulation layer produced by the significant amount of dirt causes a further temperature increase. Due to surface contamination, the resistance of the photovoltaic cells increases; therefore, the effect of Joule heat can be observed.
The most significant decrease in performance was caused by leaves, which was a decrease of around 13.5%. In the case of straw contamination, the largest decrease was 13.3% and around 11.8% in case of sawdust. The soil pollutant did not result in such a significant reduction (9%) as in the case of organic pollutants. This can be explained by the fact that the density of the soil is much higher than that of the organic pollutants; thus, they were able to disperse on a much larger surface, causing a greater current drop. The large fractures shown in the power drop diagrams (
Figure 7) indicate the time of MPPT intervention. This intervention can be observed at 16 g/panel concentration in the case of leaves, at 22 g/panel concentration in the case of straw, and at 24 g/panel concentration in the case of sawdust. In the case of soil, this phenomenon cannot be observed. Before the control intervention, the common decrease in performance was around 6%. This reduction in power is a significant loss for the entire solar power plant.
The main cause of abrupt changes in power values is the change in current. The MPPT attempts to maintain the voltage constant. However, the current decreases because of the surface contaminants (
Figure 8). When this decline reaches a critical level, the MPPT will look for a new operating point. According to a study by Saidan et al. [
15] and Hachicha et al. [
16], the current–voltage (I–V) relation for PV panels is influenced by dust. The measured temperature increase approximates well the results of other research methods [
17,
18], and in case of power loss reduction, similar scale results were presented in several studies [
19,
20]. Fountoukis et al. [
21] proved that PV performance ratio decreased as a function of increasing deposited aerosol mass at a solar test facility in Qatar. Furthermore, research by Pan et al. [
22] shows a correlation between dust deposition for different glass cases and PV efficiency reduction.
This control mechanism occurred when straw dust reached a concentration of 24 g/panel. If we observe the I–V curve of the solar cells, we can infer that as the current decreases, the voltage increases slightly (
Figure 8). In the new operating point, to which this new I–V value pair belongs, the panel still produces energy in an ideal condition, but the filling factor is lower. As a result, active performance (P) is significantly reduced (
Figure 7) as well as the energy that can be stored in the battery also decreases. The voltage used to charge the battery is kept at the same level by the circuit, but the charging current decreases to the same extent as the PV current.
4.2. In Situ Detection of Damage by Thermal Camera Test
One method of the so-called in situ assessment of solar cells without disassembly and intervention is fault identification with thermal imaging. The principle is based on the fact that the contact, transient or permanent resistance of the solar cell is higher than that of intact cells, dots, and surfaces in failure points caused by surface damage, shadow effects, and cell damage/burnout. At higher resistance, the Joule heat released by the flowing currents further heats the faulty (damaged or contaminated) cells; therefore, the individual sources of fault can be well-separated on the solar panel. This is called the hotspot phenomenon.
Manufacturing defects usually occur as microcracks that are intergranular or at the solder joints and cause only temporary resistance in the heat zone, which is short-ranged; hence, overheating is only local, i.e., the temperature distribution varies within a cell. The shadow effect is usually larger and even; therefore, it causes only a small amount of temperature difference within a cell. The shadow effect can result from installation and operation problems.
A temperature difference of 15 °C can occur inside a solar panel even when completely intact. The temperature difference is influenced by a number of factors, such as the nature of the installation, the characteristic wind direction, and its distribution. A larger temperature difference can only occur if there are cells inside the panel that have been damaged due to manufacturing, installation, or operating errors.
Figure 9a shows a large, nearly evenly distributed contamination as well as a dirt flow due to low-intensity rainfall. The cell at the highest point of contamination was certainly burnt out.
Figure 9b shows cell overheating and burnout due to vegetation shading.
Based on the thermal camera images taken in the examined solar power plant, we found more than 600 panels with a temperature difference of 15–30 °C in the temperature distribution. Furthermore, in about 150, a temperature difference of more than 30 °C was observed. According to the study by Vaishak et al. [
23], the temperature difference between clean and dusty panels can also be proven using thermal imaging under laboratory conditions because it is not possible to determine on the basis of the recordings the reason for the temperature difference measured on the solar cells. They can be local, i.e., they can be caused by a manufacturing defect or by installation or operational problems. According to the theoretical approach, if there are larger areas with higher temperatures instead of local ones, they can only result from installation or operational problems.
Self-shading, the most common installation problem, can only affect the panels at the bottom of each string row. The minimum distance between two rows can be determined as a function of the angle of inclination of the solar panels and their horizontal projection. As the angle made by sunrays at sunrise is the smallest in Hungary around the winter solstice, the distance between the individual string rows can be determined using the characteristic angle of incidence of 19.4°. The panels were installed at an angle of 30°. The distance between the first edges of the two string is 9.6 m. The distance between the rear edge of the first string and the front edge of the second string is 5.5 m. The panels are arranged in 4 rows (4 m) on the string, and the bottom row does not start directly from the ground (0.4 m). The total height of a string with mounting structure is 2.4 m. Taking these into account, a distance of at least 5.67 m should have been used; hence, in low sunlight, the lower cell row of the lowest panel rows will certainly be exposed to shade. The phenomenon of self-shading is especially common in the early morning and late evening periods when solar panels are exposed to low-intensity sunshine due to the angle of incidence. Therefore, they provide low power and often do not respect the theoretical distance between string rows. The power loss is not significant, but they do affect the life of the solar panels.
4.3. Material Testing
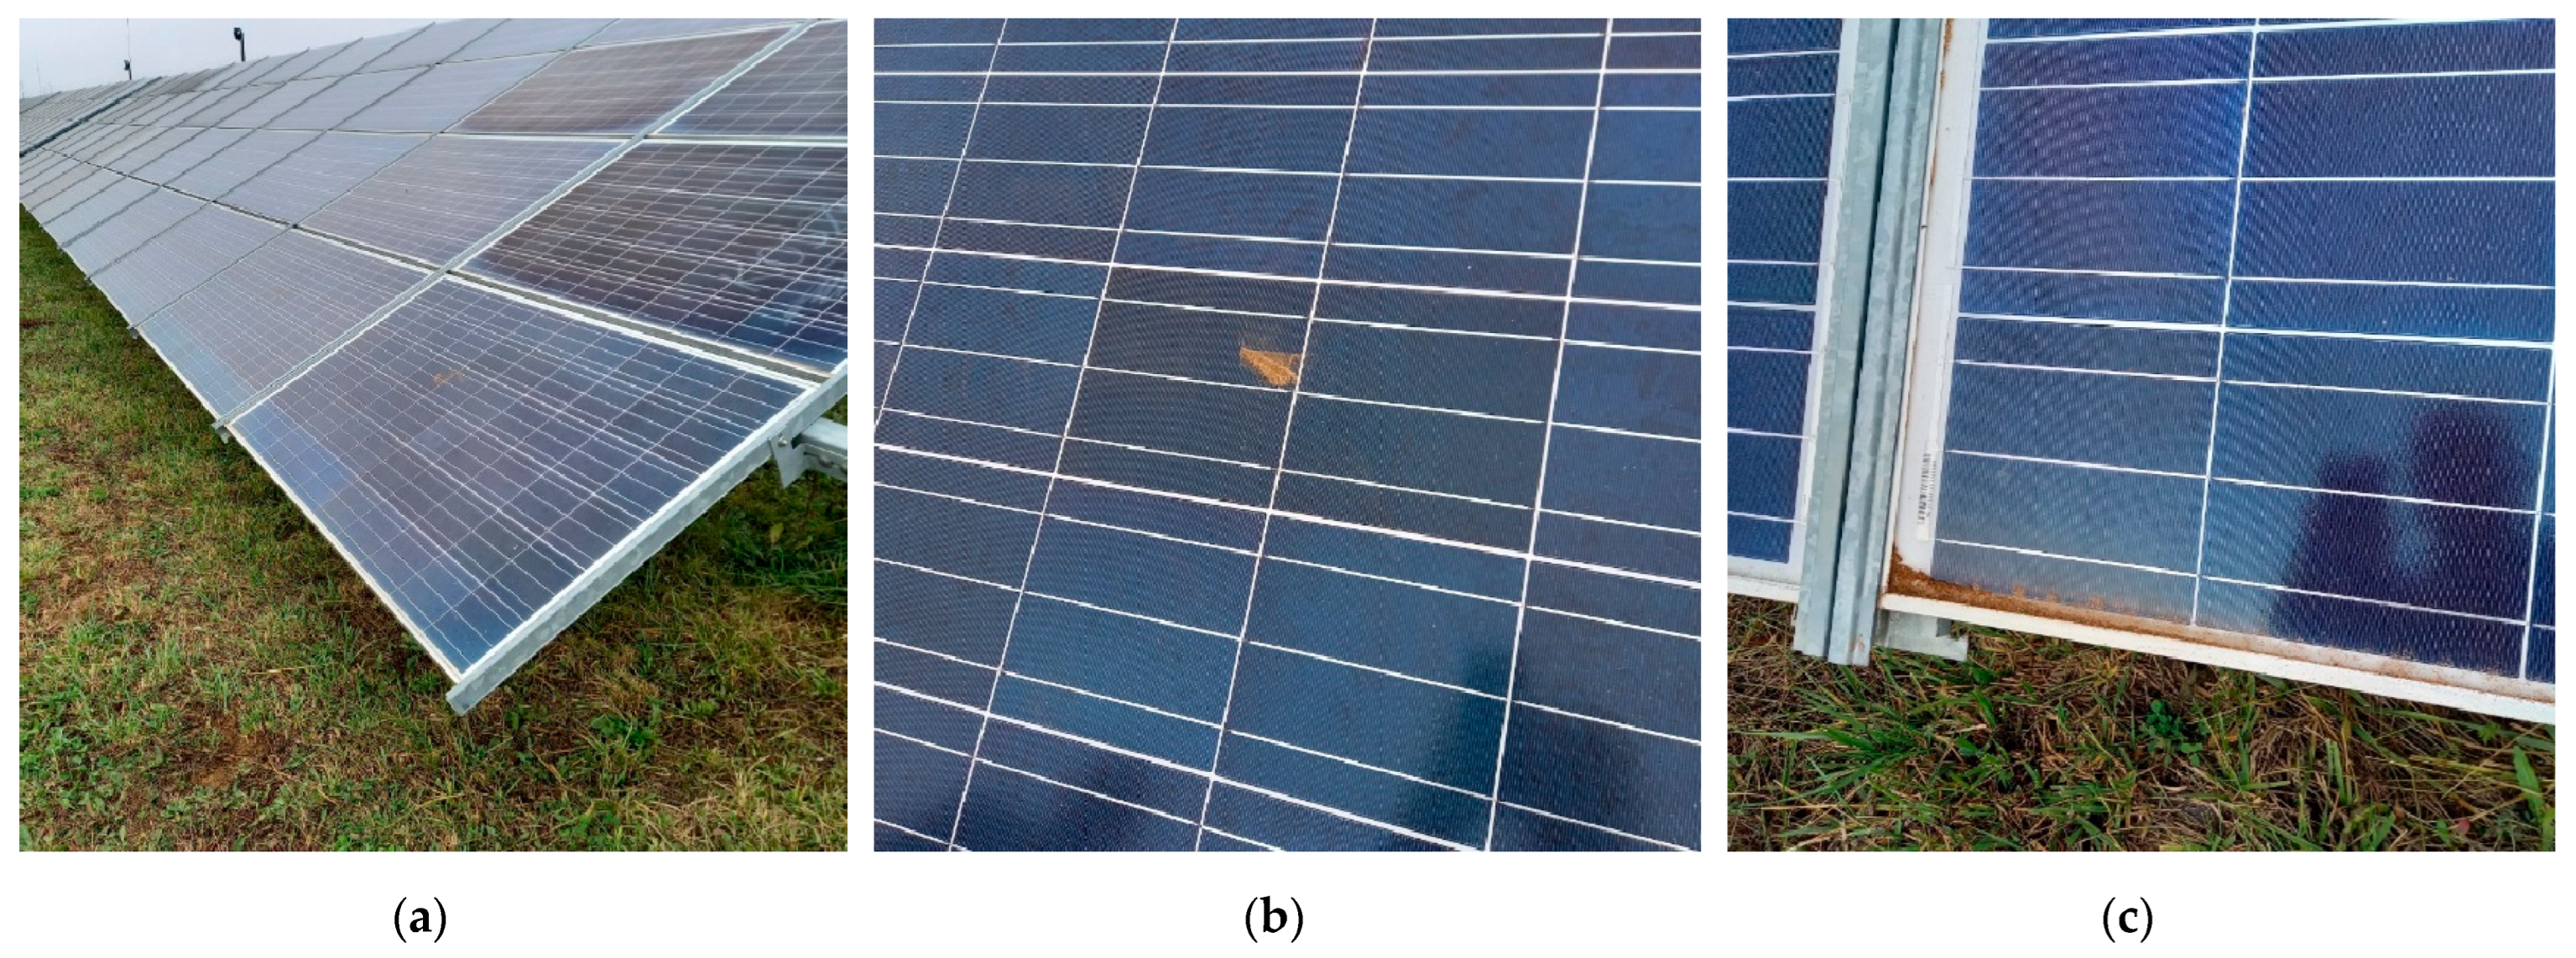
During the solar power plant park operation, large amounts of dust deposits and other surface dirt deposits were observed. Dirt deposited on the surface increases the resistance through the shadow effect on the one hand and forms a thermal insulation layer on the other hand; hence, the temperature of the solar cells increases, and the cells overheat and burn out. Thermal camera measurements were used to detect temperature increases, and dirt deposits were visually captured with a conventional camera. The presence of a contaminant on the surface of a solar cell is illustrated by way of example. In
Figure 10a, the word “dirt” was written on the dust deposited on the solar panel.
Figure 10b,c show a contaminant of plant origin. In
Figure 10c, due to the construction of the solar cells, the amount of contaminant is concentrated along the corner edges.
4.4. Powder Test
On 29 October 2020, dust samples were collected from the surface of the solar cells and the environment of the power plant. The amount of these dust samples was uniform, i.e., 1–1 cm
3.
Figure 11 and
Figure 12 illustrate the samples collected.
Stereomicroscopic images of the samples at 40× magnification. The top row of dry samples 1.–4. and moist samples 5.–8. was in the original state, while the bottom row includes the samples of the second row after drying. After drying, the granules disintegrated under slight pressure and assumed a similar state as the samples 1.–4.
The samples can be identified as dry debris of plant origin. The detected elements are C, O, Ca, Si, Al, Mg, Fe, Cu, and K (Ba), and the same material composition is present in each sample except for their intensity. Thus, it can be said that the samples collected from the surface of solar panels and the environment are the same based on the chemical analyses. This means that the dust deposited on the surface of the solar cells is not the so-called transport but comes from the immediate environment surrounding the solar power plant. Kazem et al. [
24] performed a similar analysis to test the effect of dust’s physical properties on photovoltaic modules.
A few days before sampling, on 24 October 2020, there was heavy rainfall (20 mm); however, they could collect 1 cm
3 of dust from the most polluted panel. The 2–3 mm amount of rain evaporates shortly after falling on the solar cell surface; hence, it cannot cause a cleaning effect. The amount of 4–5 mm of precipitation is also not enough to clean the solar cells. They just “rearrange” the distribution of dirt. Generally, a minimum of 9–10 mm of rain is required to truly clean solar panels. Liu et al. [
25] also considered the effect of rain and meteorological conditions during the examination of the spectral transmittance reduction of the PV covering glass caused by dust deposition.
From 4 November 2019 to 28 October 2020, precipitation data characteristic of the immediate vicinity of the solar park were retrieved. In the vicinity of a solar power plant, on an average, in every 11 days, there is an amount of precipitation that may be suitable for cleaning the contaminants on the solar cell’s surface. However, average precipitation does not reflect reality because the days of heavy rain usually follow each other. There are also periods when no or only a small amount of precipitation falls for 30 days. Considering the data, a solar panel can deposit more than 10 cm
3 of contaminants, resulting in a dust concentration of 60–100 g/panel. Kazem et al. [
1], Parrott et al. [
26], and Alagoz et al. [
27] listed several techniques to effectively clean solar parks. In addition, Parrott et al. [
26] also inferred that the cleaning method did not cause mechanical damage, which was confirmed using an electroluminescence test.
4.5. Glass Testing
There is no visible difference between the panels and the samples collected from them as in the
Figure 13, which is why further tests are needed. Glass samples from three solar cells were also analyzed: new; dismantled but working; and dismantled but defective solar cells (
Figure 13). There is no significant difference between the spectral transmittance, which means that the volumetric morphology and structure of the glass sheets do not differ and do not change during operation. This was confirmed using material testing.
However, the difference is that in the case of a broken solar cell, the surface structure of the glass has changed. The grooves of different depths and longitudes compared to the new and dismantled but well-functioning solar cells have disappeared.
Figure 14 shows the difference. However, components (K and C) that were identical to those in the dust samples were also found in this sample during material testing. This means that they do not come from the basic matrix of the glass but are deposited on it from the environment around it. As the environment is not characterized by sharp-hard dust particles but by these lump-soft materials, it can be clearly established that the glass surface of the dismantled and destroyed solar cell has been transformed due to environmental dust and dirt effects. The sharp-hard grains would have further increased the depth, length, and orientation of the grooves. Similarly, Kazem et al. [
1], Pan et al. [
22], Shehri et al. [
28], Anirudhan et al. [
29], and Toth et al. [
30] presented microscopic images of the PV covering glass samples as well as images of the dust samples tested.
In both cases, the transmittance of the solar cell decreases, and the proportion of reflected light increases. In the studied environment, the latter particles are not characteristic and did not arrive in the form of transport in detectable quantities on the surface of the solar cell. The dust deposited on the surface of the solar cell, as shown by the material analysis, can be incorporated into the surface matrix of the glass as a result of which the glass sheet becomes cloudy, discolored, and opalescent. Therefore, indirectly, there was a decrease in the performance of the solar cell. Some of the dust samples collected were wet. Wet powders more easily adhere to the surface of the solar cell, and during heating, the moisture evaporates and the dried powder is fragmented and able to diffuse into the surface. Smaller dust particles adhere to the surface in electrostatic form [
31]. These particles can be removed using wet cleaning if intervened at the right time. Cleaning can be facilitated by special coatings as proved by Lu et al. [
32].
5. Conclusions
The condition assessment of the solar power plant and the surrounding scientific research can be said to be successful as the sources of the operational problems of the power plant have been identified. The laboratory measurements showed a good agreement with the effects experienced in the power plant, which may prove useful in future assessments. The employees of the power plant will be able to act in the future to eliminate the losses. In the case of the examined power plant, the following solutions can eliminate or reduce the impact of energy production problems: relocation of the bale storage taking into account the prevailing wind direction, regular cleaning of the solar panels, and application of a monitoring system and optimization circuit. The cleaning of a large power plant is not an easy task; however, it effectively ensures sustainable operation, which is an important aspect of energy management.
The investigated solar power plant was one of the first to be built in Hungary. Since then, many more powerful power plants have been built, and similar mistakes have not been made during construction. Many errors and damaging factors as possible must be eliminated as the current 4 GW Hungarian solar power capacity will exceed 6 GW by 2030. Such and similar inspections will be indispensable in the future in order to guarantee the reliable operation of the ever-increasing solar capacity. In addition to proper power generation, slowing down the rate of reduction of service life, thereby increasing efficient operating time is an inevitable challenge. Work and experience in the field should be continued, which will require further laboratory-based thermal imaging studies.
Contamination of the solar cell not only affects its crystal structure but can also interfere with power electronic converters. As a result of increasing contamination, the voltage at the MPPT controller output decreases. As the voltage decreases, the total harmonic distortion (THD) supplied to the grid through the inverter increases. The low-pass filter at the output of the inverter cannot compensate for the THD increase. Excessive solar contamination can cause the voltage to break down to a degree that the inverter will not be able to supply electricity to the grid.


