Article

TP Concentration Inversion and Pollution Sources in Nanyi Lake Based on Landsat 8 Data and InVEST Model

1
School of Environmental and Energy Engineering, Anhui Jianzhu University, Hefei 230601, China
2
Anhui Environmental Science Research Institute, Hefei 230071, China
3
Institute of Remote Sensing and Geographic Information System, Anhui Jianzhu University, Hefei 230601, China
*
Author to whom correspondence should be addressed.
Sustainability 2023, 15(12), 9678; https://doi.org/10.3390/su15129678
Submission received: 21 May 2023 / Revised: 13 June 2023 / Accepted: 14 June 2023 / Published: 16 June 2023

Abstract

:
Phosphorus is a limiting nutrient in freshwater ecosystems. Therefore, it is of great significance to use remote sensing technology to estimate the Total phosphorus (TP) concentration in the lake body and identify the contribution of TP inflow load in the surrounding area of the lake body. In this study, two main frameworks (empirical method and machine learning algorithm) for TP estimation are proposed and applied to the development of the Nanyi Lake algorithm. Based on the remote sensing data and ground monitoring data, the results obtained by the two main algorithms are compared to explore whether the machine learning algorithm has better performance than the empirical method in the TP inversion prediction of Nanyi Lake. The Integrated Valuation of Ecosystem Services and Tradeoffs (InVEST) model was used to simulate the TP inflow load in the Nanyi Lake Basin and determine the key pollution source areas. The results show that the accuracy of the machine learning algorithm is higher than that of the empirical method and has better performance. Among the four machine learning algorithms—support vector machines (SVR), artificial neural network (BP), extreme gradient boosting algorithm (XGBoost) and random forest regression (RF)—the TP concentration inversion model established by the XGBoost algorithm is more accurate and has strong spatiotemporal heterogeneity. The simulation results in the southern and northeastern parts of the Nanyi Lake Basin contribute the most to the pollution load of the lake area, and the simulation results can provide direction for the effective prevention and control of Nanyi Lake, help to further effectively identify the key source areas of TP pollution in the water body of Nanyi Lake, and provide a meaningful scientific reference for water quality monitoring and management, to comprehensively improve the water quality of Nanyi Lake.

1. Introduction

The rapid development of the economy and the increasing intensity of human activities have greatly changed the circulation law of lakes, resulting in the degradation of ecosystem structure and function, aggravation of water eutrophication, and deterioration of water quality, which seriously restricts the sustainable development of society and economy [1,2]. Located in the middle and lower reaches of the Yangtze River, Nanyi Lake is an important part of the Yangtze River ecosystem. With the social and economic development of the area around Nanyi Lake, the residues of chemical fertilizers and pesticides used in modern agricultural production carry a large amount of phosphorus into the water body through surface runoff, and the production and domestic sewage along the lake also carry a large amount of Total phosphorus (TP) pollution load into the lake through discharge [3,4,5]. In addition, the use of lake purse seine culture and feeding food in aquaculture will also reduce the biodiversity of aquatic ecosystems and accelerate the eutrophication process of water bodies [6,7,8], thereby aggravating the deterioration of water quality in Nanyi Lake. Nanyi Lake has a large lake surface and a shallow lake depth. A large amount of lake water directly enters the Shuiyang River, which has a great impact on the water quality downstream, so the impact of the intensification of eutrophication in the water body of Nanyi Lake has more serious socio-economic significance.
Water quality degradation poses a significant challenge to the sustainable use of water resources, urgently necessitating the creation of a safe water environment. TP concentration is an important indicator of biological growth and eutrophication in lakes, making it critical for water quality management [9,10]. Water quality monitoring is a crucial foundation, providing effective data for analyzing temporal and spatial changes, addressing eutrophication issues, and exploring causes of degradation to restore ecological water environments in the middle and lower reaches of the Yangtze River [11]. The input of phosphorus nutrient load and the resulting rapid accumulation of endogenous load are pivotal factors in lake eutrophication [12]. Traditional water quality monitoring relies heavily on on-site or chemical sampling, making it expensive, time-consuming, and limited in obtaining data for the entire lake. It is also insufficient for large-scale, real-time water monitoring, which is the current requirement [13].
Remote sensing represents an effective technology for monitoring lake water quality, offering significant benefits compared to traditional monitoring methods. It not only overcomes traditional methods’ limitations but also realizes high-efficiency, low-cost, and large-scale real-time monitoring [14,15,16]. Water quality remote sensing estimation methods are broadly classified into physics-driven and data-driven approaches [17]. Physics-driven methods include radiation transmission modes and data assimilation, but due to their many variables, complex calculations, and long model running time, these methods require a large amount of high-precision data, and their simulation results may lack interpretation. Data-driven methods mainly include empirical methods, semi-empirical/analytical methods, and machine learning-based methods, which are widely used in big data monitoring of water environment remote sensing due to their advantages of few input parameters, simple calculation, and high accuracy [18,19].
Currently, remote sensing estimation of TP concentration relies on two types of empirical methods: direct and indirect estimation. Direct estimation uses the relationship between reflectivity and measured TP concentration to calculate TP concentration and is widely used and relatively accurate [19,20,21,22,23,24], but its complex algorithm structure cannot thoroughly explain the estimation mechanism. Indirect estimation initially estimates TP concentration from OAC concentration and then selects the OAC algorithm or band to develop the TP estimation algorithm. While this approach can explain the algorithm’s mechanism, it can generate uncertainties and result in accuracy loss [25,26]. Empirical models rely on field water quality sampling data to ensure high accuracy [27], but their versatility is poor. These methods assume a clear relationship between measured biophysical parameters and spectral observations, limiting their applicability under complex datasets [28]. The diversity of lake types and differences in water quality make remote sensing studies challenging. However, the use of machine learning algorithms is increasing in water quality assessment due to their computational efficiency and nonlinear mapping capabilities [29,30].
Previous studies have considered the causes and types of pollution sources in discussing TP inversion results. However, few discussions focused on the contribution of various pollution sources in their basins. This overlooks the pollution characteristics and pollution contribution of different administrative regions, limiting the ability to undertake pollution prevention and control treatment in characteristic areas when discussing pollution sources and pollution contributions. To address this, the Integrated Valuation of Ecosystem Services and Tradeoffs (InVEST) model was adopted as a significant non-point source pollution model. It is simple and easy to operate, with output results possessing strong spatial expressiveness [31], allowing for simulation of the size and distribution of TP non-point source pollution load in each partition of a specific area. The nutrient transport rate (NDR) model’s parameters required for nutrient transport rate are relatively simple, and the mechanism is clear, making it suitable for non-point source pollution simulation studies [32].
In this study, Nanyi Lake was chosen as the research area and an empirical estimation algorithm of TP was established using Landsat 8 Operational Land Imager (OLI) spectral reflectance data and measured point TP monitoring data, considering the typical characteristics and applicable conditions of TP concentration in the lake. The accuracy and differences of the Support vector machines (SVR), artificial neural network (BP), extreme gradient boosting algorithm (XGBoost), and random forest regression (RF) machine learning models were comprehensively compared with the empirical method for TP concentration inversion in Nanyi Lake. An algorithm with high accuracy was selected to establish an inversion model of TP concentration. The InVEST model was used to simulate non-point source TP inflow load results to determine the key source areas for discussing the distribution and factors of TP pollutants in the lake body. The temporal and spatial law of TP concentration in Nanyi Lake was studied and the degree of TP pollution was clarified, with the contribution of each polluted area to the TP pollution load of the water body being determined using the water system and its controlled townships as the unit. Targeted measures to control TP pollution in Nanyi Lake were implemented based on the gathered information.

2. Description of the Study Area and Dataset
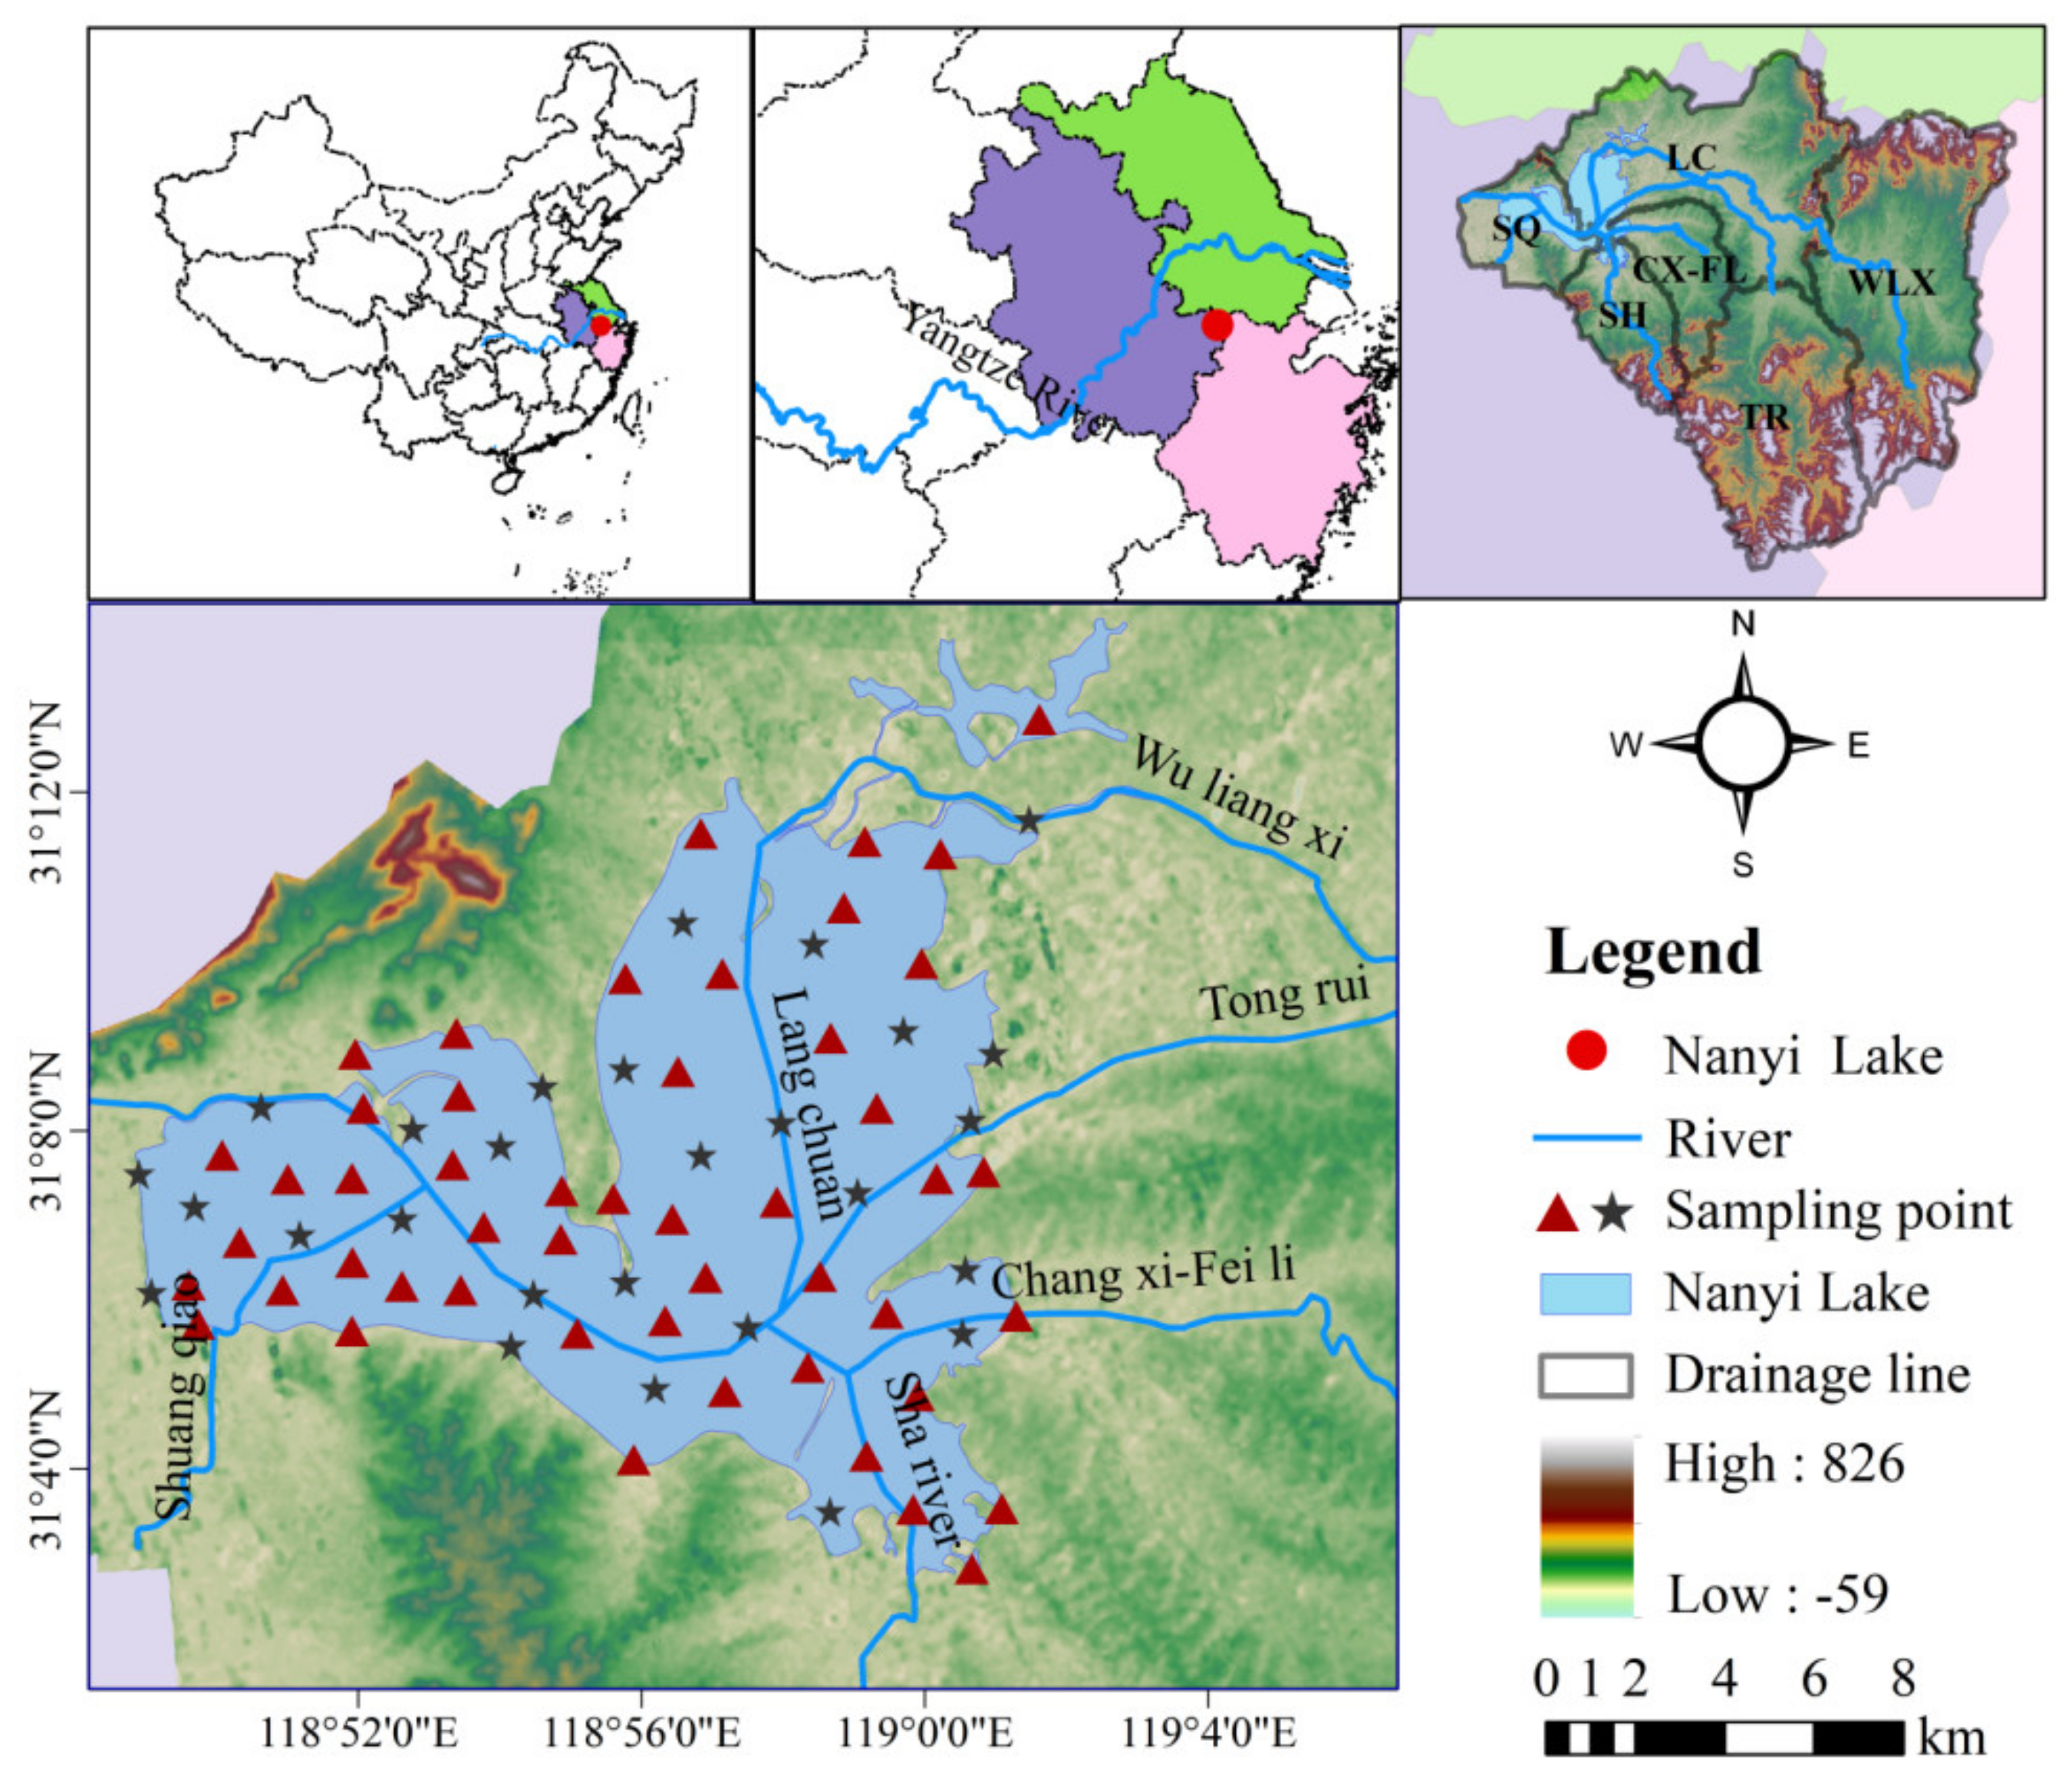
2.1. Study Area

Located in the southeast of Anhui Province, Nanyi Lake is an outflow freshwater lake on the south bank of the middle and lower reaches of the Yangtze River, the largest natural freshwater lake in southern Anhui, and one of the main lakes regulating the amount of water in the Shuiyang River. This is shown in Figure 1. The geographical coordinates are between east longitude (111°43′~119°13′ E) and north latitude (30°57′~31°15′ N). The lake water flows west through the Beishan River to the west into the Shuiyang River, with a water surface area of 204 km2 and a corresponding total reservoir capacity of 1.26 billion m3. The Shuiyang River system, where the Nanyi Lake basin is located, originates from the Tianmu Mountain at the junction of Anhui and Zhejiang, and the main rivers entering the lake are Langchuan River (LC), Tongrui River (TR), Feili River (FL), Shuangqiao River (SQ), Changxi-Feili River (CX-FL), and Shahe River (SH).

2.2. Acquisition of Field Data and Measurement of Water Quality Parameters

From January 2015 to December 2021, the field trip to Nanyi Lake was completed month by month, and 100 water samples of Nanyi Lake were collected from the Nanyi Lake area. Excluding 12 error samples, 78 samples were finally selected, each with a sampling amount of 1000 mL, acidified to pH < 2 with H2SO4, and then stored at 2–4 °C. They are used for the determination of TP, CODMn, NH3-N, and DO, respectively. The method for determining TP was ammonium molybdate spectrophotometry [33]. The determination method of CODMn was the permanganate index method [34]. The determination method of NH3-N was salicylic acid spectrophotometry [35]. DO is determined by iodometry [36].

2.3. Remote Sensing Data

Landsat 8 is an American Earth observation satellite launched on 11 February 2013, by the United States Geological Survey (USGS) and the National Aeronautics and Space Administration (NASA). After 100 days of test runs, the acquisition of images began. The Landsat 8 satellite, which contains two sensors, OLI and Thermal Infrared Sensor (TIRS), can collect about 500 images per day around the world. OLI includes all bands of ETM+, showing higher resolution and greater utility than ETM+. The band characteristics of OLI are shown in Table 1. To explore the distribution of water quality in Nanyi Lake, all Landsat 8 OLI images for the study area (line 118, path 38) were downloaded from USGS. In this paper, a total of 10 Landsat8 satellite remote sensing images were downloaded, and 7 images with cloud cover ≤ 10% were screened according to cloud coverage and image quality (31 August 2015, 20 November 2016, 31 September 2017, 31 March 2018, 31 October 2019, 20 December 2020, and 26 March 2021). The filtered data were preprocessed using envi.
Remote sensing of water quality is based on the relationship between water quality parameters and remote sensing data and is established through water surface reflectivity. Many studies have demonstrated that the properties of water can be estimated using Rayleigh’s modified reflectivity (RRC, dimensionless) [37,38]. Preprocessing of Landsat 8 images includes radiometric calibration and atmospheric correction, which eliminates atmospheric influences and converts the image to surface reflectivity [39].

2.4. InVEST Model Operation Data

The nutrient transport rate (NDR) model in the InVEST model was used to estimate the TP nutrient pollution load in the Nanyi Lake Basin. Simulations are performed using 2021 as the base year, and the required data include annual precipitation, annual potential evapotranspiration, land-use type map, DEM data, subbasin boundaries, soil maximum root layer depth, soil available water content, flow accumulation threshold, and Borselli K parameters. The sources and processing of the above data items are shown in Table 2.
The potential evapotranspiration is calculated by the Penman–Monteith formula, and the multi-year average potential evapotranspiration spatial distribution map is obtained by using the inverse distance weighted spatial interpolation method. The revised FAO Penman–Monteith is formulated as follows [41]:
PE = 0.408 Δ R n G + γ 900 T mean + 273 u 2 e s e a Δ + r 1 + 0.34 u 2
where PE represents the possible evapotranspiration (mm/d); represents the slope of the saturated water pressure curve (kPa/°C); γ represents the dry and wet surface constant (kPa/°C); Rn represents the net surface radiation (MJ/(m·d)); G represents the soil heat flux (MJ/(m2·d)); Tmean represents the daily average temperature (°C); μ2 represents the wind speed at a height of two meters (m/s); es represents the saturated water pressure (kPa); ea represents the actual water air pressure (kPa).
Effective soil water is the amount of water that can be used and absorbed by the crop. Its magnitude is determined by the water absorption capacity of the crop roots and the soil suction capacity. The formula for estimating the effective soil water content in China is calculated as follows [42]:
ASWC = 54.509 0.132 sand % 0.003 sand % 2 0.005 silt % 0.006 silt % 2 0.738 clay % + 0.007 clay % 2 2.688 OM % + 0.5010 M % 2
where sand%, silt%, clay%, and OM% represent the measured sand content; silt% content, clay content, and organic matter content, respectively.

2.5. Model Building

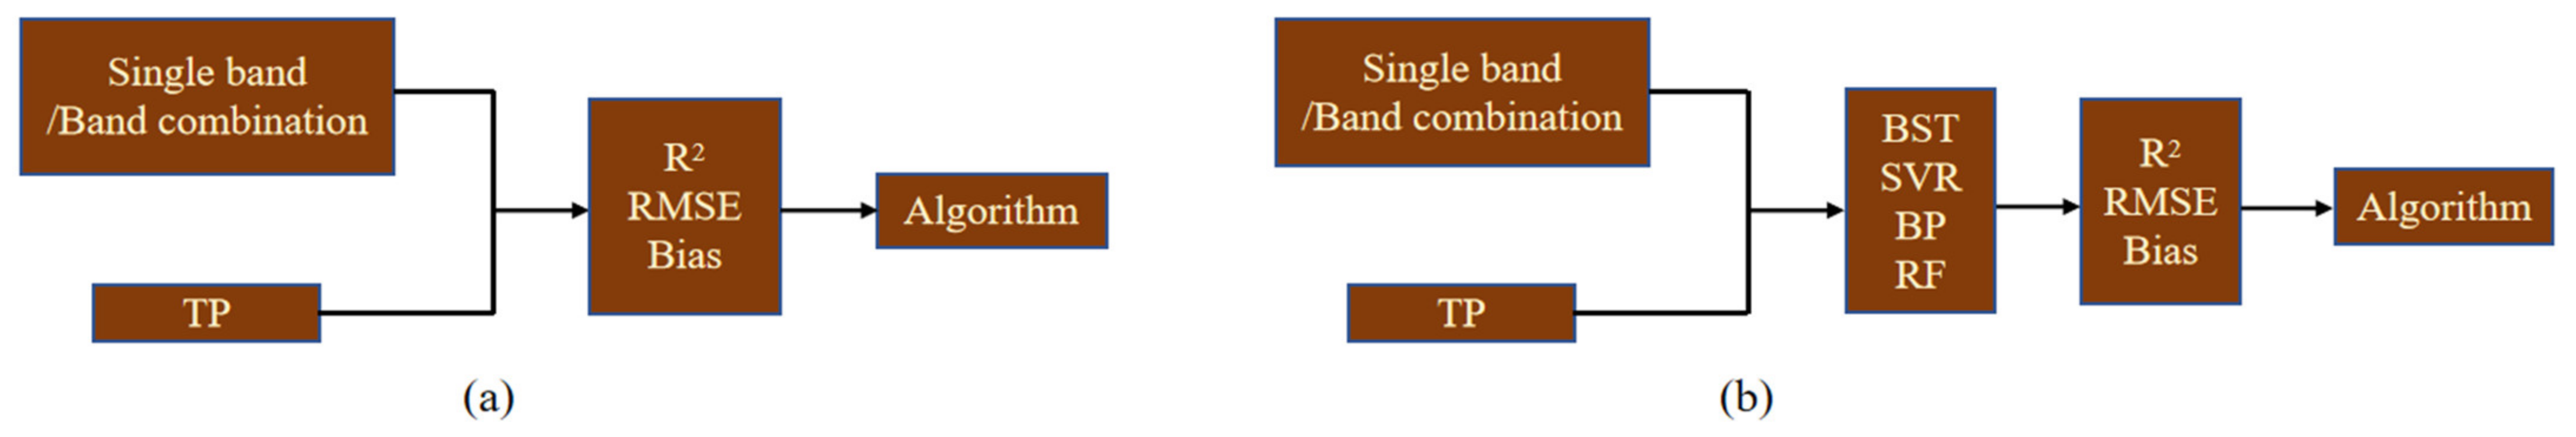
2.5.1. Direct Derivation

The environmental significance of TP is very important. The optical properties and phosphorus morphology of different lakes are different.TP and OLI spectra have a good correlation. All bands from visible to near infrared can be used to estimate TP concentration [43,44]. Since P does not have spectral characteristics, it is complicated to estimate total P concentration by remote sensing. At present, the bands used to estimate TP are not clear, and the estimation algorithm is uncertain [45,46,47]. Phosphorus mainly exists in the form of particles and is closely related to OAC in water, including suspended particulate matter (SPM), chlorophyll a(Chla), and chromogenic dissolved organic matter (CDOM) [48,49,50,51]. Therefore, appropriate TP algorithms can be developed according to the estimated range of OAC. SPM is the main water quality parameter affecting optical properties, and also the key OAC affecting TP [52]. It has been shown that TP concentration can be estimated by a simple band combination in waters where SPM dominates. Since the concentration of Chla in Nanyi Lake has a great influence on TP concentration [53], the major bands of Chla concentration should also be taken into account when estimating TP concentration in Nanyi Lake. According to the published research, as shown in Table 3, bands B1, B2, B3, B4, and B5 are selected as research objects. According to the enumeration method of addition, subtraction, multiplication, and division, any two characteristic bands were combined, and the correlation coefficients between different bands and TP were calculated. The optimal band combination was selected according to the correlation coefficient to establish the estimation model of TP concentration, as shown in Figure 2a.

2.5.2. Machine Learning Algorithm

Based on the ground monitoring data and Landsat 8 remote sensing data, four machine learning models [52,60,61,62,63,64] were adopted in the Matlab environment to establish the inversion model of TP concentration in Nanyi Lake. In this study, a comprehensive data set containing band reflectance information of 78 sampling points and ground sampling data was used as input data set to separate the data sets. In the model, data from 57 is selected as the training data set, and data from 21 is used for verification. Coefficient of determination (R2), RMSE, and Bias were also used to evaluate the performance of the model, as shown in Figure 2b.

2.5.3. Algorithm Accuracy Evaluation

Determination coefficient (R2), root mean square error (RMSE) and deviation were used to evaluate the accuracy of the model. The calculation formula is as follows:
R 2 = 1 X estimated X measured 2 X estimated X measured ¯ 2
RMSE = ( X measured X estimated ) 2 n
Bias = 1 n X estimated X measured
where X measured represents the TP data actually measured at the sampling point; Y estimated is the estimated TP value using Landsat 8; n is the number of sampling points.

2.5.4. Correlation Analysis

Correlation analysis refers to the analysis of two or more variable elements with correlation [65]. The correlation plot plug-in in Origin software is used to analyze the Pearson correlation coefficient between the TP concentration of the measured point and the values of single band and band combination, measure the linear relationship between the two sets of data, calculate the correlation between the two variables, and characterize the relationship between different OLI bands and TP of 78 sampling points. Find the band combination that has the greatest correlation with TP concentration. The correlation coefficient was calculated to reveal the relationship between TP and various environmental factors. Pearson correlation coefficient is calculated by the following formula:
R = X band X band ¯ X TP X TP ¯ X band X band ¯ 2 X TP X TP ¯ 2
where X band is the value of the band combination; X band ¯ is that all the mean value of band combination; X TP is the concentration of TP; X TP ¯ is the average of all TP data.

2.5.5. InVEST Model Building

The NDR model, which uses the mass conservation method to simulate the spatial migration process of TP nutrients and effectively estimate the transport rate of TP and the load of TP into the river, is an important part of InVEST model. This model has the function of calculating the transfer rate of phosphorus nutrients into the river through surface runoff (that is, the coefficient of entering the river) and simulating the source and transport process of nutrients in the basin. With this function, it can accurately estimate the TP load into the river in the Nanyi Lake basin and quantitatively estimate the spatial distribution of the grid unit of TP nutrient load in the Nanyi Lake basin. The basic principle of the model is as follows:
(1)
Based on the surface runoff potential index, nutrient correction load parameters of each grid are obtained, and the calculation formula is as follows:
modifide . load x , i = load x , i · RPI i
RPI i = RP i / RP a v
where modifide . load x , i is the nutrient load for each raster pixel i corrected. RPI i is the runoff potential index. RP i is the runoff agent on raster pixel i. RP a v is the average proxy parameter on the grid.
(2)
Calculate the surface nutrient transport rate:
NDR i = NDR 0 , i 1 + exp IC i IC 0 k 1
NDR 0 , i = 1 ef f ´ i
where   NDR 0 , i refers to the nutrient transport rate that is not retained by the downstream pixels. IC i is the topographic index.   IC 0 and k is the calibration parameter. ef f ´ i is the maximum interception efficiency between the surface grid element i and the river.
(3)
The formula for calculating TP load into the lake is:
x exp , i = load surf , i · NDR surf , i
x exptot = i x expi
where, x exp , i is the nutrient output of each grid cell i. load surf , i is the load of surface nutrients. NDR surf , i is the transport rate of surface nutrients. x expi is the nutrient output of sub watersheds.

3. Results

3.1. Water Quality Characteristics of Nanyi Lake

The content of each pollutant index varies with the change of year and water quantity, and the difference in rainfall in each year has a certain influence on water quality. See Figure 3a–d. The variation trend of average TP concentration in Nanyi Lake during 2015–2021 was divided into two stages, which increased from 0.047 mg/L in 2015 to 0.072 mg/L in 2018 and then decreased to 0.032 mg/L in 2021. For TP, the content in 2016 and 2018 is relatively high in the dry season, while the content in 2019 and 2020 is relatively high in the wet season. The change in permanganate is not obvious year by year. The contents of dissolved oxygen and ammonia nitrogen differ significantly from 2015 to 2021, which are relatively high in the dry season and relatively low in the wet season. The content of permanganate has no obvious difference between 2015 and 2021, with an average range of 2.98–3.50 mg/L. The water quality of Nanyi Lake is greatly affected by the inflow of rivers. From 2015 to 2021, the average inflow of lake water in Nanyi Lake is 2.454 billion m3, and the inflow of Langchuan River into the lake is the largest, with the water mainly coming from Wuxi River. When the rainfall increases, the rain will affect the growth of aquatic plants, aggravate the accumulation of pollutants, and damage the ecological environment.
The spatial variation trends of TP, dissolved oxygen, ammonia nitrogen, and permanganate concentrations in Nanyi Lake are shown in Figure 3e–h. TP concentration in East Lake was slightly higher than that in West Lake. The concentration of dissolved oxygen was higher in West Lake and Nanyi Lake during the dry season. The ammonia nitrogen content in Nanyi Lake, East Lake, and West Lake had little difference and reached the maximum in the dry season. The difference in permanganate concentration between East Lake and West Lake of Nanyi Lake is great. The concentration of permanganate in East Lake reaches its maximum in the dry season, while that in West Lake reaches its maximum in the wet season.
To explore the relationship between TP concentration and other substances in Nanyi Lake, we conducted a correlation analysis of TP, DO, NH3-N, and CODMn. As shown in Figure 3i,j. TP has the best correlation with CODMn (0.65 in the east and 0.63 in the west of the lake). The concentration of TP in Nanyi Lake is not only related to Chla, SPM, and other photosensitive substances but is also related to some less photosensitive substances. Therefore, when discussing TP pollution, we should take into account the water quality characteristics of the lake district. We should not only consider the influence of highly photosensitive substances on TP but also take into account the weak photosensitive substances.

3.2. Correlation Analysis and Multiple Regression Models

According to Table 3, band 1, band 2, band 3, band 4, and band 5 of Landsat 8 OLI images were selected for analysis, and band combinations with significant correlation coefficients were selected by the exhaustive method. Figure 4 shows the correlation coefficients between all single bands and the two band combinations with the highest correlation coefficients and TP concentration. The OLI band was positively correlated with TP concentration, with a correlation between 0.092 and 0.66, and the correlation between B4 and TP concentration was the highest (0.66). Band combination B3-B2 has the best correlation with TP concentration; 78 data points were used, 57 samples were used for training, and 21 samples were used for verification. The high-precision regression model of water quality parameters in Nanyi Lake was established.

3.3. Selection of Optimal Model

In this study, the actual measurement data in 2021 was compared with the corresponding modeling results, where the results obtained using empirical models are the worst, showing low accuracy (R2 = 0.64), as shown in Figure 5a,b. In contrast, models for XGBoost, RF, SVR and BP algorithms can achieve a degree of fit, as shown in Figure 5c–f. The results show that in model training, the XGBoost algorithm has the highest R2 value of 0.79, while the RMSE value is the lowest, which is 0.0078. In the model measurement, the XGBoost algorithm still had the highest R2 value at 0.82, while the RMSE value is the lowest, which is 0.0072. This shows that the XGBoost algorithm developed based on the machine learning framework is most suitable for TP estimation in Nanyi Lake. It should be noted that the BP neural network algorithm is essentially a gradient descent method, and the objective function to be optimized is very complex and requires a large number of parameters, such as the initial value of the network topology, weights and thresholds, which will cause the algorithm to be inefficient. RF does not perform as well as it does in classification when solving regression problems because it does not give a continuous output. When regression occurs, RF is not able to make predictions beyond the range of the training set data, which can lead to overfitting when modeling. SVR does not have a universal solution to nonlinear problems, and it is sometimes difficult to find a suitable kernel function. Therefore, the comprehensive results based on various evaluation indicators show that the XGBoost algorithm is the most suitable algorithm for TP estimation in Nanyi Lake.

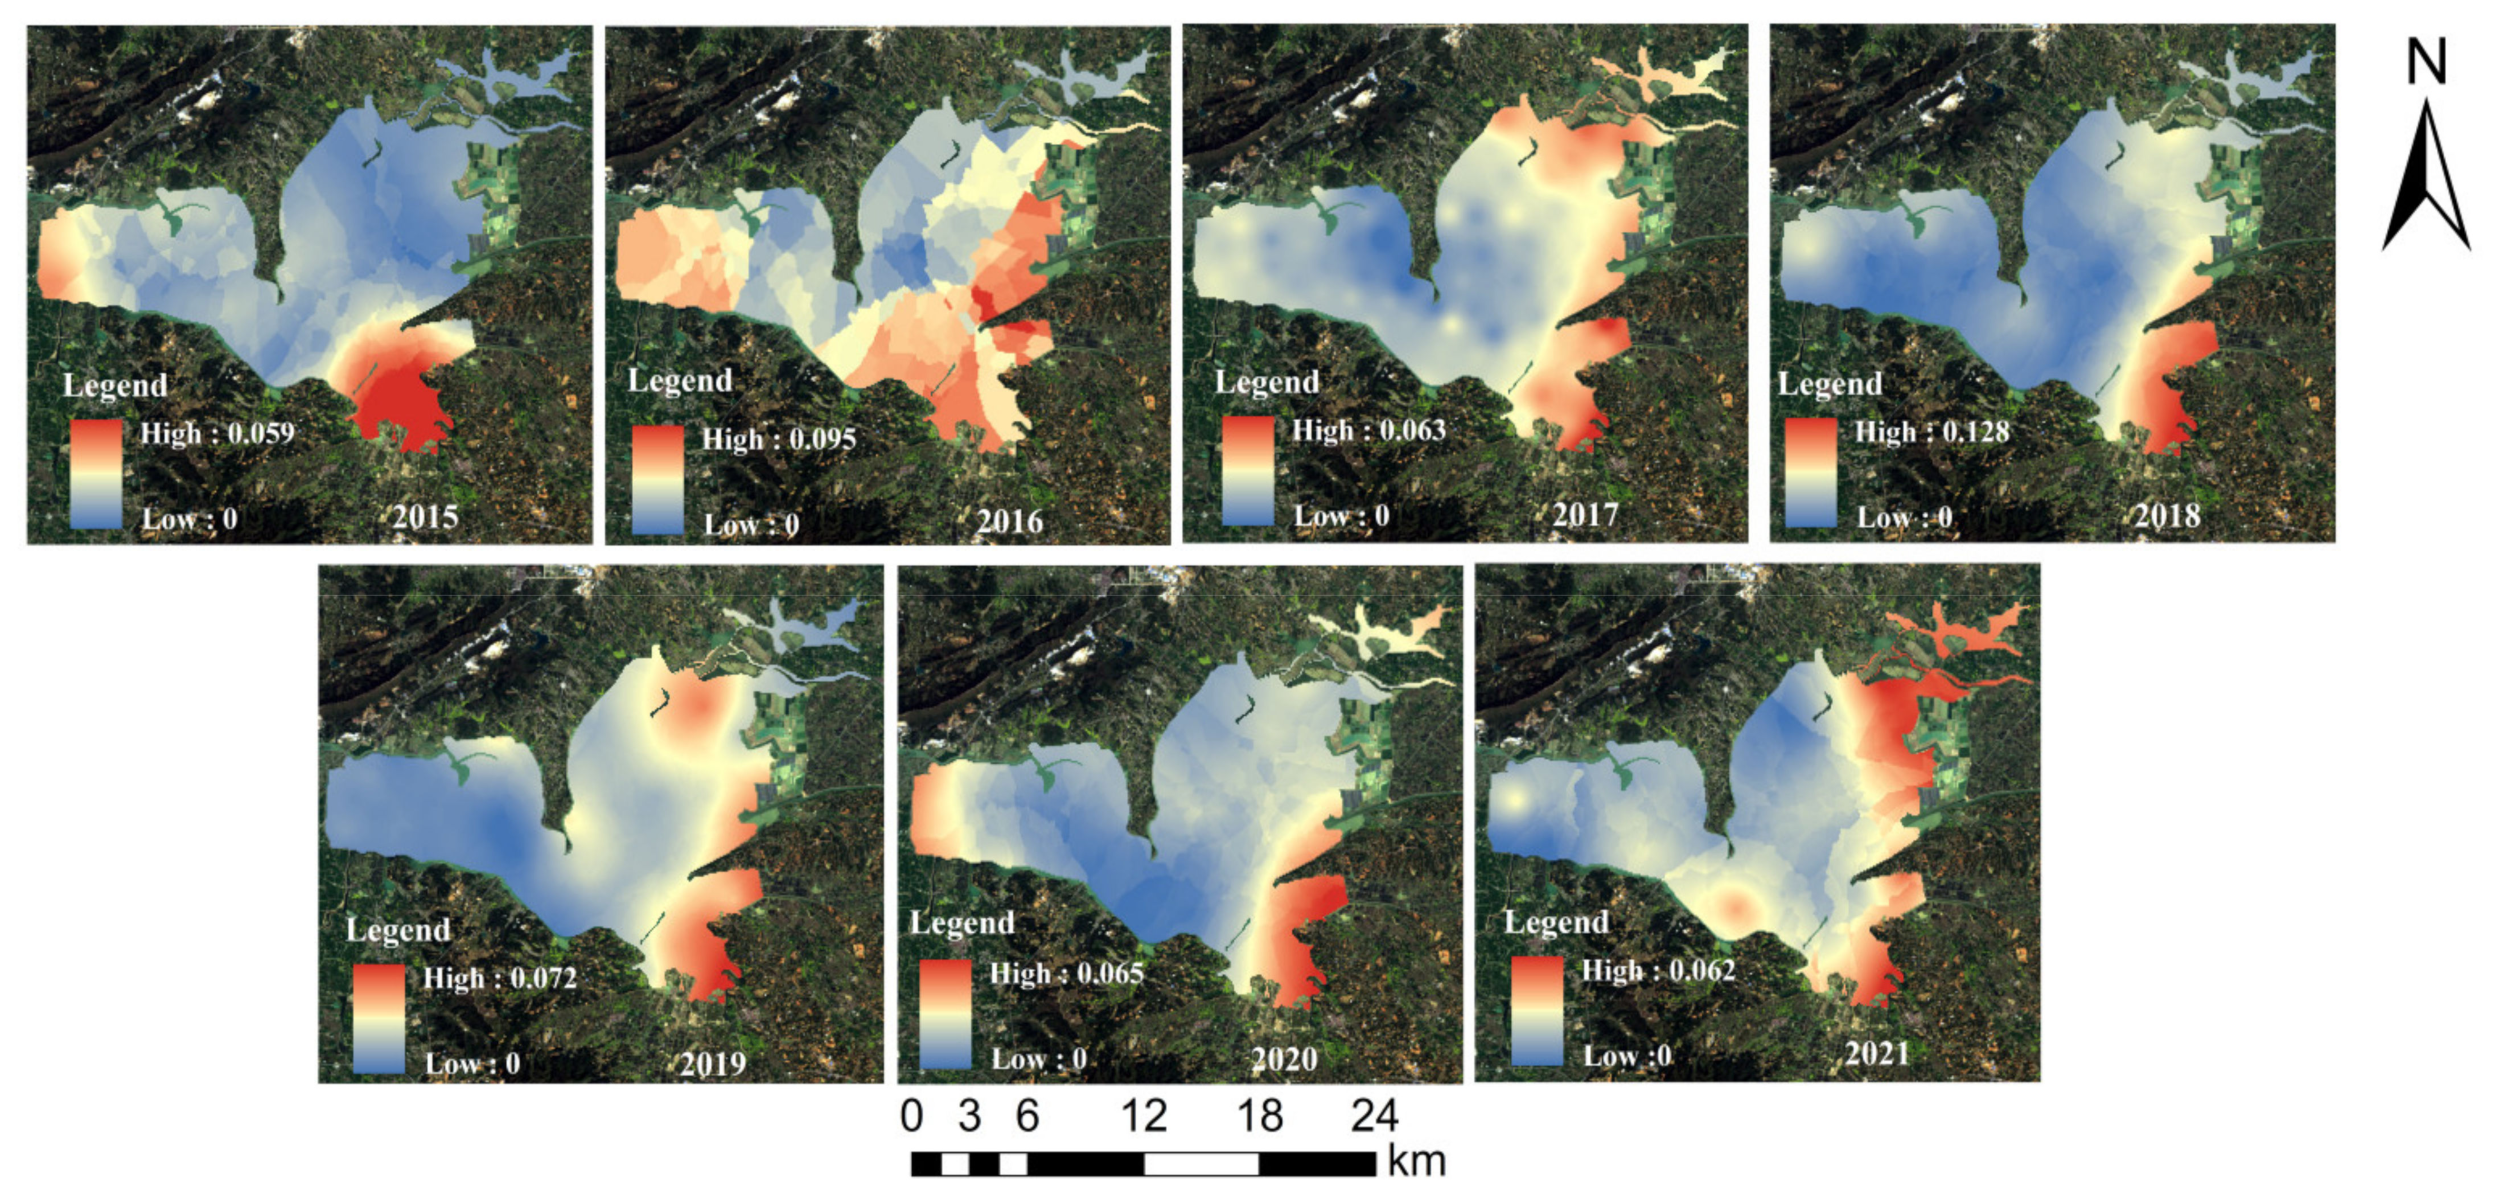
3.4. Analysis of Inversion Results

Landsat 8 remote sensing image was used to invert the spatial and temporal distribution of TP concentration in Nanyi Lake during 2015–2021 based on the model established by the XGBoost algorithm, as shown in Figure 6. The results showed that TP concentration fluctuated greatly from year to year. In 2015, TP concentration in the lake area was mainly concentrated at 0–0.059 mg/L, especially in the south and northwest of the Lake area. In 2016, the water quality in the lake area worsened, and TP content reached the highest 0.095 mg/L. From 2018 to 2021, the rectification of Nanyi Lake was intensified, and the sewage treatment system in the eastern part of the city was accelerated. The TP content gradually decreased and the water quality improved. TP East Lake is higher than West Lake, the lake is higher than the lake. Affected by the topography, most water systems in the Nanyi Lake basin flow from east to west. The upstream water system of Nanyi Lake is located in the north and southeast. The terrigenous input resulted in higher total P concentration in the southeast and north of Nanyi Lake, while the lower total P concentration was mainly concentrated in the lake.

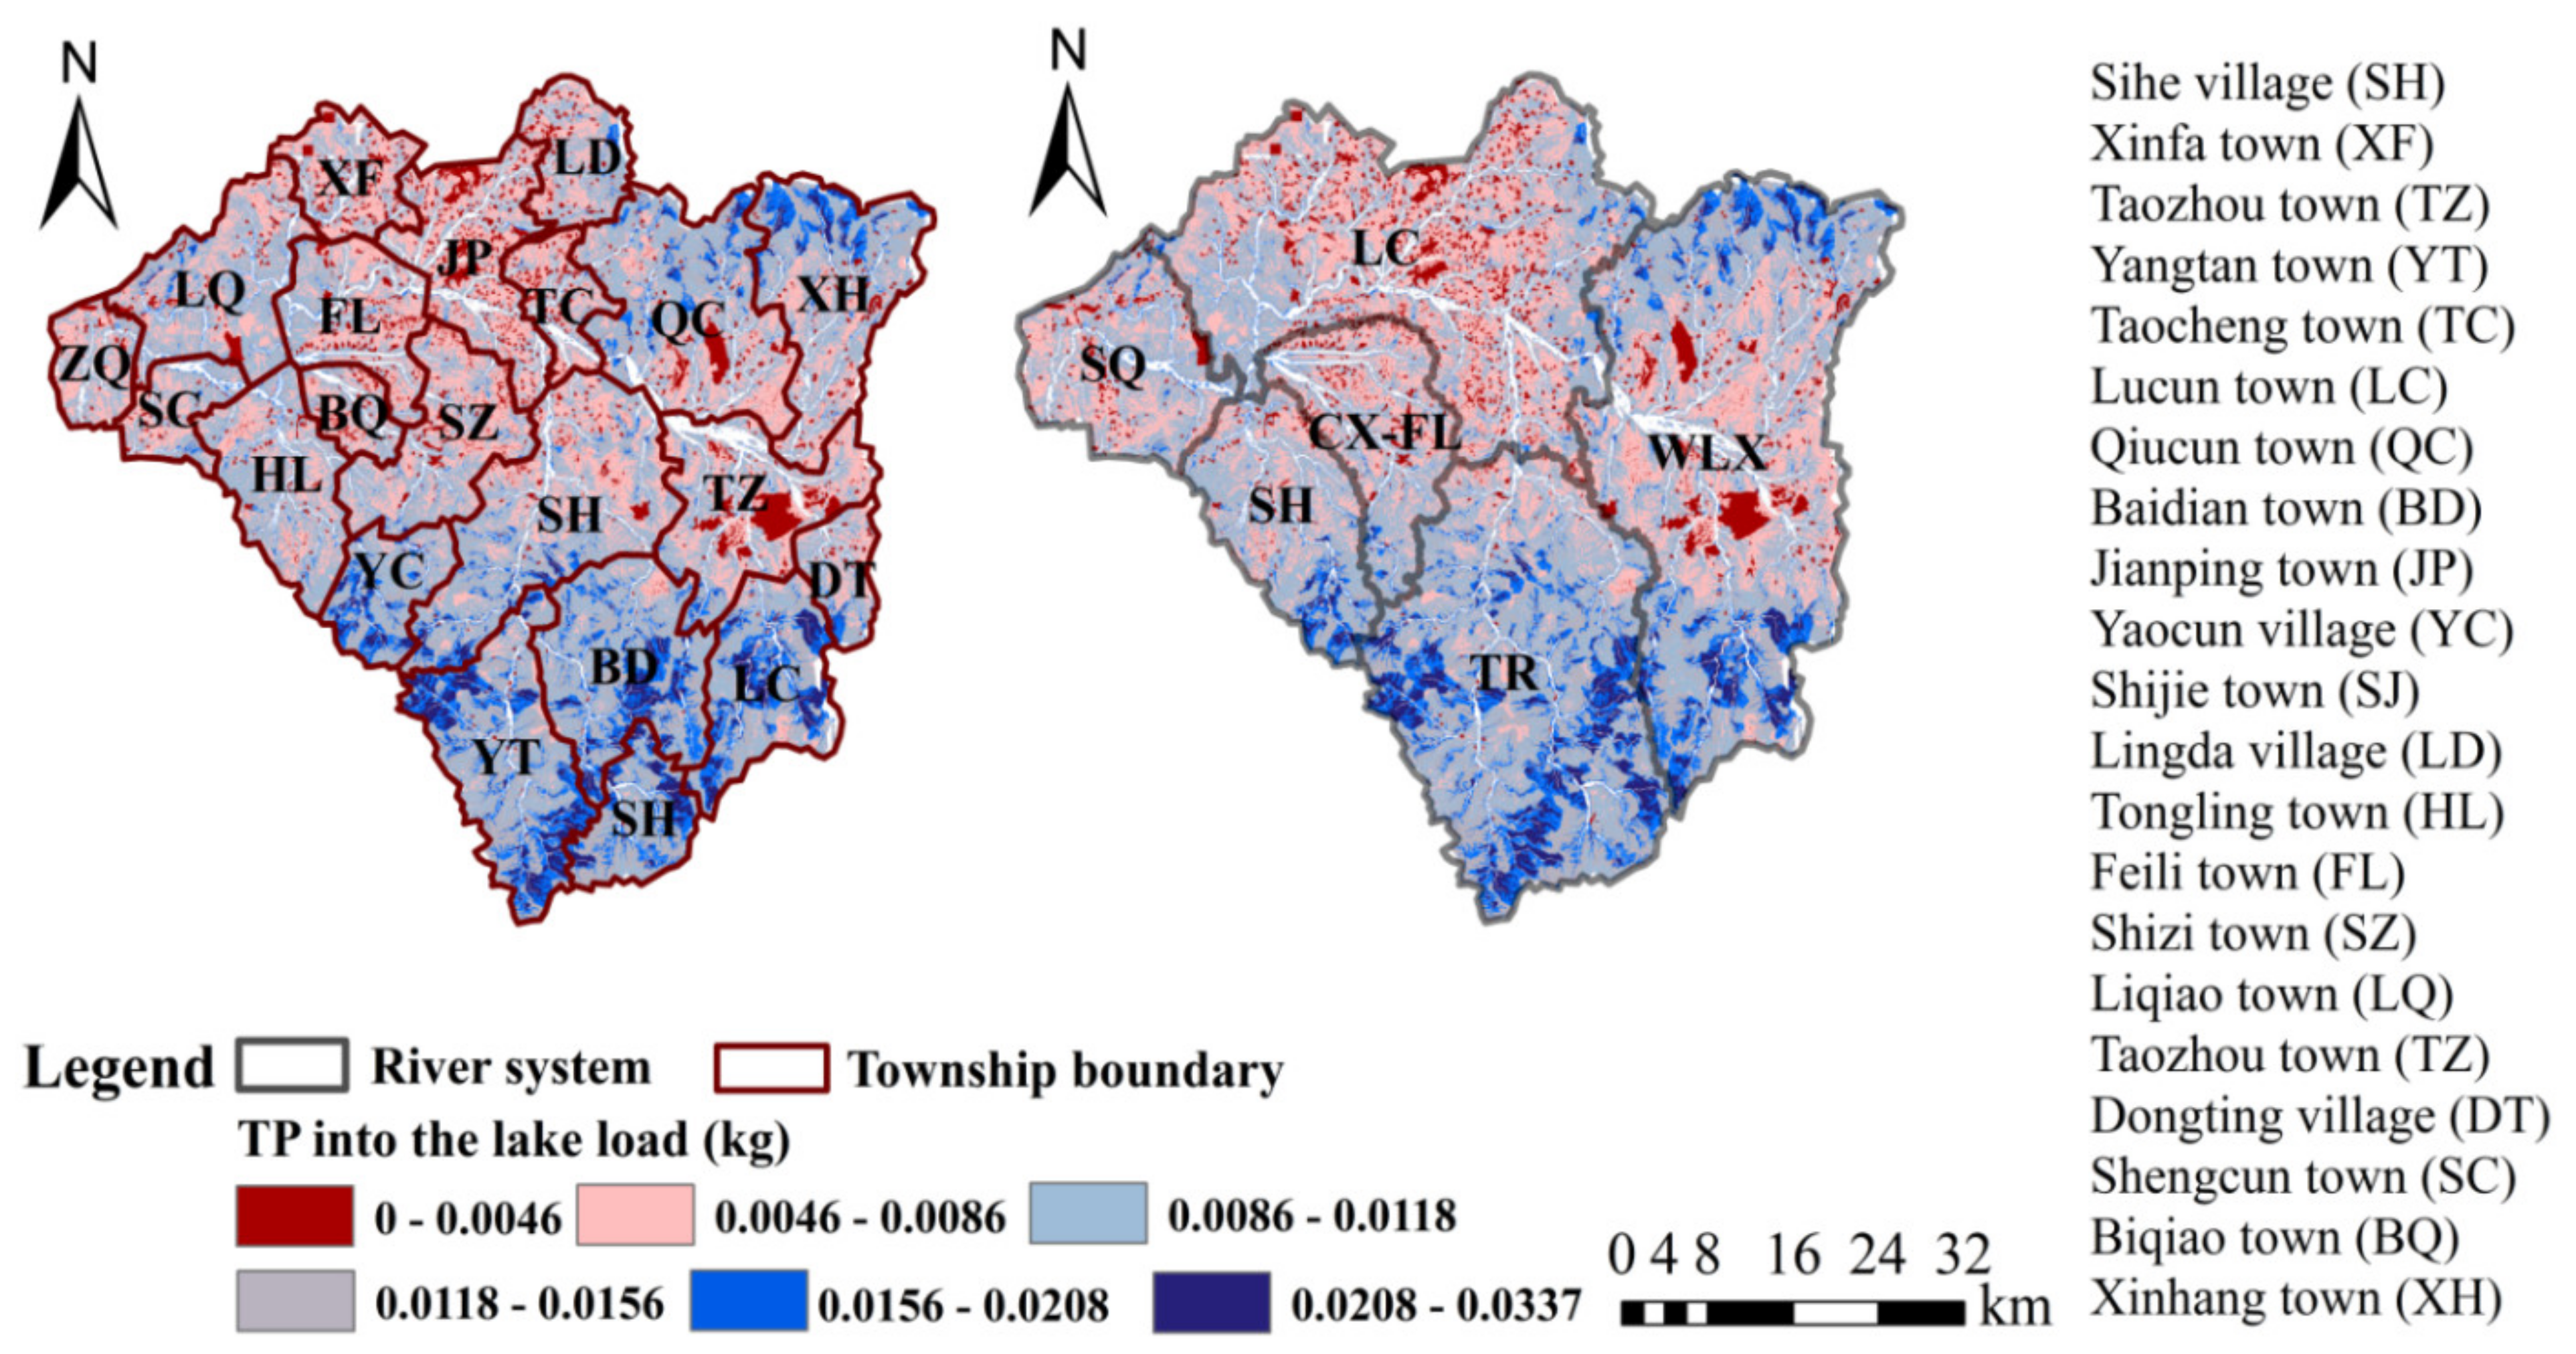
3.5. InVEST Model Simulation Result

According to the catchment scope, Nanyi Lake Basin is divided into six river system control units (SQ, LC, WLX, SH, CX-FL and TR). Taking the water system and the township administrative districts controlled by it as the unit, the TP output load is counted. The spatial distribution of TP load into the lake in each region is shown in Figure 7. The application amount of phosphorus fertilizer in the area around Nanyi Lake is large and the pollution phenomenon is serious. TP load into the lake mainly presents high values in the northeastern and southern parts of the basin. The spatial distribution of TP pollutants in towns and water systems is quite different and dispersed. From the perspective of water system boundaries, the TP pollution load in the southeast of the TR and SH water system and the north and south of the WLX water system is more serious, and the townships involved are YC, YT, SH, BD, LC, and XH.

4. Discussion

4.1. Feasibility and Limitation Analysis of the TP Inversion Model

Existing studies have shown that Xu, X.Q. et al. [66] used the empirical model to invert the distribution of TP concentration in Nanyi Lake from 2015 to 2019 and concluded that the water body of Nanyi Lake was in a mild eutrophication state during this period, among which the mass concentration of TP in the lake was mainly 0.035–0.045 mg/L in 2015. In 2016, the water quality in the lake area worsened, and 80% of the lake areas had TP content as high as 0.08 mg/L. Shi, L. et al. [67] used high-resolution image data to simulate TP concentration in Nanyi Lake based on a random forest algorithm, and the results showed that there was no obvious seasonal difference in TP concentration on the whole, but the concentration in the East Lake area was slightly higher than that in the West Lake area, and the concentration in the coastal lake area was slightly higher. In addition, Jun, F.X. et al. [52] selected the east Lake of Nanyi Lake as the research target and found that the XGBoost algorithm would overestimate the TP concentration of Nanyi Lake by using MODIS image technology. Compared with these studies, there are certain differences between the bands selected in this paper and previous studies, so the estimated TP inversion results are consistent with the previous results in the trend of TP concentration change after 2018, but the specific estimated values are different. It is worth noting that from 2018 to 2021, relevant departments intensified their efforts to improve Nanyi Lake, vigorously promoted the construction of sewage treatment plants in depth within the basin of Nanyi Lake, accelerated the collection and treatment of sewage in the eastern part of the city, and further optimized the effluent quality indexes of sewage treatment plants. Therefore, the TP content decreased year after year, and the water quality improved obviously. Meanwhile, by comparing the spatial distribution concentration range of TP concentration obtained from inversion in Nanyi Lake, it was found that the distribution rule and range of TP concentration in other lakes were consistent with the water quality test results from 2015 to 2021, except for the concentration differences in some areas around the lake. East Lake is slightly higher than West Lake, and the results and concentration range meet the requirements of the Surface Water Quality Monitoring System. It can be considered that the XGBoost model estimation method adopted in this study has certain regional applicability and feasibility. The possible reasons for the differences may be related to the selection of different sampling times, sampling points, and remote sensing images.

4.2. Causes of the TP Concentration Distribution

Nanyi Lake has shallow water, large fluctuation of lake water level, and lake water is collected from surrounding surface runoff, and the ecosystem of the surrounding area is fragile, and the water quality has a great impact on the downstream. Nanyi Lake algae cell density is high, spatial differences are large, and cyanobacteria dominate in summer, which is conducive to the formation of blooms.
The water pollution of Nanyi Lake mainly comes from industrial wastewater collected by rivers entering the lake, aquaculture and aquatic biodegradation in the lake area, and non-point source input from surrounding agriculture and residents’ lives [68]. Depending on the geographical location, the amount of rainfall affects it differently, resulting in regional differences in pollution. The Nanyi Lake basin is high in the east and northwest and flows into the Yangtze River through the Shuiyang River, which belongs to Tongjiang Lake. The amount of phosphate fertilizer application in the area around Nanyi Lake was relatively large, and the TP concentration in the marginal area was relatively high. The lack of obvious filtering of the landscape pattern in various areas around the lake and the high concentration of runoff quality will harm the water quality of the Nanyi Lake basin. The water quality of East Lake in the lake area is worse than that of West Lake, which may be related to the pollution discharge of human activities such as aquaculture, free-range livestock and poultry, and domestic sewage discharge in the upstream area. Therefore, the protection and monitoring of water quality in the upper and middle reaches of Nanyi Lake cannot be ignored. The abundant period of the Nanyi Lake basin is from May to September, the dry period is from December to February, and the rest of the months are flat periods. The peak of TP concentration in Nanyi Lake generally occurs in December, January, or February (Figure 3e). Phosphorus is mainly discharged into Nanyi Lake through runoff and drainage processes, and rainfall has a high correlation with river water quality. Nanyi Lake is surrounded by 21 townships, each controlled by 6 water system units. The pollution load flowing into the lake in the southeast of the Tonnai River system, the southeast of the Shahe River system, and the north and south of the Wuliangxi River system is high. The TP inlet lake load was mainly distributed in the northeast and south of the basin, and the low-value areas were distributed in the middle and west of the basin (Figure 7). Twenty-one townships surround Nanyi Lake, and the townships contribute the most to the TP pollution load of Nanyi Lake by YC, YT, SH, BD, LC, and XH, and domestic and industrial wastes are discharged into the lake through stormwater runoff [69], which aggravates eutrophication of the water body. These areas should be managed more often, blocked from the source, and have increased governance efficiency. Due to the limited self-purification capacity of the water body, some pollutants will be adsorbed in the sediment. When the speed of the water flow increases, the pollutants in the sediment are released again. The potential risk of endogenous phosphorus to water bodies in the sediments of Nanyi Lake is high [70]. Sediments often act as phosphorus sinks. However, it can also act as a source of phosphorus to release phosphorus from overlying water [71,72]. The sediment of polluted sediment is suspended under the disturbance of wind and waves, which is easy to have a great impact on the water quality of the lake, especially in West Lake, when the water level is low and the wind and wave are large, the water quality decline trend is obvious. The phosphorus discharged into the lake water body will reach the sediment through adsorption, precipitation, and other processes, and when the conditions are suitable, it will be released into the overlying water through the sediment gap water through dissolution, resolution, desorption, etc., so that the phosphorus concentration in the water body increases, resulting in secondary pollution [73]. Biological decomposition, changes in the redox potential of the water body, also cause phosphorus in the sediment to enter the overlying water [74,75]. Aquatic flora and fauna and suspended particulate matter can absorb and adsorb phosphorus in the water, eventually allowing phosphorus to be deposited in lakes [76,77]. In general, phosphorus loading in sediments is positively correlated with the time of accumulation. The longer the time, the more phosphorus is released into the water by endogenous sources, and the risk of eutrophication of lakes is increased [78]. Therefore, the discharge of different pollution sources in the river basin should be controlled.
A correlation between DO and CODMn in surface water has been shown [79]. The correlation analysis of this paper shows that the correlation between DO and CODMn is relatively high in East Lake and relatively low in West Lake (Figure 3i,j). The reason for the difference in the correlation between TP and other water quality parameters in Dongxihu Lake may be related to the difference in water quality characteristics of Dongxihu Lake in Nanyi Lake. TP is positively correlated with CODMn and may be associated with organic pollution. Nanyi Lake has a subtropical monsoon climate, dominated by northerly winds in winter and southerly winds in summer. The monsoon climate will lead to the accumulation of pollutants, with more pollution in the periphery than in the center of the lake [80]. Aquaculture has high density and is distributed along the lake, and when clearing the pond for a water change, pollutants will directly enter the lake, destroy the wetland function at the mouth of the lake, etc., resulting in serious degradation of aquatic plants in the lake. It indirectly causes pollution to the water body and aggravates the eutrophication process of the water body.

5. Conclusions

Taking Nanyi Lake as an example, this study uses Landsat 8 OLI remote sensing images and measured data to develop a TP inversion model for Nanyi Lake and compares and analyzes the differences between empirical methods and machine learning algorithms to predict the spatial distribution of TP concentration in Nanyi Lake from 2015 to 2021. At the same time, the changes in four main water quality parameters in Nanyi Lake from 2015 to 2021 were analyzed, the correlation between non-photosensitive substances and TP and the impact on water quality was explored, and the TP load in the Nanyi Lake Basin was simulated with the help of InVEST model.
The results show that the B3-B2 band combination of the Landsat 8 image has a good correlation with TP concentration. The machine learning algorithm is more suitable for the establishment of the Nanyi Lake TP inversion model than the empirical method, and the Nanyi Lake TP inversion model built based on XGBoost has the best performance and higher accuracy (R2 0.82, RMSE 0.0072, Bias 0.00021). The TP concentration in Nanyi Lake was inverted by the XGBoost model, except for the difference in concentration in individual areas around the lake, the distribution law and range of the concentration distribution of the other results were consistent with the general trend of water quality test results from 2015 to 2021, and the XGBoost model had certain feasibility.
From 2015 to 2021, the average TP concentration in Nanyi Lake increased from 0.047 mg/L in 2015 to 0.072 mg/L in 2018 and then decreased to 0.032 mg/L in 2021. The temporal and spatial variation of TP in Nanyi Lake was that the concentration was lower in the abundant and peaceful periods, slightly higher in the dry period, and slightly higher in the East Lake than in the West Lake. The spatial distribution characteristics of the inflow load of TP in Nanyi Lake were analyzed using the InVEST model, and the pollution contribution of various regions in the Nanyi Lake basin was identified. The surrounding townships of YC, YT, SH, BD, LC, and XH have the highest TP pollution load on Nanyi Lake. When exploring the correlation between non-photosensitive substances and TP in Nanyi Lake, it was found that TP and CODMn had a good correlation.
Therefore, while controlling TP pollution, the control of organic pollutants should be increased in combination with the temporal and spatial distribution of pollution concentration in the lake area. Strengthen the management of key source areas and conduct effective pollution prevention and control measures to control the pollution of Nanyi Lake.

Author Contributions

Conceptualization methodology and writing original draft preparation: L.D.; supervision and funding acquisition: C.Q.; data analysis: L.D., G.L. and W.Z.; writing—review and editing supported by L.D. All authors have read and agreed to the published version of the manuscript.

Funding

This financial support was provided by the 2020 Key Research and Development Program of Anhui Province (202004I07020006). The data support comes from the basic data of “three lines and one order” in Anhui Province.

Institutional Review Board Statement

Not applicable.

Informed Consent Statement

Not applicable.

Data Availability Statement

Not applicable.

Conflicts of Interest

The authors declare that they have no known competing financial interests or personal relationships that could have appeared to influence the work reported in this paper.

References

  1. Liu, D.D.; Bai, L.; Li, X.Y.; Zhang, Y.; Qiao, Q.; Lu, Z.B.; Liu, G.Y. Spatial characteristics and driving forces of anthropogenic phosphorus emissions in the Yangtze River Economic Belt, China, Resources. Conserv. Recycl. 2022, 176, 105937. [Google Scholar] [CrossRef]
  2. Tao, Y.Q.; Deng, Y.M.; Du, Y.; Xu, Y.; Leng, Z.C.; Ma, T.; Wang, Y.X. Sources and enrichment of phosphorus in groundwater of the Central Yangtze River Basin. Sci. Total Environ. 2020, 737, 139837. [Google Scholar] [CrossRef]
  3. Liu, J.; Zhang, Y.; Yuan, D.; Song, X. Empirical Estimation of Total Nitrogen and TP Concentration of Urban Water Bodies in China Using High Resolution IKONOS Multispectral Imagery. Water 2015, 7, 6551–6573. [Google Scholar] [CrossRef] [Green Version]
  4. Cheng, L.J.; Xue, B.; Zawisza, E.; Liu, J.L.; Yao, S.C.; Li, S.Y. Specific species response of Cladocera to the trophic and hydrological environments of lakes: A case study of a typical shallow mesotrophic lake. Catena 2021, 207, 105630. [Google Scholar] [CrossRef]
  5. Liu, J.B.; Shen, Z.W.; Chen, W.; Chen, J.; Zhang, X.; Chen, J.H.; Chen, F.H. Dipolar mode of precipitation changes between north China and the Yangtze River Valley existed over the entire Holocene: Evidence from the sediment record of Nanyi Lake. Int. J. Climatol. 2020, 41, 1667–1681. [Google Scholar] [CrossRef]
  6. Da Le, N.; Nguyen, T.H.; Duong, T.T.; Rochelle-Newall, E.; Hoang, T.T.H.; Vu, T.H.; Pham, T.M.H.; Nguyen, T.A.H.; Dinh, L.M.; Phung, T.X.B.; et al. Risk of eutrophication in the seawater of the coastal Red River aquaculture zone (Thai Binh province, Vietnam). Reg. Stud. Mar. Sci. 2022, 55, 102587. [Google Scholar] [CrossRef]
  7. Kumararaja, P.; Suvana, S.; Saraswathy, R.; Lalitha, N.; Muralidhar, M. Mitigation of eutrophication through phosphate removal by aluminium pillared bentonite from aquaculture discharge water. Ocean. Coast. Manag. 2019, 182, 104951. [Google Scholar] [CrossRef]
  8. Ge, Y.; Gu, X.H.; Mao, Z.G.; Chen, H.H.; Zeng, Q.F.; Yang, H.T. How does aquaculture activity affect phytoplankton functional groups in Gaoyou Lake, China. J. Freshw. Ecol. 2023, 38, 2159554. [Google Scholar] [CrossRef]
  9. Paerl, H.W.; Xu, H.; Hall, N.S.; Rossignol, K.L.; Joyner, A.R.; Zhu, G.W.; Qin, B.Q. Nutrient limitation dynamics examined on a multi-Annual scale in Lake Taihu, China: Implications for controlling eutrophication and harmful algal blooms. J. Freshw. Ecol. 2015, 30, 5–24. [Google Scholar] [CrossRef]
  10. Paerl, H.W.; Xu, H.; Hall, N.S.; Zhu, G.W.; Qin, B.Q.; Wu, Y.L.; Rossignol, K.L.; Dong, L.H.; McCarthy, M.J.; Joyner, A.R. Controlling Cyanobacterial Blooms in Hypertrophic Lake Taihu, China: Will Nitrogen Reductions Cause Replacement of Non-N-2 Fixing by N-2 Fixing Taxa? PLoS ONE 2014, 9, e113123. [Google Scholar] [CrossRef] [PubMed] [Green Version]
  11. Meng, H.; Zhang, J.; Zheng, Z. Retrieving Inland Reservoir Water Quality Parameters Using Landsat 8-9 OLI and Sentinel-2 MSI Sensors with Empirical Multivariate Regression. Int. J. Environ. Res. Public Health 2022, 19, 7725. [Google Scholar] [CrossRef] [PubMed]
  12. Tayo, G.O.; Tang, S.X.; Tan, Z.L.; Sun, Z.H.; Wang, M.; Zhou, C.S.; Han, X.F. Determination Of Endogenous Faecal Phosphorus Loss In Goats. Arch. Anim. Nutr. 2009, 63, 104–111. [Google Scholar] [CrossRef]
  13. Xiong, J.; Lin, C.; Ma, R.; Cao, Z. Remote Sensing Estimation of Lake TP Concentration Based on MODIS: A Case Study of Lake Hongze. Remote Sens. 2019, 11, 2068. [Google Scholar] [CrossRef] [Green Version]
  14. Arabi, B.; Salama, M.S.; Pitarch, J.; Verhoef, W. Integration of in-situ and multi-sensor satellite observations for long-term water quality monitoring in coastal areas. Remote Sens. Environ. 2020, 239, 111632. [Google Scholar] [CrossRef]
  15. Schaeffer, B.A.; Schaeffer, K.G.; Keith, D.; Lunetta, R.S.; Conmy, R.; Gould, R.W. Barriers to adopting satellite remote sensing for water quality management. Int. J. Remote Sens. 2013, 34, 7534–7544. [Google Scholar] [CrossRef]
  16. Brivio, P.A.; Giardino, C.; Zilioli, E. Validation of satellite data for quality assurance in lake monitoring applications. Sci. Total Environ. 2001, 268, 3–18. [Google Scholar] [CrossRef]
  17. Chen, J.; Fu, R.; Chen, S.; Li, D.; Jiang, H.; Wang, C.; Peng, Y.; Jia, K. Remote Sensing Big Data for Water Environment Monitoring: Current Status, Challenges, and Future Prospects. Earth’s Future 2022, 10, e2021EF002289. [Google Scholar] [CrossRef]
  18. Ma, Z.H.; Wang, L.; Li, X.Y.; Qu, X.N.; Yin, J.; Zhao, X.N.; Liu, Y.Q. The oasis regional small and medium lake water transparency monitoring research and impact factor analysis based on field data combined with high resolution GF-1 satellite data. J. Freshw. Ecol. 2021, 36, 77–96. [Google Scholar] [CrossRef]
  19. Fabian, P.S.; Kwon, H.H.; Vithanage, M.; Lee, J.H. Modeling, challenges, and strategies for understanding impacts of climate extremes (droughts and floods) on water quality in Asia: A review. Environ. Res. 2023, 225, 115617. [Google Scholar] [CrossRef]
  20. Sun, D.; Li, Y.; Wang, Q.; Le, C.; Lv, H.; Huang, C.; Gong, S. A novel support vector regression model to estimate the phycocyanin concentration in turbid inland waters from hyperspectral reflectance. Hydrobiologia 2012, 680, 199–217. [Google Scholar] [CrossRef]
  21. Trescott, A.; Park, M.H. Remote sensing models using Landsat satellite data to monitor algal blooms in Lake Champlain. Water Sci. Technol. J. Int. Assoc. Water Pollut. Res. 2013, 67, 1113–1120. [Google Scholar] [CrossRef] [PubMed]
  22. Li, J.; Zhang, Y.; Ma, R.; Duan, H.; Loiselle, S.; Xue, K.; Liang, Q. Satellite-Based Estimation of Column-Integrated Algal Biomass in Nonalgae Bloom Conditions: A Case Study of Lake Chaohu, China. IEEE J. Sel. Top. Appl. Earth Obs. Remote Sens. 2017, 10, 450–462. [Google Scholar] [CrossRef]
  23. Du, C.; Li, Y.; Wang, Q.; Liu, G.; Zheng, Z.; Mu, M.; Li, Y. Tempo-spatial dynamics of water quality and its response to river flow in estuary of Taihu Lake based on GOCI imagery. Environ. Sci. Pollut. Res. Int. 2017, 24, 28079–28101. [Google Scholar] [CrossRef]
  24. Elsaadi, A.M.; Yousry, M.M.; Jahin, H.S. Statistical estimation of Rosetta branch water quality using mu-lti-Spectral data. Water Sci. 2014, 28, 18–30. [Google Scholar] [CrossRef] [Green Version]
  25. Wiangwang, N.; Messina, J.; Qi, J.; Skole, D. Assessing Water Clarity and Trophic Condition of the Bight of Bangkok with Satellite Remote Sensing Imagery. Int. J. Geoinform. 2006, 2, 43–50. [Google Scholar]
  26. Liu, Y.; Jiang, H. Retrieval of TP concentration in the surface waters of Poyang Lake based on remote sensing and analysis of its spatial-temporal characteristics. J. Nat. Resour. 2010, 28, 2169–2177. [Google Scholar]
  27. Gao, Y.; Gao, J.; Yin, H.; Liu, C.; Xia, T.; Wang, J.; Huang, Q. Remote sensing estimation of the TP concentration in a large lake using band combinations and regional multivariate statistical modeling techniques. J. Environ. Manag. 2015, 151, 33–43. [Google Scholar] [CrossRef] [PubMed]
  28. Wang, X.; Xiao, C.; Xue, Z.Y.; Pu, Q.C.; Jiang, T.; Zhao, J.H.; Wang, S.M. Application of Remote Sensing Technology to Monitor NH3-N Distribution in the Danjiangkou Reservoir. J. Water Resour. Res. 2019, 8, 436–444. [Google Scholar] [CrossRef]
  29. Wang, Y.H.; Jiang, Y.Z.; Liao, W.H.; Gao, P.; Huang, X.M.; Wang, H.; Song, X.S.; Lei, X.H. 3-D hydro-environmental simulation of Miyun reservoir, Beijin. J. Hydro-Environ. Res. 2014, 8, 383–395. [Google Scholar] [CrossRef]
  30. Alevizos, E. A combined machine learning and residual analysis approach for improved retrieval of shallow bathymetry from hyperspec-tral imagery and sparse ground truth data. Remote Sens. 2020, 12, 3489. [Google Scholar] [CrossRef]
  31. Yang, X.; Ji, G.; Wang, C.; Zuo, J.; Yang, H.; Xu, J.; Chen, R. Modeling nitrogen and phosphorus export with InVEST model in Bosten Lake basin of Northwest China. PLoS ONE 2019, 14, e0220299. [Google Scholar] [CrossRef] [PubMed]
  32. Xue, Z.B. The Assessment of Ecosystem Service Functions in Yanhe River Based on the InVEST Model. Master’s Thesis, Northwest University, Xi’an, China, 2017. [Google Scholar]
  33. Li, H.; Zhang, X.; Yu, L.; Wang, L.; Chen, S. The determination of phosphate in seawater by reverse flow injection spectrophotometry. Rev. Anal. Chem. 2012, 31, 99–105. [Google Scholar] [CrossRef]
  34. Jiang, M.X.; Feng, X.H.; Chen, C.Y. Determination of permanganate index in water by automatic permanganate index tester. Sci. Technol. Innov. Appl. 2020, 321, 120–121. [Google Scholar]
  35. Li, D.L.; Xu, X.B.; Li, Z.; Wang, T.; Wang, C. Detection methods of ammonia nitrogen in water: A review. Trends Anal. Chem. 2020, 127, 115890. [Google Scholar] [CrossRef]
  36. DZ/T 0064.2-2021; Methods for Groundwater Quality Analysis Part 2: Collection and Preservation of Water Samples. Ministry of Natural Resources of the People’s Republic of China: Beijing, China, 2021.
  37. Hu, C.M.; Chen, Z.Q.; Clayton, T.D.; Swarzenski, P.; Brock, J.C.; Muller-Karger, F.E. Assessment of estuarine water-quality indicators using MODIS medium-resolution bands: Initial results from Tampa Bay, FL. Remote Sens. Environ. 2004, 93, 423–441. [Google Scholar] [CrossRef]
  38. Hu, C.M.; Lee, Z.P.; Ma, R.H.; Yu, K.; Li, D.Q.; Shang, S.L. Moderate resolution imaging spectr-oradiometer (MODIS) observations of cyanobacteria blooms in Taihu Lake, China. J. Geophys. Res. 2010, 115, C04002. [Google Scholar] [CrossRef] [Green Version]
  39. Pahlevan, N.; Mangin, A.; Balasubramanian, S.V.; Smith, B.; Alikas, K.; Arai, K.; Barbosa, C.; Bélanger, S.; Binding, C.; Bresciani, M.; et al. ACIX-Aqua: A global assessment of atmospheric correction methods for Landsat-8 and Sentinel-2 over lakes, rivers, and coastal waters. Remote Sens. Environ. 2021, 258, 112366. [Google Scholar] [CrossRef]
  40. Sharp, R.; Chaplin-Kramer, R.; Wood, S.A.; Guerry, A.; Tallis, H.; Ricketts, T.; Nelson, E.J.; Ennaanay, D.; Wolny, S.; Olwero, N.; et al. InVEST 3.4.4 User’s Guide; The Natural Capital Project, Stanford University: Standford, CA, USA; University of Minnesota: Minneapolis, MN, USA; The Nature Conservancy, and World Wildlife Fund: Arlington, VA, USA, 2016. [Google Scholar]
  41. Widmoser, P. A discussion on and alternative to the Penman–Monteith equation. Agric. Water Manag. 2009, 96, 711–721. [Google Scholar] [CrossRef]
  42. Zhou, W.; Liu, G.; Pan, J.; Feng, X. Distribution of available soil water capacity in China. J. Geogr. Sci. 2005, 15, 3–12. [Google Scholar] [CrossRef]
  43. Li, Y.; Zhang, Y.; Shi, K.; Zhou, Y.; Zhang, Y.; Liu, X.; Guo, Y. Spatiotemporal dynamics of chlorophyll-a in a large reservoir as derived from Landsat 8 OLI data: Understanding its driving and restrictive factors. Environ. Sci. Pollut. Res. Int. 2018, 25, 359–1374. [Google Scholar] [CrossRef]
  44. Deutsch, E.S.; Alameddine, I.; El-Fadel, M. Monitoring water quality in a hypereutrophic reservoir using Landsat ETM+ and OLI sensors: How transferable are the water quality algorithms? Environ. Monit. Assess. 2018, 190, 141. [Google Scholar] [CrossRef] [PubMed]
  45. Gong, S.Q.; Huang, J.Z.; Li, Y.M.; Lu, W.N.; Wang, H.J.; Wang, G.X. Preliminary exploring of hyperspectral remote sensing experiment for nitrogen and phosphorus in water. Spectrosc. Spect. Anal. 2008, 28, 839–842. [Google Scholar]
  46. Kutser, T.; Arst, H.; Miller, T.; Kaarmann, L.; Milius, A. Telespectrometrical estimation of water transpa-rency, chlorophyll-a and TP concentration of Lake Peipsi. Int. J. Remote Sens. 1995, 16, 3069–3085. [Google Scholar] [CrossRef]
  47. Isenstein, E.M.; Park, M.H. Assessment of nutrient distributions in Lake Champlain using satellite remote sensing. J. Environ. Sci. 2014, 26, 1831–1836. [Google Scholar] [CrossRef]
  48. Xue, K.; Ma, R.H.; Duan, H.T.; Shen, M.; Boss, E.; Cao, Z.G. Inversion of inherent optical properties in optically complex waters using sentinel-3A/OLCI images: A case study using China’s three largest freshwater lakes. Remote Sens. Environ. 2019, 225, 328–346. [Google Scholar] [CrossRef]
  49. Li, L.R.; Su, H.J.; Du, Q.; Wu, T.X. A novel surface water index using local background information for long term and large-scale Landsat images. ISPRS J. Photogramm. Remote Sens. 2021, 172, 59–78. [Google Scholar] [CrossRef]
  50. Wu, C.F.; Wu, J.P.; Qi, J.G.; Zhang, L.S.; Huang, H.Q.; Lou, L.P.; Chen, Y.X. Empirical estimation of TP concentration in the mainstream of the qiantang river in China using landsat TM data. Int. J. Remote Sens. 2010, 31, 2309–2324. [Google Scholar] [CrossRef]
  51. Mortula, M.; Ali, T.; Bachir, A.; Elaksher, A.; Abouleish, M. Towards Monitoring of Nutrient Pollution in Coastal Lake Using Remote Sensing and Regression Analysis. Water 2020, 12, 1954. [Google Scholar] [CrossRef]
  52. Jun, F.X.; Chen, L.; Zhi, G.C.; Min, Q.H.; Kun, X.; Xi, C.; Rong, H.M. Development of remote sensing algorithm for TP concentration in eutrophic lakes: Conventional or machine learning? Water Res. 2022, 215, 118213. [Google Scholar] [CrossRef]
  53. Hui, J.; Yao, L. Analysis and inversion of the nutritional status of China’s Poyang Lake using MODIS data. J. Indian Soc. Remote 2016, 44, 837–842. [Google Scholar] [CrossRef]
  54. Zhu, J.J.; Zhang, J.W.; Mao, Y.; Qiu, Z. Spatial-temporal distribution of suspended particulate matter in Qingcaosha Reservoir at the mouth of the Yangtze River based on Landsat-8 OLI. Prog. Laser Optoelectron. 2021, 58, 55–64. [Google Scholar]
  55. Jin, L.; Yan, L.H.; Zhuang, Z.Z.; Zhi, P.L.; Rui, H.Y.; Ying, S. Analyzing the distribution and variation of Suspended Particulate Matter (SPM) in the Yellow River Estuary (YRE) using Landsat 8 OLI. Reg. Stud. Mar. Sci. 2021, 48, 102064. [Google Scholar] [CrossRef]
  56. Xiao, S.N.; Zhu, W.N.; Chen, J.; Nan, S.; Litong, H.; Yusen, Z.; Zeliang, Z. Remote sensing inversion and spatiotemporal variation of total suspended solids in Zhoushan coastal waters of Landsat-8. Spectrosc. Spectr. Anal. 2019, 39, 3826–3832. [Google Scholar]
  57. Lim, J.; Choi, M. Assessment of water quality based on Landsat 8 operational land imager associated with human activities in Korea. Environ. Monit. Assess. 2015, 187, 384. [Google Scholar] [CrossRef]
  58. Xiang, Y.B.; Zhang, C.P.; Wu, Z.G. Inversion study on chlorophyll a in Shahu Lake based on Landsat 8 data. Land Nat. Resour. Res. 2022, 1, 88–91. [Google Scholar]
  59. Li, Y.; Zhang, Y.; Shi, K.; Zhu, G.; Zhou, Y.; Zhang, Y.; Guo, Y. Monitoring spatiotemporal variations in nutrients in a large drinking water reservoir and their relationships with hydrological and meteorological conditions based on Landsat 8 imagery. Sci. Total Environ. 2017, 599–600, 1705–1717. [Google Scholar] [CrossRef]
  60. Sun, D.Y.; Qiu, Z.F.; Li, Y.M.; Shi, K.; Gong, S.Q. Detection of TP concentrations of turbid inland waters using a remote sensing method. Water Air Soil Pollut. 2014, 225, 1–17. [Google Scholar] [CrossRef]
  61. Chang, N.B.; Xuan, Z.M.; Yang, Y.J. Exploring spatiotemporal patterns of phosphorus concentrations in a coastal bay with MODIS images and machine learning models. Remote Sens. Environ. 2013, 134, 100–110. [Google Scholar] [CrossRef]
  62. Chen, J.; Quan, W.; Cui, T.; Song, Q.; Lin, C. Remote sensing of absorption and scattering coefficient using neural network model: Development, validation, and application. Remote Sens. Environ. 2014, 149, 213–226. [Google Scholar] [CrossRef]
  63. Zou, Y.-B.; Ma, Z.-Y.; Jiao, Q.-B.; Xu, L.; Pei, J.; Li, Y.-H.; Xu, Y.-X.; Zhang, J.-H.; Li, H.; Yang, L.; et al. Comparative study on hyperspectral inversion models of water parameters. Spectrosc. Spectr. Anal. 2023, 43, 949–954. [Google Scholar]
  64. Qiao, Z.; Sun, S.; Jiang, Q.; Xiao, L.; Wang, Y.; Yan, H. Retrieval of TP Concentration in the Surface Water of Miyun Reservoir Based on Remote Sensing Data and Machine Learning Algorithms. Remote Sens. 2021, 13, 4662. [Google Scholar] [CrossRef]
  65. Yacobi, Y.Z.; Moses, W.J.; Kaganovsky, S.; Sulimani, B.; Leavitt, B.C.; Gitelson, A.A. NIR-red reflectance based algorithms for chlorophyll-a estimation in mesotrophic inland and coastal waters: Lake Kinner-et case study. Water Res. 2011, 45, 2428–2436. [Google Scholar] [CrossRef] [Green Version]
  66. Shi, L.; Wang, Z.X.; Jia, C. Modeling and application of water environment inversion of Gaofen satellite: A case study of Nanyi Lake. Anhui Geol. 2022, 32, 145–149. [Google Scholar]
  67. Xu, X.Q.; Gao, F.; Yang, X.Y. Temporal and spatial variation monitoring of water quality in Nanyi Lake based on remote sensing data inversion. Renew. Resour. Circ. Econ. 2020, 13, 31–34. [Google Scholar]
  68. Li, G.; Li, X.; Jiang, X.; Zhang, Y.; Li, H.; Zhang, J.; Cai, G.; Luo, K.; Xie, F. Occurrence and source analysis of heavy metals and dissolved organic matter in Nanyi Lake, Anhui Province. Environ. Monit. Assess. 2023, 195, 660. [Google Scholar] [CrossRef]
  69. Xu, J.; Jin, G.; Mo, Y.; Tang, H.; Li, L. Assessing Anthropogenic Impacts on Chemical and Biochemical Oxygen Demand in Different Spatial Scales with Bayesian Networks. Water 2020, 12, 246. [Google Scholar] [CrossRef] [Green Version]
  70. Xie, F.Z.; Luo, K.; Zhu, Y.R.; Li, H.B.; Li, G.L.; Liu, Z.; Li, W.L.; Cai, G.G. Phosphorus occurrence morphology and its effect on overlying waterin Nanyi Lake. China Environ. Sci. 2022, 42, 5318–5327. [Google Scholar] [CrossRef]
  71. Yan, Q.X.; Tang, S.X.; Bamikole, M.A.; Han, X.F.; Zhou, C.S.; Wang, M.; Sun, Z.H.; Tan, Z.L. Influences of dietary phosphorus variation on nutrient digestion, fecal endogenous phosphorus output and plasma parameters of goats. Livest. Sci. 2011, 142, 63–69. [Google Scholar] [CrossRef]
  72. Zhao, J.; Wang, X.X.; Li, X.Y.; Jia, H.Y.; Wang, Q.; Peng, Y.Z. Improvement of partial nitrification endogenous denitrification and phosphorus removal system: Balancing competition between phosphorus and glycogen accumulating organisms to enhance nitrogen removal without initiating phosphorus removal deterioration. Bioresour. Technol. 2019, 281, 382–391. [Google Scholar] [CrossRef]
  73. Holman, I.P.; Whelan, M.J.; Howden, N.J.K.; Bellamy, P.H.; Willby, N.J.; Rivas-Casado, M.; McConvey, P. Phosphorus in groundwater an overlooked contributor to eutrophication? Hydrol. Process. 2008, 22, 5121–5127. [Google Scholar] [CrossRef]
  74. Jin, X.D.; He, Y.L.; Kirumba, G.; Hassan, Y.; Li, J.B. Phosphorus fractions and phosphate sorption-release characteristics of the sediment in the Yangtze River estuary reservoir. Ecol. Eng. 2013, 55, 62–66. [Google Scholar] [CrossRef]
  75. Immers, A.K.; Bakker, E.S.; Van Donk, E.; Ter Heerdt, G.N.J.; Geurts, J.J.M.; Declerck, S.A.J. Fighting internal phosphorus loading: An evaluation of the large scale application of gradual Fe-addition to a shallow peat lake. Ecol. Eng. 2015, 83, 78–89. [Google Scholar] [CrossRef]
  76. Pan, G.; Krom, M.D.; Herut, B. Adsorption-desorption of phosphate on airborne dust and riverborne particulates in East Mediterranean seawater. Environ. Sci. Technol. 2002, 36, 3519–3524. [Google Scholar] [CrossRef] [PubMed]
  77. Wang, C.H.; Qi, Y.; Pei, Y.S. Laboratory investigation of phosphorus immobilization in lake sediments using water treatment residuals. Chem. Eng. J. 2012, 209, 379–385. [Google Scholar] [CrossRef]
  78. Withers, P.J.A.; Neset, T.S.S.; Nesme, T.; Oenema, O.; Rubæk, G.H.; Schoumans, O.F.; Smit, B.; Pellerin, S. Stewardship to tackle global phosphorusinefficiency: The case of Europe. Ambio 2015, 44, 193–206. [Google Scholar] [CrossRef] [PubMed] [Green Version]
  79. Sha, H.F.; Fan, L.L. Correlation between dissolved oxygen in surface water and chemical oxygen demand and permanganate index. Guangzhou Chem. Ind. 2021, 49, 105–106, 110. [Google Scholar]
  80. Yu, M.L.; Hong, G.X.; Xu, H.; Zhu, G.W.; Zhu, M.Y.; Quan, Q.M. Effects of Cyanobacterial Blooms in Eutrophic Lakes on Water Quality of Connected Rivers. Huan Jing Ke Xue 2019, 40, 603–613. (In Chinese) [Google Scholar] [CrossRef] [PubMed]
Figure 1. Location of study area and Sampling points of Nanyi Lake.
Sustainability 15 09678 g001
Figure 2. (a) Direct derivation framework; (b) Machine learning framework.
Sustainability 15 09678 g002
Figure 3. (ad) Temporal variation characteristics of water quality in Nanyi Lake; (eh) Spatial variation characteristics of water quality in Nanyi Lake; (i,j) Correlation analysis of water quality in Nanyi Lake.
Sustainability 15 09678 g003aSustainability 15 09678 g003b
Figure 4. Correlation analysis between OLI band and TP based on Pearson correlation equation.
Sustainability 15 09678 g004
Figure 5. Algorithms from different frameworks: (a,b) Direct derivation algorithm; (c) Machine learning XGBoost; (d) Machine learning RF; (e) Machine learning SVR; (f) Machine learning BP.
Sustainability 15 09678 g005
Figure 6. Temporal and spatial distribution of TP concentration in Nanyi Lake during 2015–2021.
Sustainability 15 09678 g006
Figure 7. Spatial distribution of TP load into the lake.
Sustainability 15 09678 g007
Table 1. Characteristics of the Operational Land Imager (OLI) bands in Landsat 8.
BandsWavelength (μm)Resolution (m)Center Wavelength (μm)
Band1—Costal aerosol0.43–0.45300.443
Band2—Blue0.45–0.51300.483
Band3—Green0.53–0.59300.561
Band4—Red0.64–0.67300.655
Band5—Near-Infrared (NIR)0.85–0.88300.865
Band6—SWIR 11.57–1.65301.609
Band7—SWIR 22.11–2.29302.201
Band8—Panchromatic0.50–0.68150.59
Band9—Cirrus1.36–1.38301.373
Table 2. Data source and processing required for model operation.
Data RequiredData SourcesData Processing
Spatial Distribution Map of RainfallNational Meteorological Science Data Center China Ground Climate Data Day Dataset (V3.0)Download 2021 precipitation, temperature, wind speed, sunshine time, and other data from 13 relevant meteorological stations around the Nanyi Lake Basin. Python was used to calculate the multi-year average precipitation of all meteorological stations around the Nanyi Lake Basin, ArcMap (v10.8) was used to interpolate, project, resample and mask extraction of the obtained data, and the spatial distribution map of the annual average precipitation in the watershed was obtained by the Krieger interpolation method.
Potential evapotranspirationDaily Report Dataset of China’s Surface Climate Data (V3.0)Calculated by Equation (1)
Land use type rasterThe space of the Resource and Environment Science and Data Center of the Chinese Academy of Sciences has a resolution of 30 × 30 m.The required raster data was extracted by mask using the administrative boundary of the Nanyi Lake basin
DEM dataGeospatial data cloudsDownload four pieces of DEM data from the geospatial data cloud, use the tool “Mosaic to New Raster” in the ArcGIS toolbox to stitch them together, and the tool “Fill” in the hydrological analysis toolbox to fill the depressions, and then use the administrative boundaries of the Nanyi Lake Basin Clipping to get its DEM data.
Sub-basinsObtained from DEM data processingThe ArcGIS hydrological analysis module is used to fill the DEM of Nanyi Lake Basin, analyze the direction of water flow, calculate the length of the river and the accumulation of confluence, and extract the spatial distribution of sub-basins and hydrological networks in the study area. The entire Nanyi Lake watershed is divided into 359 sub-basins.
Maximum depth of the soil root systemWorld Soil Database (v1.2)Use the administrative boundary of the Nanyi Lake watershed to extract the required raster data according to the mask
Soil available water contentWorld Soil Database (v1.2)Calculated by Formula (2)
Flow accumulation thresholdsExperience coefficient, refer to InVEST user manual [40]The default value is 1000
Borselli KExperience coefficient, refer to InVEST user manual [40]The default value is 2
Table 3. Related literature on OAC band selection.
LocationBandAlgorithm
Qingcaosha Reservoir [54]Band 3, Band 4 ρ SPM = 10 B 4 / B 3 3 + b B 4 / B 3 2 + c B 4 / B 3 + d
Yellow River Estuary [55]Band 4, Band 5 L g SPM = 0.82389 + 13.18944 R rs 680 + 1.15577 R rs 745 / R rs 555
Zhoushan Islands [56]Band 2, Band 5 ρ SPM = 3.72 / 0.009 + e 5.249 B 5 / B 2
Korea [57]Band 2, Band 3, Band 4, Band 5 TP mg / L = 0.063 0.022 B 2 + 0.015 B 3 + 0.005 B 4 0.166 B 5 Chla mg / m 3 = 54.658 + 520.451 * B 2 1221.89 B 3 + 611.115 B 4 198.199 B 5
Sand Lake [58]Band 4 chla μ g / L = 4535.2 B 4 2 + 179 B 4 + 12.44
Xin’anjiang Reservoir [59]Band 1, Band 2
Band 3, Band 4
C TP = 0.0203 + 0.005 e 0.67098 R rs B 3 + R rs B 3 + R rs B 4 / R rs B 2
Disclaimer/Publisher’s Note: The statements, opinions and data contained in all publications are solely those of the individual author(s) and contributor(s) and not of MDPI and/or the editor(s). MDPI and/or the editor(s) disclaim responsibility for any injury to people or property resulting from any ideas, methods, instructions or products referred to in the content.

