Abstract
Promoting green investment and green industry development is necessary to transform from the traditional crude economic model to a high-quality and high-efficiency economic model. Based on the panel data of 30 provinces in China from 2007 to 2021, this paper uses the entropy method to measure the level of sustainable development, examines the direct and spillover effects of green investment on the level of sustainable development in China through the spatial Durbin model, explores the heterogeneous characteristics of the spatial effects, and reveals the specific path of green investment to promote sustainable development in China. The level of sustainable development in China has an apparent spatial correlation: green investment can simultaneously improve the level of sustainable development in the region and nearby regions, has a prominent intermediary role in promoting the level of sustainable development in the region, has apparent heterogeneity in promoting the level of sustainable development in China, and, in the east and regions with high urbanization rates, green investment has apparent spillover effects on the level of sustainable development. There is a significant heterogeneity of green investment in promoting sustainable development in China, with green investment in eastern and highly urbanized regions having a significant spillover effect on sustainable development, i.e., green investment in eastern and highly urbanized regions can significantly promote the development of sustainable levels in neighboring regions. Recommendations: Eastern regions and regions with high urbanization rates should actively make use of their resources, location, and technological advantages to enhance the spatial spillover effect of sustainable development to lead the development of the region, gradually form a regional collaborative development trend, and drive overall sustainable development.
1. Introduction
Since its reform and opening up, China’s economy has developed rapidly and become an important emerging global economy. However, the main issue facing China’s economic transformation is how to move from sloppy development to sustainable development. According to data released by the World Bank, China will have a GDP of 16.86 trillion USD in 2023, ranking second globally. In contrast to the year-on-year growth in total GDP, China’s GDP growth rate has declined in recent years; for example, in 2007, it was as high as 14.3%, and in 2022, it was 3%. The decline in economic growth results from a combination of factors, but the root cause lies in the maladjustment of the economic growth pattern. The beginning of China’s economic development was mainly driven by investment. Driven by this sloppy economic growth method, the economy faced many unbalanced and insufficiency problems. The main manifestations were the imbalance in industrial structure, the mismatch between the real economy and the virtual economy, and the mismatch between economic development and the affordability of the environment.
In the early stages of China’s economic growth, the resource and environmental problems became increasingly prominent, therefore, to achieve sustainable development, pollution control was required. However, pollution control requires a large amount of investment. As a new investment model for modern economic development, green investment does not pollute the environment and creates green capital and productivity. Whether the decision for green investment is appropriate or not also has a significant impact on the operation of the economy. As a financial activity for environmental protection, green investment has the potential to guide the green development of the economy, improve economic efficiency [], and improve the level of sustainable development. Therefore, it is of great significance to explore how green investment affects sustainable development and how to improve the level of sustainable development through green innovation.
With the long-term aim of achieving sustainable development, green investment is also referred to as environmental investment, environmental, social, and governance investment, socially or sustainably responsible investment, or responsible investment, a concept that suggests that green investment is an investment activity that protects the environment, reduces pollution, reduces carbon emissions, uses alternative energy sources, and conserves natural resources []. Other scholars consider green investment to be a broad term that exists at all levels: investments in underlying technologies and projects, green companies and financial products that invest in these projects, or even entire asset classes. Green investment can also stand alone or be a subset of a broader investment theme or closely related to other investment approaches [].
In recent years, the science of sustainability has gradually taken shape and developed as the concept of sustainability has become more widespread. The contradictory and dialectical relationship between sustainability and development is linked to various ideologies that involve two extreme ethical concepts: the ‘domination of nature’ and the ‘intrinsic right of nature’. The former is represented by the doctrine of ‘light ecology”, and the latter by ‘deep ecology’. Many approaches to these concepts attempt to reconcile this paradox and address the dialectic between development and sustainability []. Most of the existing studies have focused on sustainable development in specific regions and areas, such as countries, regions, and cities [,,,,], and industries, energy, and the environment [,,,], focusing on the theoretical connotation of sustainable development, the construction of indicators, comprehensive evaluation, influencing factors, and response strategies []. For example, at the national level, Madurai Elavarasan et al. (2022) developed a new Sustainable Development Goal or Energy Sustainability Composite Index to assess the energy sustainability performance of European countries []. At the regional level, by constructing a comprehensive evaluation system of sustainable development levels in the Yangtze River Delta region, Ni et al. (2022) evaluated the spatial and temporal changes in sustainable development in the Yangtze River Delta region. The research showed that the level of sustainable development in the Yangtze River Delta region is constantly improving and the level of sustainable development of cities is spatially unbalanced []. In addition, Liu et al. (2022) used regional data to find that technological innovation is an important factor affecting sustainable development and used natural resources to invest in technology to promote sustainable development []. Regarding industry, Ching et al. (2022) conducted a systematic literature review and identified 15 sustainability functions of Industry 4.0 for sustainable manufacturing. They explained how and in what order the various sustainability functions of Industry 4.0 contribute to the development of the economic, environmental, and social dimensions of sustainability []. Regarding the environment, Udemba and Tosun (2022) used relevant instruments and methods to scientifically test China’s economic and environmental performances. The trend in the relationship between the selected variables showed that China has the ability to achieve its climate and sustainable development goals by formulating policies around the energy sector and improving technology through strong institutions []. Regarding construction of indicators, Luo et al. (2022) investigated how policies affect the institutional quality of resource-based cities by constructing an institutional quality rating system covering the innovation environment, human resources, and market environment and used China’s “sustainable development plan for resource-based cities” as a benchmark experiment []. Opoku et al. (2022) used data from OECD countries in the period from 1996 to 2016 and a battery of estimation methods (Driscoll–Kraay, instrumental variable, and panel quantile regression methods). It was found that a rise in human development (captured by the human development index, education, and human capital) led to better environmental sustainability via the reduction in the ecological footprint, carbon dioxide (CO2) and total greenhouse gas (GHG) emissions, and exposure to air pollution [].
Green investment has become China’s main driver of green and sustainable development. However, China’s investment efficiency is low and the potential for investment cooperation is still considerable []. The current impact of green investment on sustainable development is mainly in environmental pollution and green innovation. For example, Ren et al. (2022) found that environmental pollution in China is characterized by significant spatial dependence. Green investment prevents local environmental pollution, but green investment does not prevent environmental pollution in neighboring areas []. Green investment and renewable energy consumption can also contribute to sustainable growth [,], as green investment can encourage clean energy consumption and thus reduce carbon emissions in highly polluting economies []. Rising climate risks have also driven investors and policymakers towards alternative energy sectors, leading to increased demand for renewable energy, and green investments can also improve long-term and short-term environmental quality through CO2 reductions [,]. Carbon dioxide can reduce market value in the short term [], while green investment can reduce short-term and long-term carbon emission levels, thereby improving the environmental pollution []. Shen et al. (2021) found that green investment is negatively correlated with carbon dioxide and suggested that China should promote green investment and environmentally friendly policies to reduce carbon dioxide emissions []. Green investments are the most economical way to reduce CO2 and overall costs. Promoting innovative renewable energy applications and strengthening renewable energy markets will help to protect ecosystems by reducing emissions at the local and global levels. This will also help to improve environmental conditions []. It has also been shown that green investments contribute significantly to green innovation [], achieving optimal efficiency with minimal effort [] and contribute to the achievement of sustainable development []. On the government side, green policies issued by the government promote a sustainable green economy through labor- and technology-oriented production activities []. Studies have shown that government intervention in green investment should shift from taxation to subsidies so that the government can profit from green technology []. Governments should also attract green inward FDI and invest in foreign technology-intensive industries to capture green technology spillovers and stimulate green innovation [] for sustainable development [].
Literature has demonstrated that sustainable policies and green investment are useful to achieve Sustainable Development Goals (SDGs) []. This work contributes to the achievement of the goal named “ensure sustainable consumption and production patterns” (SDG 12). Existing research has focused on the impact of green investment on environmental pollution and green innovation. The results show that green investment can reduce environmental pollution and promote green innovation. The research on sustainable development is rich, not only in specific areas but also on specific topics. Regarding specific areas, it mainly focuses on the research of countries, regions, and cities, and on specific topics, it mainly focuses on the research for industry, energy, and the environment, with little literature directly examining the impact of green investment on sustainable development. Based on this, this paper uses data from a provincial panel in China from 2007 to 2021 to explore whether and how green investment acts on sustainable development using a spatial Durbin model. Green investment generation will shorten regional differences in green innovation, which will affect the level of regional green development. Therefore, this paper chooses green innovation as a mediating variable to explore whether green investment can contribute to regional sustainable development levels. Through empirical research, we found that: (1) the sustainable development level of each region in China has a significant positive spatial correlation and spatial spillover effect; (2) green investment has a significant positive promoting effect on the sustainable development level of the region and a significant spatial spillover effect on the sustainable development level of neighboring regions; (3) green innovation has a significant intermediary effect; and (4) the heterogeneity test showed that eastern regions and regions with high urbanization rates have a significant spatial spillover effect. After robustness tests and consideration of endogenous issues, the findings remain significant.
The innovations and expected contributions of this study are: (1) to construct a comprehensive evaluation system for sustainable development from environmental, social, and economic perspectives and to test whether the level of sustainable development is spatially correlated between regions with the help of the Moran Index (which helps to explain the correlation and development between regions further); (2) to explore whether green investment has an apparent direct promotion effect and a spatial spillover effect on sustainable development. The increasing emphasis on green investment has gradually enriched research, however, the relevant literature still focuses on how green investment affects high-quality economic development, while more attention should be paid to its impact on sustainable development; (3) from the perspective of green innovation, this study innovatively explores the mediation path of green investment on the level of sustainable development, making up for the current lack of exploration of its mechanism; and (4) to systematically explore whether there is significant spatial heterogeneity in the impact of green investment on sustainable development.
The remainder of the paper is structured as follows: Section 2 theorizes on the relationship between green investment, green innovation, and sustainable development and presents the relevant research hypotheses; Section 3 presents the research design and indicator construction; Section 4 reports the results of the empirical tests of the research hypotheses; and Section 5 gives conclusions and recommendations.
2. Theoretical Analysis and Research Hypothesis
Green investment’s overall development objective corresponds to sustainable development’s primary connotation. Sustainable development is multidimensional in that, when evaluating a region’s level of sustainable development, it needs to be considered in terms of economic development, social welfare, ecological environment, etc. This multidimensionality makes sustainable development no longer solely dependent on a ‘single-issue’ dynamic mechanism but requiring a comprehensive strategy. Green investment is defined as a strategy that focuses on the protection of resources and the environment and considers the triple surplus of economy, environment, and society, making it necessary to consider not only economic development but also ecological and social development. Therefore, green investment also needs to consider multiple aspects of development. This corresponds to the multidimensional requirements of sustainable development.
Green investment can facilitate the participation of production and business entities in green transformation and effectively contribute to the improvement of sustainable development []. In the short term, green investment can enhance green product innovation and green process innovation, which can assist all types of products and business operators in adopting green production measures and gaining a sustainable competitive edge. Additionally, the increase in green investment can not only help enterprises to obtain profits [] but also improve social and economic conditions and quality of life []. In the long term, the long-term, balanced effects of green investment to meet the needs of green development can drive innovation in many environmental facilities and production processes. They can significantly increase the productivity of urban infrastructure and industry while improving the urban environment and quality of urban life, ensuring sustainable development [], and enhancing people’s subjective well-being [].
Having analyzed the above arguments, we propose Hypothesis 1 as follows.
Hypothesis 1.
Green investment can significantly enhance sustainable development.
Green investment can improve sustainable development by increasing the level of green innovation, and the development of green finance can reduce inter-regional inequalities in green credit and market segmentation, and increase green investment, thus reducing the gap in green innovation capacity between regions. Green investment promotes green innovation and fosters technological innovation to gain a sustainable competitive advantage []. At the same time, it promotes the development of green innovation in cities, which is the key to China’s timely completion of its carbon peak and carbon-neutral mission and to achieving green, low-carbon, and sustainable development.
Having analyzed the above arguments, we propose Hypothesis 2 as follows.
Hypothesis 2.
Green investment can contribute to sustainable development by enhancing green innovation.
At this stage, there is a large gap between the economic development levels of the eastern regions of China and the central and western regions. Due to their geographical location, resource environment, and energy reserves, there is still a significant gap regarding the green investment options between the eastern region and the central and western regions. Therefore, green investment in different regions has different impacts on sustainable development. Compared with the central and western regions, the green investment policies introduced by the government in the eastern region have been implemented for a more extended period and green investment has had time to develop and mature, with internal industrial technology innovation reaching a bottleneck. While increasing R&D investment in the eastern region, it is necessary to encroach on the adequate resources of the local region, which is not conducive to improving the level of sustainable development. This negative impact is long-term, and the regional adjustment cycle is long. If the green investment approach within the region is adjusted, its internal industrial structure will be further optimized, and the level of sustainable development will be significantly improved []. At the same time, the difference in the urbanization rate will also affect the effect of green investment. The regional factor endowments with higher urbanization rates are relatively rich, and the interconnection between regions is also very convenient. The more adjacent the economic space is, the more conducive it is to the flow of production factors such as capital and technology. In areas with low urbanization rates, there is competition for limited scarce production factors, and the transportation between regions is not convenient, which is not conducive to the flow of production factors such as capital and technology.
Having analyzed the above arguments, we propose Hypothesis 3 as follows.
Hypothesis 3.
There is regional heterogeneity in the impact of green investment on sustainable development.
3. Study Design
3.1. Model Construction
In fact, in any economic activity, no economic activity can operate in isolation, and economic activities in different regions are all related to some extent. Studies have shown a clear spatial correlation between green investment and sustainable development. Hence, this paper uses a spatial econometric model to empirically study the impact of green investment and sustainable development and their spatial spillover effects.
In order to test Hypotheses 1 and 3, the direct effect and spillover effect between green investment and sustainable development are analyzed, and whether the green investment has different effects on sustainable development in different regions is tested. This paper constructs a spatial Durbin model. The expression of the model is as follows:
where SDGit is the level of sustainable development, GIit is the level of green investment, URit is the level of urbanization, ISit is the industrial structure, EDUit is the level of education, RDit is the level of regional development, Wij GIit, Wij URit, Wij ISit, Wij EDUit, Wij RDit are the spatially lagged terms of the explanatory variables, μi, γt are individual and time effects, and εit is the random error term.
In order to test Hypothesis 2, to further investigate the mechanism of action between green investment and sustainable development, this paper draws on the stepwise regression method proposed by Baron and Kenny (1986) [] to test whether green innovation is a mediating variable between the two by building a spatial Durbin model with the following test steps:
Step 1: Construct the regression model (1).
The coefficient α1 of the regression model (1) is tested. α1 is the effect of green investment on sustainable development. If α1 is significant, step 2 of the test is conducted, and if α1 is not significant, there is no mediating effect.
Step 2: Construct regression models (2) and (3).
Test the coefficients λ1 and ν2 in regression Equations (2) and (3) in turn and proceed to step 3 if both λ1 and ν2 are significant, or step 4 if one is not.
Step 3: Test the coefficient ν1 in regression Equation (3) if there is no mediating effect. If ν1 is not significant, the mediating effect is completely mediated, that is, the independent variable GI will affect the dependent variable SDG, and it will inevitably go through the mediating variable to play a role. If ν1 is significant, the mediating effect is partially mediated, that is, the independent variable GI will affect the dependent variable SDG, and part of it will go through the mediating variable to play a role.
Step 4: Bootstrap test. If the test passes, the mediating effect passes, otherwise the mediating effect does not pass.
3.2. Variable Definition and Data Sources
3.2.1. Dependent Variable
The sustainable development level index (SDG), referring to previous studies and drawing on the ESG development concept, is the result of corporate governance in the ESG concept to promote national economic development; therefore, this paper uses the indicator of the economy instead of corporate governance and chooses three secondary indicators of environment, economy, and society and 25 tertiary indicators to measure the sustainable development level using entropy. The entropy weighting method is used to calculate the weight of each indicator. The specific indicators are shown in Table 1.

Table 1.
System of indicators for sustainable development levels.
3.2.2. Independent Variables
The measurement of the level of green investment is relatively mature, and this paper draws on the common practice of using the total amount of industrial pollution control, urban environmental infrastructure, and forestry investment and using the entropy value method to measure the level of green investment. The specific indicators and weights are shown in Table 2.
Table 2.
Green investment level indicator system.
3.2.3. Mediating Variable
This paper draws on the study by Guo et al. (2021) [] which uses the number of green patent applications to measure the level of green innovation (CEFF).
3.2.4. Control Variables
Concerning relevant studies on green investment and sustainable development, the level of urbanization (UR), industrial structure (IS), education level (EDU), and local development (RD) were chosen as the control variables in this paper. The specific indicators are explained in Table 3.
Table 3.
Indicators of control variables.
3.2.5. Spatial Weight Matrix
This paper mainly adopts the weight matrix constructed, based on the distance, for research and analysis. Specifically, the spherical distance between the sample cities was calculated through latitude and longitude to construct the geographic distance weight matrix W1, and the distance squared inverse matrix W2 was calculated using this as the base matrix.
3.2.6. The Descriptive Statistics for Each Variable
The Descriptive Statistics for Each Variable are shown in Table 4.
Table 4.
Descriptive statistics results.
3.2.7. Data Sources
This paper used panel data from 2007 to 2021 from 30 provinces (municipalities directly under the Central Government and autonomous regions) in China (excluding Hong Kong, Macao, and Taiwan, as well as Tibet, where data are seriously missing) as the research sample, and the data were obtained from the China Statistical Yearbook and the China Environmental Statistical Yearbook, the China Energy Statistical Yearbook of various cities in previous years, and the data analysis and model estimation.
4. Empirical Results
4.1. Spatial Correlation Analysis
Based on the geographic matrix, Moran’s I index was used to conduct a spatial correlation analysis of the sustainable development level, and the results are shown in Table 5. It can be seen that the sustainable development level index is significantly positive at the 1% level for Moran’s I index between 2007 and 2021, indicating that the sustainable development index has significant spatially dependent characteristics.
Table 5.
Moran index results.
The curve based on Moran’s I index for each year is plotted in Figure 1, it shows that Moran’s I index was on an upward trend between 2007 and 2016 before suddenly dropping in 2017 and rising again year after year.
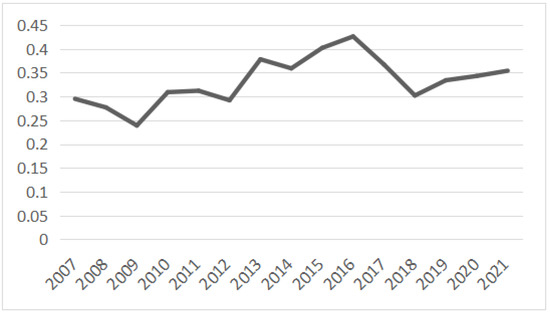
Figure 1.
Moran’s I index curve.
4.2. Testing and Analysis
Before the data could be analyzed in a spatial panel Durbin model, a series of tests were required to determine the specific form of the model, and the results of the tests for spatial model selection are shown in Table 6. Firstly, the LM test was conducted, and the results showed the following: the LM and R-LM statistics of 26.957 and 15.265 both passed the significance test, indicating that the model has both spatial error and spatial lag characteristics and can be used as a spatial Durbin model; secondly, the LR test and Wald test were used to test further whether the spatial Durbin model can be reduced to a spatial lag model or a spatial error model. Suppose the results showed that both the LR statistic and the Wald statistic pass the significance test. In that case, the original hypothesis that the spatial Durbin model can be simplified to a spatial lag model or a spatial error model can be rejected. Secondly, if, according to the results of the Hausman test, the statistics are also significant, then the original hypothesis of using a random effects model is rejected. Finally, the spatial fixed effects and time fixed effects models were tested by constructing LR statistics. The results showed that the individual effect and time effect LR test statistics both passed the significance test and therefore, a model with both time and individual fixed effects should be used. Based on the results of each spatial econometric model selection test, this paper chose the time individual double fixed effects spatial panel Durbin model for testing and analysis.
Table 6.
Test results.
4.3. Analysis of Spatial Regression Results
The estimation results of the spatial panel Durbin model are shown in Table 7. From the estimation results, it can be seen that the regression coefficient of the spatially lagged term of the sustainable development level in the model (1), rho, was 0.256 and is significantly positive at the 1% level, indicating that there was indeed a significant spatial correlation between the sustainable development levels of the regions, further validating the rationality of using the spatial econometric model for empirical analysis.
Table 7.
Analysis of the regression results.
The coefficient of green investment (GI) of 0.053 was significantly positive at the 1% level. From the estimation results, the green investment in each province had a particular promotional effect on the region’s sustainable development level. Under the guidance of green investment and other green financial instruments, social capital will continue to flow to the environmental protection industry, thus achieving industrial restructuring. Cleaner enterprises will replace more polluting ones, pollution emissions will be reduced, and local, sustainable development will be improved.
The coefficient of the spatially lagged term of the green investment (WGI) of 0.156 was significantly positive at the 1% level, and the results showed that there is indeed a substantial spatial spillover effect of green investment on the level of sustainable development.
Among the other controls, the coefficients of the urbanization level (UR) and the spatial lag of the urbanization level (WUR) both had a significant negative impact on the level of sustainable development, indicating that the level of urbanization not only inhibits the level of sustainable development in the region but also limits the level of sustainable development in the surrounding areas. The spatial lag term of the industrial structure (WIS) had a significantly positive impact on sustainable development. This means that the industrial structure did not significantly contribute to the sustainable development level of the region but could significantly contribute to the sustainable development level of the surrounding areas. The coefficient of the education level (EDU) was significantly positive. However, the spatial lag term (WEDU) coefficient was not significant, indicating that the education level could significantly contribute to the sustainable development level of the region but not to the surrounding areas. The coefficient of local development (RD) was significantly positive. However, the spatial lag term (WRD) coefficient was not significant, indicating that local development could significantly contribute to the level of sustainable development in the region but not in the surrounding areas.
Other mediating effects were carried out: from (1), it could be seen that the coefficient of GI was 0.053 and is significantly positive at the 1% level; the second test could then be carried out; from (2), it was seen that the coefficient of GI was 0.012 and is significantly positive at the 1% level; from (3), it was seen that the coefficient of CEFF was 1.482 and is significantly positive at the 1% level, while the coefficient of GI was 0.038 and is significantly positive at the 5% level. The next step was to conduct a Bootstrap test on the mediating effect, as seen in Table 8, where the mediating effect passed the Bootstrap test at the 1% level. In other words, green investment improves the level of sustainable development by enhancing the level of green innovation.
Table 8.
Bootstrap test.
In Table 7, we can only make preliminary judgments on the spatial spillover effects of variables such as green investment. Due to the existence of spatially lagged terms of variables in the spatial Durbin model, using point estimates to test spatial spillover effects may result in model estimation errors, so it is necessary to further decompose spatial spillover effects into direct, indirect, and total effects, as shown in Table 9.
Table 9.
Results of the decomposition effects.
The direct effect measures the impact of variables such as green investment on the region’s sustainable development level, i.e., the local effect of green investment. According to the results of the direct effect estimation from Table 9, the coefficient of the direct effect of green investment on the level of sustainable development was 0.062, which is significantly positive at the 1% level, indicating that green investment has a positive effect on the level of sustainable development in the region. The indirect effect measures the impact of variables such as green investment on the sustainable development level of neighboring regions, i.e., the neighborhood spillover effect of green investment. According to the results of the indirect effect estimation, the coefficient of the indirect effect of green investment on the level of sustainable development was 0.222, which is significantly positive at the 1% level.
From a direct effect perspective, green investment can, on the one hand, increase the source of funds for green energy-saving and environmentally friendly industries, reduce their financing costs, provide sufficient financial support for enterprises’ technological innovation, and create new industries and new models that take environmental protection, economic development, and social responsibility into account. On the other hand, green investment can promote the transformation and upgrading of traditional industries. In the context of the country’s vigorous implementation of the concept of green development and the continuous strengthening of “green water and green mountains is the silver mountain of gold”, some traditional industries do not receive timely financial support and lack the vitality of technological innovation and are eventually eliminated from the market. In contrast, traditional industries with solid technological innovation capabilities rely on their ability to carry out green technological innovation. As a result, they are favored by investors and eventually rejuvenated, providing a strong impetus for sustainable development. In terms of indirect effects, as the level of regional green investment increases, it is easier to build better green industry linkages through regional connections and promote regional cooperation and technology diffusion through the development of green technology industries so that the spillover effects of green investment can be better brought into play, which in turn plays a leading role in green technology innovation in neighboring cities, promoting the transformation and upgrading of industrial structures and the sustainable development level of neighboring areas.
The mechanism of green investment through green innovation to influence the level of sustainable development has a direct effect and a positive contribution to the region’s sustainable development level; this part is partly mediated. Green innovation makes the production process green, resource allocation efficient, and promotes the region’s sustainable development. In the indirect effect, the coefficient of green investment on green innovation was −0.001, insignificant, and this partial mediating effect is invalid.
4.4. Heterogeneity Test
Due to the differences in economic development between the eastern, central, and western regions of China, the effect of green investment on the level of sustainable development may differ between different regions. Therefore, we conducted a heterogeneity analysis according to the division between the eastern, central, and western regions to examine the differences in the impact of green investment on the level of sustainable development in different regions. The results of the heterogeneity analysis are shown in Table 10.
Table 10.
Heterogeneity test results.
Table 10 shows that in the eastern region, where the level of economic development is relatively high, green investment contributes little to the local level of sustainable development. However, it will significantly contribute to the level of sustainable development in the neighboring regions. However, in the central and western regions, where the level of economic development is relatively low, green investment will not only significantly contribute to the level of sustainable development in the region but also significantly contribute to the level of sustainable development in the neighboring regions. However, the spillover effect is less potent than that in the eastern region. The possible reason for this is that the green investment in the eastern region was developed earlier, and the various environmental regulatory policies introduced by the government have been in place for a long time. Therefore, increasing the level of green investment does not significantly improve local, sustainable development. Moreover, the spatial spillover effect is more significant in the eastern region because of its higher regional correlation and the spatial spillover effect is lower in the central and western regions where regional connectivity is lower.
Differences in urbanization rates can also affect the effectiveness of green investment. Therefore, this paper uses the median urbanization rate of all provinces as the classification criterion and divides the sample of 30 provinces into low urbanization rates (below the median) and high urbanization rates (above the median) to estimate the spatial SDM model using two groups of samples. The estimation results are shown in Table 10.
In areas with relatively high urbanization rates, green investment can significantly contribute to local, sustainable development levels as well as the sustainable development levels of neighboring areas. However, in regions with lower urbanization rates, the spillover effect of green investment on sustainable development levels is not significant. The possible reason for this is that regions with higher urbanization rates are relatively rich in factor endowments and have easy interconnections between regions, so the more adjacent they are in economic space, the more conducive they are to the flow of factors of production, such as capital and technology, so the increase in green investment in the region will have a positive spillover effect on the level of sustainable development in neighboring regions. In contrast, competition for a limited number of scarce production factors exists in all regions with low urbanization rates, and transportation between regions could be more convenient. Hence, the spillover effect of increased green investment in the region on neighboring regions in economic space is not significant.
4.5. Robustness Tests
This paper empirically tests the impact of green investment on the level of sustainable development by using a fixed spatial Durbin model. The study finds that green investment not only helps to enhance the level of local, sustainable development but also generates significant spatial spillover effects and enhances the level of sustainable development in neighboring regions. In order to verify the validity and robustness of the above findings, the robustness test was conducted by replacing the spatial weight matrix, changing the sample size, and lagging by one period.
The robustness test was based on the geographic adjacency spatial weight matrix. In order to ensure the reliability of the previous empirical results, this paper used the geographical location relationship between 30 provinces (cities) in China as the spatial weight matrix, i.e., if two provinces (cities) are geographically adjacent, wij = 1; otherwise, wij = 0. Table 11 shows the empirical results of the double fixed effects spatial Durbin model based on the spatial weight matrix of geographical adjacency. The correlation coefficient of the spatial Durbin model based on the geographic neighborhood spatial weight matrix was 0.236, which is significant at the 1% level. The estimated coefficients differ slightly in magnitude from those of the Durbin model based on the geographic distance matrix. However, there is no fundamental change in the direction of the coefficients, indicating the robustness of the empirical results in the previous section.
Table 11.
Robustness test results.
Excluding municipalities directly under the central government.
The differences in sustainable development levels among Chinese provinces, especially the relatively high sustainable development levels of China’s four municipalities directly under the central government, may lead to inconsistent growth effects in sustainable development. Therefore, to verify the generality of the findings of this paper, the panel data of the four municipalities directly under the Central Government of Beijing, Tianjin, Shanghai, and Chongqing were excluded, and the regression results are shown in Table 11. As can be seen, the correlation coefficient of the spatial Durbin model based on the spatial distance matrix is 0.330, significant at the 1% level, and the estimated coefficient size has changed. However, there is no significant change in its direction or significance level, again indicating that the results of this paper are robust.
Robustness tests based on endogeneity.
In the empirical analysis, reverse causality may make the empirical results endogenous. To examine the endogeneity problem, the explanatory variables are lagged by one period in this paper. The results are presented in Table 11, where the correlation coefficient of the spatial Durbin model based on the geospatial distance matrix is 0.225, significant at the 1% level. The magnitude of the estimated coefficients of the explanatory variables changed. However, their direction and significance level did not change significantly, indicating that the empirical results in the previous section remain robust.
5. Conclusions and Recommendations
5.1. Conclusions
Using the spatial Durbin model, this paper uses panel data from 30 provinces, autonomous regions, and municipalities in China from 2007 to 2021 to study the relationship between green investment and sustainable development. It then uses green innovation as a mediating variable to test the impact of green investment on the level of sustainable development separately, the impact pathways of green investment for sustainable development are explained more systematically.
Overall, our research has found that green investment plays an important role in promoting sustainable development, especially towards the goal of ensuring sustainable consumption and production patterns (SDG 12). In fact, increasing green investment can effectively contribute to increased production efficiency, reduced energy consumption and environmental pollution, leading to a sustainable development through more inclusive and sustained production pattern. It is also found that green innovation plays a mediating role. Namely, green investment can drive sustainable development by influencing green innovation. Increase in green investment can drive technological innovation to produce new products and improve production processes, which further advance environmental protection and innovation capabilities, improve pollution control and energy saving technologies, and promote breakthroughs in cultivating a sustainable consumption and production patterns.
Three main conclusions are the followings:
- (1)
- The level of sustainable development in various regions of China has an obvious positive spatial correlation and spatial spillover effect. Green investment has a significant positive effect on the level of sustainable development in the region and has a significant spatial spillover effect on the level of sustainable development in neighboring regions. The possible reason is that under the guidance of green investment and other green financial instruments, social funds continue to flow to the environmental protection industry, achieving industrial restructuring. More polluting enterprises are replaced by clean enterprises, pollution emissions are reduced, and the level of sustainable development in local and adjacent areas is improved.
- (2)
- Green innovation has a significant mediating effect between green investment and sustainable development. The possible reason is that with the improvement in the regional green investment level, it is easier to build a better green industry association through regional connections and promote regional cooperation and technology dissemination through the development of the green technology industry so that the direct effect and spillover effect of green investment can more easily occur so it can then play a leading role in green technology innovation in local and adjacent areas, promote the transformation and upgrading of industrial structures, and promote the sustainable development level of local and adjacent areas.
- (3)
- For the eastern region, the direct effect of green investment on the level of sustainable development is not significant and the spillover effect is obvious. However, for the regions with low urbanization rates, the direct effect is significant and the spillover effect is not significant. The possible reason is that green investment in the eastern region has already been carried out, the government’s environmental regulation policies have been implemented for a long time, and green investment has matured there. Therefore, raising the level of green investment does not significantly improve the level of local sustainable development. In addition, the regional correlation degree of the eastern region is high and the spatial spillover effect is significant. In areas with low urbanization rates, there is competition for limited scarce production factors and transportation between regions is not convenient. Therefore, the spillover effect of the promotion of green investment in the region on the adjacent areas of economic space is not significant.
5.2. Recommendations
As an effective means of sustainable development, green investment can promote the active participation of various economic agents in ecological and environmental governance, fulfill their social responsibilities, and significantly improve sustainable development. Based on the above findings, the following recommendations are made:
Firstly, sound intra-regional linkage strategies should be established to utilize the spatial spillover effects of sustainable development levels effectively. The analysis showed that the level of sustainable development has significant positive spatial correlation and spatial spillover effects. Therefore, each region should strive to promote its sustainable development level, make full use of the spatial spillover effect, and promote each other through regional linkages. While improving the quality of their development, regions with a high level of sustainable development should actively make use of their resources, location, and technological advantages to enhance the spatial spillover effect of sustainable development to play a role in leading the whole region, gradually forming a regional collaborative development trend and driving overall sustainable development.
Secondly, we should continue to increase the scale and areas of green investment and implement differentiated strategies for green investment in each region to improve the quality and efficiency of investment and help achieve the goal of sustainable development. When green investment reaches a particular scale, we should actively explore new investment methods and areas and strive to achieve economic benefits while also considering environmental and social benefits, thereby promoting sustainable development. For productive green investment, the cycle of economic benefits needs to be shortened and the pace of green innovation accelerated. At the same time, cooperation between regions should be strengthened to enhance the scale effect of green industry development and promote the quality and efficiency of the overall economy and cross-regional collaborative development.
Third, the development environment of green innovation should be optimized to enhance the effect of environmental factors on the efficiency of regional green innovation, obtain the technology spillover effect by introducing foreign advanced technology, and continue to digest and absorb on this basis so as to improve their own innovation ability and carry out re-innovation. To promote the progress of green technology in China, there should be an in-depth implementation of the talent support road, strengthening of the cultivation of innovative talents, talent support provided for the development of regional green innovation, the market-oriented implementation of strict green innovation intellectual property protection, the continual strengthening of the enforcement of intellectual property rights, expansion of the scope of intellectual property protection, and an institutional guarantee provided for the development of green innovation activities.
Author Contributions
Conceptualization, L.L.; Methodology, H.W. All authors have read and agreed to the published version of the manuscript.
Funding
This research received no external funding.
Institutional Review Board Statement
Not applicable.
Informed Consent Statement
Not applicable.
Data Availability Statement
Not applicable.
Conflicts of Interest
The authors declare no conflict of interest.
References
- Wang, L.; Su, C.; Ali, S.; Chang, H. How China is fostering sustainable growth: The interplay of green investment and production-based emission. Environ. Sci. Pollut. Res. 2020, 27, 39607–39618. [Google Scholar] [CrossRef]
- Chen, Y. The Driver of Green Innovation and Green Image-Green Core Competence. J. Bus. Ethics 2008, 81, 531–543. [Google Scholar] [CrossRef]
- Inderst, G.; Kaminker, C.; Stewart, F. Defining and Measuring Green Investments: Implications for Institutional nvestors’ Asset Allocations. In OECD Working Papers on Finance, Insurance and Private Pensions; OECD Publishing: Paris, France, 2012; p. 24. [Google Scholar]
- Jabareen, Y. A New Conceptual Framework for Sustainable Development. Environ. Dev. Sustain. 2008, 10, 179–192. [Google Scholar] [CrossRef]
- Broadstock, D.C.; Chan, K.; Cheng, L.T.W.; Wang, X. The role of ESG performance during times of financial crisis: Evidence from COVID-19 in China. Financ. Res. Lett. 2021, 38, 101716. [Google Scholar] [CrossRef] [PubMed]
- Manioudis, M.; Angelakis, A. Creative Economy and Sustainable Regional Growth: Lessons from the Implementation of Entrepreneurial Discovery Process at the Regional Level. Sustainability 2023, 15, 7681. [Google Scholar] [CrossRef]
- Fahad, S.; Almawishir, N.; Benlaria, H. Using the PLS-SEM Model to Measure the Impact of the Knowledge Economy on Sustainable Development in the Al-Jouf Region of Saudi Arabia. Sustainability 2023, 15, 6446. [Google Scholar] [CrossRef]
- Li, S.; You, S.; Liu, D.; Wang, Y. National Quality and Sustainable Development: An Empirical Analysis Based on China’s Provincial Panel Data. Sustainability 2023, 15, 4879. [Google Scholar] [CrossRef]
- Liu, A.; Cai, L.; Chen, F. Evolutionary Path and Sustainable Optimization of an Innovation Ecosystem for a High-Tech Enterprise Based on Empirical Evidence from Hubei Province. Sustainability 2023, 15, 770. [Google Scholar] [CrossRef]
- Shen, Y.; Guo, X.; Zhang, X. Digital Financial Inclusion, Land Transfer, and Agricultural Green Total Factor Productivity. Sustainability 2023, 15, 6436. [Google Scholar] [CrossRef]
- Zhang, Y.; Xia, Z.; Li, Y.; Dai, A.; Wang, J. Sustainable Digital Marketing Model of Geoenergy Resources under Carbon Neutrality Target. Sustainability 2023, 15, 2015. [Google Scholar] [CrossRef]
- Yang, C.; Masron, T.A. Impact of Digital Finance on Energy Efficiency in the Context of Green Sustainable Development. Sustainability 2022, 14, 11250. [Google Scholar] [CrossRef]
- Renyong, H.; Sedik, A.A. Environmental Sustainability and Foreign Direct Investment in East Africa: Institutional and Policy Benefits for Environmental Sustainability. Sustainability 2023, 15, 1521. [Google Scholar] [CrossRef]
- Madurai Elavarasan, R.; Pugazhendhi, R.; Irfan, M.; Mihet-Popa, L.; Campana, P.E.; Kan, I.A. A novel Sustainable Development Goal 7 composite index as the paradigm for energy sustainability assessment: A case study from Europe. Appl. Energy 2022, 307, 118173. [Google Scholar] [CrossRef]
- Ni, R.; Wang, F.; Yu, J. Spatiotemporal changes in sustainable development and its driving force in the Yangtze River Delta region, China. J. Clean. Prod. 2022, 379, 134751. [Google Scholar] [CrossRef]
- Liu, Q.; Sun, H.; Luo, H. Resource-richness, technological innovation, and sustainable development: Evidence from emerging economies. Resour. Policy 2022, 79, 103047. [Google Scholar] [CrossRef]
- Ching, N.T.; Ghobakhloo, M.; Iranmanesh, M.; Maroufkhani, P.; Asadi, S. Industry 4.0 applications for sustainable manufacturing: A systematic literature review and a roadmap to sustainable development. J. Clean. Prod. 2022, 334, 130133. [Google Scholar] [CrossRef]
- Udemba, E.N.; Tosun, M. Moderating effect of institutional policies on energy and technology towards a better environment quality: A two dimensional approach to China’s sustainable development. Technol. Forecast. Soc. Chang. 2022, 183, 121964. [Google Scholar] [CrossRef]
- Luo, L.; Liu, P.; Zhu, F.; Sun, Y.; Liu, L. Policy objective bias and institutional quality improvement: Sustainable development of resource-based cities. Resour. Policy 2022, 78, 102932. [Google Scholar] [CrossRef]
- Opoku, E.E.O.; Dogah, K.E.; Aluko, O.A. The contribution of human development towards environmental sustainability. Energy Econ. 2022, 106, 105782. [Google Scholar] [CrossRef]
- Fan, Q.; Liu, J.; Zhang, T.; Liu, H. An Evaluation of the Efficiency of China’s green investment in the “Belt and Road” countries. Struct. Chang. Econ. Dyn. 2022, 60, 496–511. [Google Scholar] [CrossRef]
- Ren, S.; Hao, Y.; Wu, H. How Does Green Investment Affect Environmental Pollution? Evidence from China. Environ. Resour. Econ. 2022, 81, 25–51. [Google Scholar] [CrossRef]
- Wan, Y.; Sheng, N. Clarifying the relationship among green investment, clean energy consumption, carbon emissions, and economic growth: A provincial panel analysis of China. Environ. Sci. Pollut. Res. 2022, 29, 9038–9052. [Google Scholar] [CrossRef] [PubMed]
- Zahan, I.; Chuanmin, S. Towards a green economic policy framework in China: Role of green investment in fostering clean energy consumption and environmental sustainability. Environ. Sci. Pollut. Res. 2021, 28, 43618–43628. [Google Scholar] [CrossRef] [PubMed]
- Rokhmawati, A. The nexus among green investment, foreign ownership, export, greenhouse gas emissions, and competitiveness. Energy Strategy Rev. 2021, 37, 100679. [Google Scholar] [CrossRef]
- Musah, M.; Owusu-Akomeah, M.; Kumah, E.A.; Mensah, I.A.; Nyeadi, J.D.; Murshed, M.; Alfred, M. Green investments, financial development, and environmental quality in Ghana: Evidence from the novel dynamic ARDL simulations approach. Environ. Sci. Pollut. Res. 2022, 29, 31972–32001. [Google Scholar] [CrossRef]
- Salehi, M.; Fahimifard, S.H.; Zimon, G.; Bujak, A.; Sadowski, A. The Effect of CO2 Gas Emissions on the Market Value, Price and Shares Returns. Energies 2022, 15, 9221. [Google Scholar] [CrossRef]
- Li, Z.; Li, R.Y.M.; Malik, M.Y.; Murshed, M.; Khan, Z.; Umar, M. Determinants of Carbon Emission in China: How Good is Green Investment? Sustain. Prod. Consum. 2021, 27, 392–401. [Google Scholar] [CrossRef]
- Shen, Y.; Su, Z.; Malik, M.Y.; Umar, M.; Khan, Z.; Khan, M. Does green investment, financial development and natural resources rent limit carbon emissions? A provincial panel analysis of China. Sci. Total Environ. 2021, 755, 142538. [Google Scholar] [CrossRef]
- Omer, A.M. Energy, environment and sustainable development. Renew. Sustain. Energy Rev. 2008, 12, 2265–2300. [Google Scholar] [CrossRef]
- Zhang, X.; Song, Y.; Zhang, M. Exploring the relationship of green investment and green innovation: Evidence from Chinese corporate performance. J. Clean. Prod. 2023, 412, 137444. [Google Scholar] [CrossRef]
- Zhang, H.; Shao, Y.; Han, X.; Chang, H. A road towards ecological development in China: The nexus between green investment, natural resources, green technology innovation, and economic growth. Resour. Policy 2022, 77, 102746. [Google Scholar] [CrossRef]
- Huang, H.; Wang, F.; Song, M.; Balezentis, T.; Streimikiene, D. Green innovations for sustainable development of China: Analysis based on the nested spatial panel models. Technol. Soc. 2021, 65, 101593. [Google Scholar] [CrossRef]
- Liu, H.; Tang, Y.M.; Iqbal, W.; Raza, H. Assessing the role of energy finance, green policies, and investment towards green economic recovery. Environ. Sci. Pollut. Res. 2022, 29, 21275–21288. [Google Scholar] [CrossRef] [PubMed]
- Zhang, X.; Yousaf, H.M.A.U. Green supply chain coordination considering government intervention, green investment, and customer green preferences in the petroleum industry. J. Clean. Prod. 2020, 246, 118984. [Google Scholar] [CrossRef]
- Luo, Y.; Salman, M.; Lu, Z. Heterogeneous impacts of environmental regulations and foreign direct investment on green innovation across different regions in China. Sci. Total Environ. 2021, 759, 143744. [Google Scholar] [CrossRef] [PubMed]
- Liu, L.; Wang, Z.; Zhang, Z. Matching-game approach for green technology investment strategies in a supply chain under environmental regulations. Sustain. Prod. Consum. 2021, 28, 371–390. [Google Scholar] [CrossRef]
- Ali, S.M.; Appolloni, A.; Cavallaro, F.; D’Adamo, I.; Di Vaio, A.; Ferella, F.; Gastaldi, M.; Ikram, M.; Kumar, N.M.; Martin, M.A.; et al. Development Goals towards Sustainability. Sustainability 2023, 15, 9443. [Google Scholar] [CrossRef]
- Ahmed, Z.; Ahmad, M.; Murshed, M.; Shah, M.I.; Mahmood, H.; Abbas, S. How do green energy technology investments, technological innovation, and trade globalization enhance green energy supply and stimulate environmental sustainability in the G7 countries? Gondwana Res. 2022, 112, 105–115. [Google Scholar] [CrossRef]
- Zimon, G.; Tarighi, H.; Salehi, M.; Sadowski, A. Assessment of Financial Security of SMEs Operating in the Renewable Energy Industry during COVID-19 Pandemic. Energies 2022, 15, 9627. [Google Scholar] [CrossRef]
- Savchenko, A.B.; Borodina, T.L. Green and Digital Economy for Sustainable Development of Urban Areas. Reg. Res. Russ. 2020, 10, 583–592. [Google Scholar] [CrossRef]
- Feng, S.; Chong, Y.; Li, G.; Zhang, S. Digital finance and innovation inequality: Evidence from green technological innovation in China. Environ. Sci. Pollut. Res. 2022, 29, 87884–87900. [Google Scholar] [CrossRef] [PubMed]
- Wu, W.; Yu, L. How Does Environmental Corporate Social Responsibility Affect Technological Innovation? The Role of Green Entrepreneurial Orientation and Green Intellectual Capital. J. Knowl. Econ. 2023. [Google Scholar] [CrossRef]
- Baron, R.M.; Kenny, D.A. The moderator-mediator variable distinction in social psychological research: Conceptual, strategic, and statistical considerations. J. Pers. Soc. Psychol. 1986, 51, 1173–1182. [Google Scholar] [CrossRef]
- Guo, J.; Zhou, Y.; Ali, S.; Shahzad, U.; Cui, L. Exploring the role of green innovation and investment in energy for environmental quality: An empirical appraisal from provincial data of China. J. Environ. Manag. 2021, 292, 112779. [Google Scholar] [CrossRef] [PubMed]
Disclaimer/Publisher’s Note: The statements, opinions and data contained in all publications are solely those of the individual author(s) and contributor(s) and not of MDPI and/or the editor(s). MDPI and/or the editor(s) disclaim responsibility for any injury to people or property resulting from any ideas, methods, instructions or products referred to in the content. |
© 2023 by the authors. Licensee MDPI, Basel, Switzerland. This article is an open access article distributed under the terms and conditions of the Creative Commons Attribution (CC BY) license (https://creativecommons.org/licenses/by/4.0/).