Article

Cross-Regional Allocation of Human Capital and Sustainable Development of China’s Regional Economy—Based on the Perspective of Population Mobility

1
Economy College, Guangxi University, Nanning 530004, China
2
College of Mathematics and Information Science, Guangxi University, Nanning 530004, China
*
Author to whom correspondence should be addressed.
Sustainability 2023, 15(12), 9807; https://doi.org/10.3390/su15129807
Submission received: 20 May 2023 / Revised: 12 June 2023 / Accepted: 14 June 2023 / Published: 20 June 2023

Abstract

:
Using the panel data of cities at the prefecture level and above in China, based on the endogenous growth theory, this study aims to explore the influence of the cross-regional allocation of human capital on regional economic sustainable development. Least squares estimation and stepwise regression methods were adopted for an empirical test, and the results showed that (1) the cross-regional allocation of human capital can significantly promote regional economic sustainable development; (2) labor productivity, industrial structure, and regional innovation capacity play mediating roles in the relationship between the cross-regional allocation of human capital and regional economic sustainable development; (3) household registration policy plays a negative moderating role in the influence of cross-regional allocation of human capital on regional economic sustainable development; (4) after considering the potential endogenous problems and conducting additional robustness analysis, including changing the independent variable and changing the dependent variable, our main results remain robust and reliable. With the development of the economy, the cross-regional allocation of human capital plays an important role in regional economic sustainable development. Thus, in order to improve regional economic sustainable development, it is imperative for governments to promote a reform of the household registration system, to guide the rational mobility of population, and to optimize the regional allocation of human capital.

1. Introduction

After entering The New Normal (the concept of “The New Normal” was first developed by Mohamed El-Erian (President of American Pacific Fund Management) in 2008 to predict the likely long-term trend of world economic growth after the 2008 international financial crisis), China’s economy has been growing slowly [1]. This is not a “China-specific phenomenon”, but a systematic trend in the process of industrialization to urbanization, the “inevitable road” of economic growth [2], and an upgraded version of economic development [3]. The United States, Britain, France, Italy, Japan and other developed countries have generally experienced low-speed growth. China’s economy is undergoing the transformation of industrialization and urbanization that developed countries experienced decades ago [4]. Therefore, the report of the 19th CPC National Congress has clearly stated that China’s economy has shifted from the high-speed growth stage to a high-quality development stage [5,6], which reveals the characteristics of China’s economy (Figure 1).
The sustained decline of the economic growth rate means that the impetus to support rapid economic growth is gradually weakening [7]. From a domestic perspective, the elasticity of capital output declines [8], the size of the population decreases, and there are more and more aging people [9,10], and the “learning by doing” effect is not ideal [11,12]. In addition, the current institution has hindered technological innovation and distorted human capital allocation [13]. From an international perspective, the global economy has fallen into a rapid recession due to the impact of the COVID-19 epidemic [14], and China is no exception. It is obvious that the impetus, which has promoted economic growth in the past, can no longer meet the requirements of high-quality development [15,16]. It is urgent to transform the economic growth impetus from factor-driven to innovation-driven [17,18].
Innovation becomes an economic growth impetus, which must rely on human capital. At present, the stock of human capital has increased in China, but the allocation of human capital among regions is not optimal enough [19]. It may be the current institution that hinders population mobility [20], which leads to mismatch of human capital with regional economy, for example, “high-skilled labor shortage and low-skilled labor surplus” coexists [21]. Since 2022, in China’s labor market, the recruitment and employment dilemma has become more prominent, and human capital mismatch is even more serious. This phenomenon has seriously hindered China’s economic growth [22]. Therefore, reasonably guiding population mobility and optimizing the cross-regional allocation of human capital will undoubtedly help to promote sustained economic development [23].
The cross-regional allocation of human capital relies mainly on population mobility [24]. As a factor of production, population mobility increases the stock of the human capital of a destination and decreases that of departure, which is a rematch of human capital [25]. This is why we can study the cross-regional allocation of human capital from the perspective of population mobility.
In short, China’s economy is growing slowly, the impetus to support rapid economic growth is gradually weakening, and it is urgent to transform the economic growth impetus from factor-driven to innovation-driven [26]. In this context, cultivating new growth impetus to promote regional sustainable development is an urgent theoretical and practical problem.
At present, most literature on this aspect focuses on theoretical research and at the national level (such as Ren baoping, 2022; Wang Yiming, 2017; Yuan Fuhua, 2012) [3,4,27]. Empirical studies are relatively rare at the regional level, especially at the urban level, which leads to the lack of a clear understanding of growth impetus and the lack of a theoretical basis for policy formulation.
Therefore, using the panel data of cities at the prefecture level and above in China, based on the endogenous growth theory, this study aims to explore the influence of the cross-regional allocation of human capital on regional economic sustainable development, in order to tap new economic growth impetus and promote sustainable regional economic development.
Compared with the existing literature, the marginal contribution of this paper is mainly embodied in the following three aspects:
Firstly, possible theoretical contributions. We clarify theoretically the influence mechanism of the cross-regional allocation of human capital on regional economic sustainable development. That is, the cross-regional allocation of human capital has a direct effect on economic growth; in addition, it also has an indirect effect on economic growth through labor productivity, industrial structure, and regional innovation capacity. The household registration policy plays a negative moderating role in the influence of cross-regional allocation of human capital on regional economic sustainable development (Figure 2 and Figure 3). Among them, the introduction of the household registration policy has a pioneering significance. Based on this, our study enriches and develops the existing economic theory.
Secondly, possible empirical contributions. From the urban level, this paper systematically studies the mechanism of cross-regional allocation of human capital on economic growth, makes an empirical test on the relevant theory, and establishes a relatively complete dynamic evolution system and development path. Most of the existing literature on the relationship between human capital and economic growth is based on human capital stock, other than human capital allocation. Even though some research works are about the mismatch of human capital, they are only limited to the department or industry level (such as Nan Yu, 2020; Pei kaibing, 2021) [28,29]. According to incomplete statistics, it is the first time to explore new power sources from the cross-regional allocation of human capital. Based on this, our study forms complement and expansion to the existing empirical research literature.
Thirdly, possible policy contributions. As China’s economy enters The New Normal, the drawbacks of the traditional extensive growth mode, which relies on cheap labor and large-scale material capital accumulation, are becoming increasingly apparent. It is urgent to change the growth mode from capital-driven to efficiency-driven and innovation-driven. Thus, human capital has become a key factor. Compared with the long time of human capital accumulation, optimizing the allocation of human capital is likely quicker and more effective. Our study confirms that population mobility can optimize the cross-regional allocation of human capital, and then promote regional economic growth. Thus in order to improve regional economic sustainable development, it is imperative for governments to promote the reform of the household registration system, to guide the rational mobility of the population, and to optimize the regional allocation of human capital. Based on this, our study provides a new development perspective and important policy implications.
Figure 2. Economic growth stage and dynamic evolution and transmission mechanism (Source: It was modified on the basis of Qiu zuohua’s diagram [30]).
Sustainability 15 09807 g002
Figure 3. Conceptual model diagram.
Sustainability 15 09807 g003

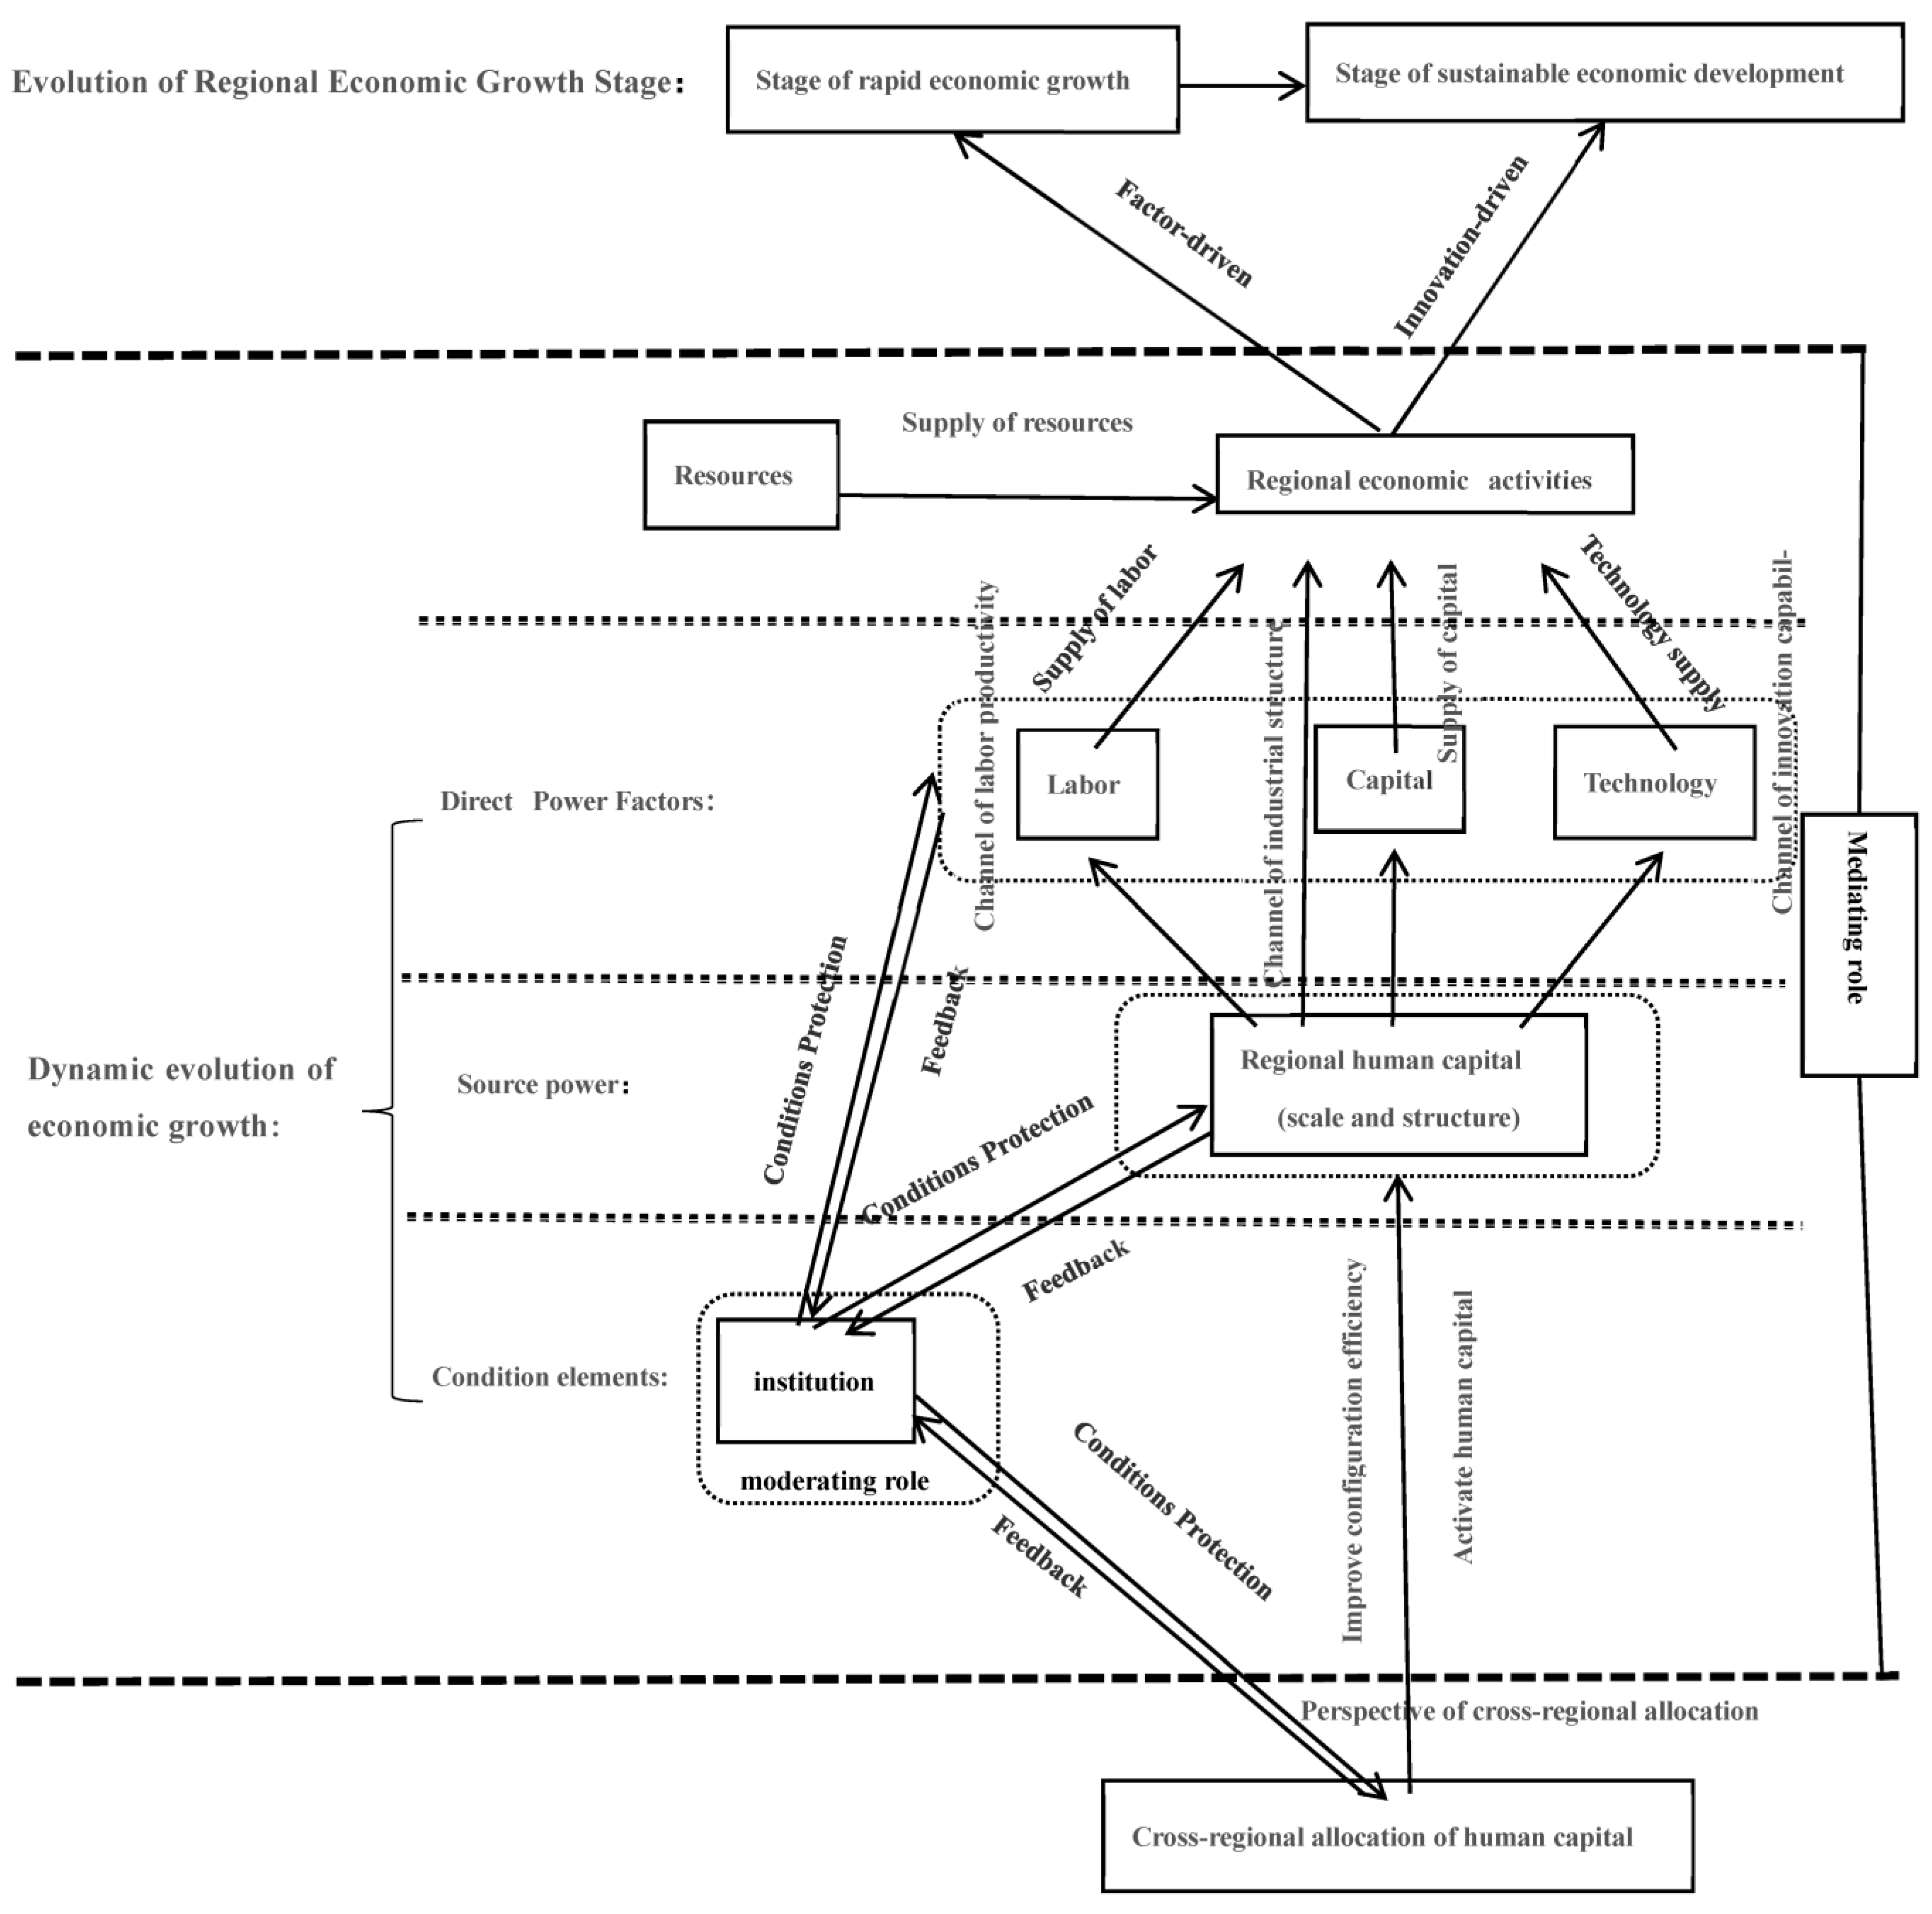
2. Theoretical Analysis and Research Hypothesis

According to endogenous growth theory, labor, capital, technology, human capital and institution are all the motive factors of economic growth, but the mechanism of different motive factors on economic growth is different [30]. Labor, capital and technology act directly on the production process. So labor, capital and technology are the direct power factors. Human capital not only acts directly on the production process, but also on labor, capital and technology to increase labor productivity, upgrade industrial structures, and enhance regional innovation capacity, contributing indirectly to economic growth [31,32,33]. Labor productivity, industrial structure upgrading, and regional innovation ability are the medium channels. Thus, human capital is a combined power factor. The institution is regulated, therefore, the institution is a normative factor, which plays a moderating role in the process of economic activity. The direct power factors, the combined power factor, and the normative factor act together in the process of economic activity, and realize the stage evolution of economic growth (as shown in Figure 2) [30].

2.1. The Direct Effect

As a direct input factor of production, the scale and structure of human capital have a direct effect on economic growth [34,35]. Cross-regional allocation of human capital can change the size and structure of regional human capital. As far as the scale of human capital is concerned, under the market mechanism, human capital is allocated based on the principle of supply and demand equilibrium. Namely, human capital transfers from surplus regions to shortage regions, which changes the scale of human capital according to local economic development and promotes economic growth. As far as the human capital structure is concerned, cross-regional allocation of human capital can optimize the human capital structure [36], improving the education level and comprehensive quality level in the resettlement area, thus forming the population quality dividend, compensating for the disappearing population quantity dividend, and then providing sustained economic development [37]. So, Hypothesis 1 is proposed.
H1. 
Cross-regional allocation of human capital is a key power of urban economic growth, that is, the net inflow of labor force can promote urban economic growth.
The theory that population mobility is beneficial to sustainable economic development has been widely accepted and has been empirically tested [38,39], which is also manifested in the practice of local government competition. For the inflow regions, the population inflow without local household registration makes the regions maintain lower labor costs and reduce social security expenditures. Therefore, population inflow is beneficial to the inflow regions So, Hypothesis 1a is proposed.
H1a. 
The inflow of labor can promote the economic growth of the inflow regions.
For the outflow regions, population outflow may be the local surplus labor force or mismatched labor force. For example, in the early period of reform and opening up, the surplus labor force from rural areas to cities did not hinder rural economic development [40]. In addition, emigrants retain their household registration in the local regions and they can still get financial transfer payments. After the “migratory bird-like” emigrants return, they can increase local consumption and promote economic growth [41]. In addition, the emigrants promote the economy of outflow regions through the effect of remittances and investment in human capital [42]. Thus, emigrants may not have a negative impact on the economic growth of the outflow area. The economic growth of the inflow area does not sacrifice the economic growth of the outflow regions [43]. So, Hypothesis 1b is proposed.
H1b. 
The outflow of labor will not bring negative effects on the economy of the outflow regions.

2.2. The Mediating Effects

Human capital not only acts directly on economic activity, but also on labor, capital and technology to increase labor productivity, upgrade industrial structures and enhance regional innovation capacity, contributing indirectly to economic growth. Labor productivity, industrial structure and regional innovation ability play mediating roles. So, Hypothesis 2 is proposed.
H2. 
Cross-regional allocation of human capital has mediating effects on economic growth.
  • The mediating effect of labor productivity
The cross-regional allocation of human capital can improve the quality of labor and increase its productivity due to the following aspects: (1) Matching effect. Population mobility expands the pool of human capital of inflow regions, provides enterprises with abundant human resources, and makes it easier for workers and enterprises to match [44], which in turn increases labor productivity. (2) Reconfiguration of production factors. Cross-regional allocation of human capital causes a reconfiguration of production factors, brings an efficient combination of production factors, and then increases labor productivity [45]. (3) Specialization in the division of labor. The influx of people enhances market capacity, diversified demand, the division of labor and overall efficiency of work. The specialized division of labor promotes the migration to realize “pareto efficiency” in production, which directly improves labor productivity. (4) Skills complement. Cross-regional allocation of human capital can promote complementary skills. More emphasis is placed on efficient synergy and cooperation among highly skilled workers in the same field of specialization or related fields in order to increase labor productivity. Medium and low-skilled workers are mainly engaged in basic production. So, Hypothesis 2a is proposed.
H2a. 
Cross-regional allocation of human capital can increase labor productivity and thus promote economic growth.
2.
The mediating effect of industrial structure
Human capital is one of the important determinants of industrial structure evolution, and also determines the direction and speed of industrial structure evolution (Ciccone & Papaioannou, 2009). Only the continuous improvement of human capital can upgrade industrial structure [46]. The influence of human capital on the industrial structure is shown in the following aspects: (1) Cross-regional allocation of human capital improves the quality of the labor force, changes the marginal productivity and marginal income of all production factors, and changes the proportion of production factor input, which induces industrial structure upgrading [47]. (2) Human capital also can upgrade the industrial structure by changing factor endowment structure and consumption demand structure. So, Hypothesis 2b is proposed.
H2b. 
Cross-regional allocation of human capital can upgrade the industrial structure and thus promote economic growth.
3.
The mediating effect of regional innovation capacity
Human capital enhances innovation and technological progress, thus leading to the creation of new products. As an important carrier of knowledge and key input factor in the process of innovation, the cross-regional allocation of human capital affects urban innovation capacity and efficiency [48,49]. The cross-regional allocation of human capital can enlarge the pool of human capital, promote the quantity and quality of matching between enterprises and human capital, and improve the efficiency of urban innovation [50]. By introducing and applying new ideas to local markets, the cross-regional allocation of human capital also contributes to knowledge spillover and diffusion, which can promote innovation. In addition, cross-regional allocation of human capital brings high-skilled labor with different regional and cultural backgrounds to cities, which brings diversified skills, knowledge and ideas to improve regional innovation capacity. So, Hypothesis 2c is proposed.
H2c. 
Cross-regional allocation of human capital can improve regional innovation capacity and thus promote economic growth.

2.3. The Moderating Effect

Whether the current household registration policy can hinder the human capital to be allocated according to the market mechanism, and whether the optimal allocation can be achieved remain to be investigated [51]. The strict restriction of the household registration policy on population mobility is equivalent to raising the cost of population migration, which is not conducive to population mobility. Therefore, the household registration policy is a restrictive measure of population mobility. The stronger the restriction of the household registration policy, the weaker the mobility of human capital [52], and vice versa. So Hypothesis 3 is proposed.
H3. 
The household registration policy has a negative moderating effect on the economic growth effect of the cross-regional allocation of human capital.

3. Research Design

3.1. Model Setting

In order to investigate the influence of cross-regional allocation of human capital on regional economic growth, this paper sets up the following models,
Y i t = α 0 + α 2 N e t i n m i g i t + γ X i t + μ i + μ t + ε i t
where, i denotes cities at the prefecture level and above, t denotes different time, Y i t denotes the economic growth of region i in year t , N e t i n m i g i t is the core independent variable, indicating cross-regional allocation of human capital, measured by the net inflow rate of labor force, the net inflow of advanced human capital, etc., X i t indicates other control variables, μ i is the fixed effect of the region (or city), μ t is the fixed effect of time, and εit indicates the random error. Formula (1) is used to evaluate the impact of cross-regional allocation of human capital on regional economy.
The above theoretical analysis shows that cross-regional allocation of human capital can improve labor productivity, upgrade the industrial structure and enhance regional innovation capacity. Thus, based on the research ideas of Guo Han et al. [53], the mediating effect models are set up in the form of simultaneous equations:
Y i t = α 0 + α 1 N e t i n m i g i t + α 2 X i t + μ i + μ t + ε i t
M i t = β 0 + β 1 N e t i n m i g i t + β 2 X i t + μ i + μ t + ε i t
Y i t = γ 0 + γ 1 N e t i n m i g i t + γ 2 M i t + γ 3 X i t + μ i + μ t + ε i t
where the variable M i t represents labor productivity, industrial structure and regional innovation ability respectively. The economic implications of the remaining variables are the same as above.
The previous study was conducted without considering the household registration policy. In fact, household registration policy plays a decisive role in population mobility in China, so we take China’s unique household registration policy into the model to test the moderating effect of household registration policy. Based on the benchmark model (1), we introduce the interaction variables of household registration policy and cross-regional allocation of human capital:
Y i t = α 0 + α 2 N e t i n m i g i t + α 3 N e t i n m i g i t · H j z d i t + γ X i t + μ i + μ t + ε i t
where the H j z d denotes household registration policy. Referring to the practice of Shi Guifen [28], we choose the ratio of permanent population to residence registration population as the residence registration policy. The economic implications of the remaining variables are the same as above.
Suppose the net inflow rate of labor force has a significant positive effect on urban economic growth; (1) if the interaction coefficient α3 is significantly positive, household registration policy strengthens the impact of net inflow of labor force on urban economic growth, that is, household registration policy has a significant positive moderating effect; (2) if α3 is significantly negative, household registration policy weakens the impact of the net inflow rate of labor force on urban economic growth, that is, the household registration policy has a significant negative moderating effect, and vice versa.

3.2. Variable Selection

  • Dependent variable
This paper focuses on long-term economic growth. According to Yuan Fuhua [4], the GDP per capita growth rate is chosen as the dependent variable. The specific calculation process is: real GDP (1990 constant price) divided by the population, obtain GDP per capita, then calculate GDP per capita growth rate year by year [54]. However, this kind of annual growth includes the trend component and the periodic component, so the data are smoothed by HP filtering method to eliminate the periodic component. In the follow-up robustness test, the urban GDP growth index is used as the replacement dependent variable.
2.
Core independent variables
The core independent variables in this paper are the net inflow rate of labor force, the net inflow rate of advanced human capital and the net inflow rate of ordinary human capital, etc. Net inflow rate of labour = (labour inflow − labour outflow)/total population [40]. The reasons we use the net inflow rate of labor force as a measure of human capital cross-regional allocation are as follows:
(1)
As the carrier of human capital, the flow of the labor force will inevitably lead to human capital flow, which is itself the re-allocation of human capital.
(2)
Referring to the existing literature, we chose the net inflow rate of the labor force as a measure of human capital cross-regional allocation. For example, reference [40] in our study used the net inflow rate of the labor force as a measure of human capital cross-regional allocation to study enterprise productivity.
(3)
Based on the reality of China’s population mobility, at present, the years of education of floating population in China exceed the average level of education, which means the human capital contained in the floating population is higher.
In the follow-up robustness test, take “1-household registration population/resident population” as the substitution variable of labor force net inflow rate [55]. Net inflow rate of advanced human capital = (inflow of tertiary and above labor − outflow of tertiary and above labour)/total population. Net inflow rate of ordinary human capital = (inflow of high school and below − outflow of high school and below)/total population [56].
3.
Control variables
In order to ensure the accuracy and robustness of the model, referring to the studies of Zhang Cui [46], Zhang Xun et al. [57], and Fu Lifu et al. [58], this paper controls a series of variables related to economic growth. (1) Natural factors of economic growth. Natural factors of economic growth have important impacts on economic growth. This paper selects land resources (the administrative area of land) and water resources to control the regional natural factors of economic growth. (2) Fiscal expenditure. Despite China’s transition from a planned economy to market economy, the role of the government in economic growth remains important, especially in terms of economic orientation. The fiscal policy adopted by the government can regulate the macro-economy, and then affect the economic growth. This paper selects the fiscal expenditure to control the government’s policy intervention. (3) The public social welfare. Urban public social welfare is closely related to economic development. We select the number of ordinary middle schools, ordinary primary schools, medical and health institutions, and the total book collection of public libraries to control the public social welfare. (4) Openness. There is a close relationship between opening and economic growth. This paper selects net export and actual used foreign capital to control the opening. (5) Material capital. Material capital is one of the essential factors to promote economic growth. This paper selects the fixed assets investment to control material capital.
4.
Mediating variables
The mediating variables include: labor productivity, industrial structure and regional innovation capacity. Referring to Bender’s article [59], this paper measures labor productivity by the ratio of urban GDP to urban employees. The ratio of value-added of tertiary sector to that of secondary sector is used to denote the advanced industrial structure [14]. The smaller the ratio, the lower the industrial structure, and vice versa. As a direct embodiment of innovation [60,61], patent has become the most commonly used measure of innovation capacity, and this paper uses the patent license amount as a measure of urban innovation capacity, based on Cui Tingting’s practice [62].
5.
Moderating variable
This article chooses the household registration policy as the moderating variable. The strictness of the household registration system directly affects whether the immigrants get household registration. The ratio of resident population to household registration population is used as a measure of household registration policy [28].
All variables see Table 1.

3.3. Descriptive Statistics of Data Sources and Variables

In this paper, the panel data of cities at prefecture level and above from 2005 to 2020 in China (excluding Tibet, Hong Kong, Macao and Taiwan due to the serious lack of data) were used for the econometric study. The data came from the following sources: China Statistical Yearbook, China Urban Statistical Yearbook and China Economic Network Statistical Database. The above-mentioned data were firstly dealt with at the micro-level: (1) Considering the effect on economic growth, this paper included only immigrants that were from 15 to 64 years old; (2) in order to accurately measure the impact of population mobility on economy, non-work-related population mobility was excluded; (3) we included only the mobile population whose household residence place were different from their living place for more than six months. Overall, the sample period is from 2005 to 2020, and the total sample size was 4544. The descriptive statistics of each variable are shown in Table 2.

4. Empirical Results and Analysis

4.1. Benchmark Regression

In this paper, we used the Hausman test to determine whether the panel is a fixed-effect model or a random-effect model. The Hausman test value is 77.34, prob = 0.000, so the assumption of a random-effect model was rejected, and we chose the fixed-effect model to test. We used a two-way fixed effect model (FE) of time and individuals to analyze the above model (1). The results are shown in Table 3. Column (1) shows that the net inflow rate of labor force has a significant positive effect on the growth rate of GDP per capita at the level of 1%, indicating that net inflow of the labor force will significantly increase the growth rate of GDP per capita. In the economic sense, every one percentage point increase in the net inflow rate of the labor force will increase the GDP per capita growth rate by 0.617 percentage points, thus Hypothesis 1 is verified, namely, that the cross-regional allocation of human capital is a key power of urban economic growth, that is, the net inflow of labor force can promote urban economic growth. This result is consistent with the existing literature results [63,64]. Column (2) shows that the net inflow rate of advanced human capital has a significant positive effect on the growth rate of GDP per capita at the level of 1%, indicating that the net inflow rate of advanced human capital will significantly increase the growth rate of GDP per capita. In the economic sense, the GDP per capita growth rate will increase by 14.40 percentage points for every 1 percentage point increase in the net inflow rate of advanced human capital. Column (3) shows that the net inflow rate of ordinary human capital has no significant effect on the growth rate of GDP per capita. That is, the effect of the inflow of ordinary human capital on urban economic growth is not significant. This shows that advanced human capital plays the most important role. Compared with ordinary human capital, advanced human capital carries more knowledge, and technical and management experience [65]. Collaborating with local advanced human capital, foreign advanced human capital can promote knowledge spillovers and create a top-level complement between advanced skills [66], thus contributing to economic growth. This also confirmed that “the city’s economic competition depends on the talent competition” [67]. The major cities actively attract talent to promote economic growth. Column (4) shows that the inflow the rate of labor force has a significant positive effect on the growth rate of GDP per capita at the level of 1%, indicating that the inflow of the labor force will significantly increase the growth rate of GDP per capita. In an economic sense, for every one percentage point increase in the labor inflow rate, the growth rate of GDP per capita will increase by 2.054 percentage points, thus Hypothesis 1a is verified, namely, the inflow of labor can promote the economic growth of the inflow area. This result is consistent with the existing literature results [68,69]. Column (5) shows that the outflow rate of labor force has not significant effect on the growth rate of GDP per capita, indicating that the outflow of labor force does not have a negative impact on the economy of the place of outflow. Thus, we can draw the conclusion that the economic development of the inflow is not based on sacrificing the economic growth of the outflow, thus Hypothesis 1b is verified, namely, the outflow of labor will not bring negative effects on the economy of the outflow area. This result is consistent with the existing literature results [40].
We can be pretty sure that population mobility can improve the mismatch of human capital, and improve the efficiency of resource allocation in both the inflow and outflow regions [40]. As for regions into which population flows, the inflow of labor force makes the human capital allocate more effectively in the suitable cities, which improves the labor productivity and promotes the economic growth. For the regions out of which population flow, the outflow of labor force may be the local surplus labor force or the labor force mismatched with the regional economy. That is to say, population mobility can promote the use efficiency of human capital, avoid human capital mismatch and waste. The economic development of the inflow regions does not presuppose the economic growth of the outflow regions, so population mobility is conducive to promoting national economic growth [40].

4.2. Endogenous Test

In this paper, a series of control variables are considered to alleviate the possible endogenous problems, but the endogenous problems may still exist. To further address them, referring to the practice in the existing literature, the model was re-estimated with the lag period of the core independent variable as the instrumental variable for the current period, and the results are shown in Table 4. It can be seen that the estimated results are basically consistent with the results of the baseline regression, and that the symbols and significance of the core independent variables are the same as before, so the research hypotheses of this paper still hold.

4.3. Robustness Test

  • Change the core independent variable
Firstly, we use “1-household registration/resident population” [55] to replace the net rate of labor inflow. The regression results are shown in Table 5. The effect of labor inflow on the growth rate of GDP per capita is significantly positive at the 1% level, which further verifies the robustness of the above conclusion.
Secondly, referring to Xia Yiran and Lu Ming [56], we used the ratio of the inflow of labor with a college degree or above in one city to that of the whole nation as the core independent variable. The regression results are shown in Table 6. The effect of labor inflow on the growth rate of GDP per capita is significantly positive at the 1% level, which further verifies the robustness of the above conclusion.
2.
Change the dependent variable
We changed the dependent variable from the urban GDP per capita growth rate to the urban GDP growth index for further regression analysis. The regression results are shown in Table 7, the effect of labor inflow on the urban GDP growth index is significantly positive at the 5% level, which further verifies the robustness of the above conclusion.

4.4. Heterogeneity Test

  • Heterogeneity test based on population size
Taking the average resident population size of 3.72 million as the boundary, we divide the sample cities into two types. One type is the sample with small and medium-sized cities in which the permanent population is less than 3.72 million, and the other is the sample with super-cities and mega-cities in which the resident population is more than 3.72 million. The regression analysis is shown in Table 8, in which (1)–(3) are listed as the regression results of small and medium-sized cities, and (4)–(6) are listed as the regression results of mega-cities and mega-cities. For small and medium-sized cities, the impact of net inflow rate of labor force, net inflow rate of advanced human capital and net inflow rate of ordinary human capital on GDP per capita is all significantly positive at 1% level. From an economic point of view, every 1 percentage point increase in the net inflow rate of the labor force will increase the GDP per capita growth rate by 1.36 percentage points, and every 1 percentage point increase in the net inflow rate of advanced human capital, the GDP per capita growth rate will increase by 7.115 percentage points, and every 1 percentage point increase in the net inflow rate of ordinary human capital, the GDP per capita growth rate will increase by 1.131 percentage points. It can be seen that for small and medium-sized cities with low population density, all kinds of population inflow can promote economic growth, but the most important one is advanced human capital. This result is consistent with the existing literature results [70,71,72]. For the super-cities and mega-cities, the situation is different, from the (4)–(6) columns, it can be seen that the net inflow rate of labor force and the net inflow rate of ordinary human capital have no significant impact on GDP per capita, only the net inflow rate of advanced human capital has a significant positive effect on the growth rate of GDP per capita at the level of 1%. This shows that the population density of super-cities and mega-cities is high, and the supply of ordinary labor force may have fully met the urban demand for labor force, or even there has been a surplus, resulting in a crowding effect [73]. So for these cities, not all of the labor inflows can promote economic growth, and only the inflow of advanced human capital can promote economic growth. According to column (5), the GDP per capita growth rate will increase by 12.72 percentage points for every 1 percentage point increase in advanced human capital inflow rate. Intuitively, compared with small and medium-sized cities, advanced human capital plays a more obvious role in super-cities and mega-cities (12.72), and advanced human capital plays a little more than half of the role in small and medium-sized cities (7.115). The likely reason is that big cities have advanced equipment, large factories, and abundant human capital, allowing advanced human capital to play a greater role in top-level complement, which also dovetails with the status quo in China. For example, Beijing, Shanghai, Guangzhou and other major cities make attractive policies for senior talent to promote economic growth [74].
2.
Heterogeneity test based on level of development
Next, the sample cities are divided into Eastern cities, Central cities and Western cities according to the degree of economic development. The cities in the most developed Eastern region are Beijing, Tianjin, Shanghai, as well as Hebei, Liaoning, Jiangsu, Zhejiang, Fujian, Shandong, Guangdong, and Hainan provinces’ prefecture-level cities and above. The cities in the less developed Central region are Shanxi, Inner Mongolia, Jilin, Heilongjiang, Anhui, Jiangxi, Henan, Hubei and Hunan Provinces’ prefecture-level cities and above. The cities in the least developed western region are Chongqing, as well as Sichuan, Guizhou, Yunnan, Shaanxi, Gansu, Qinghai, Ningxia, Xinjiang and Guangxi provinces’ prefecture-level cities and above. The regression analysis is shown in Table 9. The (1)–(4) are listed as the regression results of Eastern cities. Only the net inflow rate of advanced human capital has a significant positive effect on the growth rate of GDP per capita at the level of 1%, while the rest are not significant, which shows that for the developed cities in the eastern region, the net inflow rate of advanced human capital has a significant positive effect on the growth rate of GDP per capita at the level of 1%, namely, only the inflow of advanced human capital can promote economic growth. The net inflow of the labor force and the outflow of labor force has no significant impact on the economy. This result is consistent with the existing literature results [75,76]. Although the test in column (3) is not significant, it can be inferred from the negative value of its coefficient that the inflow of ordinary human capital is very likely to have a negative impact on the economy. So for the more developed cities, in order to promote economic growth, we must screen talents strictly and pay attention to the hourglass effect of talent inflow. The (5)–(8) are listed as the regression results of Central cities. The results show that the net inflow rate of labor force, advanced human capital and ordinary human capital have significant positive effects on the growth rate of GDP per capita at the level of 1%. It can be seen that for the Central cities, all kinds of population inflow can promote economic growth, but the most important is advanced human capital. It is worth noting that the outflow rate of labor force on the GDP per capita growth rate at the 10% level is significantly negative. This indicates that the outflow of labor has a negative impact on the Central cities. The main reason may be that the Central cities are adjacent to the Eastern cities and are affected by the talent siphon effect. The majority of the out-flowing labor force in the central region is advanced human capital, which has a negative impact on the economic development of the Central cities. The (9)–(12) are listed as the regression results of Western cities. It can be known that the net inflow rate of the labor force and that of advanced human capital in Western cities have significantly positive effects on the growth rate of GDP per capita at the level of 1%, however, the effect of the net inflow rate of ordinary human capital and the outflow rate of labor force on the growth rate of GDP per capita is not significant.
This shows that for the Eastern developed cities, only the inflow of advanced human capital can promote economic growth. For the Central cities and Western cities, all kinds of population inflow can promote economic growth, while the most important one is advanced human capital. It is worth noting that the outflow of labour from the Central regions has a negative impact on the economy of the Central cities. The possible reason is that the Central cities are adjacent to the Eastern cities and are affected by the siphon effect of talents, which results in a negative impact on the economic development of the Central cities.
3.
The heterogeneity test based on different administrative status
Finally, the sample cities are divided into municipalities and provincial capitals and other cities according to their administrative status. The regression analysis is shown in Table 10. The (1)–(5) are listed as the regression results of municipalities and provincial capitals, it can be seen that the net inflow rate of the labor force to the GDP per capita growth rate is significantly positive at the level of 10%, the net inflow rate of advanced human capital and labor inflow is significantly positive at the level of 1%, and the net inflow rate of ordinary human capital to the GDP per capita growth rate is not significant. It is worth noting that the labor outflow rate is significantly positive. This shows that for municipalities and provincial capitals, the inflow of labor significantly promotes economic growth, which is driven by advanced human capital rather than ordinary human capital [64]. It is also worth noting that the outflow of labor from municipalities and provincial capitals can significantly promote economic growth. The main reason may be that the ordinary labour force in such cities may be close to saturation or even surplus, so the outflow of labor force can alleviate the crowding effect, and thus promote economic growth [77]. Although the impact of the inflow of ordinary human capital on economic growth is not significant, the negative value of the coefficient is worth noting. The inflow of ordinary human capital may have a negative impact on the economy. Therefore, for the municipalities directly under the central government and the provincial capital cities, government should attract advanced human capital, other than ordinary human capital. The (6)–(10) are listed as the regression results of other cities. It can be known that the net inflow rate of labor force, of advanced human capital, of ordinary human capital, the inflow rate of labor force, and the outflow rate of labor force are significantly positive at the level of 1%. So all kinds of population inflow can promote economic growth, but the most important is advanced human capital. It is worth noting that the effect of the outflow rate is significantly negative at the 5% level, indicating that the outflow of workers have a negative impact.

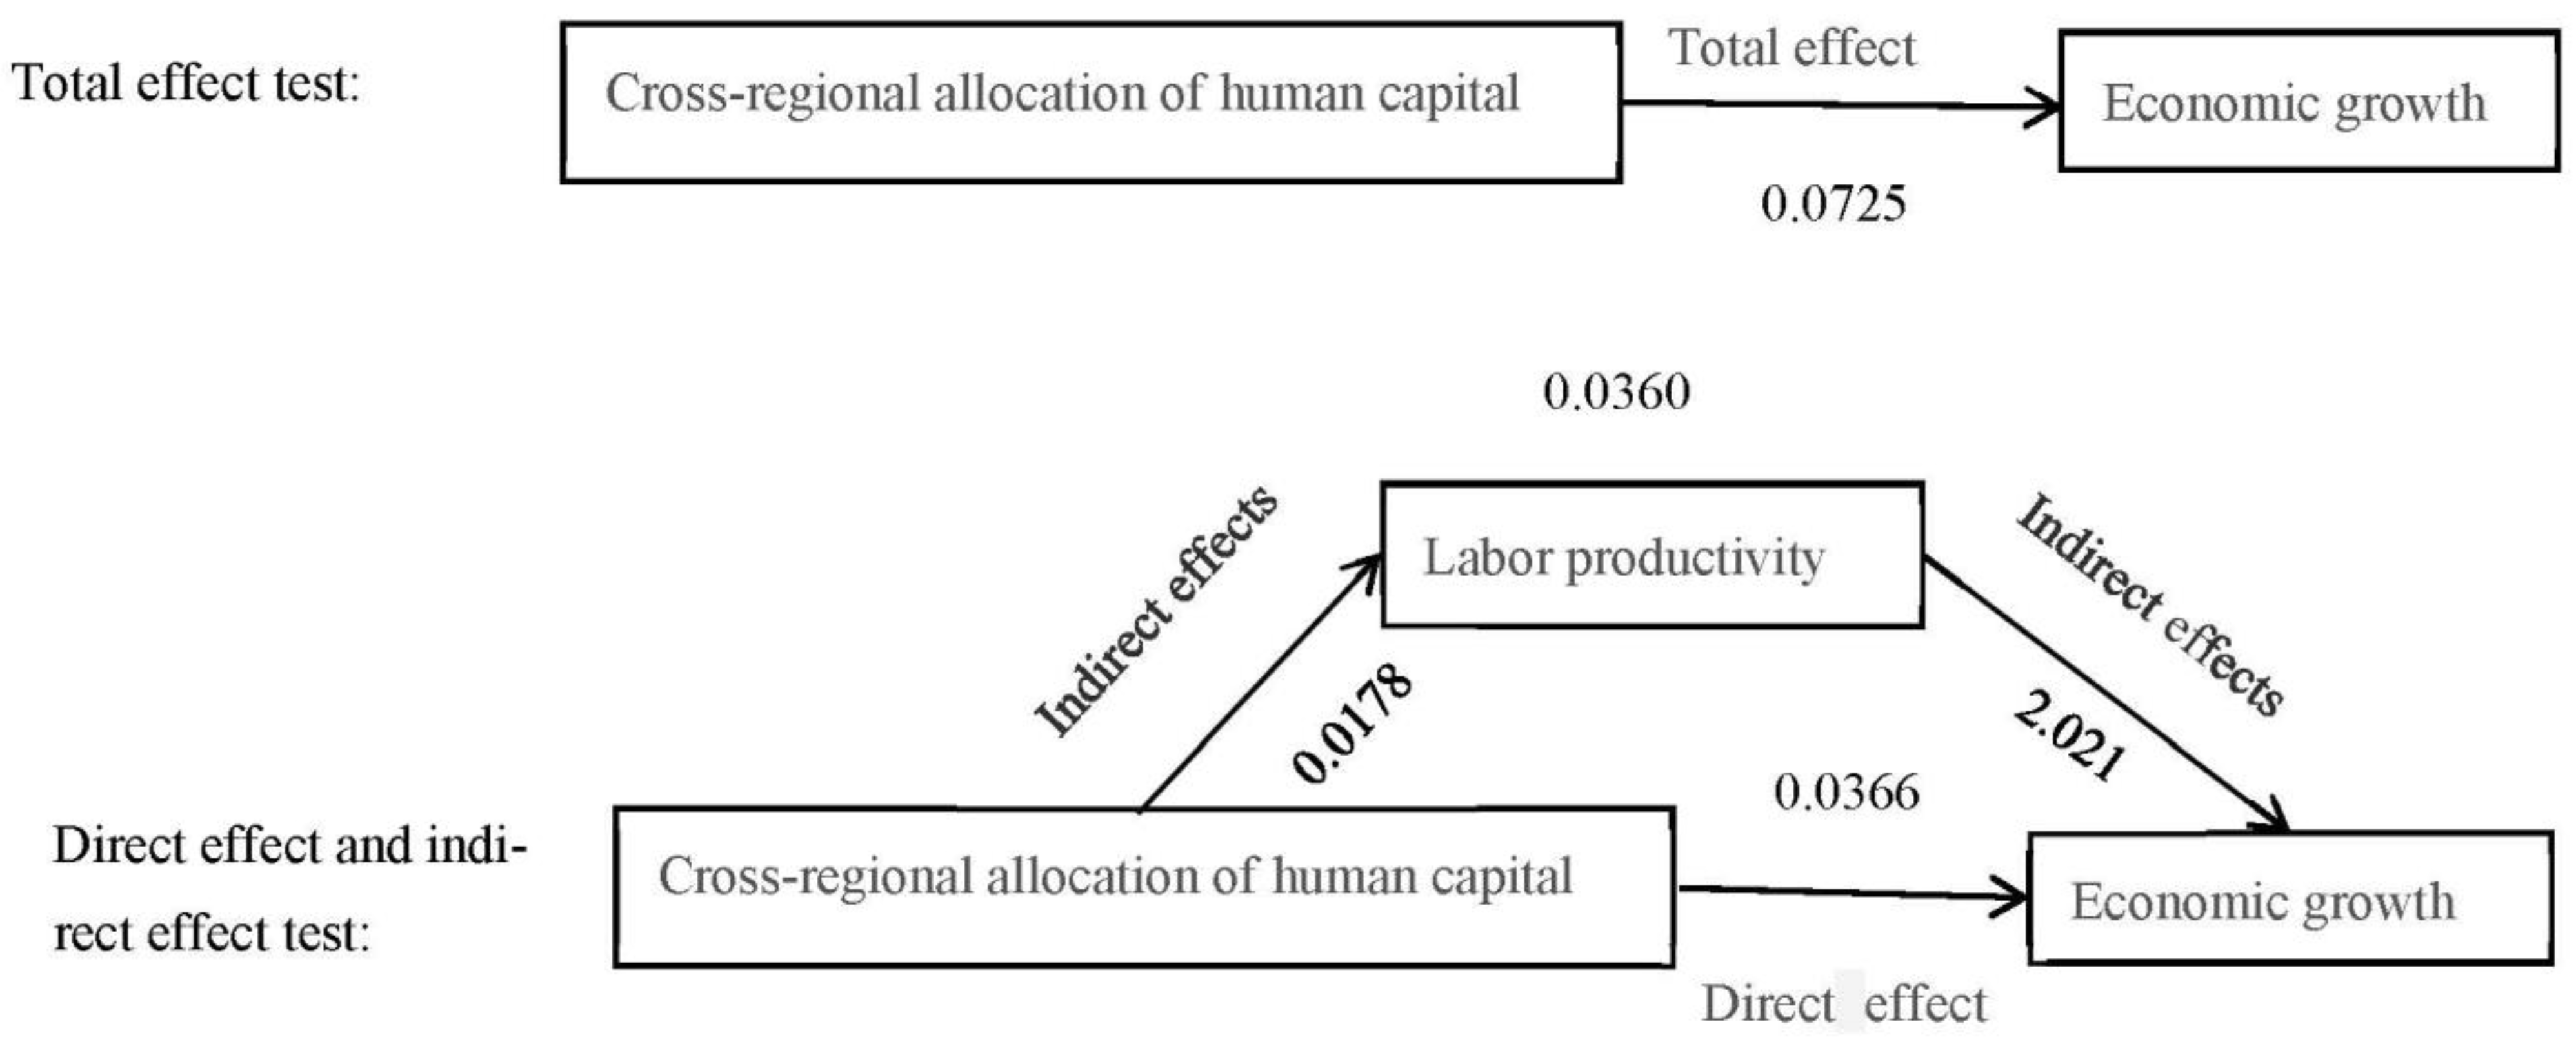
4.5. Test of Mediating Effect

  • The mediating effect test of labor productivity
The estimated results of the mediating effect of labor productivity are shown in Table 11. Column (1) reflects the effect of the net inflow rate of ordinary human capital on the growth rate of urban GDP per capita (that is, the test of total effect) without mediating variables. It shows that the effect is significantly positive at the level of 1%, and the coefficient is 0.0725, which means that the average GDP growth rate will increase by 0.0725 percentage points for every 1 percentage point increase in the net inflow rate of ordinary human capital.
Then, we analyze the mediating effect of labor productivity. From column (2), we can see that at the level of 1%, the net inflow rate of ordinary human capital has a significant positive effect on the growth rate of urban GDP per capita. At the same time, according to the estimated results, for every 1 percentage point increase in the inflow of ordinary human capital, the labor productivity will increase by 0.0178 percentage points. So the inflow of ordinary human capital is an important factor affecting the labor productivity [78]. Column (3) shows that at the level of 1%, both the net inflow rate of ordinary human capital and the labor productivity have significantly positive effects on the growth rate of GDP per capita. It shows that the promotion of economic growth can be started from two aspects: optimizing cross-regional allocation of human capital and improving labor productivity [79]. From the direct effect test result, at 1% level, if the ordinary human capital inflow rate changes 1 percentage point, the GDP per capita growth rate changes 0.0366 percentage points. After controlling the variable of labor productivity, the ordinary human capital inflow rate can still promote the economic growth. The test results validate the endogenous growth theory with human capital as the core, that is, human capital is the determinant of economic growth [80]. At the same time, the test results verify that when labor productivity is the mediating variable, the cross-regional allocation of human capital has a direct effect on economic growth and strengthens the conclusion that human capital plays a decisive role in economic growth. From the indirect effect of human capital on economic growth through labor productivity, whether in the second step of the mediating effect test [column (2)] or the third step [column (3)], at the same time, column (3) shows that the influence coefficient of the mediating variable is also significant. Therefore, we can draw a conclusion that the mediating effect exists, and the mediating effect is 0.0360, that is, cross-regional allocation of human capital can indirectly promote regional economic growth by improving labor productivity [81]. The direct effect accounted for 50.48% of the total effect, and the indirect effect accounted for 49.52% of the total effect. Thus Hypothesis 2a is verified, namely, cross-regional allocation of human capital can increase labor productivity and thus promote economic growth, see Figure 4.
From the above analysis, with the decline of China’s population dividend, increasing the optimization cross-regional allocation of human capital and raising labor productivity will be an important measure to promote China’s sustainable development.
2.
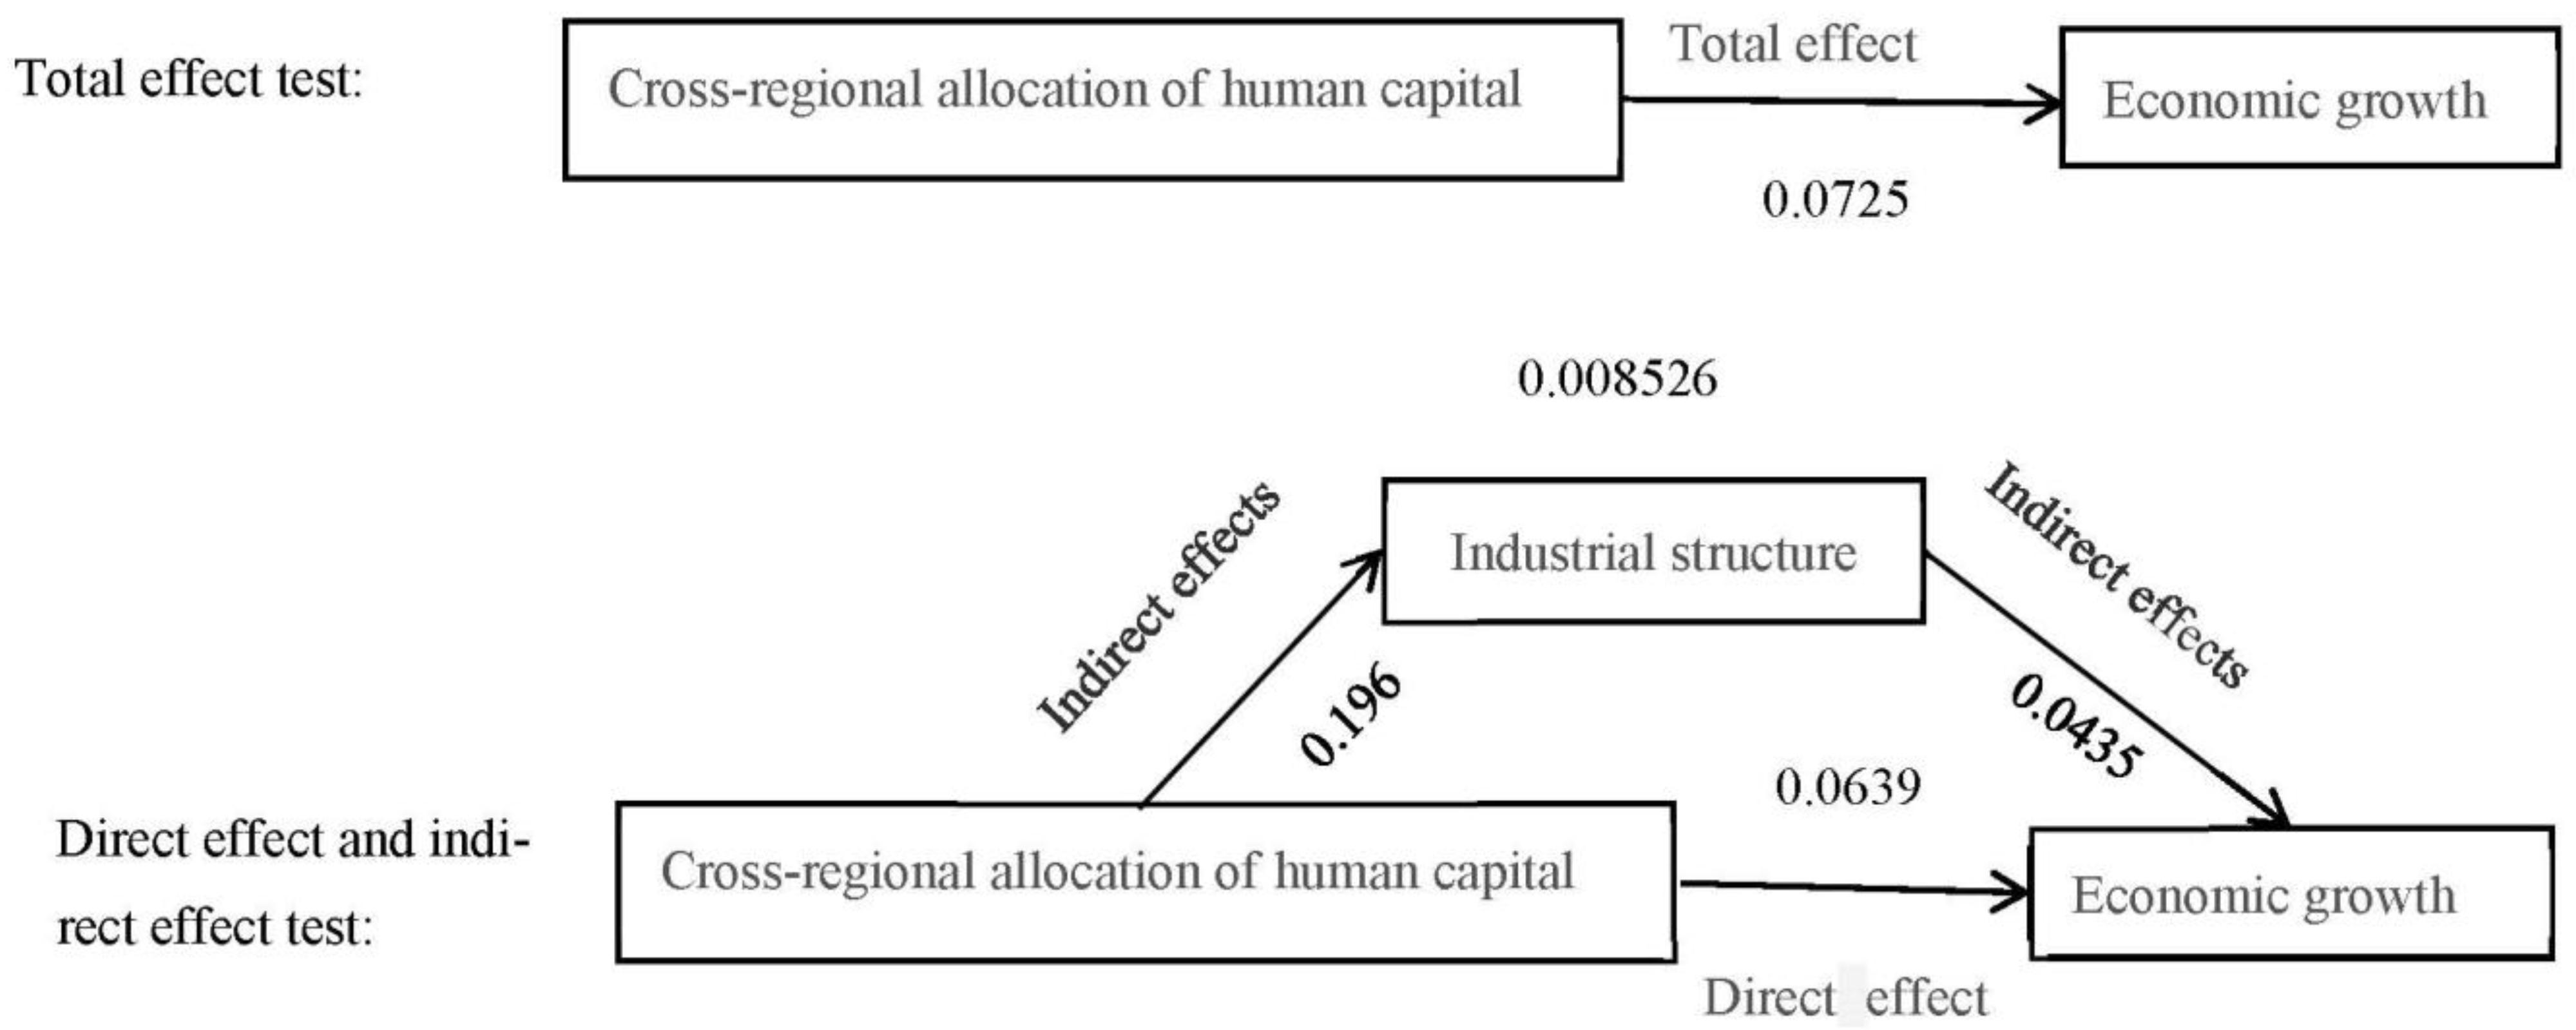
The mediating effect test of industrial structure
The estimated results of the mediating effect of industrial structure upgrading are shown in Table 12. Column (1) reflects the effect of the net inflow rate of ordinary human capital on the growth rate of urban GDP per capita (that is, the test of total effect) without mediating variables. It shows that the effect is significantly positive at the level of 1%, and the coefficient is 0.0725, which means that the average GDP growth rate will increase by 0.0725 percentage points for every 1 percentage point increase in the net inflow rate of ordinary human capital.
Then, we analyze the mediating effect of industrial structure. Column (2) shows that the net inflow rate of ordinary human capital has a significant positive effect on the growth rate of urban GDP per capita at the level of 5%. At the same time, according to the estimated results, for every 1 percentage point increase in the inflow of ordinary human capital, the industrial structure will be upgraded by 0.196 percentage points, which shows that the inflow of ordinary human capital is an important factor affecting the upgrading of industrial structure, and the rational allocation of human capital is helpful to promote the upgrading of industrial structure. Column (3) shows that at the levels of 1% and 5%, respectively, the net inflow rate of ordinary human capital and the upgrading of industrial structure have significantly positive effects on the GDP per capita growth rate of cities. It shows that the promotion of economic growth can be started from two aspects: optimizing cross-regional allocation of human capital and upgrading the industrial structure [82]. From the direct effect test result, at 1% level, the inflow rate of ordinary human capital changes 1 percentage point, the growth rate of GDP per capita changes 0.0639 percentage points. After controlling the variable of industrial structure upgrading, the inflow rate of ordinary human capital can still promote the economic growth. The test results validate the endogenous growth theory with human capital as the core, that is, human capital is the determinant of economic growth. At the same time, the test results confirm that when the industrial structure upgrading is the mediating variable, cross-regional allocation of human capital has a direct effect on economic growth, it also strengthens the conclusion that human capital plays a decisive role in economic growth [83]. From the indirect effect of human capital on economic growth through industrial structure upgrading, whether it is in the second step [column (2)] or the third step [column (3)] of the mediating effect test, at the same time, column (3) shows that the influence coefficient of the mediating variable is also significant. Therefore, we can draw a conclusion that the mediating effect exists, and the mediating effect is 0.0435, that is, cross-regional allocation of human capital can indirectly promote regional economic growth by promoting the upgrading of industrial structure [84]. The direct effect accounted for 88.14% of the total effect, and the indirect effect accounted for 11.86% of the total effect see Figure 5. Thus Hypothesis 2b is verified, namely, cross-regional allocation of human capital can upgrade industrial structure and thus promote economic growth [85].
From the above analysis, with the decline of China’s population dividend, increasing the optimization of cross-regional allocation of human capital and upgrading industrial structure will be an important measure to promote China’s sustainable development.
3.
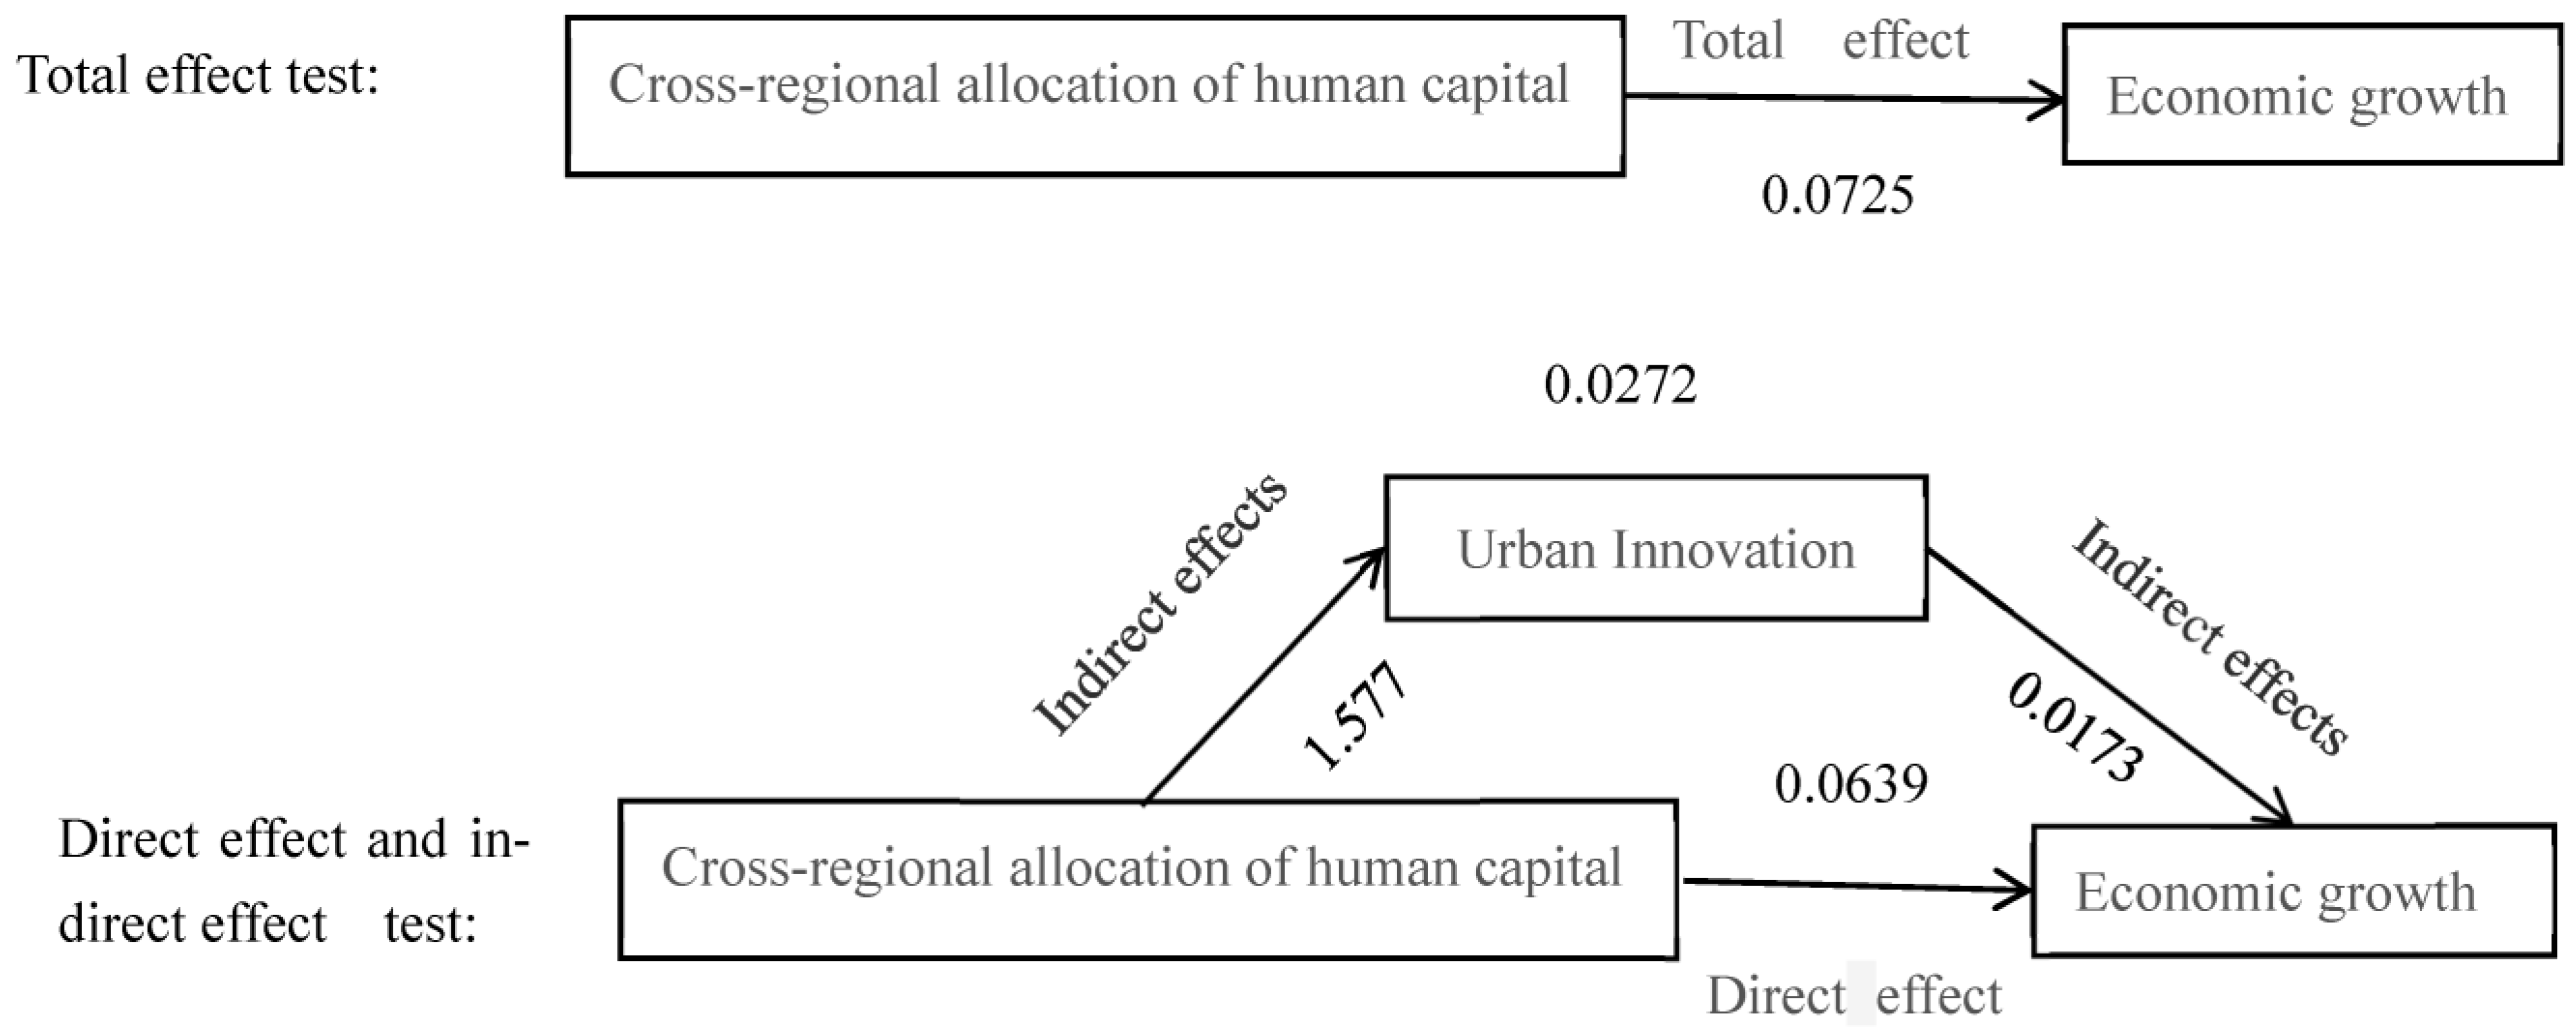
The mediating effect test of regional innovation capability
The estimated results of the mediating effect of regional innovation capability are shown in Table 13. Column (1) reflects the effect of the net inflow rate of ordinary human capital on the growth rate of urban GDP per capita (that is, the test of total effect) without mediating variables. It shows that the effect is significantly positive at the level of 1%, the coefficient is 0.0725, which means that the average GDP growth rate will increase by 0.0725 percentage points for every 1 percentage point increase in the net inflow rate of ordinary human capital.
Then, it analyzes the mediating role of urban innovation capability. Column (2) shows that the net inflow rate of ordinary human capital has a significant positive effect on the growth rate of urban GDP per capita at the level of 1%. At the same time, according to the estimated results, for every 1 percentage point increase in the inflow of ordinary human capital, the urban innovation capacity will increase by 1.577 percentage points, which shows that the inflow of ordinary human capital is an important factor affecting urban innovation ability, and the rational allocation of human capital is helpful to promote urban innovation ability [76]. Column (3) shows that at the level of 1%, both the net inflow rate of ordinary human capital and the urban innovation capacity have significantly positive effects on the GDP per capita growth rate. It shows that the promotion of economic growth can be started from two aspects: optimizing cross-regional allocation of human capital and promoting the urban innovation capacity [86,87,88]. From the direct effect of the test results, at the level of 1%, every 1 percentage point change in the net inflow rate of ordinary human capital, the growth rate of GDP per capita changes 0.0452 percentage points, indicating that after controlling the variable of urban innovation capacity, the result of this test proves the endogenous growth theory that human capital is the key factor of economic growth, that is, human capital is the decisive factor of economic growth. At the same time, the test results confirm that the cross-regional allocation of human capital has a direct effect on economic growth when urban innovation capacity is the mediating variable, it also strengthens the conclusion that human capital plays a decisive role in economic growth [89]. From the indirect effect of human capital on economic growth through urban innovation ability, whether it is in the second step [column (2)] or the third step [column (3)] of the mediating effect test, at the same time, column (3) shows that the influence coefficient of the mediating variable is also significant. Therefore, we can draw a conclusion that the mediating effect exists, and the mediating effect is 0.0273, that is, cross-regional allocation of human capital can indirectly promote regional economic growth by promoting urban innovation capacity. The direct effect accounted for 62.34% of the total effect, and the indirect effect accounted for 37.66% of the total effect, see Figure 6. Thus Hypothesis 2c is verified, namely, cross-regional allocation of human capital can improve regional innovation capacity and thus promote economic growth.
From the above analysis, with the decline of China’s population dividend, optimizing cross-regional allocation of human capital and promoting regional innovation capacity will become an important measure to promote China’s economic sustainable development [90].
To sum up, acting on labor, capital and technology, human capital contributes indirectly to economic growth by increasing labor productivity, upgrading industrial structure and enhancing regional innovation capacity. So labor productivity, industrial structure and regional innovation ability are the medium transmission channels of cross-regional allocation of human capital to promote regional economic growth. Thus Hypothesis 2 is verified, namely, cross-regional allocation of human capital has mediating effects on economic growth.

4.6. The Moderating Effect Test of Household Registration Policy

The regression results are shown in Table 14. Column (1) shows that the effect of net inflow rate of labor force on urban economic growth is significantly positive at the level of 1%, but the interaction coefficient between the net inflow rate of labor force and the household registration policy is significantly negative at the level of 5%, which indicates that the household registration policy weakens the impact of the net inflow rate of labor force on urban economic growth. The household registration policy has a significant weakening or inhibiting effect, namely a significant negative moderating effect. This result is consistent with the existing literature results [91]. The reason may be that the existence of the household registration policy makes the labor force no longer follow the market allocation mechanism, which weakens or inhibits the labor force’s economic promotion. Column (2) shows that the impact of the net inflow of advanced human capital on urban economic growth is significantly positive at the 1% level, at the same time, the interaction coefficient between the net inflow rate of human capital and the household registration policy is also significantly positive at the level of 1%, which indicates that the household registration policy has strengthened the urban economic growth effect of the high net inflow rate of human capital. That is to say, the household registration policy can strengthen or promote the urban economic growth effect of the net inflow of advanced human capital, namely, it has a significant positive regulation effect. The reason may be that the household registration policy in many cities is designed to attract advanced human capital inflows. Column (3) shows that the effect of net inflow rate of ordinary human capital on urban economic growth is not significant, and the interaction coefficient between net inflow rate of ordinary human capital and household registration policy is not significant either. Column (4) shows that the effect of the rate of labor inflow on urban economic growth is significantly positive at the level of 1%, but the interaction coefficient between the rate of labor inflow and household registration policy is not significant, indicating that the household registration policy has no moderating effect. The reason may be that, for the vast majority of cities, ordinary human capital accounts for the vast majority of the inflow of labor force, the inflow of ordinary human capital is migratory, more focused on short-term economic effects than on the benefits of the household registration policy. Column (5) shows that the effect of the rate of labor outflow on urban economic growth is significantly negative at the level of 5%, while the interaction coefficient between the rate of labor outflow and household registration policy is significantly positive at the level of 1%, which means that the household registration policy weakens the influence of the rate of labor outflow on urban economic growth. So the household registration policy plays a weakening and inhibiting role in the negative effect of economic growth on the outflow of labor force. Thus Hypothesis 3 is partly verified, namely, the household registration policy has a negative moderating effect on the economic growth effect of cross-regional allocation of human capital, but e except for advanced human capital.

5. Discussion

With the development of the economy, human capital is becoming more and more important to economic sustainable development [92,93,94,95]. Unfortunately, the human capital of China does not play an adequate role as developed countries do. Based on the endogenous growth theory, this study examined the underlying mechanisms of the effect of cross-regional allocation of human capital on regional economic sustainable development in the Chinese setting. We showed that cross-regional allocation of human capital significantly affected regional economic sustainable development. The net inflow of human capital can promote urban economic growth. The inflow of human capital exerts a positive effect on the economy of the inflow area. The outflow of human capital has no adverse on the economy of the outflow area. Our results is in accordance with the recent studies [40,68,69]. To some extent, the effect of cross-regional allocation of human capital on regional economic sustainable development is robust. Therefore, governments should emphasize the importance of cross-regional allocation of human capital and optimize the regional allocation of human capital.
Furthermore, current studies have verified human capital can exert an effect on labor productivity [94,96,97,98,99], industrial structure [100,101] and innovation [32,102]; Meanwhile, labor productivity [8,40] industrial structure [49,83] and innovation [103,104] have a positive effect on economic growth, but lacked an integrated perspective to better understand the effect of human capital on economic growth. Therefore, we further fill the gaps between human capital and economic growth. Specifically, cross-regional allocation of human capital affects labor productivity, industrial structure and innovation at the same time, which in turn affects regional economic sustainable development.
Additionally, in terms of household registration policy, we show that it plays a negative moderating role in the influence of cross-regional allocation of human capital on regional economic sustainable development. This may be attributed to increasing the cost of population mobility caused by household registration policy.
Actually, our study may provide a new perspective to better understand the influence of human capital on economic growth. This paper studies the relationship between human capital and economy from the perspective of flow, rather than the human capital stock.

6. Conclusions and Policy Recommendations

6.1. Conclusions

Firstly, cross-regional allocation of human capital is a key driving force of urban economic growth. Specifically, the inflow of labor can promote the economic growth of the inflow of cities. The outflow of the labor force will not bring probably negative effects on the economy of the outflow cities. The economic growth of the inflow area does not presuppose the economic growth of the outflow area, so the cross-regional allocation is beneficial to the whole national economic growth.
Secondly, the heterogeneity test shows that for small and medium-sized cities with low population density, all kinds of population inflow can promote economic growth, but the most important factor is advanced human capital. For super-cities and mega-cities, only advanced human capital inflows can promote economic growth, and the role of advanced human capital in super-cities and mega-cities is more obvious. For the Eastern developed cities, only the inflow of advanced human capital can promote economic growth. For the Central and western cities, all kinds of population inflow can promote economic growth, but the most important one is advanced human capital. It is worth noting that the outflow of labor from the Central cities has a negative impact on the economy of the Central cities, possibly due to the fact that the Central cities are adjacent to the Eastern cities and are affected by the talent siphon effect, which has a negative impact on the economic development of the Central cities. For municipalities & provincial capitals, the inflow of labor significantly promotes economic growth, which is driven by advanced human capital rather than ordinary human capital. It is worth noting that the outflow of labour from municipalities and provincial capitals can significantly promote economic growth, possibly because the ordinary labour force in such cities may be close to saturation or even surplus. So the outflow of the labor force eases the crowding effect, and thus promotes economic growth. For other cities, all types of population inflows contribute to economic growth, but the most important is advanced human capital. It is worth noting that the rate of labor outflow has a negative impact on other cities, and the reason may still be due to the siphon effect.
Thirdly, acting on labor, capital, and technology, human capital contributes indirectly to economic growth by increasing labor productivity, upgrading industrial structures and enhancing regional innovation capacity. So labor productivity, industrial structure, and regional innovation ability are the medium transmission channels of cross-regional allocation of human capital to promote regional economic growth.
Last, generally, the household registration policy weakens the influence of population mobility on urban economic growth, that is, the household registration policy has a significant weakening or inhibiting effect. The reason may be that the household registration policy impedes population mobility.

6.2. Policy Recommendations

As China’s economy enters The New Normal, the drawbacks of the traditional extensive growth model, which relies mainly on labor and large-scale material capital accumulation, are becoming more obvious. It is urgent to transfer towards an efficiency-driven and innovation-driven model of sustainable growth. So human capital is a key driving force of urban sustainable economic development. In view of the long time of increasing the stock of human capital, it is particularly important to optimize the allocation of human capital. Considering the realistic background of the national strategy of rejuvenating the country through science and education and the strategy of innovation-driven development, this paper holds that it is particularly important to optimize the allocation of human capital. As an important way to improve the efficiency of cross-regional allocation of human capital, population mobility should be given more policy guidance so as to foster new economic growth drivers and promote China’s sustainable economic development. Specifically, we should increase efforts to optimize the allocation of human capital across regions. Improving labor productivity, upgrading industrial structure, and enhancing regional innovation capacity will become important measures to promote China’s economic growth. At the same time, the local government should introduce the policy of talent introduction according to local conditions, and should not blindly follow the trend and get involved in the “War for talent”.

6.3. Limitations and Future Research

First, our study is conducted in Chinese cultural background, resulting in the results being limited to the Chinese context. Given the difference in cross-culture, is there a possible difference between the mechanism of cross-regional allocation of human capital on regional economic sustainable development and the research based on Chinese samples? Future research can verify the above conclusions through cross cultural comparative analysis. Second, although we examined the influence mechanisms between the cross-regional allocation of human capital and regional economic sustainable development from labor productivity, industrial structure and innovation, we did not discuss the relationship between labor productivity, industrial structure and innovation. So future research can discuss the relationship between labor productivity, industrial structure and innovation. Third, although we explored the mechanisms of cross-regional allocation of human capital on regional economic sustainable development respectively, however, we did not explore its joint mediation effect. Therefore, future research can explore the joint mediation effect. Finally, although we explored the mechanisms of cross-regional allocation of human capital on regional economic sustainable development, we did not explore its boundary conditions. Therefore, future research can explore the boundary conditions.

Author Contributions

Conceptualization, X.L.; Methodology, P.L.; Software, G.Y.; Validation, P.L.; Investigation, X.L.; Data curation, X.L. and G.Y.; Writing—original draft, X.L.; Supervision, P.L.; Project administration, X.L. All authors have read and agreed to the published version of the manuscript.

Funding

1. This work was supported by the Key Projects of the National Social Science Fund (No. 17AJL012). 2. This work was supported by the Guangxi Science and Technology Base and Talent Project (Grant No. AD22080047).

Institutional Review Board Statement

Not applicable.

Informed Consent Statement

Not applicable.

Data Availability Statement

Not applicable.

Conflicts of Interest

The authors declare no conflict of interest.

References

  1. China Economic Growth Frontier Research Group; Yuan, F.H.; Chen, C.P.; Zhang, P.; Liu, X.H.; Lu, M.T. China’s long-term economic growth path, efficiency and potential growth level. Econ. Res. 2012, 11, 4–17+75. [Google Scholar]
  2. Yang, B.; Wang, L.; Zhao, J. Does China’s “Structural acceleration” to “Structural deceleration” originate from industrial structure? A study based on a stochastic frontier model. J. Southeast Univ. 2018, 5, 65–80. [Google Scholar]
  3. Ren, B. From the Chinese growth miracle to high-quality growth. Political Econ. Rev. 2022, 6, 3–34. [Google Scholar]
  4. Yuan, F. “Structural acceleration” and “Structural deceleration” of long-term growth processes: An explanation. Econ. Res. 2012, 3, 127–140. [Google Scholar]
  5. Yu, Y.; Yang, X.; Zhang, S. Research on the Characteristics of Time and Space Conversion of China’s Economy from High-speed Growth to High-quality Development. Quant. Technol. Econ. 2019, 36, 3–21. [Google Scholar]
  6. Lin, J.Z.; Kim, H.H. An empirical study on the high-quality development efficiency of the urban economy in China. Int. J. Adv. Appl. Sci. 2022, 6, 119–124. [Google Scholar] [CrossRef]
  7. Zhao, W.Z. Promote the transformation of the driving forces for China’s economic growth and achieve high-quality economic development. Ind. Inf. Technol. 2022, 4, 5–19. [Google Scholar]
  8. Lai, P.Y. China’s productivity dilemma for economic growth: A slowdown in growth with increased investment. World Econ. 2016, 1, 75–94. [Google Scholar]
  9. Li, J.B.; Jiang, Q.B. Population size, population ageing and economic growth. Popul. J. 2023, 2, 55–66. [Google Scholar]
  10. Bloom, D.E.; Canning, D.; Fink, G. Implications of population ageing for economic growth. Oxf. Rev. Econ. Policy 2010, 4, 583–612. [Google Scholar] [CrossRef] [Green Version]
  11. Arrow, K.J. The economic implications of learning by doing. Rev. Econ. Stud. 1971, 3, 155–173. [Google Scholar]
  12. The China Economic Growth Frontier Research Group; Yuan, F.H.; Zhang, P.; Wang, H.M.; Liu, X.H.; Lu, M.T.; Zhang, L. The low efficiency impact and deceleration of China’s economic growth. Econ. Res. 2014, 12, 4–17, 32. [Google Scholar]
  13. Dong, X.B.; Zhu, H.; Kang, J.J.; Song, S.F. Research on the growth effect of intellectual property protection system in the transition period. Econ. Res. 2012, 8, 4–17. [Google Scholar]
  14. Wang, F.; Tian, M.; Qin, G. Coupling, coordination and optimization of new urbanization and industrial structure upgrading. East China Econ. Manag. 2020, 3, 59–68. [Google Scholar]
  15. Yan, C.L. Analysis of China’s economic growth dynamics under The New Normal. Soc. Sci. Chin. Univ. 2017, 6, 44–52. [Google Scholar]
  16. Lin, J.Y.; Wan, G.; Morgan, P.J. Prospects for a re-acceleration of economic growth in the PRC. J. Comp. Econ. 2016, 44, 842–853. [Google Scholar] [CrossRef]
  17. Zhang, Y.P.; Yang, Z. Research on the driving mechanism of innovation-driven economic growth and its realization path. Reform Econ. Syst. 2016, 6, 53–58. [Google Scholar]
  18. Laeven, L.; Levine, R.; Michalopoulos, S. Financial innovation and endogenous growth. J. Financ. Intermediat. 2015, 1, 1–24. [Google Scholar] [CrossRef] [Green Version]
  19. Li, H. Study on the Path of Economic Growth in China. Ph.D. Thesis, Central Party School of the Communist Party of China, Beijing, China, November 2019. [Google Scholar]
  20. Chen, X.; Xia, H. Human capital allocation efficiency in China’s inter-provincial economic growth. Popul. Econ. 2013, 6, 86–92. [Google Scholar]
  21. Benhabib, J.; Spiegel, M.M. The role of human capital in economic development evidence from aggregate cross-country data. J. Monetary Econ. 1994, 34, 143–173. [Google Scholar] [CrossRef]
  22. Li, J.; Nan, Y.; Liu, X. China’s economic growth problem: Human capital misallocation and its solution. Econ. Res. 2017, 3, 18–31. [Google Scholar]
  23. Liu, Z.; Li, H.; Hu, Y.; Li, C. Upgrading the human capital structure and economic growth—Also on the formation and narrowing of the Midwestern Sectional Figure Skating Championships gap. Econ. Res. 2018, 3, 50–63. [Google Scholar]
  24. Hu, Z.G.; Liu, W.T.; Peng, X.Y. Spatial differentiation of population migration and economic development: A human capital accumulation perspective. Chin. Soft Sci. 2023, 1, 105–113. [Google Scholar]
  25. Wang, X. A Study on Regional Human Capital Allocation and Its Impact on Economic Growth in China. Ph.D. Thesis, Liaoning University, Shenyang, China, June 2010. [Google Scholar]
  26. Li, Y.; Li, P.; Li, X.; Zhang, P. Analysis and Forecast of China’s Economic Situation in 2015; Social Sciences Literature Press: Beijing, China, 2015. [Google Scholar]
  27. Wang, Y. A new round of power transformation and route choice of China’s economy. Manag. World 2017, 2, 1–14. [Google Scholar]
  28. Nan, Y. The gap of human capital toward high-quality development in China: From the perspective of human capital structure and allocative efficiency. J. Beijing Univ. Technol. 2020, 4, 30–39. [Google Scholar]
  29. Pei, K. Allocation of R&D human capital and technological innovation: Perspective of heterogeneous education level. Sci. Prog. Countermeas. 2021, 14, 11–20. [Google Scholar]
  30. Qiu, Y.H.; Li, L.T. Study on the interaction mechanism between human capital and rural economy based on the theory of economic growth dynamics. China Agric. Sci. Technol. News 2006, 4, 60–66. [Google Scholar]
  31. Masatoshi, K.; Hiroyuki, O.; Yuji, H. Does founders’ human capital matter for innovation? Evidence from Japanese Start-ups. J. Small Bus. Manag. 2015, 1, 114–128. [Google Scholar]
  32. Teixeira, A.A.C.; Queiros, A.S.S. Economic growth, human capital and structural change: A dynamic panel data analysis. J. Res. Policy 2016, 8, 1636–1648. [Google Scholar] [CrossRef]
  33. Khadan, J. Estimating the effects of human capital constraints on innovation in the caribbean. Economies 2018, 2, 6–33. [Google Scholar]
  34. Barrow, S.M. Economic Growth; He, H.X., Translator; China Social Sciences Press: Beijing, China, 1995. [Google Scholar]
  35. Mankiw, N.G.; David Romer David, N.W. A contribution to the empiric of economic growth. Q. J. Econ. 1992, 2, 407–437. [Google Scholar] [CrossRef]
  36. Zhang, Y.H. Research on the influence of human capital structure and R&D investment on economic growth. Chin. Prices 2022, 12, 38–41. [Google Scholar]
  37. Shi, G.; Lee, J.; Huang, S. Migration, demographic dividend and economic growth. East China Econ. Manag. 2022, 14, 65–69. [Google Scholar]
  38. Dong, S.C. Empirical analysis of population mobility and regional economic development. Mark. Hum. Anal. 2004, 5, 23–26, 32. [Google Scholar]
  39. Li, X.Y.; Lin, Y.Z.; Zhang, Z. A study on the interaction between population mobility and economic growth. Soc. Sci. Abstr. 2016, 2, 71–72. [Google Scholar]
  40. Zhang, Y.C.; Liang, Q.X. Labor mobility, across-regional allocation of human capital and enterprise productivity. Labor Econ. Res. 2022, 5, 55–86. [Google Scholar]
  41. Zeng, Y. A study on the spatial structure of trans-regional migration flows in China—Description, model expression and prediction. Popul. Econ. 2022, 6, 58–76. [Google Scholar]
  42. Zeng, X. Research on the Relationship between Inter-Provincial Population Migration and Regional Economic Development in China from a Spatial Perspective. Ph.D. Thesis, Shanghai Academy of Social Sciences, Shanghai, China, November 2018. [Google Scholar]
  43. Docquier, F.; Rapoport, H. Globalization, Brain Drain and Development; Working Paper, No. 2011-18; Bar-Ilan University, Department of Economics: Ramat-Gan, Israel, 2011. [Google Scholar]
  44. Fu, M. Geographical distance and technology spillover effects—A spatial econometric interpretation of technology and economic agglomeration. Economics 2009, 4, 1549–1566. [Google Scholar]
  45. Wang, L.L.; Qiao, X. Population migration cost, city size and productivity in our country. Economics 2020, 1, 165–188. [Google Scholar]
  46. Dai, Q.; Bie, Z. FDI, human capital accumulation and economic growth. Econ. Res. 2006, 4, 15–27. [Google Scholar]
  47. Bai, Y. A Study on the Impact of Heterogeneous Human Capital on Industrial Structure Upgrading—Inner Mongolia as an Example. Ph.D. Thesis, Central University of Finance and Economics, Beijing, China, November 2020. [Google Scholar]
  48. Zhang, C. Foreign human capital, cultural diversity and urban innovation in China. Econ. Res. 2019, 11, 172–192. [Google Scholar]
  49. Liu, L.; Si, S.; Li, J. Research on the effect of regional talent allocation on high-quality economic development—Based on the perspective of innovation-driven growth. Sustainability 2023, 15, 6315. [Google Scholar] [CrossRef]
  50. Wang, T. Human capital flow and technology spillover effects: An empirical study based on the data of Chinese manufacturing enterprises. Econ. Sci. 2008, 4, 99–109. [Google Scholar]
  51. Wang, M.; Cai, F. The course and prospect of the reform of household registration system. Guangdong Soc. Sci. 2008, 6, 19–26. [Google Scholar]
  52. Chen, Q.; Huang, T.; Wu, K. Human capital mobility and innovation: A comparative study based on China’s talent introduction policy. J. Shanghai Univ. 2018, 4, 124–140. [Google Scholar]
  53. Guo, H.; Gao, X. Urbanization, digital economy and high-quality economic development—An empirical analysis based on intermediary effect and regulatory effect. Econ. Perspect. 2021, 3, 18–29. [Google Scholar]
  54. Guo, M.; Nowakowska-Grunt, J.; Gorbanyov, V.; Egorova, M. Green technology and sustainable development: Assessment and green growth frameworks. Sustainability 2020, 12, 6571. [Google Scholar] [CrossRef]
  55. Ye, W.P.; Li, X.C.; Chen, Q. The effect of floating population on urban entrepreneurial activity: Mechanism and evidence. Econ. Res. 2018, 6, 157–170. [Google Scholar]
  56. Xia, Y.; Lu, M. The footprint of urban human capital across the century—historical heritage, policy impact and labor mobility. Econ. Res. 2019, 1, 132–149. [Google Scholar]
  57. Zhang, X.; Wan, G. Does China’s rural infrastructure promote inclusive growth? Econ. Res. 2016, 10, 82–96. [Google Scholar]
  58. Fu, L.; Li, J.; Fang, X.; Wei, H. The mechanism and effectiveness test of digital Pratt & Whitney Finance for Inclusive Growth. Stat. Study 2021, 10, 62–75. [Google Scholar]
  59. Bender, S.; Bloom, N.; Card, D.; Van Reenen, J.; Wolter, S. Management practices, workforce selection, and productivity. J. Labor Econ. 2018, 1, S371–S409. [Google Scholar] [CrossRef] [Green Version]
  60. Liu, F.; Nan, T.; Wang, X. Causes and Evolution Characteristics of Green Innovation Efficiency Loss: The Perspective of Factor Mismatch under Local Government Competition. Sustainability 2022, 14, 8338. [Google Scholar] [CrossRef]
  61. Ai, X.; Zhang, H.; Guo, K.; Shi, F. Does regional innovation environment have an impact on the gathering of technological talent? An empirical study based on 31 provinces in China. Sustainability 2022, 14, 15934. [Google Scholar] [CrossRef]
  62. Cui, T.; Chen, X. Migration and urban innovation: Evidence from vice-provincial cities and above in China. Sci. Technol. Manag. Res. 2021, 11, 23–30. [Google Scholar]
  63. Bryan, G.; Melanie, M. The aggregate productivity effects of internal migration: Evidence from Indonesia. J. Political Econ. 2019, 5, 2229–2268. [Google Scholar] [CrossRef] [Green Version]
  64. Faggian, A.; Isha, R.; Kathryn, D. The Inter-regional migration of human capital and its regional consequences: A review. Reg. Stud. J. Reg. Stud. Assoc. 2017, 1, 128–143. [Google Scholar] [CrossRef]
  65. Hu, Y.Y.; Liu, Z.Y. An analysis of the impact of different types of human capital on economic growth. Popul. Econ. 2004, 2, 55–58. [Google Scholar]
  66. Liu, C.J.; Dong, Y.F. Heterogeneous human capital flow and regional economic development: A case study of Shanghai. China Popul. Sci. 2007, 4, 50–57, 96. [Google Scholar]
  67. Wang, X.H. The global dimension of China’s talent competition. Chin. Talent 2018, 7, 26–28. [Google Scholar]
  68. Giannetti, M.; Liao, G.M.; Yu, X.Y. The brain gain of corporate boards: Evidence from China. J. Financ. 2015, 4, 1629–1682. [Google Scholar] [CrossRef]
  69. Braunerhjelm, P.; Ding, D.; Per, T. Labour market mobility, knowledge diffusion and innovation. Eur. Econ. Rev. 2020, 123, 103386. [Google Scholar] [CrossRef]
  70. Wu, P.G. The impact of human capital flow on regional economic growth disparities. J. Natl. Sun Yat-Sen Univ. Sci. 2009, 5, 200–208. [Google Scholar]
  71. Wong, Q. A Study on the Effect of Labor Mobility on Regional Economic Growth. Ph.D. Thesis, Jilin University, Changchun, China, 2020. [Google Scholar]
  72. Ni, M. Study on the Relationship between Human Capital and Economic Growth Considering Population Mobility. Ph.D. Thesis, Tianjin University of Finance and Economics, Tianjin, China, 2015. [Google Scholar]
  73. Guo, L.Y.; Huang, J.Z.; Zhuang, H.M. Flow of human capital, agglomeration of high-tech industries and economic growth. Nankai Econ. Res. 2020, 6, 163–180. [Google Scholar]
  74. Liao, S.Y.; Wang, M.R. Seven measures of “Talent competition” in China’s big cities. Policy Outlook 2018, 7, 48–49. [Google Scholar]
  75. Bosetti, V.; Cristina, C.; Elena, V. Migration of skilled workers and innovation: A European perspective. J. Int. Econ. 2015, 2, 311–322. [Google Scholar] [CrossRef]
  76. Bernstein, S.; Rebecca, D.; Timothy, M.; Beatriz, P. The Contribution of High-Skilled Immigrants to Innovation in the United States; Standford Graduate School of Business Working Paper; No. 3748; Stanford Graduate School of Business: Stanford, CA, USA, 2018. [Google Scholar]
  77. Kangasniemi, M.; Matilde, M.; Catherine, R.; Lorenzo, S. The economic impact of migration: Productivity analysis for Spain and the UK. J. Product. Anal. 2012, 3, 333–343. [Google Scholar] [CrossRef] [Green Version]
  78. Krugman, P. The myth of Asia’s miracle. Foreign Aff. 1994, 6, 62–78. [Google Scholar] [CrossRef]
  79. Maré, D.; Richard, F. Productivity and Local Workforce Composition. In Geography, Institutions and Regional Economic Performance; Springer: Berlin/Heidelberg, Germany, 2013; pp. 59–76. [Google Scholar]
  80. Breton, T.R. The quality vs the quantity of schooling: What drives economic growth? Econ. Educ. Rev. 2011, 4, 765–773. [Google Scholar] [CrossRef] [Green Version]
  81. Peri, G. The effect of immigration on productivity: Evidence from US States. Rev. Econ. Stat. 2012, 1, 348–358. [Google Scholar] [CrossRef] [Green Version]
  82. Jin, W.D. The Effect of Dynamic Machining between Human Capital and Industrial Structure Transformation. Econ. Rev. 2010, 6, 137–142. [Google Scholar]
  83. Dai, Q.W.; Yang, J.R. A empirical study of the relation of industrial structure upgrading and human capital:a example for Jiang Xi province. Jiangxi Soc. Sci. 2007, 12, 123–126. [Google Scholar]
  84. Dong, F.R.; Li, P. The Interaction Relation between Human Capital and Industrial Structure in Guang Dong. Hum. Resour. Dev. China 2009, 3, 72–76. [Google Scholar]
  85. Ran, M.S.; Mao, Z.B. The mechanism analysis of human capital to economic growth. J. Chong Qing Univ. Soc. Sci. Ed. 2008, 1, 56–59. [Google Scholar]
  86. Sun, Z.; Hou, Y.L. Government training subsidy, externality of enterprise training and technological innovation: From the perspective of human capital investment in incomplete labor market. Econ. Manag. Res. 2019, 4, 47–64. [Google Scholar]
  87. Madsen, J.B. Human capital and world technology frontier. Rev. Econ. Stat. 2014, 4, 676–692. [Google Scholar] [CrossRef]
  88. Csaba, C.; Badulescu, A. Education and human capital as engines for economic growth: A literature review. Ann. Univ. Oradea Econ. Sci. 2015, 2, 665–673. [Google Scholar]
  89. Hua, J.; Hu, J.X. Evaluation of the coupling relationship between China’s regional scientific and technological innovation and high-quality economic development. Sci. Technol. Prog. Countermeas. 2019, 8, 19–27. [Google Scholar]
  90. Shi, H.B.; Cui, Y.C.; Tsai, S.B.; Wang, D.M. The impact of technical-nontechnical factors synergy on innovation performance: The moderating effect of talent flow. Sustainability 2018, 10, 693. [Google Scholar] [CrossRef] [Green Version]
  91. Kerr, S.; William, K. Immigration policy levers for US innovation and startups. In Innovation and Public Policy; Goolsbee, A., Jones, B., Eds.; University of Chicago Press: Chicago, IL, USA, 2022; pp. 85–116. [Google Scholar]
  92. Gupta, M.R.; Chakraborty, B. Human capital accumulation and endogenous growth in a dual economy. Hitotsubashi J. Econ. 2006, 2, 169–195. [Google Scholar]
  93. Barro, R.J. Human capital and growth. Am. Econ. Rev. 2001, 2, 12–17. [Google Scholar] [CrossRef]
  94. Gennaioli, N.; La Porta, R.; Lopez-de-Silanes, F.; Shleifer, A. Human capital and regional development. Q. J. Econ. 2013, 1, 105–174. [Google Scholar] [CrossRef] [Green Version]
  95. Sunde, U.; Vischer, T. Human capital and growth: Specification matters. Economica 2015, 326, 368–390. [Google Scholar] [CrossRef] [Green Version]
  96. Liu, W.; Li, S.R. Industrial structure and economic growth. China’s Ind. Econ. 2002, 5, 14–21. [Google Scholar]
  97. Berry, C.R.; Glaeser, E.L. The divergence of human capital levels across cities. Pap. Reg. Sci. 2005, 3, 407–444. [Google Scholar] [CrossRef] [Green Version]
  98. Oreski, D.; Marsic, K.; Kedmenec, I. The association between human capital and overall productivity in the European Union countries. CECIIS 2015, 2, 49–56. [Google Scholar]
  99. Shapiro, J.M. Smart cities: Quality of life, productivity, and the growth effects of human capital. Rev. Econ. Stat. 2006, 2, 324–335. [Google Scholar] [CrossRef]
  100. Ciccone, A.; Papaioannou, E. Human capital, the structure of production, and growth. Rev. Econ. Stat. 2009, 1, 66–82. [Google Scholar] [CrossRef]
  101. Saviotti, P.; Pyka, A. From necessities to imaginary worlds: Structural change, product quality and economic development. Technol. Forecasting Soc. Change 2013, 80, 1499–1512. [Google Scholar] [CrossRef]
  102. Akhvlediani, T.; Cieslik, A. Human capital, technological progress and technology diffusion across Europe: Education matters. Empirica. 2020, 3, 475–493. [Google Scholar] [CrossRef]
  103. Yong, W. On innovative impetus driving China’s sustainable economic growth. Innov. Comput. Inf. 2011, 5, 156–160. [Google Scholar]
  104. Zhou, R.B.; Liu, Y.Z.; Yang, Z.W. Spatial-Temporal Evolution and Knowledge Spillovers of Urban Innovation in China. Econ. Geogr. 2019, 39, 85–92. [Google Scholar]
Figure 1. China’s economic growth. (Red bars mean the beginning of The New Normal).
Sustainability 15 09807 g001
Figure 4. The mediating effect model of Labor productivity.
Sustainability 15 09807 g004
Figure 5. The mediating effect model of industrial structure.
Sustainability 15 09807 g005
Figure 6. The mediating effect model of urban innovation capability.
Sustainability 15 09807 g006
Table 1. Variable description.
Variable CategoryVariable NameSymbolsMethods of Calculation and References
Dependent variableGrowth rate of GDP per capitaRjgdp(Real GDP per capita this year-Real GDP per capita last year)/Real GDP per capita this year
Core independent variablesNet inflow of populationNetinmig(The inflow of population–the outflow of population)/Total population
Net inflow of advanced human capitalGjrlzb(The inflow of college and above population–the outflow of college and above population)/Total population
Net inflow of ordinary human capitalPtrlzb(The inflow of college and below population—he outflow of college and below population)/Total population
Robustness test variablesAlternative variables to the core independent variablesNetin11-Registered population/Resident population [55]
HumancThe inflow of college and above population in one city/the inflow of college and above population in one country [56]
Alternative variables to the dependent variableGdprGDP growth rate
Control variablesResource EndowmentThe land area of the administrative regionXztdmjThe data came directly from the statistical yearbook
Total amount of water resourcesSzyThe same asthe above
Government policyFiscal expenditureCzzcThe same as the above
Public WelfareNumber of ordinary secondary schoolsPtzxThe same as the above
Number of ordinary primary schoolsPtxxThe same as the above
Number of medical and health institutionsYlwsThe same as the above
Total stock of public librariesGgtsThe same as the above
OpennessThe actual amount of foreign capital usedSjsywzThe same as the above
Net exportsJckExport–Import
Physical capitalInvestment in fixed assetsGdzcThe data came directly from the statistical yearbook
Mediating variableLabor productivityLdsclUrban GDP/Employed persons in urban units [59]
Industrial structureCyjgAdded value of tertiary industry/Added value of secondary industry [14]
Regional innovation capabilityCxnlNumber of patents granted [62]
Moderating variableHousehold registration control policyHjzdResident population/Registered population [37]
Table 2. Descriptive statistics.
Variable SymbolVariable MeaningSample SizeAverageStandard DeviationMinimumMaximum
Dependent variableRjgdpGrowth rate of GDP per capita45440.4210.3250.0014.677
Core independent variablesNetinmigThe rate of population net inflow4544−0.0260.1080.3480.760
RklrThe rate of population inflow45440.0390.0800.0000.762
RklcThe rate of population outflow45440.0650.0530.0010.367
GjrlzbNet inflow of advanced human capital45440.0400.1750.0001.000
PtrlzbNet inflow of ordinary human capital4544−0.0650.212−1.2461.000
Robustness
test variables
GdprGDP growth index45440.1100.094−0.3113.842
NetinAlternative indicator of net population inflow rate 145440.6450.239−2.1810.996
HumancAlternative indicator of net population inflow rate 24544−2.3781.345−4.6052.867
Mediating variableLdsclLabor productivity45440.0820.0570.0000.641
CyjgIndustrial structure45440.9500.5440.0949.482
CxnlRegional innovation capability4544143.7961344.4090.00046,988
Moderating variableHjzdHousehold registration control policy45444.4314.9700.314236.136
Control variables(Resource Endowment)
XztdmjThe land area of administrative region454416.52721.7831.113261.570
SzyTotal amount of water resources45441.6193.1520.01534.948
(Government policy)
CzzcPublic Expenditure4544278.949521.8574.9308351.54
(Public Services)
PtzxNumber of ordinary secondary schools454486.907126.4555.0002639.00
PtxxNumber of ordinary primary schools4544172.216181.2566.0001978.00
YlwsNumber of medical and health institutions454467.856114.5094.1346421.72
GgtsTotal stock of public libraries45442.1456.7360.003179.850
(Openness)
SjsywzThe actual used foreign capital45447.65518.8380.000308.256
JckNet export454412.310189.894−3037.55919.90
(Physical capital)
GdzcInvestment in fixed assets454477.789128.5060.0031724.58
Table 3. Baseline regression results.
(1)
Rjgdp
(2)
Rjgdp
(3)
Rjgdp
(4)
Rjgdp
(5)
Rjgdp
Netinmig0.617 ***
(0.215)
————————
Gjrlzb——14.40 ***
(1.699)
——————
Ptrlzb————0.133
(0.244)
————
Rklr——————2.054 ***
(0.490)
——
Rklc————————0.235
(0.221)
Xztdmj0.0502
(0.312)
0.654 ***
(0.203)
0.805
(3.023)
−0.0396
(3.021)
0.871
(3.002)
Szy1.73
(1.502)
−0.608
(1.200)
0.203
(0.150)
0.0112
(0.016)
0.0208
(0.015)
Czzc2.91 ***
(0.000)
9.80 *
(0.000)
2.91 ***
(0.000)
0.279 ***
(0.000)
0.288 ***
(0.000)
Ptzx0.751 ***
(0.000)
0.512 ***
(0.000)
0.732 ***
(0.000)
0.721 ***
(0.000)
0.717 ***
(0.000)
Ptxx−0.366 ***
(0.000)
−0.248 ***
(0.000)
−0.354 ***
(0.000)
−0.351 ***
(0.000)
−0.345 ***
(0.000)
Ylws0.200 **
(0.000)
0.189 ***
(0.000)
0.185 *
(0.000)
0.212 **
(0.000)
0.179 *
(0.000)
Ggts0.353
(0.312)
0.621
(1.012)
0.341
(0.300)
0.00375
(0.003)
0.00336
(0.003)
Sjsywz−0.119
(0.103)
−0.242
(1.012)
−0.104
(1.155)
−0.145
(0.102)
−0.964
(1.311)
Jck0.120 **
(0.000)
0.840 **
(0.000)
0.118 **
(0.000)
0.116 ***
(0.000)
0.117 **
(0.000)
Gdzc0.139 ***
(0.000)
0.982 ***
(0.000)
0.140 ***
(0.000)
0.134 ***
(0.000)
0.140 ***
(0.000)
_cons0.329 ***
(0.040)
0.194 ***
(0.037)
0.312 ***
(0.039)
0.247 ***
(0.045)
0.292 ***
(0.039)
Individual effectControlControlControlControlControl
Time effectControlControlControlControlControl
N45444544454445444544
r20.4610.5580.4560.4780.456
Note: In parentheses are T statistics; *, **, *** indicate that the statistics are significant at the 10%, 5%, and 1% levels, respectively. Source: calculated on the basis of data from the 2005 and 2015 percent national sample surveys, the 2010 and 2020 national population censuses and the statistical yearbooks at the municipal or provincial levels.
Table 4. Tool variable regression.
(1)
Rjgdp
(2)
Rjgdp
(3)
Rjgdp
(4)
Rjgdp
(5)
Rjgdp
Netinmig(-1)0.552 ***
(0.195)
————————
Gjrlzb(-1)——13.35 ***
(1.611)
——————
Ptrlzb(-1)————0.106
(0.218)
————
Rklr(-1)——————1.976 ***
(0.453)
——
Rklc(-1)————————0.307
(0.204)
Xztdmj0.0421
(0.003)
0.575 **
(0.002)
0.574
(3.023)
−0.0896
(3.021)
0.998
(3.001)
Czzc2.66 ***
(0.000)
9.35 ***
(0.000)
2.68 ***
(0.000)
0.252 ***
(0.000)
0.265 ***
(0.000)
Szy0.222
(0.014)
0.909
(0.010)
0.257 *
(0.140)
0.0147
(0.015)
0.0264
(0.014)
Ptzx0.690 ***
(0.000)
0.447 ***
(0.000)
0.669 ***
(0.000)
0.666 ***
(0.000)
0.650 ***
(0.000)
Ptxx−0.325 ***
(0.000)
−0.197 ***
(0.000)
−0.313 ***
(0.000)
−0.316 ***
(0.000)
−0.303 ***
(0.000)
Ylws0.301 **
(0.000)
0.227 ***
(0.000)
0.288 *
(0.000)
0.301 **
(0.000)
0.279 *
(0.000)
Ggts0.318
(0.312)
0.153
(1.012)
0.308
(0.300)
0.335
(0.355)
0.279
(0.314)
Sjsywz−0.743
(0.103)
−0.018
(1.012)
−0.636
(1.155)
−0.894
(0.102)
−0.951
(1.311)
Jck0.960 ***
(0.000)
0.709 ***
(0.000)
0.963 ***
(0.000)
0.894 ***
(0.000)
0.951 ***
(0.000)
Gdzc0.133 ***
(0.000)
0.971 ***
(0.000)
0.135 ***
(0.000)
0.128 ***
(0.000)
0.134 ***
(0.000)
_cons0.342 ***
(0.038)
0.219 ***
(0.041)
0.324 ***
(0.037)
0.268 ***
(0.042)
0.299 ***
(0.037)
Individual effectControlControlControlControlControl
Time effectControlControlControlControlControl
N45444544454445444544
r20.4410.5330.4370.4600.437
Note: *, **, *** indicate that the statistics are significant at the 10%, 5%, and 1% levels, respectively.
Table 5. Surrogate index 1 robustness test.
(1)
Rjgdp
(2)
Rjgdp
(3)
Rjgdp
(4)
Rjgdp
(5)
Rjgdp
Netin0.198 ***
(0.055)
————————
Gjrlzb——14.40 ***
(1.699)
——————
Ptrlzb————0.133
(0.244)
————
Rklr——————2.054 ***
(0.490)
——
Rklc————————0.235
(0.221)
Xztdmj0.0348
(2.003)
0.470 **
(0.202)
−0.138
(2.023)
−0.644
(2.021)
0.0499
(2.001)
Czzc0.194 ***
(0.000)
0.606 ***
(0.000)
0.196 ***
(0.000)
0.199 ***
(0.000)
0.192 ***
(0.000)
Szy0.120
(0.140)
0.235 **
(0.121)
0.113 *
(0.140)
0.0166
(0.014)
0.0108
(0.013)
Ptzx0.690 ***
(0.000)
0.447 ***
(0.000)
0.669 ***
(0.000)
0.666 ***
(0.000)
0.650 ***
(0.000)
Ptxx−0.141 ***
(0.000)
−0.388
(0.000)
−0.130 ***
(0.000)
−0.901
(0.000)
−0.136 ***
(0.000)
Ylws0.301 **
(0.000)
0.227 ***
(0.000)
0.288 *
(0.000)
0.301 **
(0.000)
0.279 *
(0.000)
Ggts0.318
(0.312)
0.153
(1.012)
0.308
(0.300)
0.335
(0.355)
0.279
(0.314)
Sjsywz−0.743
(0.103)
−0.018
(1.012)
−0.636
(1.155)
−0.894
(0.102)
−0.951
(1.311)
Jck0.960 ***
(0.000)
0.709 ***
(0.000)
0.963 ***
(0.000)
0.894 ***
(0.000)
0.951 ***
(0.000)
Gdzc0.133 ***
(0.000)
0.971 ***
(0.000)
0.135 ***
(0.000)
0.128 ***
(0.000)
0.134 ***
(0.000)
_cons0.342 ***
(0.038)
0.219 ***
(0.041)
0.324 ***
(0.037)
0.268 ***
(0.042)
0.299 ***
(0.037)
Individual effectControlControlControlControlControl
Time effectControlControlControlControlControl
N45444544454445444544
r20.4620.5580.4560.4780.456
Note: *, **, *** indicate that the statistics are significant at the 10%, 5%, and 1% levels, respectively.
Table 6. Surrogate index 2 robustness test.
(1)
Rjgdp
(2)
Rjgdp
(3)
Rjgdp
(4)
Rjgdp
(5)
Rjgdp
Humanc0.0699 ***
(0.008)
————————
Gjrlzb——0.0631 ***
(0.012)
——————
Ptrlzb————0.0750 ***
(0.011)
————
Rklr——————1.662 ***
(0.526)
——
Rklc————————0.213
(0.186)
_cons0.462 ***
(0.041)
0.317 ***
(0.042)
0.319 ***
(0.042)
0.260 ***
(0.047)
0.304 ***
(0.042)
Control variablesControlControlControlControlControl
Individual effectControlControlControlControlControl
Time effectControlControlControlControlControl
N45444544454445444544
r20.5230.4880.4890.4990.486
Note: *** indicate that the statistics are significant at the 1% levels.
Table 7. Robustness test for replacement of dependent variable.
(1)
Gdpr
(2)
Gdpr
(3)
Gdpr
(4)
Gdpr
(5)
Gdpr
Netinmig0.377 **
(0.147)
————————
Gjrlzb——0.326 ***
(0.077)
——————
Ptrlzb————0.310 ***
(0.074)
————
Rklr——————0.236
(0.689)
——
Rklc—————— 0.427
(0.487)
_cons0.462 ***
(0.041)
0.317 ***
(0.042)
0.319 ***
(0.042)
0.260 ***
(0.047)
0.304 ***
(0.042)
Control variablesControlControlControlControlControl
Individual effectControlControlControlControlControl
Time effectControlControlControlControlControl
N45444544454445444544
r20.5230.4880.4890.4990.486
Note: **, *** indicate that the statistics are significant at the 5%, and 1% levels, respectively.
Table 8. Heterogeneity test based on different population densities.
Resident Population ≤ 3,720,000Resident Population > 3,720,000
(1)
Rjgdp
(2)
Rjgdp
(3)
Rjgdp
(4)
Rjgdp
(5)
Rjgdp
(6)
Rjgdp
Netinmig1.360 ***
(0.338)
————0.149
(0.202)
————
Gjrlzb——7.115 ***
(1.605)
————12.72 ***
(2.760)
——
Ptrlzb————1.131 ***
(0.297)
————−0.398
(0.247)
Control variablesControlControlControlControlControlControl
Individual effectControlControlControlControlControlControl
Time effectControlControlControlControlControlControl
N227022702270227222722272
r20.5770.5790.5700.6180.6770.621
Note: *** indicate that the statistics are significant at the 1% levels.
Table 9. Heterogeneity test based on different levels of development.
Eastern RegionCentral RegionWestern Region
(1)
Rjgdp
(2)
Rjgdp
(3)
Rjgdp
(4)
Rjgdp
(5)
Rjgdp
(6)
Rjgdp
(7)
Rjgdp
(8)
Rjgdp
(9)
Rjgdp
(10)
Rjgdp
(11)
Rjgdp
(12)
Rjgdp
Netinmig0.428
(0.371)
——————0.841 ***
(0.283)
——————0.785 ***
(0.294)
——————
Gjrlzb——12.56 ***
(2.335)
——————11.11 ***
(1.537)
——————16.93 ***
(2.393)
————
Ptrlzb————−0.0603
(0.432)
——————0.636 ***
(0.223)
——————0.0128
(0.345)
——
Rklc——————0.466
(0.452)
——————−0.325 *
(0.190)
——————0.678
(0.454)
Control variablesControlControlControlControlControlControlControlControlControlControlControlControl
Individual effectControlControlControlControlControlControlControlControlControlControlControlControl
Time effectControlControlControlControlControlControlControlControlControlControlControlControl
N160016001600160017421742174217421200120012001200
r20.4690.5310.4670.4670.6340.6670.6280.6220.4060.6420.3940.401
Note: *, *** indicate that the statistics are significant at the 10%, and 1% levels, respectively.
Table 10. Heterogeneity test based on different administrative status.
Municipalities Directly under the Central Government or Provincial CapitalsOther Cities
(1)
Rjgdp
(2)
Rjgdp
(3)
Rjgdp
(4)
Rjgdp
(5)
Rjgdp
(6)
Rjgdp
(7)
Rjgdp
(8)
Rjgdp
(9)
Rjgdp
(10)
Rjgdp
Netinmig0.773 *
(0.451)
————————1.029 ***
(0.220)
——————
Gjrlzb——11.72 ***
(1.790)
————————11.86 ***
(1.383)
——————
Ptrlzb————−0.271
(0.550)
————————0.749 ***
(0.194)
————
Rklr——————1.813 ***
(0.507)
————————2.625 ***
(0.753)
——
Rklc————————2.981 **
(1.271)
————————−0.295 **
(0.139)
Control variblesControlControlControlControlControlControlControlControlControlControl
Individual effectControlControlControlControlControlControlControlControlControlControl
Time effectControlControlControlControlControlControlControlControlControlControl
N49649649649649640624062406240624062
r20.6710.7680.6660.6870.6810.5620.5990.5540.5780.546
Note: *, **, *** indicate that the statistics are significant at the 10%, 5%, and 1% levels, respectively.
Table 11. Estimation of the mediating effect of labor productivity.
(1)
Rjgdp
(2)
Ldscl
(3)
Rjgdp
Ptrlzb0.0725 ***
(0.011)
0.0178 ***
(0.005)
0.0366 ***
(0.014)
ldscl————2.021 ***
(0.265)
Xztdmj0.000249
(0.002)
−0.000179
(0.000)
0.000610
(0.002)
Szy−0.00765
(0.012)
−0.00732 ***
(0.002)
0.00715
(0.012)
Czzc0.000196 ***
(0.000)
0.0000150 **
(0.000)
0.000166 ***
(0.000)
Ptzx−0.0000432
(0.000)
0.0000114
(0.000)
−0.0000662
(0.000)
Ptxx−0.000572 ***
(0.000)
−0.000143 ***
(0.000)
−0.000282 ***
(0.000)
Ylws0.000214
(0.000)
0.0000249
(0.000)
0.000164
(0.000)
Ggts−0.000217
(0.002)
−0.000192
(0.000)
0.000172
(0.002)
Sjsywz−0.000804
(0.001)
−0.000166
(0.000)
−0.000468
(0.001)
Jck0.000115 **
(0.000)
0.0000112
(0.000)
0.0000918 **
(0.000)
Gdzc0.00140 ***
(0.000)
0.000175 ***
(0.000)
0.00104 ***
(0.000)
_cons0.363 ***
(0.041)
0.104 ***
(0.007)
0.153 ***
(0.042)
Individual effectControlControlControl
Time effectControlControlControl
N454445444544
r20.4940.2340.584
Note: **, *** indicate that the statistics are significant at the 5%, and 1% levels, respectively.
Table 12. Estimation of the mediating effect of industrial structure upgrading.
(1)
Rjgdp
(2)
Cyjg
(3)
Rjgdp
Ptrlzb0.0725 ***
(0.011)
0.196 **
(0.077)
0.0639 ***
(0.012)
Cyjg————0.0435 **
(0.020)
Xztdmj0.0249
(0.201)
−0.0128 **
(0.006)
0.805
(2.023)
Szy0.0077
(0.012)
−0.0338 **
(0.013)
−0.00618
(0.012)
Czzc0.000196 ***
(0.000)
0.000142 ***
(0.000)
0.000190 ***
(0.000)
Ptzx−0.0000432
(0.000)
0.000273 *
(0.000)
−0.0000551
(0.000)
Ptxx−0.000572 ***
(0.000)
−0.000397 **
(0.000)
−0.000555 ***
(0.000)
Ylws0.000214
(0.000)
0.0000819 *
(0.000)
0.000211
(0.000)
Ggts−0.000217
(0.002)
0.00611 **
(0.003)
−0.000482
(0.002)
Sjsywz−0.000804
(0.001)
−0.00336 ***
(0.001)
−0.000658
(0.001)
Jck0.000115 **
(0.000)
−0.00000570
(0.000)
0.000115 **
(0.000)
Gdzc0.00140 ***
(0.000)
0.00159 ***
(0.000)
0.00133 ***
(0.000)
_cons0.363 ***
(0.041)
1.118 ***
(0.104)
0.315 ***
(0.037)
Individual effectControlControlControl
Time effectControlControlControl
N454445444544
r20.4940.2010.498
Note: *, **, *** indicate that the statistics are significant at the 10%, 5%, and 1% levels, respectively.
Table 13. Estimation of the mediating effect of regional innovation capability.
(1)
Rjgdp
(2)
Cxnl
(3)
Rjgdp
Ptrlzb0.0725 ***
(0.011)
1.577 ***
(0.364)
0.0452 ***
(0.013)
Cxnl————0.0173 ***
(0.003)
Xztdmj0.000249
(0.002)
−0.0844 *
(0.043)
0.00171
(0.002)
Szy−0.00765
(0.012)
−0.728 ***
(0.253)
0.00494
(0.009)
Czzc0.000196 ***
(0.000)
−0.00180 **
(0.001)
0.000227 ***
(0.000)
Ptxx−0.000572 ***
(0.000)
−0.00917 ***
(0.002)
−0.000414 ***
(0.000)
Ylws0.000214
(0.000)
0.00172
(0.001)
0.000185
(0.000)
Ggts−0.000217
(0.002)
0.101
(0.071)
−0.00196 **
(0.001)
Sjsywz−0.000804
(0.001)
−0.0446 ***
(0.015)
−0.0000322
(0.001)
Jck0.000115 **
(0.000)
−0.000102
(0.000)
0.000116 **
(0.000)
Gdzc0.00140 ***
(0.000)
0.0339 ***
(0.004)
0.000809 ***
(0.000)
_cons0.363 ***
(0.041)
4.747 ***
(0.869)
0.281 ***
(0.030)
Individual effectControlControlControl
Time effectControlControlControl
N454445444544
r20.4940.4670.548
Note: *, **, *** indicate that the statistics are significant at the 10%, 5%, and 1% levels, respectively.
Table 14. The moderating effect of household registration policy.
(1)
Rjgdp
(2)
Rjgdp
(3)
Rjgdp
(4)
Rjgdp
(5)
Rjgdp
Netinmig0.0685 ***
(0.008)
————————
Netinmig × Hjzd−0.00321 **
(0.002)
————————
Gjrlzb——8.742 ***
(1.674)
——————
Gjrlzb × Hjzd 47.53 ***
(12.123)
Ptrlzb————0.217
(0.252)
————
Ptrlzb × Hjzd −0.00150
(0.042)
Rklr——————1.822 ***
(0.540)
——
Rklr × Hjzd 0.0302
(0.045)
Rklc————————−0.466 **
(0.222)
Rklc × Hjzd 0.150 ***
(0.049)
_cons0.499 ***
(0.041)
0.242 ***
(0.039)
0.372 ***
(0.039)
0.301 ***
(0.046)
0.367 ***
(0.040)
Control variablesControlControlControlControlControl
Individual effectControlControlControlControlControl
Time effectControlControlControlControlControl
N45444544454445444544
r20.4610.5580.4560.4780.456
Note: **, *** indicate that the statistics are significant at the 5%, and 1% levels, respectively.
Disclaimer/Publisher’s Note: The statements, opinions and data contained in all publications are solely those of the individual author(s) and contributor(s) and not of MDPI and/or the editor(s). MDPI and/or the editor(s) disclaim responsibility for any injury to people or property resulting from any ideas, methods, instructions or products referred to in the content.

