Article

Too Much of a Good Thing? The Impact of Serial M&A on Innovation Performance

School of Business Administration, University of Science and Technology Liaoning, Anshan 114051, China
*
Authors to whom correspondence should be addressed.
Sustainability 2023, 15(12), 9829; https://doi.org/10.3390/su15129829
Submission received: 14 May 2023 / Revised: 7 June 2023 / Accepted: 16 June 2023 / Published: 20 June 2023
(This article belongs to the Section Economic and Business Aspects of Sustainability)

Abstract

:
Based on the sample of serial M&A of Chinese listed companies from 2010–2019, this paper intends to investigate the impact of serial M&A on innovation performance and the impact of financing constraints and digital inclusive finance (DIF). The empirical results show that an inverted U-shaped relationship exists between serial M&A and innovation performance that first goes up and then goes down. The results of mechanism analysis show that financing constraints play a mediating role in the inverted U-shaped relationship between serial M&A and innovation performance, while DIF plays a moderating role in the mediating effect of serial M&A on innovation performance through the financing constraint. The heterogeneity analysis finds that the inverted U-shaped relationship between serial M&A and innovation performance is more significant in firms with non-state ownership property, a higher business environment index, and medium and large-scale firm size. The research results not only help to promote the in-depth analysis of the impact of serial M&A on innovation performance, but also help to provide targeted theoretical reference and practical guidance for corporate management decision making.

1. Introduction

Innovation is the first driving force to lead development, and how to promote innovation has been the focus of attention. Following the speedy development of China’s capital market, it has become more and more difficult to rely solely on in-house independent innovation. M&A, as an essential route and means for enterprises to acquire external resources and competitive advantages [1,2,3], has facilitated enterprises in obtaining key resources such as technical knowledge and R&D talents in a short-term period [4]. As a result, more and more enterprises have chosen the approach of serial M&A to drive innovation performance. Unlike episodic M&A, serial M&A is a phenomenon where companies may complete multiple acquisitions over a period of time [5,6,7]. Golubov, Yawson, and Zhang (2015) have pointed out that it is practically non-existent for a firm to have only one M&A transaction [8]. According to the China Stock Market & Accounting Research Database (CSMAR), of the 1730 listed companies which had 16,362 M&A transactions during 2010–2019, there were 1583 (91.50%) listed companies that underwent more than two M&A. However, most of the existing literature has tended to examine M&A as stand-alone events and has provided insufficient focus on the issue of serial M&A. A small amount of literature has discussed the possible economic consequences of serial mergers and acquisitions [9,10], but most of it has been limited to the scope of financial performance, while little concern has been given to innovation performance. Indeed, the existing literature is not lacking in exploring the link between M&A and innovation performance [11,12,13,14,15], but unfortunately, they have not focused on the issue of serial M&A, and the impact of serial M&A on innovation performance remains to be studied. Given the enthusiasm for serial M&A in practice, we cannot help but ask whether there is only a monotonic increasing relationship between serial M&A and innovation performance. With the increase of serial M&A, is there a “Too-Much-of-A-Good-Thing Effect” that leads to diminishing returns? The improvement of innovation performance relies on financial support, so do financing constraints and the DIF affect the relationship between serial M&A and innovation performance? What are the specific mechanisms behind these effects? The responses to the above questions will guide the management and practice of the business.
In the research on the relationship between M&A and innovation performance, there is no unified conclusion on whether M&A promotes innovation performance. Some scholars have argued from the perspectives of synergistic effects [16], resource complementarity [17,18,19,20], knowledge transfer [21,22], and learning [23,24,25], that M&A enhances innovation performance. Firms reconfigure advanced technology, equipment, technological assets, and technical personnel through M&A, thereby reducing innovation costs and achieving economies of scale and scope in innovation. At the same time, they convert external knowledge into internal knowledge through learning, which reduces the internal R&D risks and improves innovation performance. Conversely, some scholars have proposed that M&A inhibits innovation performance from a market competition perspective, arguing that serial M&A disrupt the innovation patterns of a limited number of firms competing with each other [26,27]. At the same time, the transaction costs of M&A, as well as post-merger management and integration issues, may also have a negative impact on innovation performance [28,29,30]. Furthermore, based on perspectives of technological knowledge and disruptive innovation, some scholars have suggested an inverted U-shaped relationship between M&A and innovation performance [31,32]. Financing constraints are an important factor that restricts M&A decisions and the actual innovation performance of companies. Currently, research on the relationship between M&A and financing constraints mainly explores the alleviating effect of M&A on financing constraints from the perspectives of internal market theory [33,34], and expanding financing channels [35] for M&A targets. In the research on the relationship between financing constraints and digital finance, most literature indicates that the development of digital finance can effectively alleviate financing constraints and thereby have a positive impact on innovation performance [36,37,38,39,40,41]. However, there is limited research that explores the pathways and mechanisms through which digital finance and financing constraints affect innovation performance in the context of continuous M&A.
Although the existing literature has explored the relationship between M&A and innovation performance and has drawn some meaningful conclusions, further analysis reveals that (1) Most available studies have considered M&A as independent events, failing to fully expose the nature of M&A as having continuity. For multiple M&As occurring within a year, usually only the largest transaction amount is retained, and the analysis of serial M&A and their value is probably not comprehensive. (2) A small amount of relevant literature has discussed the impact of M&A on innovation performance, providing a number of contrasting findings, such as either facilitating or inhibiting a positive U-shape or inverted U-shape. However, most of the literature has focused on resource features such as the knowledge and technology of the merging parties, and has focused less on the impact of serial M&A decisions on improving innovation performance. (3) Previous studies exploring the effects of M&A on financing constraints have mainly discussed the mitigating effects of M&A on financing constraints. Meanwhile, the Influences of DIF on financing constraints has been examined. However, the impact relationships and internal mechanisms among serial M&A, innovation performance, financing constraints, and DIF need further structured analysis.
In light of this, a sample of M&A data of Chinese A-share listed companies in Shanghai and Shenzhen from 2010–2019 is used in this paper to explore the impact of serial M&A on innovation performance and the mechanism by which DIF and financing constraints act on their relationship. The contributions of this paper are as follows: First, to add to the understanding of the relationship between serial M&A and innovation performance. With the surge in open innovation in firms, the relationship between M&A and innovation performance has received increasing attention in recent years. This paper focuses on the phenomenon of serial M&A in corporate acquisitions, aiming to address the limitations of existing research that overlook the issue of serial M&A. By examining the relationship between serial M&A and innovation performance, it reveals an inverted U-shaped relationship between the two, which helps to comprehensively clarify the relationship between serial M&A and innovation performance. Second, it helps to clarify the mechanism of the impact of serial M&A on corporate innovation. By exploring the mediating role of financing constraints and the moderating role of DIF, the findings of the study shows that serial M&A indirectly affects firm innovation performance through financing constraints, and DIF strengthens the link between them, and at the same time, moderates the impact of serial M&A on financing constraints and plays a moderating role with mediation, which provides an important reference for clarifying the mechanism of how serial M&A affects innovation performance. Third, based on the examination of the nature of property rights, the business environment index, and firm size, it is found that serial M&A, in the scenario of non-state-owned enterprises, higher-business-environment indexes, and medium to large-scale firms, tend to indirectly generate an inverted U-shaped effect on innovation performance through financing constraints, which helps to provide targeted suggestions for firms to improve their innovation performance. Furthermore, this study has important theoretical and practical meaning for optimizing serial M&A decisions, improving innovation performance, and even for achieving the high-quality development of enterprise, providing scientific grounds and useful reference for governmental regulatory departments to improve the effectiveness of policy setting.

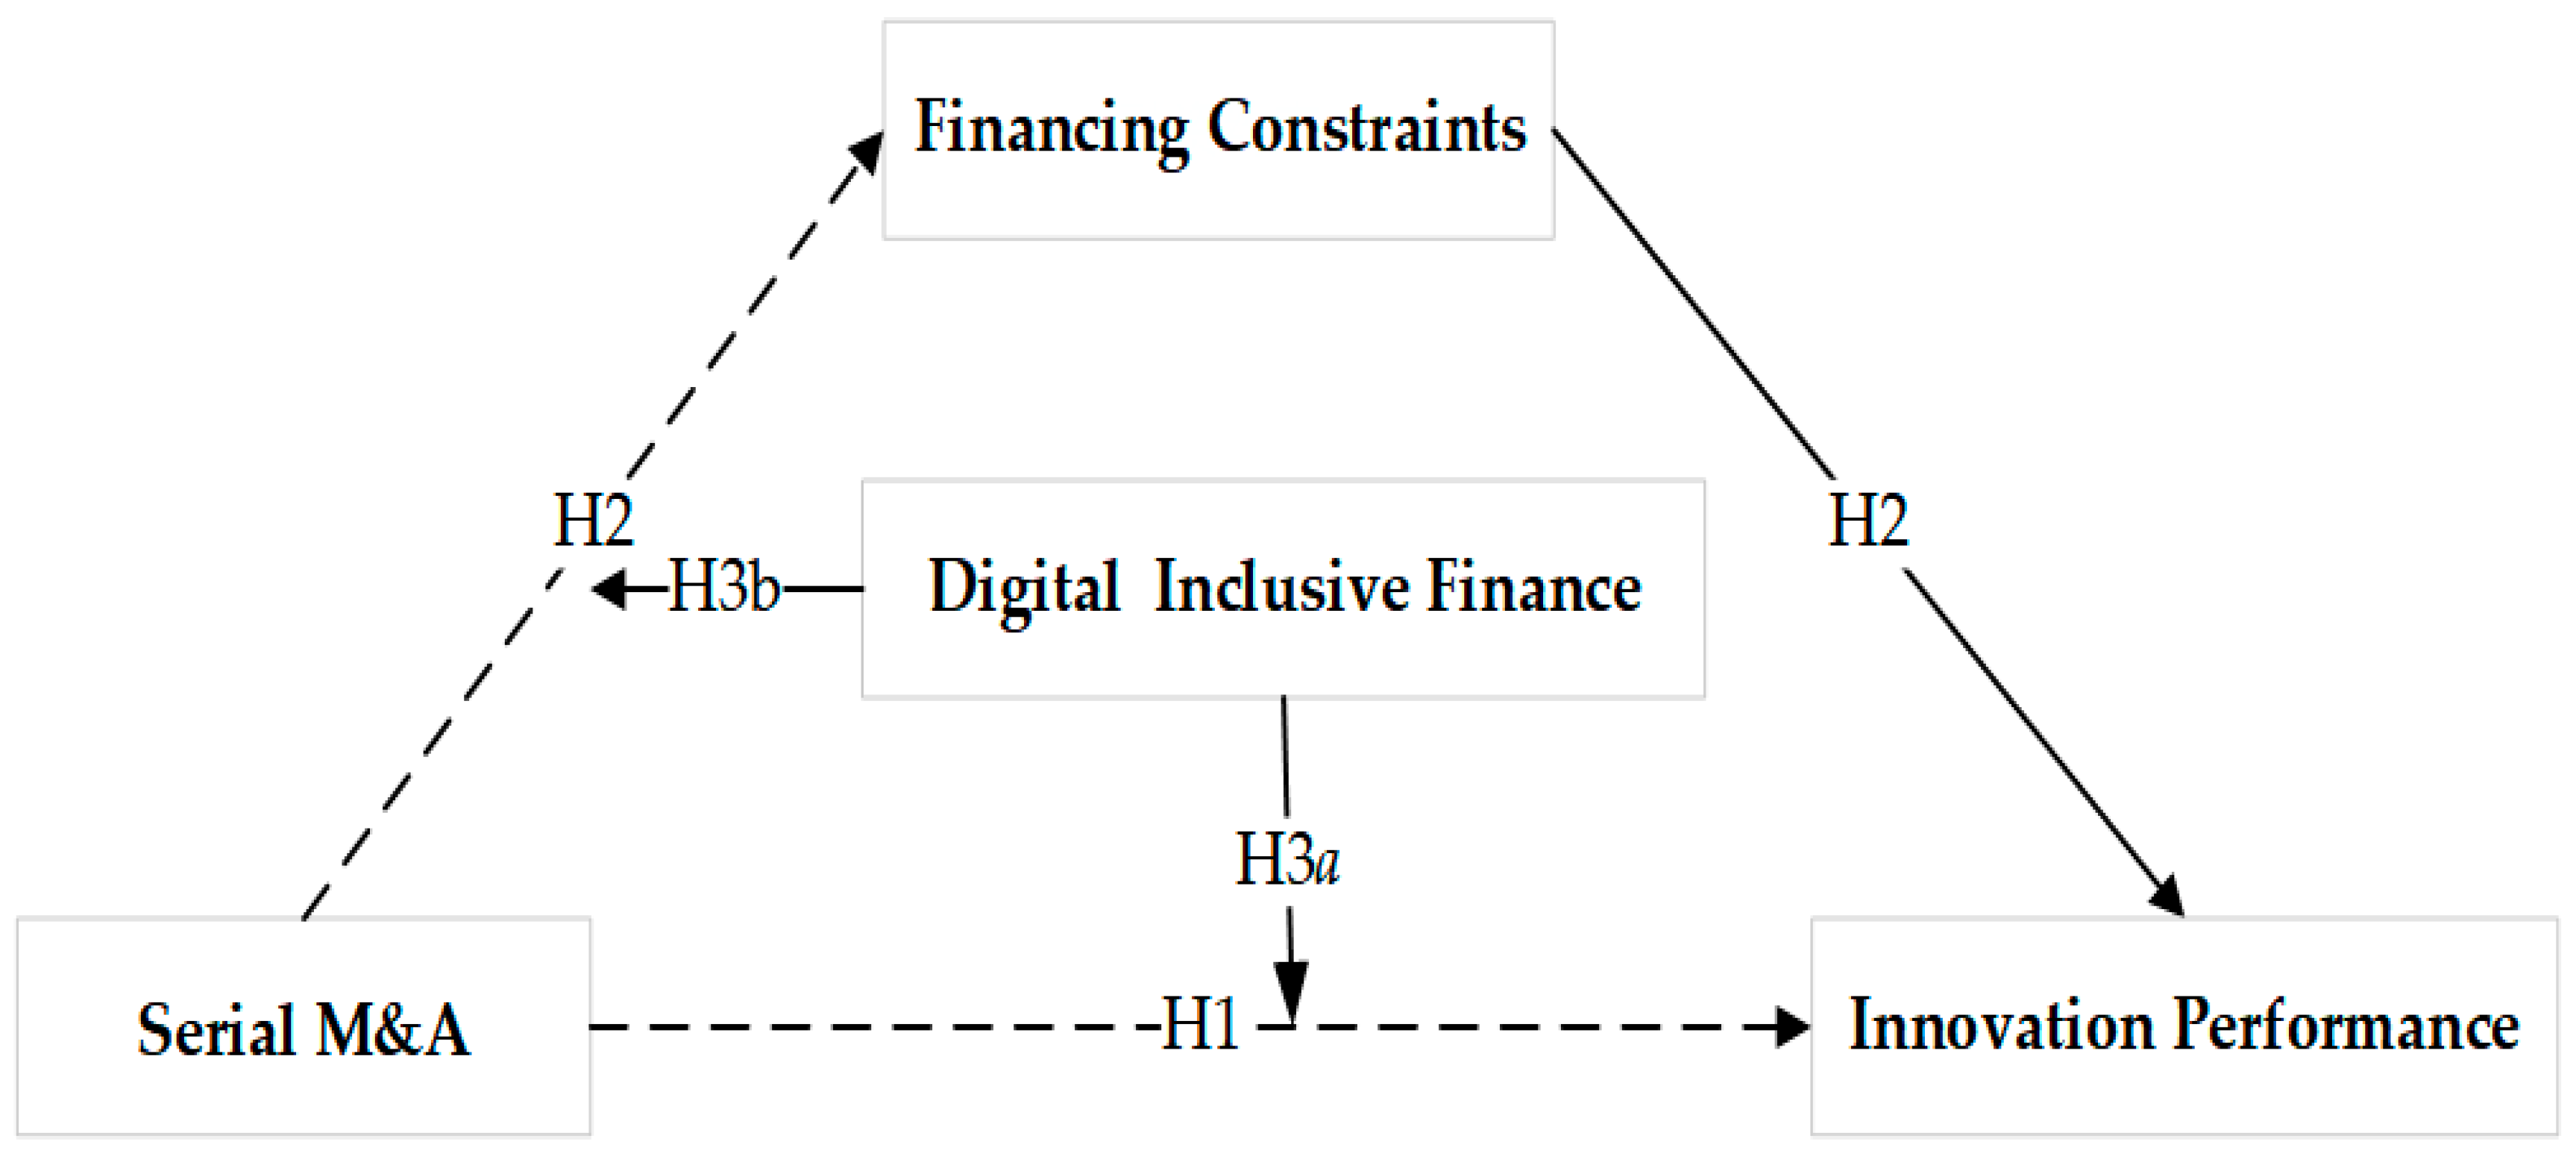
2. Theoretical Analysis and Research Hypothesis

2.1. Serial M&A and Corporate Innovation Performance

The TMGT effect is the phenomenon that there is a threshold for the positive effect of the positive antecedent variable on the expected outcome, beyond which the positive effect disappears and turns into a negative effect on the expected outcome [42,43,44,45,46]. It is used to explain the impact of serial M&A on innovation performance with the premise that serial M&A should be a positive antecedent variable of innovation performance. Therefore, this paper analyzes the positive effects of serial M&A on innovation performance theoretically from the perspectives of efficiency theory, resource complementarity theory, transaction cost theory, and knowledge transfer theory. These theoretical analyses aim to provide a basis for explaining the inverted U-shaped relationship between serial M&A and innovation performance.
According to efficiency theory, as the number of serial M&A increases, the specialty and integration efficiency of corporate M&A increases [47], and the ability to manage the relationship between M&A integration and autonomy is stronger [48] while duplicative innovation investment can be avoided [16], which is more helpful in releasing synergy potential and thus improving performance of innovation. From the theory of resource complementarity, the acquisition of multiple complementary resources is beneficial for improving innovation performance [49], and serial M&A facilitates firms in breaking through their own boundaries and increasing their access to multiple knowledge technologies through continuous exposure to varied resources [5,50,51], which lays the foundation for optimal resource allocation and facilitates the improvement of innovation performance. Under transaction cost theory, serial M&A can directly acquire technological resources which are not easily transferred between firms with a certain stickiness [52,53,54,55], avoiding the over-payment of transaction costs. The money saved by firms can be transferred to the increase of innovation investment, thus promoting innovation performance. According to knowledge transfer theory, firms cannot be good at all aspects of management and technology [56,57,58]. The serial M&A help firms expand their management and technical knowledge stock [59,60,61], and it is easier to promote breakthrough innovation through the sharing and learning of knowledge, technology, and other resources from both sides of the M&A, which avoids the inertness that results from reliance on inherent technology and knowledge [62,63,64].
However, based on the TMGT effect, if the serial M&A is excessive in order to promote innovation performance, then it may weaken the enhancement of innovation performance or may even appear to undermine it. Those factors which bring positive effects also have their own costs, and if they are over-invested or over-used, the positive effects they bring may gradually decrease while the costs may gradually increase, resulting in a negative outcome where the costs outweigh the benefits [42,65,66]. Hence, the relationship between serial M&A and the innovation performance is not simply linear, but rather an inverted U-shaped relationship with an increase followed by a decrease. First, as serial M&A increases, the organizational management costs of firms rise, which reduces the innovation effect from M&A [29,67] and even generates negative innovation performance. Second, serial M&A can promote innovation performance by acquiring multiple complementary resources, whereas the TMGT effect suggests that this seemingly monotonic positive relationship will reach a certain turning point, and as the resources such as knowledge brought by serial M&A gradually increase, resource overlap or resource redundancy may occur, and continued M&A can adversely affect innovation performance. Third, overly serial M&A behavior leads to higher costs of integrating and transferring resources, and insufficient identification, absorption, and adaptation capabilities, which also makes it hard for firms to effectively integrate multiple differentiated resources, thus gradually weakening the positive influence of serial M&A on innovation performance. Based on the above analysis, this paper concludes that the impact of serial M&A and innovation performance is nonlinear, and the relationship between the two shows an inverted U-shaped relationship that first increases and then decreases. Accordingly, Hypothesis 1 is proposed:
Hypothesis 1. 
There is an inverted U-shaped relationship between serial M&A and innovation performance.

2.2. The Mediation Mechanisms of Financing Constraints

As there are long R&D cycles, high risks, and high capital requirements for corporate innovation activities, they cannot be achieved solely by internal financing, and external financing remains an important channel to support corporate innovation [68,69,70]. However, there is information asymmetry between external investors and internal managers, and it is difficult for external investors who are at an informational disadvantage to judge the innovation value of the firm rationally. If there is limited external financing, firms will reduce their innovation investment [70], which in turn weakens their innovation performance. Nemlioglu and Mallick (2021) have shown that firms with strong management practice abilities can make effective use of innovation and achieve better performance through more financing channels [71]. Most studies show that M&A is a useful way of relieving corporate financing pressures [34]. The establishment of internal capital markets by firms through serial M&A to optimize capital allocation can help M&A firms to enhance the capital utilization efficiency and can also help M&A firms to obtain external financing [33], which consequently improves their innovation performance. Yet, as the amount of serial M&A has grown and the financing constraint problem has eased, principal-agent problems such as opportunistic motives, adverse selection, and moral hazard problems have begun to emerge [72], and managers tend to make more inefficient M&A for personal gain, which negatively affects innovation performance. With the increase of the number of serial M&A, the problem of information asymmetry between M&A firms and target firms, as well as the incompleteness and opacity of contracts, is becoming more and more common [73,74]. According to signaling theory, firms can deliver positive signals to the capital market by means of M&A to demonstrate corporate value [75], which in turn relieves the issue of corporate financing constraints in order to boost innovation performance. However, this signaling effect is time-dependent [76]. As serial M&A has increased, the positive effect of signaling has gradually diminished or even disappeared, external financing has become difficult, and the pressure of financing constraints has remained, which is not helpful to improve innovation performance. Hence, this paper argues that serial M&A of firms does not influence firms’ innovation performance directly, rather indirectly through financing constraints, which are a mediating variable in the nonlinear relationship between the serial M&A of firms and innovation performance. Accordingly, Hypothesis 2 is proposed:
Hypothesis 2. 
Finance constraints play a mediating role in the inverted U-Shaped relationship between serial M&A and innovation performance.

2.3. The Moderating Effect of DIF

The market environment of finance is one of the core factors for the technological innovation of firms, and an effective financial supply will impact the improvement of firms’ innovation performance directly [77]. The traditional financial system suffers from a certain degree of operational inefficiency and resource mismatch, and the financial mismatch can have a disincentive effect on innovation performance. DIF can, to a certain extent, correct the inefficient operation of traditional finance and the misallocation of resources, which helps companies to provide smooth external financing channels [78,79], and thus improve the financing efficiency of enterprises effectively. The improvement of financing efficiency, on the other hand, can relieve the financing constraint issue, raise the capital investment for enterprises’ innovation activities [80], and facilitate the enhancement of innovation performance. Therefore, when the level of DIF development is high, it has the potential to enhance the financing efficiency of the firms by alleviating financing constraints, which in turn strengthens the positive effect of serial M&A on innovation performance. Given that DIF can match information between different economic entities quickly [80] and has the advantage of correcting the stage mismatch, attribute mismatch, and domain mismatch of traditional finance [81], it can provide stable financial inputs for corporate innovation. Furthermore, it can still create incentives for innovation when serial M&A exceeds a critical point, which mitigates the negative effects of excessive serial M&A. In addition, for firms with excessive serial M&A, apart from paying huge transaction costs, they also face management costs, integration costs, agency costs, and resource redundancy, which all force them to cut innovation investment due to financing pressure. The development of DIF can relieve financing constraints effectively and weaken the negative impact of excessive serial M&A on innovation performance to some degree.
On this basis, Hypothesis 3 is proposed:
Hypothesis 3a. 
DIF plays a moderating role in the inverted U-shaped relationship between serial M&A and innovation performance.
Hypothesis 3b. 
DIF plays a moderating role between serial M&A and innovation performance indirectly by easing financing constraints.
In summary, the research framework of this paper is shown in Figure 1.

3. Data Selection, Model Design & Variable Definition

3.1. Data Selection

In the paper, we choose a total sample of companies listed in Chinese A-shares from 2010–2019 and define serial M&A according to the occurrence of three or more M&As in a ten-year period by referring to Schipper et al. [82]. The sample data were processed as follows: (1) exclude the failed or uncompleted M&A samples; (2) keep the sample events clean; retain only one sample with the largest value of M&A transaction if several M&As occurred in the same company on the same first M&A announcement date; (3) remove M&A transaction amounts less than 1 million yuan; (4) exclude the related transactions; (5) remove financial and insurance samples; (6) exclude ST samples; (7) exclude samples with missing relevant financial data; (8) exclude samples with less than three M&As. To mitigate the effect of outliers, all continuous variables were tailed down at the 1% level. After the screening as above, a total sample of 12,367 observations was finally obtained. The data related to M&A restructuring, corporate governance, corporate finance, and innovation utilized in this paper were obtained from the China Stock Market & Accounting Research Database (CSMAR), and the DIF index was obtained from the Digital Financial Inclusion Index of Peking University. Since the starting year of the DIF index data is 2011, this paper excludes the 2010 data when conducting the DIF index test, and the data processing is mainly performed with STATA14.0.

3.2. Model Design

(1)
According to Hypothesis 1, the non-linear relationship between serial M&A and innovation performance is tested, and the baseline model is set as follows:
P A T i , t = α 0 + α 1 S M A i , t + α 2 S M A i , t 2 + α 3 10 C o n t r o l i , t + I n d u s t r y + Y e a r + ε
where α 0 represents the constant term, α 1 10 represents the estimated coefficients of the variables, subscript i represents the firm, t represents the year, P A T i , t represents the innovation performance of the serial M&A firm i in year t, and S M A i , t represents the number of M&A that occurred in firm i in year t. C o n t r o l i , t represents the set of control variables, including enterprise size S i z e i , t , financial leverage L e v e r a g e i , t , operating income growth rate G r o w t h i , t , R&D investment intensity R D i , t , government subsidy S u b s i d y i , t , board size B o a r d i , t , shareholding concentration S h a r e c o n i , t , executive salary S a l a r y i , t , industry fixed effects I n d u s t r y , and annual fixed effects Y e a r . ε represents the random error term. The expected sign of the core variable serial M&A quadratic term S M A i , t 2 is negative and is used to examine the non-linear effect on firm innovation performance of the number of serial M&A. If Hypothesis 1 holds, then α 2 < 0 and is significant.
(2)
Based on Hypothesis 2, we examine how the financing constraint mediates the nonlinear relationship between serial M&A and innovation performance. Referring to Baron and Kenny (1986) [83], Zhang and Du (2023) [84], and based on model (1)—financing constraints—a mediating variable is introduced and the model is set as follows:
S A i , t = β 0 + β 1 S M A i , t + β 2 S M A i , t 2 + β i C o n t r o l i , t + I n d u s t r y + Y e a r + ε
P A T i , t = χ 0 + χ 1 S M A i , t + χ 2 S M A i , t 2 + χ 3 S A i , t + χ i C o n t r o l i , t + I n d u s t r y + Y e a r + ε
where β 0 and χ 0 represent the constant term; β 1 10 and χ 1 10 represent the estimated coefficient of the variables; and S A i , t represents the financing constraint of the serial M&A firm i in year t. To guarantee comparability, the control variables are in agreement with model (1). If the estimated coefficient β 2 of the serial M&A quadratic term S M A i , t 2 in model (2a) is significant, it indicates a nonlinear relationship between serial M&A and the financing constraint. If the estimated coefficient χ 3 of financing constraint S A i , t in model (2b) is significantly positive and the absolute value of the estimated coefficient χ 2 becomes smaller/bigger or less/more significant compared to the estimated coefficient α 2 of the quadratic term S M A i , t 2 of serial M&A in model (1), Hypothesis 2 is supported, which shows that financing constraints mediate in the relationship of serial M&A and performance of innovation.
(3)
Under Hypothesis 3, the moderating role of DIF development in the non-linear relationship between serial M&A and innovation performance, and its moderation of the mediating variable financing constraints was tested. Based on models (1), (2a), and (2b), the moderating variable DIF index is introduced and the model is set as follows:
P A T i , t = δ 0 + δ 1 S M A i , t × D I F i , t + δ 2 S M A i , t 2 × D I F i , t + δ 3 D I F i , t + δ i C o n t r o l i , t + I n d u s t r y + Y e a r + ε
S A i , t = ϕ 0 + ϕ 1 S M A i , t × D I F i , t + ϕ 2 S M A i , t 2 × D I F i , t + ϕ 3 D I F i , t + ϕ i C o n t r o l i , t + I n d u s t r y + Y e a r + ε
P A T i , t = γ 0 + γ 1 S M A i , t × D I F i , t + γ 2 S M A i , t 2 × D I F i , t + γ 3 D I F i , t + γ 4 S A i , t + γ i C o n t r o l i , t + I n d u s t r y + Y e a r + ε
where δ 0 , ϕ 0 and γ 0 represent the constant term; and δ 1 10 , φ 1 10 and γ 1 10 represent the estimated coefficients of the variables. If the estimated coefficient δ 2 of S M A i , t 2 × D I F i , t in model (3a) is negative and significant, Hypothesis 3a is supported, which indicates that the DIF index has a moderating effect in the inverted U-shaped relationship between serial M&A and innovation performance. If the estimated coefficient ϕ 2 of S M A i , t 2 × D I F i , t in model (3b) is significant, it indicates that the DIF index plays a moderating role in the nonlinear relationship between serial M&A and financing constraints. If the estimated coefficient γ 4 of the financing constraint S A i , t in model (3c) is significantly positive and the estimated coefficient γ 2 becomes smaller or less significant compared to the estimated coefficient δ 2 of S M A i , t 2 × D I F i , t in model (3a), it supports Hypothesis 3b, indicating that the moderating effect of the DIF index works indirectly via the financing constraint.

3.3. Variable Definition

(1)
Explained Variable: Innovation Performance ( P A T i , t ). The reasons for using the number of patent applications as the most direct indicator of a firm’s innovation performance are as follows. First, there is uncertainty between R&D investment and the conversion of technological achievements. Second, compared to the number of granted patents, the number of patent applications can more accurately reflect the level of innovation in a firm [85]. Referring to Wu, Yu, and Khan (2023) [60], Kutieshat and Farmanesh (2022) [86], Tang (2022) [87], and others, the total number of invention patents, utility models, and designs plus one is measured by logarithm.
(2)
Explanatory variable: serial M&A ( S M A i , t ). It is measured using the number of M&A that occurred in firm i in year t.
(3)
Moderating variable: Financing constraints ( S A i , t ). With reference to the method drawn from Hadlock et al. [77], the financing constraint is measured using the SA index, which is derived using two variables (firm size and firm age) that do not vary much over time and are highly exogenous, and is calculated as follows:
S A i , t = 0.737 × S i z e i , t + 0.043 × S i z e i , t 2 0.040 × A g e i , t
where S i z e i , t represents the natural logarithm of the total asset size of firm i in year t, and A g e i , t represents the year of firm i established in year t. S A i , t takes a negative value, and the larger the value, the higher the degree of financing constraints that a firm faces.
(4)
Mediator variable: Digital Inclusive Finance Index ( D I F i , t ). Digital inclusive finance, as an important tool for measuring the high-quality development of a country’s financial sector, aims to drive financial innovation through technological means. The sources of statistical data for the DIF are diverse. Among them, Peking University’s Digital Finance Research Center has utilized data from Ant Group (China’s largest digital finance company) to construct a set of DIF indicators that reflect the actual development of digital finance in China. This index has been widely referenced in studies analyzing the development of digital finance in China and carries a high level of authority. Referring to Lee, Lou, and Wang (2023) [88], Peng and Mao (2023) [89], and others, the Digital Inclusive Finance Index compiled by the Institute of Digital Finance, Peking University was used to measure the degree of DIF in 31 provincial tiers (autonomous regions and municipalities) in mainland China. Since the numerical financial index in the sample takes values in the range of 10 to 500, the natural logarithm of the DIF index plus one is used as a measure to eliminate the effect of the magnitude.
(5)
Control variable: This includes firm size, financial leverage, operating revenue growth rate, intensity of R&D investment, government subsidies, board size, shareholding concentration, and executive salary. Considering the effects of year and industry, they are under control in empirical studies. The specific variable descriptions are shown in Table A1 of Appendix A.

4. Empirical Analysis

4.1. Descriptive Statistics and Correlation Analysis

As can be seen from Table 1, the mean of the innovation performance (natural logarithm) of the sample is 1.014 (95.348) with a standard deviation of 1.949, which indicates that there is a certain variation in innovation performance among the sample firms. The mean of serial M&A is 1.242, indicating that there is an average of 1.242 acquisitions per year for M&A firms during the sample period with a standard deviation of 1.909, indicating that there is some variation in serial M&A among the sample firms. The mean value of financing constraints is −3.817 with a standard deviation of 0.274, indicating a small variation in financing constraints among the sample firms. The average value of DIF index (natural logarithm) is 4.838 (207.542), and the standard deviation is 1.593, which is less than the mean, indicating that the difference of DIF index among the sample firms is small.
According to the preliminary judgment of the research hypotheses based on the correlation analysis in Table 1, it is clear to note a significant positive relationship existed in serial M&A and corporate innovation performance, and Hypothesis 1 may be valid. Financing constraints are significantly positive related to corporate innovation performance and notably negative related to serial M&A, which suggests there are financing constraints easily arising from innovation activities, and serial M&A transactions can alleviate the financing constraints, so Hypothesis 2 may be valid. The DIF index is significantly positive relating to corporate innovation performance and serial M&A, but significantly negatively correlated with financing constraint, indicating that DIF can relieve the financing constraint problem and improve both corporate innovation performance and serial M&A. Hypothesis 3a and 3b may hold.

4.2. The Analysis of Empirical Results

4.2.1. Benchmark Analysis and the Mediating Effect of Financing Constraints

Table 2 presents how serial M&A relate to both corporate innovation performance and the mediating role of financing constraints in it. According to model (1), column (1) of Table 2 shows the results of controlling for both year and industry, and testing only for serial M&A on a firm’s performance of innovation. It can be noticed that the estimated coefficient of the quadratic term of serial M&A is −0.001, which is significantly negative at the 1% level, and that of the primary term is 0.039, which still shows an inverted U-shaped relationship between serial M&A and firm innovation performance. The results of testing for both year and industry and including control variables are presented in column (2) of Table 2. As seen, the estimated coefficient of the quadratic term of serial M&As is −0.001, that is significantly negative at the 1% level, and the estimated coefficient of the primary term is 0.025. This indicates that serial M&A show an inverted U-shaped relation to the innovation performance; that is, serial M&A have a non-linear effect on firm innovation performance by promoting and then inhibiting it. Hypothesis 1 is supported. Through the calculation of column 2, the inflection point of serial M&A is approximately around 12.5, indicating that before reaching 12.5 serial M&A transactions, the corporate innovation performance shows a gradual improvement. However, after surpassing 12.5 serial M&A transactions, as the number of serial M&A activities increases, the corporate innovation performance begins to decline.
Column (3) of Table 2 shows the test results of model (2b), which shows that the estimated coefficient of the quadratic term for serial M&A is 0.0005, which is significantly positive at the 1% level, and the estimated coefficient of the primary term is −0.005, which is significantly negative at the 1% level. This reveals a U-shaped relationship between serial M&A and corporate financing constraints. After calculation, the inflection point of serial M&A is five times, and the serial M&A can effectively alleviate the corporate financing constraint before the inflection point. However, continuing M&A after the inflection point of serial M&A will aggravate the financing constraint issue.
From column (4) of Table 2, we can find that the estimated coefficient of financing constraint is 0.725, which is significantly positive at the 1% level. Compared to column (2), the absolute value of the estimated coefficient of the quadratic term of serial M&A becomes bigger (|−0.002| > |−0.001|), and the significant of the one term of serial M&A becomes larger (0.025 * < 0.028 **). The mediating effect of financing constraints = −0.005 × 0.725 = −0.003625, and accounts for 14.5% of the total effect (0.025). This means that financing constraints play a partly mediating role in the inverted U-shaped relationship between serial M&A and firm innovation performance, which supports Hypothesis 2. The absolute value of the estimated coefficient of the quadratic term becomes larger under the mediating role of financing constraints, indicating that the inverted U-shaped relationship between serial M&A and innovation performance is steeper when there is a serious financing constraint issue, and financing constraints act as a negative mediating variable in their relationship.

4.2.2. U-Test and the Application of Schumpeterian Theory of Innovation

According to Schumpeter’s (1942) [90] creative destructive theory, the inverted U-shaped relationship of enterprise innovation is due to new innovation destroying or replacing previous innovation. The inverted U-shaped results of Nemlioglu and Mallick (2017) [91] have also supported Schumpeter’s theory of creative destruction. Previous studies have shown the inverted U-shaped relationship between serial M&A activities and innovation performance in firms. This study proposes that the impact of serial M&A on innovation can be divided into two stages. In the first stage, as the number of serial M&A activities increases, it helps firms to integrate and acquire differentiated organizational management, technology, and resources from target firms, thereby promoting the accumulation of innovation. In the second stage, as the number of serial M&A activities continues to increase, the incremental innovation value brought by serial M&A gradually diminishes. In Table 3, the U-test is conducted on the main explanatory variable S M A i , t from Table 2. The results indicate that the extreme point of S M A i , t is 12.076, and the S M A i , t ranges from 0 to 40. It is observed that the extreme point falls within the data range and the null hypothesis can be rejected at a 1% significance level. Moreover, the slope in the results is negative within the interval, indicating the inverted U-shaped relationship.

4.2.3. The Moderating Effect of DIF

As noted in column (1) of Table 4, the estimated coefficient of D I F i , t is 0.512, which is significantly positive at the 1% level, indicating that the DIF has a remarkable contribution to the corporate innovation performance. The estimated coefficient of the interaction term S M A i , t × D I F i , t between the primary term of serial M&A and the DIF is 0.005, which is significantly positive at the 10% level, and the estimated coefficient of the interaction term S M A i , t 2 × D I F i , t between the quadratic term of serial M&A and the DIF is −0.00028, which is significantly negative at the 1% level, indicating that the DIF is a positive moderating variable of the inverted U-shaped relationship between serial M&A and corporate innovation performance. H3a is supported. In column (1), the estimated coefficient for DIF is 0.512, which means that for every increase of one standard deviation in the digital financial index, the innovation performance will increase by 12.42% (0.512 × 1.593 ÷ 1.949). The sample was divided into a lower and a higher DIF group based on the median DIF of the region where the serial M&A firms were located. The relationship between serial M&A and innovation performance was further tested in groups, and the outcomes are shown in columns (4) to (9). In the lower group of DIF in column (4), the estimated coefficient of quadratic term S M A i , t 2 for serial M&A is −0.0016, which is significantly negative at the 10% level. In the higher group of DIF in column (7), the estimated coefficient of quadratic term S M A i , t 2 for serial M&A is −0.0013, which is significantly negative at the 5% level. The estimated coefficient S M A i , t 2 in column (7) has a smaller absolute value (wider U-shaped opening) and increased significantly compared to column (4), implying that a higher DIF index positively moderates the inverted U-shaped relationship between serial M&A and corporate innovation performance. Once again, Hypothesis 3a is supported.
As noted in column (2) of Table 4, the estimated coefficient of the interaction term S M A i , t 2 × D I F i , t between the quadratic term of the serial M&A and the DIF index is 0.0001, which is significantly positive at the 1% level, whereas the estimated coefficient of the interaction term S M A i , t × D I F i , t of the primary term of the serial M&A and the DIF index is −0.001, which is significantly negative at the 1% level, suggesting that the DIF index adversely moderates the U-shaped relationship between the serial M&A and corporate financing constraints. From column (3), it can be noted that the estimated coefficient of financing constraints is 0.719, which is significantly positive at the 1% level, and the estimated coefficient of S M A i , t 2 × D I F i , t becomes smaller compared to column (1), indicating that DIF development indirectly moderates the inverted U-shaped relationship between serial M&A and firm innovation performance through the mediating variable financing constraints. Hypothesis 3b is favored.
In columns (5) and (8), the estimated coefficients of the quadratic term S M A i , t 2 for serial M&A are 0.0005 and 0.004, respectively, which are significantly positive at the 1% level. It demonstrates that DIF adversely moderates the U-shaped relationship between serial M&A and financing constraints. From columns (6) and (9), we can see that the estimated coefficients of financing constraints are 0.599 and 0.808, respectively, which are significantly positive at the 1% level. Looking at the estimated coefficients of the quadratic term S M A i , t 2 for serial M&A reveals that column (6) becomes smaller compared to column (4), and column (9) becomes smaller compared to column (7). It presents that the mediating role played by financing constraints is effective under the effect of different levels of DIF. Comparing the estimated coefficients of S M A i , t 2 in columns (6) and (9), the absolute value is smaller and more significant in column (9), which suggests that DIF plays a moderating role among the relationship of financing constraints, serial M&A, and corporate innovation performance. Hypothesis 3b is supported. According to columns (4)–(6), when the DIF index is low, the total effect of financial constraints on the relationship between serial M&A and innovation performance is approximately −17.97% (= −0.009 × 0.599 ÷ 0.030). According to columns (7)–(9), when the DIF index is high, the total effect of financial constraints on the relationship between serial M&A and innovation performance is −11.54% (= −0.003 × 0.808 ÷ 0.021). It can be observed that as the DIF index decreases, the negative mediating effect of financial constraints becomes more pronounced.

4.3. Heterogeneity Analysis

4.3.1. Ownership Property Heterogeneity

Ownership property is an important characteristic for corporate M&A and innovation. The impact of serial M&A undertaken by firms with different natures of ownership on firm innovation performance may also differ due to significant differences in the government intervention and policy burdens they bear. Although state-owned enterprises are more easily able to obtain funding and financial support for their innovations, the serial M&A behavior of state-owned enterprises is more likely to be constrained by political identity. In contrast, the serial M&A behavior of non-state enterprises faces less policy pressure, while their innovation is more vulnerable to financing constraints. This paper examines the relationship between serial M&A and both innovation performance and the mediating role of financing constraints, respectively, by dividing the sample into two subsamples: the state-owned enterprises (SOE) group and the non-state-owned enterprises group. The results of the test are shown in Table 5, and the estimated coefficient S M A i , t 2 in column (1) is −0.002, which is not significant. In the group of non-state owned enterprises, the estimated coefficient S M A i , t 2 in column (4) is −0.0019, which is significantly negative at the 1% level, the estimated coefficient S M A i , t 2 in column (5) is 0.001, which is significantly positive at the 1% level, the estimated coefficient S A i , t in column (6) is 0.770, which is significantly positive at the 1% level, and the estimated coefficient S M A i , t 2 in column (6) is −0.0023, which is smaller than that in (4). As can be seen, compared to state-owned enterprises, serial M&As of non-state-owned enterprises have an inverted U-shaped relationship with innovation performance, with financing constraints playing a partially mediating role in the relationship. The intrinsic logic of serial M&A strategies varies for firms with different ownership structures. In comparison, state-owned enterprises need to take social responsibilities, such as maintaining economic market order, safeguarding employment, and improving people’s livelihoods. Their innovation behavior is more susceptible to government influence. Therefore, the impact of serial M&A and financial constraints on the innovation performance of non-state-owned enterprises may be stronger. Compared to non-state-owned enterprises, SOEs are more likely to obtain government subsidies and bank loans. Thus, the effects of serial M&A and financial constraints on the innovation performance of SOEs are not significant. For non-state-owned enterprises, reasonable serial M&A can effectively alleviate financial constraints and help them obtain financial support for research and development (R&D). Therefore, the intermediary role of serial M&A and financial constraints may be more significant for non-state-owned enterprises.

4.3.2. Business Environment Heterogeneity

A good business environment is a pre-condition to improve a firm’s innovation performance. According to the China Sub-Provincial Enterprise Business Environment Index Report 2017, the enterprise business environment is measured through the Enterprise Business Environment Index. This paper tests the relationship between serial M&A and both innovation performance and the mediating role of financing constraints by dividing the sample into higher and lower groups of business environment index based on whether the business environment index is above the median. The outcomes are displayed in Table 6. The estimated coefficient S M A i , t 2 in column (1) is −0.0016, which is significantly negative at the 1% level; the estimated coefficient S M A i , t 2 in column (2) is 0.0004, which is significantly positive at the 1% level; the estimated coefficient S A i , t in column (3) is 0.772, which is significantly positive at the 1% level; and the estimated coefficient S M A i , t 2 in column (3) is −0.002, which is smaller than the estimated coefficient S M A i , t 2 of (1). While in the lower business environment index group, the estimated coefficient S M A i , t 2 in column (4) is −0.002, which is not significant. As can be seen, compared to the lower business environment index, an inverted U-shaped relationship exists in serial M&A and innovation performance for firms in regions with a higher business environment index, and financing constraints play a partially mediating role in their relationship. When the business environment index of the region where the serial M&A firm is located is low, it means that the firm faces greater uncertainty, and this affects their motivation to choose serial M&A channels to obtain technological or synergistic effects. At the same time, it also indicates that the company faces more unstable financial constraints. Therefore, for firms in regions with a low business environment index, the relationship among serial M&A, financial constraints, and innovation performance is not significant.

4.3.3. Firm Size Heterogeneity

Firm size is a fundamental characteristic variable of companies. Dang, Li, and Yang (2018) have found that even small differences in firm size can have a significant impact on the explanatory and dependent variables in the model [92]. Although serial M&A can help companies achieve synergies and economies of scale, the sensitivity of economies of scale to different firm sizes has been noted by Smyth, Boyes, and Pesau (1975) [93]. Given the criticality of the firm size indicator, in order to avoid selective bias in the test results, the firm size is divided into three groups: low, medium, and high, based on the 25th and 75th percentiles. The test results are shown in Table 7. The results in column (1) of Table 7 indicate that the inverted U-shaped impact between serial M&A and innovation performance is not significant when the firm size is low. Column (4) shows that when the firm size is medium, there is a significant inverted U-shaped relationship between serial M&A and innovation performance (the estimated coefficient of S M A i , t 2 is −0.002 and significant at the 1% level). In columns (5) and (6), the estimated coefficients for S M A i , t 2 are 0.001 and −0.002, and the estimated coefficient for S A i , t is 0.690, which are all significant at the 1% level. These results indicate that financing constraints play a negative mediating role in the relationship between serial M&A and innovation performance. The results in column (7) of Table 7 show that when the firm size is high, the inverted U-shaped relationship between serial M&A and innovation performance is significant at the 5% level. Column (7) also shows a significant negative linear relationship between serial M&A and financing constraints. This differs from the non-linear relationship in column (5). In column (9), the estimated coefficient for S A i , t is 1.107, significant at the 1% level. It can be seen that when the firm size is high, serial M&A still has an inverted U-shaped impact on innovation performance through financing constraints, but the mediating effect is through a linear path compared to the medium-sized firm model.

5. Robustness Tests

In order to guarantee the reliability of the previous results, this paper uses various methods such as variable models, replacement variables, reduced samples, lag one-period, instrumental variables, and bootstrap tests for robustness testing.

5.1. Tobit Model Test

From the descriptive statistical analysis, it is observed that the lower bound of the sample observations of innovation performance is 0, that is, the explanatory variables belong to the censored data with the left side limited point of 0. In order to minimize the estimation bias due to the regression method, the Tobit model is used in this paper to re-test the baseline model in the previous paper, and the results are shown in columns (1) to (2) of Table 8. In the table, the log-likelihood value is a measure of how well the model fits the data, indicating the fit of the model to the data given the estimated parameters. In the presence of control variables, the log-likelihood values in columns (1) and (2) are −13,831.55 and −13,326.785, respectively. Higher negative values typically indicate a better fit of the model to the data. The left intercept number is 9329, which means that the lower bound of the innovation performance of companies is set at 9329. LR Chi2 is a statistic used to test the overall fit of the model, and higher LR Chi2 values indicate a better fit of the Tobit model compared to the null model (without any independent variables). In columns (1) and (2), the LR Chi2 values are 31.30 and 1040.83 ***, respectively, indicating that the Tobit model has some explanatory power in explaining the innovation performance of companies compared to the null model. Column (1) of Table 8 shows the estimated coefficient S M A i , t 2 of −0.017, which is significantly negative at the 1% level, and the estimated coefficient S M A i , t of 0.317 when the Tobit model is used to test the baseline model without considering the control variables. Column (2) shows the results of the test with the control variables added, which shows that the estimated coefficient S M A i , t 2 of −0.013 is significantly negative at the 1% level with an estimated coefficient S M A i , t of 0.145, indicating an inverted U-shaped relationship between serial M&A and the innovation performance. The test results are in line with the previous paper.

5.2. Substitution of Variables

Considering the importance of granted innovation, invention patents as a measure of innovation performance can effectively reflect corporate innovation performance. For the purpose of avoiding bias due to the definition of variables, the number of ‘invention patents’ is used to replace the total number of invention patents, utility models, and designs in the previous section to measure firms’ innovation performance, and the outcomes are presented in columns (3) and (4) in Table 8. It is observed that the estimated coefficients S M A i , t 2 are −0.002 and −0.001, respectively, which are significantly negative at the 1% level, and the estimated coefficients S M A i , t are 0.044 and 0.016, respectively, which are significantly positive at the 1% level. The test results are in agreement with the earlier paper.

5.3. Narrowing down the Sample Test

Since the sample selected for this paper is listed firms with three or more M&A occurrences during 2010–2019, considering that innovation performance may be based on the impact of higher frequency serial M&A, the definition of serial M&A under this paper may be biased to the results. We further exclude the samples with less than 5 M&As, and have a narrowed sample of 10,253 observations. The results are shown in columns (5) to (6) of Table 8. As can be seen, the estimated coefficients S M A i , t 2 are −0.001 and −0.002, respectively, which are significantly negative at the 1% level, and the estimated coefficients S M A i , t are 0.045 and 0.030, respectively, which are significantly positive at the 1% level. The test results are in line with the previous paper. Furthermore, the relationship between serial M&A and innovation performance are examined using sample data from the COVID-19 period (2020–2021), as shown in columns (7) and (8) of Table 8. It can be observed that with the use of post-pandemic samples, the inverted U-shaped relationship between serial M&A and innovation performance is not significant. Instead, it exhibits a significant positive linear relationship at the 10% level. There may be several reasons for this result. First, the influence of serial M&A on innovation performance may be linear or nonlinear, depending on the external environment. Second, serial M&A will continue to have an inverted U-shaped impact on innovation performance after the COVID-19 pandemic, but we only have two years of available data at present. Further in-depth analysis is needed to determine the specific reasons for these findings in the future.

5.4. Endogeneity Test

The endogeneity problem can lead to bias in the results of basic regression analyses. Serial M&A and innovation performance may occur simultaneously driven by the fundamental characteristics of firms, thereby resulting in endogeneity problems caused by bidirectional causality. Specifically, on the one hand, serial M&A may indirectly influence innovation performance through financial constraints. On the other hand, firms with higher levels of innovation performance may alleviate their financial constraints, leading them to be more inclined to pursue serial M&A. Therefore, there may exist a bidirectional causal relationship between serial M&A and innovation performance. In columns (1) to (3) of Table 9, the explanatory variables are regressed with a one-period lagged regression, and the results are consistent with the previous analysis, which can partially alleviate the endogeneity problem. However, for robustness, assuming that serial M&A is an endogenous explanatory variable, one-period lag is used as an instrumental variable, and the model is subjected to GMM regression tests as shown in columns (4) to (6). By comparing the results of the GMM regression with the results of the basic regression, it is found that there is a significant inverted U-shaped relationship between serial M&A and innovation performance, and the mediating effect of financial constraints is effective. This further confirms the reliability and robustness of the conclusions of this study.

5.5. Bootstrap Test

To ensure the validity of the research findings, this paper uses the bootstrap method to conduct a robustness test on the mediating effect of financing constraints by repeating it 1000 times, and if the upper and lower limits of the 95% confidence interval do not include 0, then it is proven that financing constraints are effective mediating variables. Table 10 displays the outcomes of the bootstrap analysis of the mediating effect of financing constraints. The results indicate that the mediating effect of serial M&A through financing constraints on corporate innovation performance is −0.006 and does not contain 0 at the percentile bootstrap confidence interval (P) and deviation-corrected bootstrap confidence interval (BC), which means that there is a valid mediating effect. The previous hypothesis was further tested.

6. Conclusions and Discussion

6.1. New Findings and Conclusions

To address the impact of serial M&A on corporate innovation performance, this paper explores the mechanism of financing constraints on the relationship between the two, and investigates how the level of DIF development affects the relationship. Using data on M&A transactions of Chinese listed companies from 2010–2019, this paper empirically examines the existence of an inverted U-shaped effect between serial M&A and innovation performance, and further analyzes the role played by financing constraints and DIF in their relationship. The main findings of this paper are as follows:
First, serial M&A has an inverted U-shaped effect on the innovation performance through financing constraints. Theoretical analysis shows that serial M&A can enhance innovation performance through the pathways of efficiency improvement, resource complementarity, transaction cost reduction, and knowledge transfer, but excessive serial M&A can harm innovation performance due to the TMGT effect. The empirical results of this paper demonstrate that the inverted U-shaped relationship exists in serial M&A and innovation performance, which rises first and then falls. Serial M&A can effectively alleviate the financing constraints by establishing internal capital markets and releasing positive signals, thus promoting innovation performance. However, as the number of serial M&A increases, agency problems emerge, the transmission of positive signaling effects diminishes, and firms face increased financing constraint pressures, which in turn inhibits innovation performance. The empirical findings indicate that financing constraints play a mediating role in the inverted U-shaped relationship between serial M&A and innovation performance.
Second, DIF plays a moderating role in the relationship among serial M&A, financing constraints, and innovation performance. DIF can effectively secure the supply of funds for serial M&A firms, which helps to promote innovation performance and can delay the negative effect of serial M&A on innovation performance. In this paper, the empirical results show that DIF plays a moderating role in the inverted U-shaped relationship between serial M&A and innovation performance. DIF can effectively alleviate the financing constraints faced by firms, and the development of DIF in regions where serial M&A firms are located indirectly affects innovation performance by influencing financing constraints. Additionally, the DIF index plays a moderating role in the inverted U-shaped relationship in which serial M&A affects innovation performance via financing constraints.
Third, the ownership property, business environment, and firm size play a key role in the relationship among serial M&A, financing constraints, and innovation performance. The heterogeneity analysis of ownership property and business environment can further clarify the complex mechanism in which serial M&A indirectly affects the process of innovation performance through financing constraints. Based on the empirical results, serial M&A of SOEs have little non-linear effect on innovation performance, while serial M&A of non-state-owned enterprises have an inverted U-shaped effect on innovation performance, with financing constraints playing a mediating role in the relationship between them. The non-linear effect of serial M&A on innovation performance is not significant for firms located in regions with a low business environment index, whereas when the business environment index is high, serial M&As have an inverted U-shaped effect on innovation performance, and this effect acts indirectly through mediating variable financing constraints. The impact of serial M&A on innovation performance is not significant for small-scale enterprises, while for medium and large-scale enterprises, the serial M&A has an indirect inverted U-shaped effect on innovation performance through the mediation of financing constraints. However, the relationship between financing constraints and serial M&A differs for medium-scale and large-scale enterprises. Specifically, the relationship between serial M&A and financing constraints is linear for medium-scale enterprises, while it is linear for high-scale enterprises.

6.2. Managerial Implication and Contribution to Practice

The above findings have important managerial and practical implications with the following implications. First, serial M&A is important for innovation performance, but excessive serial M&A can have negative effects. While firms should take advantage of the positive impact of serial M&A on innovation performance, they should also consider the possibility that too-frequent serial M&A may have a TMGT effect. As a result, it is important for firms to control the degree of serial M&A in order to achieve optimal results. For government regulators, it helps to improve relevant policies to guide serial M&A positively while avoiding the adverse effects of excessive serial M&A in order to better promote sustainable corporate innovation.
Second, firms should take full advantage of the role played by financing constraints and DIF in the relationship between serial M&A and innovation performance. Given that serial M&A has a non-linear impact on innovation performance via financing constraints indirectly, DIF can alleviate the problem of corporate financing constraints and strengthen the impact of serial M&A on corporate innovation performance. Furthermore, corporate managers should use serial M&A to keep financing constraints within reasonable limits, and at the same time, take full benefit of the positive impact of DIF on corporate innovation performance. As for the government, it should introduce policies to guide and promote the development of DIF in order to alleviate the problem of corporate financing constraints and improve corporate innovation performance.
Third, government regulators should pay attention to the differences in the impact of serial M&A on the innovation performance of firms with different ownership property and business environments. In the meantime, targeted policies should be formulated for serial M&A firms in different ownership property and business environments, so as to guide and monitor the frequency of serial M&A in a reasonable manner and drive serial M&A firms to improve their innovation performance.

6.3. Limitation and Further Development

There are still some limitations in the study of this paper. As the intensity of corporate innovation investment changes, the impact of serial M&A on corporate innovation performance will also change. It is necessary for future research to explore more about the relationship regarding the innovation investment of serial M&A indirectly affecting innovation performance through financing constraints. Furthermore, the inclusion or exclusion of government subsidies, particularly R&D subsidies, also influences the mechanism behind the nonlinear relationship between serial M&A and innovation performance. It is essential for future research to delve deeper into investigate the impact of government subsidies on the innovation performance of firms engaged in serial M&A.

Author Contributions

Conceptualization, X.Z.; methodology, X.Z., Y.S. and H.L.; software, X.Z.; validation, X.Z., Y.S. and H.L.; formal analysis, X.Z. and Y.S.; investigation, X.Z., Y.S. and H.L.; resources, X.Z., Y.S. and H.L.; data curation, X.Z. and Y.S.; writing—original draft preparation, X.Z. and Y.S.; writing—review and editing, X.Z. and Y.S.; visualization, X.Z. and Y.S.; supervision, H.L. and Y.S.; project administration, X.Z. and H.L.; funding acquisition, X.Z. All authors have read and agreed to the published version of the manuscript.

Funding

This work was supported by Social Science Foundation of Liaoning Province (CN) [grant number L22BGL031] and the Basic Scientific Research Project of the Educational Department of Liaoning Province (CN) [grant number LJKQR20222553].

Institutional Review Board Statement

Not applicable.

Informed Consent Statement

Not applicable.

Data Availability Statement

Data are available from authors upon reasonable request.

Conflicts of Interest

The authors declare no conflict of interest.

Appendix A

Table A1. Variable definitions.
TypeNameSymbolDescription
Dependent variableInnovation Performance P A T i , t the natural logarithm of the total number of inventions, utility models, and designs plus one
Independent variableSerial M&A S M A i , t represents the number of M&A that occurred in firm i in year t
Mediator variableFinancing Constraint S A i , t refer to Model (4)
Moderating variableDigital Inclusive Finance D I F i , t the natural logarithm of the digital financial index plus one
Control variableFirm Size S i z e i , t the natural logarithm of the total asset size of firm i in year t
Financial Leverage L e v e r a g e i , t total liabilities divided by total assets
Operating Revenue Growth Rate G r o w t h i , t operating income growth divided by total operating income in the previous year
R&D Investment Intensity R D i , t R&D expenditure divided by operating income
Government Subsidy S u b s i d y i , t the natural logarithm of the total amount of government grants plus one
CEO Duality D u a l i , t if the Chairman and CEO are the same person, it equals 1, otherwise it equals 0.
Board Size B o a r d i , t total number of directors on board
Shareholding Concentration S h a r e c o n i , t percentage of shares held by the largest shareholder
Executive Salary S a l a r y i , t the natural logarithm of executive salary plus one

References

  1. González-Torres, T.; Rodríguez-Sánchez, J.-L.; Pelechano-Barahona, E.; García-Muiña, F.E. A systematic review of research on sustainability in mergers and acquisitions. Sustainability 2020, 12, 513. [Google Scholar] [CrossRef] [Green Version]
  2. Junni, P.; Teerikangas, S. Mergers and acquisitions. In Oxford Research Encyclopedia of Business and Management; Oxford University Press: Oxford, UK, 2019. [Google Scholar]
  3. David, J.M. The aggregate implications of mergers and acquisitions. Rev. Econ. Stud. 2021, 88, 1796–1830. [Google Scholar] [CrossRef]
  4. Li, Q.; Guo, J.-J.; Liu, W.; Yue, X.-G.; Duarte, N.; Pereira, C. How knowledge acquisition diversity affects innovation performance during the technological catch-up in emerging economies: A moderated inverse u-shape relationship. Sustainability 2020, 12, 945. [Google Scholar] [CrossRef] [Green Version]
  5. Zhang, X.; Yao, H.; Du, X. The Peer Effect of Serial Mergers and Acquisitions and the Internal Control of Enterprises. J. Northeast. Univ. Soc. Sci. 2021, 23, 22. [Google Scholar]
  6. Mingwei, Z.; Jiachun, Y.; Yuju, L.; Yitao, M. A Study of M&A Performance Based on Enterprise Capability Measurement Model: Taking Shanghai RAAS Serial M&A in 2014 as an Example. In Proceedings of the 2020 16th Dahe Fortune China Forum and Chinese High-educational Management Annual Academic Conference (DFHMC), Zhengzhou, China, 4–6 December 2020; pp. 189–193. [Google Scholar]
  7. Tanna, S.; Yousef, I. Mergers and acquisitions: Implications for acquirers’ market risk. Manag. Financ. 2019, 45, 545–562. [Google Scholar] [CrossRef]
  8. Golubov, A.; Yawson, A.; Zhang, H. Extraordinary acquirers. J. Financ. Econ. 2015, 116, 314–330. [Google Scholar] [CrossRef] [Green Version]
  9. Xu, W.; Gao, X.; Li, D.; Zhuang, M.; Yang, S. Serial acquirers and stock price crash risk: International evidence. J. Int. Financ. Mark. Inst. Money 2022, 78, 101538. [Google Scholar] [CrossRef]
  10. Hossain, M.M.; Pham, M.D.M.; Islam, N. The performance and motivation of serial acquisitions: Evidence from Australia. Int. Rev. Financ. Anal. 2021, 77, 101827. [Google Scholar] [CrossRef]
  11. Papa, A.; Dezi, L.; Gregori, G.L.; Mueller, J.; Miglietta, N. Improving innovation performance through knowledge acquisition: The moderating role of employee retention and human resource management practices. J. Knowl. Manag. 2020, 24, 589–605. [Google Scholar] [CrossRef]
  12. Awan, U.; Arnold, M.G.; Gölgeci, I. Enhancing green product and process innovation: Towards an integrative framework of knowledge acquisition and environmental investment. Bus. Strategy Environ. 2021, 30, 1283–1295. [Google Scholar] [CrossRef]
  13. Cappa, F.; Collevecchio, F.; Oriani, R.; Peruffo, E. Banks responding to the digital surge through Open Innovation: Stock market performance effects of M&As with fintech firms. J. Econ. Bus. 2022, 121, 106079. [Google Scholar]
  14. Lee, Y.J.; Shin, K.; Kim, E. The influence of a firm’s capability and dyadic relationship of the knowledge base on ambidextrous innovation in biopharmaceutical M&As. Sustainability 2019, 11, 4920. [Google Scholar]
  15. Li, J.; Wu, X. Technology-driven cross-border M&A, CSR, and enterprise innovation performance—Evidence from China. Sustainability 2022, 14, 4169. [Google Scholar]
  16. Denicolò, V.; Polo, M. Duplicative research, mergers and innovation. Econ. Lett. 2018, 166, 56–59. [Google Scholar] [CrossRef]
  17. Rhodes-Kropf, M.; Robinson, D.T. The market for mergers and the boundaries of the firm. J. Financ. 2008, 63, 1169–1211. [Google Scholar] [CrossRef]
  18. Makri, M.; Hitt, M.A.; Lane, P.J. Complementary technologies, knowledge relatedness, and invention outcomes in high technology mergers and acquisitions. Strateg. Manag. J. 2010, 31, 602–628. [Google Scholar] [CrossRef]
  19. Chen, F.; Meng, Q.; Li, X. Cross-border post-merger integration and technology innovation: A resource-based view. Econ. Model. 2018, 68, 229–238. [Google Scholar] [CrossRef]
  20. Ning, Y.; Ju, Y.; Wang, S.-S. The Impact of Technological Relevance on Innovation Performance in Overseas M&A—An Empirical Study Based on Technology Sourcing Overseas M&A. J. Northeast. Univ. Soc. Sci. 2020, 22, 42. [Google Scholar]
  21. Sarala, R.M.; Vaara, E. Cultural differences, convergence, and crossvergence as explanations of knowledge transfer in international acquisitions. J. Int. Bus. Stud. 2010, 41, 1365–1390. [Google Scholar] [CrossRef]
  22. Xiao, H.; Shi, Y.; Yang, T. The Impacts Of Board Faultlines On Innovation Performance In Cross-Border Mergers and Acquisitions. Int. J. Innov. Manag. 2023, 26, 2250073. [Google Scholar] [CrossRef]
  23. Buckley, P.J.; Buckley, P.J.; Cross, A.; Tan, H.; Liu, X.; Voss, H. Historic and emergent trends in Chinese outward direct investment. In Foreign Direct Investment, China and the World Economy; Palgrave Macmillan: London, UK, 2010; pp. 119–162. [Google Scholar]
  24. Bae, Y.; Lee, K.; Roh, T. Acquirer’s absorptive capacity and firm performance: The perspectives of strategic behavior and knowledge assets. Sustainability 2020, 12, 8396. [Google Scholar] [CrossRef]
  25. Ahuja, G.; Katila, R. Technological acquisitions and the innovation performance of acquiring firms: A longitudinal study. Strateg. Manag. J. 2001, 22, 197–220. [Google Scholar] [CrossRef]
  26. Federico, G.; Langus, G.; Valletti, T. Horizontal mergers and product innovation: An economic framework. Int. J. Ind. Organ. 2018, 59, 1–23. [Google Scholar] [CrossRef] [Green Version]
  27. Haucap, J.; Rasch, A.; Stiebale, J. How mergers affect innovation: Theory and evidence. Int. J. Ind. Organ. 2019, 63, 283–325. [Google Scholar] [CrossRef]
  28. Zollo, M.; Singh, H. Deliberate learning in corporate acquisitions: Post-acquisition strategies and integration capability in US bank mergers. Strateg. Manag. J. 2004, 25, 1233–1256. [Google Scholar] [CrossRef]
  29. Del Giudice, M.; Maggioni, V. Managerial practices and operative directions of knowledge management within inter-firm networks: A global view. J. Knowl. Manag. 2014, 18, 841–846. [Google Scholar] [CrossRef]
  30. Carayannis, E.G.; Grigoroudis, E.; Del Giudice, M.; Della Peruta, M.R.; Sindakis, S. An exploration of contemporary organizational artifacts and routines in a sustainable excellence context. J. Knowl. Manag. 2017, 21, 35–56. [Google Scholar] [CrossRef]
  31. Wubben, E.F.; Batterink, M.; Kolympiris, C.; Kemp, R.G.; Omta, O.S. Profiting from external knowledge: The impact of different external knowledge acquisition strategies on innovation performance. Int. J. Technol. Manag. 2015, 69, 139–165. [Google Scholar] [CrossRef]
  32. Xue, H.; Zeng, S.; Sun, D. Radical or Incremental? Impacts of Mergers and Acquisitions on Firms’ Innovation. IEEE Trans. Eng. Manag. 2022, 1–17. [Google Scholar] [CrossRef]
  33. Duan, Y.; Jin, Y. Financial constraints and synergy gains from mergers and acquisitions. J. Int. Financ. Manag. Account. 2019, 30, 60–82. [Google Scholar] [CrossRef] [Green Version]
  34. Khatami, S.H.; Marchica, M.-T.; Mura, R. Corporate acquisitions and financial constraints. Int. Rev. Financ. Anal. 2015, 40, 107–121. [Google Scholar] [CrossRef] [Green Version]
  35. Erel, I.; Jang, Y.; Weisbach, M.S. Do acquisitions relieve target firms’ financial constraints? J. Financ. 2015, 70, 289–328. [Google Scholar] [CrossRef]
  36. Jiang, Z.; Ma, G.; Zhu, W. Research on the impact of digital finance on the innovation performance of enterprises. Eur. J. Innov. Manag. 2022, 25, 804–820. [Google Scholar] [CrossRef]
  37. Tang, D.; Chen, W.; Zhang, Q.; Zhang, J. Impact of Digital Finance on Green Technology Innovation: The Mediating Effect of Financial Constraints. Sustainability 2023, 15, 3393. [Google Scholar] [CrossRef]
  38. Feng, S.; Zhang, R.; Li, G. Environmental decentralization, digital finance and green technology innovation. Struct. Chang. Econ. Dyn. 2022, 61, 70–83. [Google Scholar] [CrossRef]
  39. Kong, T.; Sun, R.; Sun, G.; Song, Y. Effects of digital finance on green innovation considering information asymmetry: An empirical study based on Chinese listed firms. Emerg. Mark. Financ. Trade 2022, 58, 4399–4411. [Google Scholar] [CrossRef]
  40. Zhang, L.; Chen, J.; Liu, Z.; Hao, Z. Digital Inclusive Finance, Financing Constraints, and Technological Innovation of SMEs—Differences in the Effects of Financial Regulation and Government Subsidies. Sustainability 2023, 15, 7144. [Google Scholar] [CrossRef]
  41. Xie, H.; Wen, J.; Wang, X. Digital Finance and High-Quality Development of State-Owned Enterprises—A Financing Constraints Perspective. Sustainability 2022, 14, 15333. [Google Scholar] [CrossRef]
  42. Pierce, J.R.; Aguinis, H. The too-much-of-a-good-thing effect in management. J. Manag. 2013, 39, 313–338. [Google Scholar] [CrossRef] [Green Version]
  43. Britton, W.B. Can mindfulness be too much of a good thing? The value of a middle way. Curr. Opin. Psychol. 2019, 28, 159–165. [Google Scholar] [CrossRef]
  44. Gong, Y.; Yao, Y.; Zan, A. The too-much-of-a-good-thing effect of digitalization capability on radical innovation: The role of knowledge accumulation and knowledge integration capability. J. Knowl. Manag. 2022. [Google Scholar] [CrossRef]
  45. Turner, K.; Harris, M.C.; Crook, T.R.; Ranft, A.L. Too much of a good thing? An assessment of the effects of competitive and cooperative action repertoires on firm performance. Manag. Decis. 2022, 60, 123–145. [Google Scholar] [CrossRef]
  46. Li, J.; Liang, B.; Yan, Z. Too Much of a Good Thing? The Impact of Government Subsidies on Incubator Services: Empirical Evidence from China. Sustainability 2022, 14, 14387. [Google Scholar] [CrossRef]
  47. Haleblian, J.; Kim, J.-Y.; Rajagopalan, N. The influence of acquisition experience and performance on acquisition behavior: Evidence from the US commercial banking industry. Acad. Manag. J. 2006, 49, 357–370. [Google Scholar] [CrossRef] [Green Version]
  48. Puranam, P.; Srikanth, K. What they know vs. what they do: How acquirers leverage technology acquisitions. Strateg. Manag. J. 2007, 28, 805–825. [Google Scholar] [CrossRef]
  49. Sahoo, S.; Kumar, A.; Upadhyay, A. How do green knowledge management and green technology innovation impact corporate environmental performance? Understanding the role of green knowledge acquisition. Bus. Strategy Environ. 2023, 32, 551–569. [Google Scholar] [CrossRef]
  50. Grant, M.; Nilsson, F.; Nordvall, A.-C. Pre-merger acquisition capabilities: A study of two successful serial acquirers. Eur. Manag. J. 2022, 40, 932–942. [Google Scholar] [CrossRef]
  51. Weber, M.; zu Knyphausen-Aufseß, D.; Schweizer, L. Improving the M&A decision-making process: Learning from serial acquirers. Schmalenbach Bus. Rev. 2019, 71, 295–342. [Google Scholar]
  52. Bresman, H.; Birkinshaw, J.; Nobel, R. Knowledge transfer in international acquisitions. J. Int. Bus. Stud. 1999, 30, 439–462. [Google Scholar] [CrossRef]
  53. Deng, P.; Lu, H. Transnational knowledge transfer or indigenous knowledge transfer: Which channel has more benefits for China’s high-tech enterprises? Eur. J. Innov. Manag. 2022, 25, 433–453. [Google Scholar] [CrossRef]
  54. Yu, H.; Zhang, J.; Zhang, M.; Fan, F. Cross-national knowledge transfer, absorptive capacity, and total factor productivity: The intermediary effect test of international technology spillover. Technol. Anal. Strateg. Manag. 2022, 34, 625–640. [Google Scholar] [CrossRef]
  55. Kozhakhmet, S.; Nurgabdeshov, A. Knowledge acquisition of Chinese expatriates: Managing Chinese MNEs in Kazakhstan. J. Int. Manag. 2022, 28, 100919. [Google Scholar] [CrossRef]
  56. Schuhmacher, A.; Gassmann, O.; Bieniok, D.; Hinder, M.; Hartl, D. Open innovation: A paradigm shift in pharma R&D? Drug Discov. Today 2022, 27, 2395–2405. [Google Scholar] [PubMed]
  57. Tomita, K. Open innovation and drug discovery startups in Japan: The importance of communication in licensing. Asia Pac. Manag. Rev. 2022, 27, 282–291. [Google Scholar] [CrossRef]
  58. Keenan, L.; Monteath, T.; Wójcik, D. Patents over patients? Exploring the variegated financialization of the pharmaceuticals industry through mergers and acquisitions. Compet. Chang. 2022, 27, 472–494. [Google Scholar] [CrossRef]
  59. Hanif, N.; Wu, J.; Babar, A.B. Linking ownership acquired in Chinese firms to post-acquisition innovation performance: Role of institutional distance. Chin. Manag. Stud. 2022, 16, 1043–1065. [Google Scholar] [CrossRef]
  60. Wu, J.; Yu, L.; Khan, Z. How Do Mutual Dependence and Power Imbalance Condition the Effects of Technological Similarity on Post-acquisition Innovation Performance Over Time? Br. J. Manag. 2023, 34, 195–219. [Google Scholar] [CrossRef]
  61. Liang, Y.; Giroud, A.; Rygh, A. Strategic asset-seeking acquisitions, technological gaps, and innovation performance of Chinese multinationals. J. World Bus. 2022, 57, 101325. [Google Scholar] [CrossRef]
  62. Hong, X.; Lin, X.; Fang, L.; Gao, Y.; Li, R. Application of machine learning models for predictions on cross-border merger and acquisition decisions with ESG characteristics from an ecosystem and sustainable development perspective. Sustainability 2022, 14, 2838. [Google Scholar] [CrossRef]
  63. Strobl, A.; Bauer, F.; Degischer, D. Contextualizing deliberate learning from acquisitions: The role of organizational and target contexts. J. Bus. Res. 2022, 139, 194–207. [Google Scholar] [CrossRef]
  64. Li, J. Can technology-driven cross-border mergers and acquisitions promote green innovation in emerging market firms? Evidence from China. Environ. Sci. Pollut. Res. 2022, 29, 27954–27976. [Google Scholar] [CrossRef] [PubMed]
  65. Dagaev, N.; Roads, B.D.; Luo, X.; Barry, D.N.; Patil, K.R.; Love, B.C. A too-good-to-be-true prior to reduce shortcut reliance. Pattern Recognit. Lett. 2023, 166, 164–171. [Google Scholar] [CrossRef]
  66. Jones, C.I.; Williams, J.C. Too much of a good thing? The economics of investment in R&D. J. Econ. Growth 2000, 5, 65–85. [Google Scholar]
  67. Vătămănescu, E.-M.; Mitan, A.; Cotîrleț, P.C.; Andrei, A.G. Exploring the mediating role of knowledge sharing between informal business networks and organizational performance: An insight into SMEs internationalization in CEE. Sustainability 2022, 14, 3915. [Google Scholar] [CrossRef]
  68. Brown, J.R.; Petersen, B.C. Cash holdings and R&D smoothing. J. Corp. Financ. 2011, 17, 694–709. [Google Scholar]
  69. Alkhataybeh, A. Working capital and R&D smoothing: Evidence from the Tel Aviv stock exchange. J. Appl. Econ. 2021, 24, 91–102. [Google Scholar]
  70. Liu, D.; Li, Z.; He, H.; Hou, W. The determinants of R&D smoothing with asset sales: Evidence from R&D-intensive firms in China. Int. Rev. Econ. Financ. 2021, 75, 76–93. [Google Scholar]
  71. Nemlioglu, I.; Mallick, S. Effective innovation via better management of firms: The role of leverage in times of crisis. Res. Policy 2021, 50, 104259. [Google Scholar] [CrossRef]
  72. Hall, B.H.; Moncada-Paternò-Castello, P.; Montresor, S.; Vezzani, A. Financing constraints, R&D investments and innovative performances: New empirical evidence at the firm level for Europe. Econ. Innov. New Technol. 2016, 25, 183–196. [Google Scholar]
  73. Hall, B.H.; Lerner, J. The financing of R&D and innovation. In Handbook of the Economics of Innovation; Elsevier: Amsterdam, The Netherlands, 2010; Volume 1, pp. 609–639. [Google Scholar]
  74. Hall, B.H. The financing of innovative firms. Rev. Econ. Inst. 2010, 1, 1. [Google Scholar] [CrossRef]
  75. Bae, K.H.; Kang, J.K.; Kim, J.M. Tunneling or value added? Evidence from mergers by Korean business groups. J. Financ. 2002, 57, 2695–2740. [Google Scholar] [CrossRef]
  76. Baker, M.; Stein, J.C.; Wurgler, J. When does the market matter? Stock prices and the investment of equity-dependent firms. Q. J. Econ. 2003, 118, 969–1005. [Google Scholar] [CrossRef] [Green Version]
  77. Hsu, P.-H.; Tian, X.; Xu, Y. Financial development and innovation: Cross-country evidence. J. Financ. Econ. 2014, 112, 116–135. [Google Scholar] [CrossRef] [Green Version]
  78. Gomber, P.; Kauffman, R.J.; Parker, C.; Weber, B.W. On the fintech revolution: Interpreting the forces of innovation, disruption, and transformation in financial services. J. Manag. Inf. Syst. 2018, 35, 220–265. [Google Scholar] [CrossRef]
  79. Lee, I.; Shin, Y.J. Fintech: Ecosystem, business models, investment decisions, and challenges. Bus. Horiz. 2018, 61, 35–46. [Google Scholar] [CrossRef]
  80. Zhang, D.; Jin, Y. R&D and environmentally induced innovation: Does financial constraint play a facilitating role? Int. Rev. Financ. Anal. 2021, 78, 101918. [Google Scholar]
  81. Wu, Y.; Huang, S. The effects of digital finance and financial constraint on financial performance: Firm-level evidence from China’s new energy enterprises. Energy Econ. 2022, 112, 106158. [Google Scholar] [CrossRef]
  82. Schipper, K.; Thompson, R. Evidence on the capitalized value of merger activity for acquiring firms. J. Financ. Econ. 1983, 11, 85–119. [Google Scholar] [CrossRef]
  83. Baron, R.M.; Kenny, D.A. The moderator–mediator variable distinction in social psychological research: Conceptual, strategic, and statistical considerations. J. Personal. Soc. Psychol. 1986, 51, 1173. [Google Scholar] [CrossRef]
  84. Zhang, X.; Du, X. Industry and Regional Peer Effects in Corporate Digital Transformation: The Moderating Effects of TMT Characteristics. Sustainability 2023, 15, 6003. [Google Scholar] [CrossRef]
  85. Griliches, Z. Patent statistics as economic indicators: A survey. In R&D and Productivity: The Econometric Evidence; University of Chicago Press: Chicago, IL, USA, 1998; pp. 287–343. [Google Scholar]
  86. Kutieshat, R.; Farmanesh, P. The impact of new human resource management practices on innovation performance during the COVID 19 crisis: A new perception on enhancing the educational sector. Sustainability 2022, 14, 2872. [Google Scholar] [CrossRef]
  87. Tang, H. The effect of ESG performance on corporate innovation in China: The mediating role of financial constraints and agency cost. Sustainability 2022, 14, 3769. [Google Scholar] [CrossRef]
  88. Lee, C.-C.; Lou, R.; Wang, F. Digital financial inclusion and poverty alleviation: Evidence from the sustainable development of China. Econ. Anal. Policy 2023, 77, 418–434. [Google Scholar] [CrossRef]
  89. Peng, P.; Mao, H. The Effect of Digital Financial Inclusion on Relative Poverty Among Urban Households: A Case Study on China. Soc. Indic. Res. 2023, 165, 377–407. [Google Scholar] [CrossRef]
  90. Schumpeter, J.A., II. Capitalism, Socialism, and Democracy, 1942; Routledge: London, UK, 1976. [Google Scholar]
  91. Nemlioglu, I.; Mallick, S.K. Do managerial practices matter in innovation and firm performance relations? New evidence from the UK. Eur. Financ. Manag. 2017, 23, 1016–1061. [Google Scholar] [CrossRef]
  92. Dang, C.; Li, Z.F.; Yang, C. Measuring firm size in empirical corporate finance. J. Bank. Financ. 2018, 86, 159–176. [Google Scholar] [CrossRef]
  93. Smyth, D.J.; Boyes, W.J.; Peseau, D.E. The measurement of firm size: Theory and evidence for the United States and the United Kingdom. Rev. Econ. Stat. 1975, 57, 111–114. [Google Scholar] [CrossRef]
Figure 1. Research framework. Note: The dotted line represents the non-linear relationship, the solid line represents the linear relationship.
Sustainability 15 09829 g001
Table 1. Descriptive statistics and correlation analysis of the main variables.
VariableMeanStd.Dev.MinMax P A T i , t S M A i , t S A i , t D I F i , t
P A T i , t 1.0141.949011.2111
S M A i , t 1.2421.9090400.0472 ***1
S A i , t −3.8170.274−4.78600.061 ***−0.090 ***1
D I F i , t 4.8381.59306.0190.131 ***0.170 ***−0.269 ***1
Note: t-values are in parentheses. *** p < 0.01.
Table 2. The relationship between serial M&A and both corporate innovation performance and the mediating role of financing constraints.
Variables(1)(2)(3)(4)
Model (1)Model (1)Model (2a)Model (2b)
S M A i , t 0.039 ***
(2.98)
0.025 *
(1.93)
−0.005 ***
(−2.92)
0.028 **
(2.23)
S M A i , t 2 −0.001 **
(−2.31)
−0.001 ***
(−3.02)
0.0005 ***
(4.21)
−0.002 ***
(−3.56)
S A i , t ---0.725 ***
(9.66)
C o n t r o l s i , t YesYesYesYes
YearYesYesYesYes
IndustryYesYesYesYes
Constant−0.364 ***
(−6.00)
−6.597 ***
(−19.58)
−3.935 ***
(−53.05)
−3.744 ***
(−10.26)
Observation Value12,36712,36712,36712,367
R20.12500.18860.21970.1966
F102.10 ***73.46 ***82.32 ***71.50 ***
Note: t-values are in parentheses. * p < 0.1, ** p < 0.05, *** p < 0.01.
Table 3. U-test for testing non-linearity.
Lower BoundUpper Bound
Interval040
Slope0.086−0.198
t-value6.362−3.029
p > |t|0.0000.001
Extreme point12.076
Overall test of presence of the inverse U-shapet-value = 2.12; p > |t| = 0.017
Table 4. The moderating role of DIF.
Variables(1)(2)(3)(4)(5)(6)(7)(8)(9)
Full SamplesLower DIF GroupHigher DIF Group
Model (3a)Model (3b)Model (3c)Model (1)Model (2a)Model (2b)Model (1)Model (2a)Model (2b)
S M A i , t 0.030
(1.35)
−0.009 ***
(−3.18)
0.035
(1.62)
0.021
(1.31)
−0.003
(−1.49)
0.024
(1.48)
S M A i , t 2 −0.0016 *
(−1.70)
0.0005 ***
(3.79)
−0.0019 **
(−2.02)
−0.0013 **
(−2.18)
0.004 ***
(2.93)
−0.0016 ***
(−2.58)
S M A i , t × D I F i , t 0.005 *
(1.95)
−0.001 **
(−2.55)
0.005 **
(2.21)
S M A i , t 2 × D I F i , t −0.00028 ***
(−3.02)
0.0001 ***
(3.96)
−0.0003 ***
(−3.48)
D I F i , t 0.512 ***
(6.00)
0.027 *
(1.81)
0.496 ***
(5.83)
S A i , t 0.724 ***
(9.01)
0.599 ***
(5.25)
0.808 ***
(7.17)
C o n t r o l s i , t YesYesYesYesYesYesYesYesYes
YearYesYesYesYesYesYesYesYesYes
IndustryYesYesYesYesYesYesYesYesYes
Constant−8.482 ***
(−17.88)
−4.199 ***
(−46.10)
−5.444 ***
(−11.07)
−6.104 ***
(−12.47)
−3.614 ***
(−32.57)
−3.939 ***
(−8.04)
−7.300 ***
(−13.52)
−4.692 ***
(−50.57)
−3.509 ***
(−5.22)
N11,30211,30211,302507850785078622462246224
R20.18950.20260.19700.16100.17110.16550.18900.19630.1973
F69.69 ***66.09 ***68.31 ***31.76 ***50.18 ***32.78 ***54.99 ***31.25 ***53.62 ***
Note: t-values are in parentheses. * p < 0.1, ** p < 0.05, *** p < 0.01.
Table 5. Heterogeneity test: grouping by ownership property.
Variables(1)(2)(3)(4)(5)(6)
Group of State-Owned EnterprisesGroup of Non-State-Owned Enterprises
Model (1)Model (2a)Model (2b)Model (1)Model (2a)Model (2b)
S M A i , t 0.016
(0.68)
−0.007 **
(−2.16)
0.021
(0.89)
0.038 **
(2.34)
−0.005 **
(−2.42)
0.042 ***
(2.58)
S M A i , t 2 −0.002
(−0.85)
0.001
(1.33)
−0.002
(−1.07)
−0.0019 ***
(−3.24)
0.001 ***
(4.42)
−0.0023 ***
(−3.76)
S A i , t --0.675 ***
(5.95)
--0.770 ***
(7.42)
C o n t r o l s i , t YesYesYesYesYesYes
YearYesYesYesYesYesYes
IndustryYesYesYesYesYesYes
Constant−6.829 ***
(−14.12)
−4.799 ***
(−49.11)
−3.589 ***
(−5.75)
−5.997 ***
(−12.82)
−3.101 ***
(−29.17)
−3.610 ***
(−7.76)
N626262626262610561056105
R20.21510.36740.22100.17770.19540.1864
F38.78 ***89.71 ***38.29 ***40.89 ***33.62 ***40.54 ***
Note: t-values are in parentheses. ** p < 0.05, *** p < 0.01.
Table 6. Heterogeneity test: grouping by business environment.
Variables(1)(2)(3)(4)(5)(6)
Group of High Business Environment IndexGroup of Low Business Environment Index
Model (1)Model (2a)Model (2b)Model (1)Model (2a)Model (2b)
S M A i , t 0.027 *
(1.66)
−0.005 **
(−2.21)
0.031 *
(1.91)
0.021
(0.87)
−0.004
(−1.28)
0.024
(0.97)
S M A i , t 2 −0.0016 ***
(−2.76)
0.0004 ***
(3.65)
−0.002 ***
(−3.24)
−0.002
(−0.97)
−0.0001
(0.49)
−0.002
(−1.00)
S A i , t --0.772 ***
(8.57)
--0.663 ***
(5.45)
C o n t r o l s i , t YesYesYesYesYesYes
YearYesYesYesYesYesYes
IndustryYesYesYesYesYesYes
Constant−6.856 ***
(−15.33)
−4.230 ***
(−39.29)
−3.588 ***
(−7.43)
−6.098 ***
(−11.99)
−3.453 ***
(−44.34)
−3.809 ***
(−6.95)
N753275327532483548354835
R20.19570.23420.20530.18240.27660.1875
F51.09 ***48.11 ***49.64 ***27.8361.05 ***27.28 ***
Note: t-values are in parentheses. * p < 0.1, ** p < 0.05, *** p < 0.01.
Table 7. Heterogeneity test: grouping by firm size.
Variables(1)(2)(3)(4)(5)(6)(7)(8)(9)
Group of 25% Firm SizeGroup of 25%~75% Firm SizeGroup of 75% Firm Size
Model (1)Model (2a)Model (2b)Model (1)Model (2a)Model (2b)Model (1)Model (2a)Model (2b)
S M A i , t −0.009
(−0.25)
−0.005
(−1.00)
−0.002
(−0.06)
0.030
(1.62)
−0.004
(−1.61)
0.033 *
(1.78)
0.045
(1.63)
−0.005 **
(−2.32)
0.051 *
(1.87)
S M A i , t 2 0.004
(0.67)
0.002 **
(2.41)
0.001
(0.25)
−0.002 **
(−2.25)
0.001 ***
(3.39)
−0.002 ***
(−2.77)
−0.002 **
(−1.97)
0.001
(1.10)
−0.002 **
(−2.08)
S A i , t --1.336 ***
(9.62)
--0.690 ***
(6.28)
--1.107 ***
(4.92)
C o n t r o l s i , t YesYesYesYesYesYesYesYesYes
YearYesYesYesYesYesYesYesYesYes
IndustryYesYesYesYesYesYesYesYesYes
Constant−4.258 ***
(−7.49)
0.865 ***
(4.48)
−5.413 ***
(−9.52)
−6.426 ***
(−13.60)
−4.069 ***
(−42.75)
−3.617 ***
(−6.70)
−9.819 ***
(−8.16)
−9.431 ***
(−80.40)
0.620
(0.26)
N309230923092618461846184309130913091
R20.18050.54980.21070.17700.22530.18400.24290.71050.2494
F17.19 ***49.04 ***17.37 ***36.73 ***43.87 ***35.31 ***33.26 ***153.81 ***32.08 ***
Note: t-values are in parentheses. * p < 0.1, ** p < 0.05, *** p < 0.01.
Table 8. Robustness test of the baseline model.
Variables(1)(2)(3)(4)(5)(6)(7)(8)
Tobit ModelChange the VariablesChange the SamplesSamples during the COVID-19 Pandemic
S M A i , t 0.317 ***
(5.04)
0.145 **
(2.46)
0.044 ***
(5.01)
0.016 *
(1.84)
0.045 ***
(3.30)
0.030 **
(2.23)
0.045
(1.51)
0.017 *
(1.95)
S M A i , t 2 −0.017 ***
(−2.77)
−0.013 **
(−2.23)
−0.002 ***
(−3.93)
−0.001 ***
(−2.90)
−0.001 ***
(−2.68)
−0.002 ***
(−3.17)
−0.003
(−0.98)
-
C o n t r o l s i , t NOYesNOYesNOYesYesYes
YearYesYesYesYesYesYesYesYes
IndustryYesYesYesYesYesYesYesYes
Constant−4.166 ***
(−31.77)
−23.562 ***
(−19.48)
0.186 ***
(3.46)
−3.387 ***
(−14.08)
−0.347 ***
(−5.18)
−6.427 ***
(−17.15)
−9.010 ***
(−17.14)
−8.940 ***
(−18.25)
N12,36712,36712,36712,36710,25310,25348544854
R2 0.06760.12160.12730.18640.26970.2659
F 112.3764.7383.43 ***61.31 ***71.32 ***74.25 ***
Left Intercept Number9 3299 329
Log-likelihood−13,831.55−13,326.785
L R   c h i 2 31.30 ***1040.83 ***
Note: t-values are in parentheses. * p < 0.1, ** p < 0.05, *** p < 0.01.
Table 9. Endogeneity test of one-period lag test and GMM test.
Variables(1)(2)(3)(4)(5)(6)
Lag TestGMM Test
Model (1)Model (2a)Model (2b)Model (1)Model (2a)Model (2b)
S M A i , t 0.025 *
(1.70)
−0.008 ***
(−4.49)
0.031 **
(2.13)
0.114 **
(2.29)
−0.082 ***
(−10.82)
0.164 ***
(3.21)
S M A i , t 2 −0.002 ***
(−3.58)
0.001 ***
(5.80)
−0.002 ***
(−4.17)
−0.004 ***
(−2.80)
0.002 ***
(9.22)
−0.005 ***
(−3.58)
S A i , t --0.723 ***
(8.75)
--0.613 ***
(8.34)
C o n t r o l s i , t YesYesYesYesYesYes
YearYesYesYesYesYesYes
IndustryYesYesYesYesYesYes
Constant−6.915 ***
(−18.70)
−4.172 ***
(−55.93)
−3.897 ***
(−9.36)
−4.667 ***
(−14.36)
−4.357 ***
(−88.07)
−1.994 ***
(−4.29)
N10,92910,92910,92910,92910,92910,929
R20.18890.21280.1962
F67.75 ***66.70 ***65.95 ***
LM statistic 7.2797.27927.119
Cragg-Donald Wald F statistic 465.853465.853443.961
Note: (1)∼(3) t-values are in parentheses. (4)∼(6) z-values are in parentheses. * p < 0.1, ** p < 0.05, *** p < 0.01.
Table 10. Robustness test of the mediation effect.
Mediation PathCoefficientDeviationStandard ErrorLower LimitUpper Limit
Indirect effect−0.006−0.00010.001−0.0084−0.0037(P)
−0.0083−0.0036(BC)
Direct effect0.054−0.00050.0100.0350.076(P)
0.0350.075(BC)
Disclaimer/Publisher’s Note: The statements, opinions and data contained in all publications are solely those of the individual author(s) and contributor(s) and not of MDPI and/or the editor(s). MDPI and/or the editor(s) disclaim responsibility for any injury to people or property resulting from any ideas, methods, instructions or products referred to in the content.

