Abstract
The problems of environmental pollution and resource shortages are becoming increasingly prominent with the advances in technology and the improvements in social productivity levels. How to coordinate the innovating subjects, and strengthen the interaction and cooperation among the subjects to improve the green technology innovation efficiency (GTI efficiency) is an important issue to be solved urgently. This paper constructs a multisubject collaborative analysis framework of “government–market–society” for the GTI efficiency based on the pluralistic co-governance theory. Using 30 provinces (or regions, cities) in China from 2016 to 2020 as research samples, we analyzed the driving factors of GTI efficiency using the dynamic QCA method. Furthermore, the configuration effects of the driving factors were further analyzed in the time and spatial dimensions. The results show that: (1) The single driving factor does not constitute the requisite condition for high GTI efficiency. (2) There are three types of paths to realize high GTI efficiency: “government–market driven”, “market–society driven”, and “government–market–society synergistic promotion”. Among them, the “government–market-driven” path is subdivided into “government—internal-market driven” and “government-supported–external-market driven”. (3) In the time dimension, the “market–society driven” path has prominently enhanced its driving effect on GTI efficiency, while the driving effect of the other three paths is little changed. In the spatial dimension, the coverage of the “government-supported–external-market driven” path appears to have obvious regional differences, and the explanation degree of the central region is higher, while the other three paths do not have obvious regional differences. Based on the perspective of configuration, these research results enrich the related research on the driving factors of GTI efficiency in the time and spatial dimension. It provides enlightenment for boosting the coordinated development of regional GTI efficiency and realizing sustainable economic growth.
1. Introduction
A series of scientific and technological innovations have promoted changes in society and production methods since the industrial revolution, greatly improving social productivity. Technological innovation has been the crucial source of the world’s economic growth [1]. However, traditional technological innovation has caused extraordinarily prominent issues, such as energy consumption and environmental contamination [2]. From international environmental law to the Paris Agreement, countries around the world are actively seeking a balance between environmental conservation and economic development. China’s economy has burgeoned swiftly after the Reform and Opening-up strategy. The GDP has increased from 364.52 billion CNY in 1978 to 114.4 trillion CNY in 2021, with a mean annual increase rate of 9% [3]. At the moment, China contributes to about 30% of global economic growth and has risen to become the world’s second-largest economy. However, the traditional extensive economic development mode has caused serious ecological damage, and China’s environmental situation is facing a severe test. Based on the BP Statistical Review of World Energy 2021, China’s consumption of renewable energy growth in 2020 made up one-third of the total global amount, the country’s growth rate of disposable energy was 2.1%, and it was one of the few regions in the world to increase its carbon emissions. The 2022 global environmental performance index list shows that China’s ranking among 180 countries in the world is 160th, scoring only 28.4 points. It can be seen that ecological and environmental problems have become the principal reasons hampering the sustainable growth of the economy in China. Hence, the organic combination of green development and technological innovation is the crux of China’s coordinated promotion of economic growth and environmental protection. This concept plays a constructive role in leading China’s new pattern of economic growth. The paper of the 20th Party Congress distinctly stated that innovation is the first impetus. Scientific and technological innovation offers a powerful foundation for improving comprehensive national strength. At the same time, it also re-emphasizes the green progress conception that “lucid waters and lush mountains are invaluable assets”, and the green low-carbon production mode was promoted through green transformation. GTI is an important way to implement innovation-driven development strategies and economic transformation and development [4].
The concept of GTI was initially conceptualized by Braun and Wield in 1994 [5]. It has the commercial aspects of boosting productivity and competitiveness as well as the social features of environmental protection and energy saving, which is a fundamental approach to solving the dilemma of economic growth and energy conservation. As a complex systemic project, GTI cannot accurately reflect its true level when measured only from the perspective of inputs or outputs. GTI efficiency comprehensively considers the proportional relationship between input elements and innovation results in the process of GTI activities and is a crucial index to reflect the efficiency of innovation investment resource utilization. Scientific measurement and analysis of GTI efficiency can more objectively assess the level of GTI. With the rapid development of green technology, the government, market, and society gradually joined in the activities of GTI. At the early stage of development, the government promoted the improvement of GTI efficiency by funding R&D and formulating green policies and regulations. The government acted as a guide at this point, laying the groundwork for the commercialization of GTI. As government support strengthens and companies begin to develop and commercialize green technologies in practice, the role of the market becomes increasingly apparent. Market-oriented GTI activities can integrate various resources and form a complete innovation ecosystem, including R&D, production, and sales. High GTI efficiency is realized through the comprehensive promotion and application of green technologies. In a government-led and market-driven environment, public participation and supervision can play a positive supporting role. Social supervision can be combined with social needs to motivate the update of green technology, thus promoting the progress of GTI efficiency.
On the whole, the government, market, and society work in concert to influence GTI efficiency through information interchange and resource sharing. Therefore, this paper explores the driving factors of GTI efficiency in China based on the pluralistic co-governance theory from the perspective of a group state. Firstly, the GTI efficiency evaluation indicator system is constructed, and the super-efficiency EBM (SEBM) and global Malmquist–Luenberger (GML) index models are applied to measure and dynamically evaluate the GTI efficiency of each province and city. Secondly, based on the pluralistic co-governance theory, a multisubject synergistic analysis framework of “government–market–society” is constructed. The dynamic QCA method is also applied to explore the driving factors of GTI efficiency and propose a path to promote it. Finally, the time effects of different paths are analyzed, and the spatial differences of the paths are explored by combining the Kruskal–Wallis (KW) test. The driving path of GTI efficiency improvement is finally derived to provide insights for regional GTI efficiency development.
This study has made the following contributions: (1) Based on the pluralistic co-governance theory, we construct an analytical framework of “government–market–society” influencing factors from the perspective of configuration. This enriches the study of external drivers of GTI efficiency. (2) The analysis method in dynamic QCA for panel data is used to investigate whether each synergistic path has a temporal effect. The combination of the QCA method and panel data makes up for the deficiency of cross-sectional data grouping for temporal analysis in previous studies. (3) Combined with the KS test method, we explore the preference differences among the groupings in the spatial dimension. This facilitates the provision of driving paths for different regions to maximize GTI efficiency in line with their development characteristics.
The organization of this study is as follows: The second part provides an overview of the research related to GTI and GTI efficiency and constructs a theoretical framework. The third part introduces the models and methods used in this study, which are the SEBM model, GML index, and dynamic QCA. The fourth part shows the data sources and the measurement of the outcome and antecedent variables. The data are calibrated to facilitate the subsequent group analysis. The fifth part conducts the empirical analysis, including the GTI efficiency evaluation, the necessary analysis of individual conditions, and the adequacy analysis of the condition grouping. The sixth part summarizes the analysis results and provides conclusions.
2. Literature Review and Research Framework
2.1. Literature Review
2.1.1. Research on the Concept of GTI
GTI is a composite concept that combines technological innovation and green technology concepts, aiming to attain the synergetic progress of the economy, environment, and resources [6]. Since GTI activities cover multiple links between economic benefits, resource utilization, environmental protection, and innovation output, the academic circle has not yet reached an agreement on the connotation of GTI. Early scholars conducted in-depth discussions on the connotation of GTI. Kemp et al. [7] claimed that GTI is a systematic technological innovation. It consists of new or improved organizational innovation technology, process, system, and related products that need to be developed to avoid or reduce environmental pollution. HelloStrom [8] believed that GTI can be defined as the entire process of R&D, design, and market application of new techniques and new products based on reducing environmental pollution.
From the micro level, some scholars have further decomposed GTI. Wang et al. [9] held that GTI can be regarded as the innovation of green processes and green products. The former is more inclined to innovate the production process, while the latter concentrates on innovation throughout the product life cycle. After considering the environmental impact, Zhang et al. [10] decomposed GTI into cleaner production technology innovation and terminal technology innovation. Among them, clean production technology focuses on cutting pollutants from the source. The end technology mainly deals with pollutants after production. Yin et al. [11] believed that the GTI process of manufacturing enterprises is the basis of green manufacturing, which consists of three phases: technical export, economic output, and social impact. Yao et al. [12] defined GTI as realizing the greening of enterprises at all stages by utilizing green products and processes for technology research as well as production. Finally, it can achieve the triple benefits of economy, ecology, and society. Li et al. [13] maintained that GTI can be divided into substantive and strategic, with the former enhancing the market value of the firm and the latter used to meet market demand. Liu et al. [14] pointed out that GTI is a technology that covers product design, production, consumption, and recycling.
From the macro perspective, Behera et al. [15] argued that GTI is an innovative activity that can reduce negative environmental externalities while embodying technology in economic production, creating a win-win situation for both the economy and the environment. Li et al. [16] defined GTI as a process that rationalizes the usage of resources and energy and enhances environmental benefits. Xu et al. [17] defined GTI from the viewpoint of the digital economy as a development process that integrates digital technology with green innovation. Wang et al. [18] asserted that GTI is a type of technological innovation to decrease the life cycle cost of green technology from concept formation to putting products on the market. GTI will take into account comprehensively decreasing energy consumption, saving resources, and reducing environmental contamination in the development process [19]. Furthermore, through green production, we will simultaneously promote economic, environmental, and social benefits. This is a new development path to achieve sustainable economic development [20].
In short, although these GTI concepts are not described differently, the connotation is the same. It is a process that balances the benefits of the economy, society, and environment, applies natural environmental protection and technological innovation to production and business activities, and obtains certain economic benefits and environmental value. It is of great significance for economic progress and environmental conservation.
2.1.2. Research on Measurement Methods of GTI efficiency
DEA and its extended model are the most common GTI efficiency measurement methods nowadays. Wang et al. [21] integrated the DEA-BCC model with the Malmquist index to study and analyze the GTI efficiency of 29 subindustries under different pollution levels in the Chinese manufacturing industry from 2013 to 2019. Li et al. [22] measured and analyzed the GTI efficiency of industrial enterprises in Hubei Province through the DEA-Tobit model. Wang et al. [23] used the Bootstrap-DEA model to measure the GTI efficiency of 21 listed green companies in the biomass power business from both resource and environmental perspectives. Zhu et al. [24] measured the development of GTI efficiency in Chinese industrial enterprises through an improved DEA model. Luo et al. [25] evaluated the GTI efficiency of emerging strategic industries by combining the Malmquiste-DEA index approach. Xu et al. [26] measured the GTI efficiency of 19 wastewater treatment companies in the same way. Zhang et al. [27] measured the efficiency of the IT industry through a three-stage DEA model. Du et al. [28] regarded industrial carbon emissions and “three wastes” contaminants as unexpected outputs and used the network DEA to estimate the GTI efficiency of industrial enterprises.
In addition, an increasing number of researchers have adopted the SBM model, which further considers the problem of relaxation variables compared to the traditional DEA model. Jie [29] used a network SBM model with the comprehensive environmental pollution index as the undesirable output to statistically analyze the GTI efficiency of the enterprise. Peng et al. [30] included environmental pollution in the index system of GTI efficiency and used the non-expected SBM model to calculate the GTI efficiency of technological SMEs in a province. Zhang et al. [31] calculated the provincial Chinese industrial GTI efficiency from 2005 to 2018, combining the SSBM model with undesired output. Shen et al. [32] set industrial CO2 emissions as undesirable outputs of industrial GTIE as a premise. Using the SBM-DEA model of non-directed two-stage networks with variable scale returns, the industrial GTI efficiency was calculated. Xie et al. [33] argued that GTI efficiency can be decomposed into the R&D stage and the results transformation stage. Therefore, they used a two-stage SBM model to measure the GTI efficiency of the high-tech manufacturing industry. Tian et al. [34] combined regional and industry perspectives to measure the efficiency of GTI in advanced manufacturing using a network SBM-DEA model.
However, while the SBM model calculates the efficiency value to optimize efficiency, it cannot find the shortest path to the efficiency boundary. Recently, some scholars have measured efficiency by considering the EBM hybrid model. Zhang [4] calculated the GTI efficiency of China’s architectural industry using the EBM model and discussed its development trend. Chen et al. [35] employed network SBM and EBM models to estimate the GTI efficiency of industrial enterprises in China. After comparing the efficiency values obtained, it was found that the exactness of the EBM model is greater.
2.1.3. Influencing Factors of GTI efficiency
Scholars have discussed the elements influencing GTI efficiency at three levels: government, market, and society. Based on more government-level studies, Wu et al. [36] explored the effects of three aspects of government policies on GTI: quantity, effectiveness, and implementation. The study found that all three had positive effects on GTI, and the first two had a greater degree of influence than the latter. Ma et al. [37] argued that environmental regulation can promote GTI, while the development of digital finance plays a positive moderating role in it. Wang et al. [38] pointed out that environmental regulation has a positive spillover effect on GTI in the surrounding area. This spillover effect is greater than the direct promotion effect in the region. Hu et al. [39] used Chinese urban panel data to further decompose environmental regulation from different perspectives. It was concluded that government environmental regulation significantly promotes GTI efficiency and that there is regional heterogeneity. Fang et al. [40] classified environmental regulations as “market-incentivized” and “command-and-control”. For regional GTI efficiency, the former has a significant facilitating effect, while the latter has a suppressive effect. Yi et al. [41] decomposed environmental regulation into command and control, market incentives, and social will and explored their effects on GTI efficiency separately. Luo et al. [42] argued that environmental regulatory tools include control regulation, informal regulation, and market regulation. The former two were found to have a facilitating effect on GTI efficiency in China, while the latter inhibited the development of GTI efficiency. Bao et al. [43] pointed out that the regulation of cost inputs has a positive impact on GTI efficiency, and conversely, the regulation of government subsidies has a negative impact, and that financial resource allocation can play a mediating role. Liu et al. [44], using the spatial Durbin model, pointed out that government technology spending promotes industrial GTI efficiency development.
From the market perspective, Li et al. [45] found that the more mature the market, the more favorable the development of GTI efficiency in high-end manufacturing. Shang et al. [46] argued that import trade can facilitate the development of GTI efficiency in China to some extent. Liu et al. [47] pointed out that opening up to the outside world can help companies introduce advanced technology and management experience, broaden technology and knowledge boundaries, and enhance GTI capabilities. Guo et al. [48], based on the Tobit panel model study with PRD cities, concluded that the greater the level of economic openness, the higher the GTI efficiency. Song et al. [49] studied the provincial GTI panel data in China and found that the positive impact of FDI on GTI efficiency was greater than the negative impact, and the degree of driving was different for different regions. Xu et al. [50] believed that FDI and OFDI can develop together through benign interaction, and this synergistic relationship can have a greater positive impact on GTI efficiency. Liu et al. [51] used new energy firms as the subject of their study, and the model test results showed that stock liquidity promotes GTI by increasing inputs and reducing financial risk. Meanwhile, government subsidies play a positive moderating role in this process. Hu et al. [52] argued that with the rise in the status of global value chains, manufacturing GTI efficiency has increased significantly. Furthermore, this synergistic relationship can have a greater positive impact on GTI efficiency.
Fewer studies have been conducted on the factors influencing GTI efficiency from a social perspective. Yang et al. [53] found that social trust promotes corporate GTI efficiency and has a greater impact on non-state-owned firms than state-owned firms. Zhang et al. [31] pointed out that the level of education of the population exerts a significant positive effect on industrial GTI efficiency and there is a positive spatial spillover effect. Zhao et al. [54] found that the higher the involvement of the news media and community residents, the stronger the incentive for firms to innovate. Environmental NGOs did not play an active role.
2.2. Theoretical Framework
2.2.1. The Pluralistic Co-Governance Theory
The pluralistic co-governance theory is a philosophy of governance based on multiparty participation, consultation, and cooperation. Essentially, it refers to the full participation of multiple subjects, such as government, market, and society, in the governance of social public affairs, through consultation and other ways, to take advantage of their respective resources so as to achieve good governance results. The doctrine emphasizes the need and importance of cooperation and agreement between the government and all sectors of society, aiming to achieve goals in a more coordinated and efficient manner. Its core concept is that the government is no longer a unilateral dominant player, but works together with various other social organizations to solve problems. The organizational framework from the perspective of pluralistic governance tends to be a flat network structure, which means it breaks through the hierarchy and allows each social subject on the network to express their demands directly. It also makes use of the interconnected relationships between each node to obtain social identity and social resources. The operation mechanism of pluralistic governance is that all subjects have the same value pursuit but need to rely on external forces for effective information communication to ensure that information can be shared among subjects. This is a kind of interest seeking, and rule constraints are needed to ensure the effective implementation of this governance model. Pluralistic shared governance broadens the channels of popular participation and, to a certain extent, enhances mutual recognition among different social subjects. It allows government, market, and society to participate in governance together.
Pluralistic and shared governance can overcome or reduce the drawbacks arising from the traditional governance model. Firstly, it can increase participation and cooperation, and thus, make decision making more comprehensive, accurate, and sustainable. In the fields of environmental protection and GTI, different stakeholders have different knowledge, experience, and resources. The pluralistic shared governance model can pool these resources together to form a more complete and comprehensive decision-making and management system. Collaboration and cooperation between governments, markets, and individuals can also lead to more flexible and real-time feedback mechanisms, providing more reliable support and reference for decision making. Secondly, pluralistic shared governance can enhance public trust and satisfaction in politics and decision making, thus strengthening the stability and reliability of the democratic system. In traditional decision-making and management models, the public often feels that their voices are ignored and that the management process lacks transparency and fairness. Furthermore, the pluralistic co-governance model solicits the opinions and suggestions of various stakeholders through a wide range of channels. It improves the opportunity and quality of public participation and enhances public trust and satisfaction in decision making. Finally, multigovernance can also promote technological innovation and the progress of environmental industries. Companies often need to face high R&D costs, technical barriers, and market risks in the GTI process. Furthermore, the multiple co-governance model can provide the necessary resources and support for companies through a variety of means, including government incentives and public recognition. In this way, it promotes technological innovation and the development of environmental industries.
2.2.2. Driving Factors of GTI efficiency
Studies have been conducted to confirm the impact of government, market, and society on GTI efficiency, respectively. Therefore, this paper selects the five factors of environmental regulation, government subsidies, openness, market competition, and public participation as the key factors affecting the GTI efficiency from three perspectives: government, market, and society.
The influence of government factors on GTI efficiency. As the promoter and guide of GTI, the government can, on the one hand, restrain pollution emissions and reduce environmental pollution, and on the other hand, give financial support to encourage green technology change. From the perspective of constraints, the implementation of environmental regulations has raised the emission standards for pollution and prompted some enterprises that seriously pollute the environment to withdraw from the market. Environmental regulations can also force companies to use greener, more energy-efficient, and cleaner products and technologies, thereby increasing the demand for environmentally friendly products and technologies. From the incentive point of view, government subsidies can provide certain financial support for enterprises, reduce the cost of technology research and development, and alleviate the lack of funds for technological innovation. The non-reimbursable and continuous performance of government R&D subsidies motivates firms to remain optimistic about the prospects of R&D activities. This effectively increases firms’ willingness to innovate and promotes the transformation and application of technological innovation. Therefore, both environmental regulation and government subsidies have a positive contribution to GTI efficiency.
The influence of market factors on GTI efficiency. Building a market-oriented GTI system is an essential element in the establishment of the national innovation system. Furthermore, the openness and competition of the markets can promote GTI efficiency enhancement. Opening up to the outside world can broaden the market scope and provide a broader platform for GTI. The internationalization of green technology can help companies understand international market demand and improve the adaptability and feasibility of the technology. Meanwhile, international cooperation and innovation in green technology can be strengthened through technology exchange and patent sharing. Opening up to the outside world will also introduce more international competition. With fierce market competition, enterprises are forced to increase their technological innovation capabilities to adapt to market demand and improve competitiveness. Therefore, opening up to the outside world and market competition can have a positive impact on GTI efficiency.
The influence of social factors on GTI efficiency. The public’s green demands will, on the one hand, push the government to implement environmental regulations and force enterprises to carry out GTI. On the other hand, to avoid the negative impact caused by public pressure, companies will consider the public interest and increase their sense of responsibility and importance to GTI. Therefore, the higher the level of public participation, the higher the level of GTI efficiency.
2.2.3. Research Framework Construction
The pluralistic co-governance theory states that government, market, and society together constitute a complete governance structure. There is a dominant, competitive, and synergistic relationship among the three. Diverse group effects exist for different combinations of factors, producing different GTI-efficiency driving paths. Therefore, from the configuration perspective, this study summarizes the possible enhancement paths of GTI efficiency based on the interaction and cooperation among government, market, and society. It includes three categories: single dominant improvement paths, dual combination improvement paths, and multiple collaborative improvement paths. The possible enhancement paths of GTI-efficiency are shown in Table 1. Among them, 1 means that the condition has an effect, and 0 means that the condition has no effect.

Table 1.
Possible improvement paths for GTI efficiency.
Single dominant improvement path. In the governance of GTI activities, there may be competing and dominant relationships among government, market, and society. There are differences in the development and characteristics of GTI in different regions. Therefore, there exists the possibility that the GTI efficiency can be obviously improved by enhancing the degree of influence of a certain factor alone. For example, significant improvements in GTI efficiency can be achieved simply by strengthening government regulation and increasing government subsidies. Whether there is a strong dominance of some factors in this case deserves further exploration.
Dual combination improvement path. There may be an interactive and collaborative relationship between government, market, and society for some two influencing factors. For example, the enhancement of GTI efficiency requires continuous optimization of the relationship between the government and the market to achieve a combination of a competent government and an effective market. This means that the government needs to influence market equilibrium through appropriate interventions, which in turn play a role in the GTI process. At this time, a positive interaction between government and market can sensibly promote GTI efficiency.
The multiple collaborative improvement path. There may be synergistic partnerships between government, market, and society, where the strengths of each party complement each other. The tripartite cooperation of government coordination, market coordination, and social supervision can enhance information and resource sharing. Thus, a multisubject “government–market–society” model can be formed to jointly improve GTI efficiency.
To sum up, this paper constructs a multibody synergistic analysis framework of “government–market–society” to study the driving factors of GTI efficiency, as shown in Figure 1.
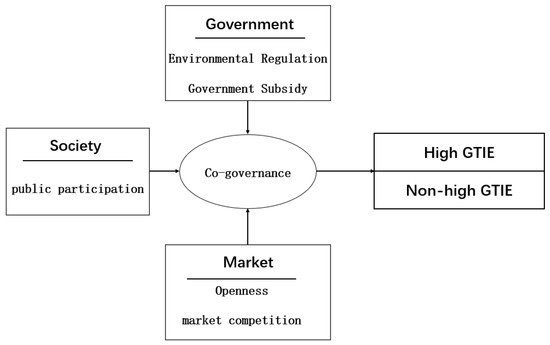
Figure 1.
Theoretical framework.
3. Methodology
3.1. SEBM Model and GML Index
Classical DEA models contain radial models exemplified by CCR and BCC and non-radial models exemplified by SBM, but there are certain shortcomings in both models. Considered from the perspective of the distance function, the radial model’s evaluation of the level of inefficiency just contains the proportion of equal scaling down (increasing) of all inputs (outputs), while the portion of slack amelioration is not shown in the measurement of efficiency values. For the non-radial model, the evaluated decision-making unit’s (DMU) projection point is the furthest point from it on the frontier, which defies the expectation of reaching the frontier with the shortest path. Because of the foregoing problems, the EBM model has been put forward by Tone and Tsutsui [55]. This model takes radial scale and relaxation variation into account, which enhances the relative comparability between DMUs. The analysis results obtained by traditional DEA methods usually show that multiple DEAs are evaluated as effective. At this time, it is impossible to distinguish the efficiency differences between these DMUs. Therefore, Andersen et al. [56] further established the super-efficiency model to cope with this situation. The advantage of this model is that the calculated efficiency of effective DMU can be greater than 1, which improves the accuracy of the calculation results.
This article combines the research method of super-efficient DEA to construct a non-radial, non-directed SEBM model that considers undesired outputs based on the EBM model. See Equation (1) for details.
where * is the optimal efficiency, is the indicator weight, is the key parameter, b is the undesired output, q is the count of undesired outputs, and s and n are the numbers of outputs and inputs, respectively.
The EBM model measures only the efficiency value that changes due to changes in technical efficiency. However, with the passage of time, the influence of technological advancement on efficiency cannot be ignored. Thus, when technical advancement becomes the major driver of productivity gains, a static analysis that only includes technical efficiency is incomplete. Therefore, to better demonstrate the dynamic change procedure of GTI efficiency, this paper further introduces the GML index and decomposes it into a technology advancement indicator and a technical efficiency indicator. The frontier reference of the GML index is determined by calculating the mean value across all periods, so this method can overcome the defect that the classical Malmaquist index cannot analyze the connection between efficiency values in dissimilar periods. Combined with the SEBM model, the GML index model is constructed as follows:
GML is the change indicator of GTI efficiency under global reference, EC is the pure technical efficiency change indicator from n to n + 1, and TC is the technology advancement indicator from n to n + 1. When GML > 1, the GTI efficiency indicates a positive growth tendency from period n to n + 1; when GML = 1, the GTI efficiency remains unchanged from period n to n + 1; when GML < 1, the GTI efficiency indicates a negative decline tendency from period n to n + 1. The same pattern of change exists for EC and TC.
3.2. QCA Method
Qualitative comparative analysis (QCA) is a multiple-logical analysis method that combines qualitative and quantitative analysis. This method takes a Boolean operation as the underlying operation logic, divides the research objects into different groups, makes a comparative analysis of each group, finds the differences and common points among the groups, and finally explores the causal relationship and mechanism of the research objects. The multivariate configuration analysis of QCA is based on three hypotheses: concurrent causality, equivalence, and asymmetry. Multiple concurrent causalities mean that there are multiple causes in a cause combination, and a particular cause combination is not necessarily the only way to cause such a result. Equivalence means that multiple paths may produce the same result. Asymmetry means that the cause of the result is different from that of the result, and the conditions that work in one configuration may not work in other configurations or may work in the opposite way. The QCA method can be divided into three types: clear set (csQCA), multivalued set (mvQCA), and fuzzy set (fsQCA). The antecedent conditions and the resulting values of clear sets need to be calibrated to dichotomous variables of 0 and 1. A multivalued set allows conditions and results to be multivalued variables based on a clear set. The fuzzy sets allow the calibration of set scores and calibrate cases to membership scores between 0 and 1 to deal with the problem of degree and membership.
However, traditional QCA is mostly applied to cross-sectional data and cannot explore the time longitudinal configuration effect. GTI is a complex and continuous activity process, and the interaction between cause and effect and time cannot be fully explained by cross-sectional grouping alone. Therefore, this study combines traditional fsQCA with dynamic QCA to analyze the panel data on GTI efficiency and explore the configuration relationship under the space–time effect. Different from traditional QCA, dynamic QCA can be measured in three dimensions: inter-group, intra-group, and aggregate. The consistency distance is used to capture the degree of variation in consistency in the time dimension and the case dimension.
4. Data and Indicator Measures
According to the accuracy and availability of the data, panel data from 30 Chinese provinces and cities (except Tibet) from 2016 to 2020 were picked as the research target in this article. The data were acquired from the CSMAR database and China’s official statistical yearbooks.
4.1. Measure of the Outcome Variable
GTI is a complex system that includes factor inputs, innovative outputs, and environmental benefits. Therefore, this study establishes the GTI efficiency evaluation system at three levels: technology production, economic enhancement, and environmental benefits. This study introduces environmental pollution as an undesirable output and focuses on the core connotations of “green” and “innovation”. Based on this, the evaluation indexes of the multidimensional input and output of GTI efficiency are constructed, and GTI efficiency is measured more objectively and accurately. Table 2 shows the established input–output indicator system.
Table 2.
GTI efficiency indicator system.
Input indexes for GTI activities are considered in three dimensions: human capital, financial, and energy inputs. Human capital investment is usually expressed in terms of full-time equivalent R&D personnel, which refers to the actual number of personnel participating in R&D activities. It is an internationally comparable indicator developed specifically for comparing scientific and technical manpower investments [57]. R&D investment funds are mainly allocated to the expenditure associated with developing new products and transforming technology [58]. Total energy consumption in the industry reflects the energy input, which includes the consumption of different energy types [59].
The output indicators of GTI activities are considered in terms of expected output and unexpected output. Expected outputs include economic and technical benefits. GDP per capita objectively measures the overall economic changes of provinces or regions [60]. Furthermore, the ability of each region to make profits through innovation activities can be measured by the sales income of new products [47]. Therefore, economic efficiency can be expressed by two indicators: GDP per capita and new product sales revenue.
Considering the lag time difference arising from the filing and granting of patents, the number of patents authorized is more in line with the index requirements of the technological innovation process. Most of the literature measures technological output through the number of patents [31]. Patents are divided into utility model patents, design patents, and invention patents. Among them, invention patents are the core indicators that reflect the possession of independent intellectual property rights in the international arena. At the same time, the number of patents granted is a more intuitive reflection of the actual results of technological innovation than the number of patent applications. Therefore, the technological output is measured by the number of invention patents granted in this paper [32].
For undesired output, scholars usually use industrial “three waste” emissions, including industrial emissions of exhaust gas, industrial solid waste, and industrial wastewater emissions [61]. Based on the availability of data, industrial waste gas emissions are replaced by industrial SO emissions in this paper. Due to the continuous improvement of the synthetic usage ratio of industrial solid waste in recent years, it has been able to reach 100% utilization efficiency, so the discharge of industrial solid waste is not considered. Therefore, the final unintended outputs chosen in this paper are industrial SO emissions as well as wastewater emissions.
4.2. Measures of the Antecedent Condition
Based on the pluralistic co-governance theory, this study explores the synergistic effects of five antecedents on GTI efficiency from the three levels of government, market, and society, including environmental regulation, government subsidies, opening up to the outside world, market competition, and social participation. The specific measurements are as follows.
Environmental regulation. Environmental regulation refers to the regulations and policies formulated by the government or other public agencies to protect the environment and prevent environmental pollution and ecological damage. In this paper, we refer to Shang et al. [46] and use the investment in environmental pollution control as a proxy variable for environmental regulation through the share of GDP.
Government subsidy. Government subsidies for GTI activities include direct means of financial support as well as indirect means, such as tax relief, the provision of low-interest loans, and the provision of energy resources. Since the indirect approach is difficult to quantify, this study borrows the measurement method of Zhu et al. [62] and measures it by the proportion of government input funds in the internal expenses of local R&D activities.
Openness. Opening up to the outside world achieves its own economic development and social progress by promoting international exchange, cooperation, and resource allocation. The higher the foreign investment, the deeper the level of exploitation of markets and resources. This paper refers to Wang’s [63] research on foreign investment as a percentage of GDP to measure the degree of openness to the outside world.
Market competition. The number of industrial enterprises above the scale can reflect market competition, so this paper refers to Hou and Chen’s [64] study to use it as a proxy indicator of market competition.
Public participation. The environmental petition is a way for the public to report environmental problems and conditions to the government or other relevant departments, which can report the degree of public participation in environmental supervision. Environmental petitions usually include written letters, telephone calls, and the Internet. The public can reflect environmental problems to the government or environmental organizations through these channels. In this paper, we refer to the measurement of Ge et al. [65] to measure public participation through regional environmental petition matters.
4.3. Calibration
In the QCA approach, calibration is a critical step in assigning case data to an ensemble affiliation [66]. Conventional measurements are made mainly by ranking the data size of the measured indicators to derive the relative position height. However, the position of the corresponding values may change to high or low due to changes in the overall level of the studied cases. Furthermore, the calibration criterion can solve the problem by determining the fuzzy set of specific cases and converting the quantitative index into an aggregate affiliation. By setting three anchor points of complete affiliation, intersection, and complete disaffiliation, the cases are attributed to the corresponding set of variables and given affiliation degrees from 0 to 1. We draw on existing theories and research to calibrate the outcome and condition variables using the direct calibration method [67]. The three calibration points of fully affiliated, crossover, and fully unaffiliated were set as the 75%, 50%, and 5% quartiles of the descriptive statistics of the sample, respectively. The calibration anchor points are shown in Table 3.
Table 3.
Calibration result.
5. Data Analysis and Discussion
5.1. GTI Efficiency Level in China
We used MAX-DEA Ultra 9.0 software to calculate the values of GTI efficiency in 30 provinces and cities on the Chinese mainland from 2016 to 2020 through SEBM models containing undesired outputs. The trends in GTI efficiency during the inspection period in China are represented in Figure 2. It can be clearly seen that the efficiency values show an N-shaped trend of increasing, then decreasing, and then increasing. Among them, 2019–2020 showed substantial growth, indicating that GTI efficiency shows a positive development trend. However, on the whole, China’s GTI efficiency is not high, so it is necessary to study its upgrading path.
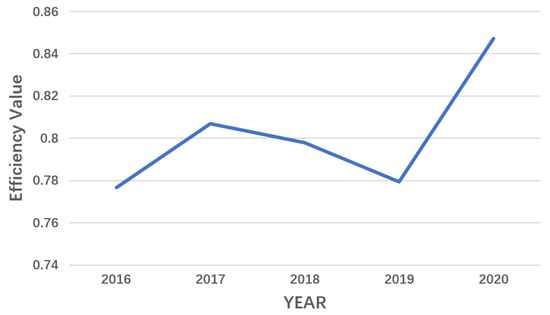
Figure 2.
GTI efficiency trends.
The GTI efficiency measured based on the SEBM model is the technical efficiency of different DMUs in the same specific period, only for the technological progress in this period, and is a static efficiency. However, GTI is a long-term, continuous process, and technological progress in this process will have an impact on efficiency values. Therefore, measuring only by the SEBM model cannot reflect the dynamic changes in the continuous development of efficiency during the examined period. To further grasp the dynamic changes in GTI efficiency in China, this study measured them by applying the GML indicator. It is further broken down into the technological advancement indicator and the technical efficiency indicator. The outcomes are displayed in Table 4. At the national level, the average GML value during the examined years was greater than 1, manifesting that China’s GTI efficiency is on the rise. In terms of the decomposition indicator, the mean value of the technological advancement indicator is 1.011, and the mean score of the technical efficiency indicator is 1.025. This indicates that although the improvement of technological advancement and technical efficiency have jointly improved the GTI efficiency in China, the latter is the key propulsion power affecting the improvement of efficiency. China has achieved remarkable results in the scientific allocation and economical and efficient use of resources in recent years.
Table 4.
GML indicator value of GTI efficiency.
5.2. Analysis of the Necessity of Individual Conditions
Before analyzing the condition grouping, the necessity of individual conditions needs to be checked one by one. This step aims to identify the extent to which the multivariate histories explain the outcome variables. If a condition is necessary to produce a certain result, then this condition will appear in a path consisting of multiple conditions. It then needs to fully analyze the conditions that cannot be necessary on their own and use Bourg’s simplification to identify conditional configurations that are more powerful in explaining the case. We use RStudio software to analyze the necessity of a single condition of GTI efficiency in China and calculate the inter-group and intra-group consistency distances, respectively. The results are shown in Table 5.
Table 5.
Analysis of necessary conditions.
The conventional fsQCA’s necessary condition analysis focuses on observing the consistency scores of the antecedent conditions relative to the results. The scores are commonly interpreted as the significance of the coefficients in the regression statistical analysis. Conditional variables with a consistency score above 0.9 are regarded as necessary for the results [68]. In the dynamic QCA analysis, we introduced inter-group and inter-group consistency distances to observe the existence of fluctuations in consistency levels in the temporal and spatial dimensions. In the panel data analysis, when the consistency distance is less than 0.2, the summary consistency accuracy is high and can be directly used as a basis for judgment [69]. On the contrary, when the consistency distance is greater than 0.2, the necessity needs to be further explored. From the test results, it is clear that the aggregate consistency of the four conditional variables of environmental regulation, government subsidies, market competition, and public participation affecting high or non-high GTI efficiency does not exceed 0.9. Their inter-group and intra-group consistency distances are also less than 0.2. This demonstrates that these factors are not necessary conditions for the outcome variable. Although the pooled consistency for the antecedent condition of openness is less than 0.9, there is an inter-group consistency distance greater than 0.2, which needs to be further examined. Table 6 demonstrates the inter-group consistency and coverage of openness and GTI efficiency. It can be revealed that in all three situations, the level of consistency is less than 0.9 for all years, so there is no necessary relationship. Although in situation 1, the opening presents a clear time effect for non-high GTI efficiency and the necessity increases year by year, it still does not meet the criteria of the necessity condition. In summary, every single antecedent condition did not meet the necessary conditions to affect high or non-high GTI efficiency, so the effect of conditional grouping on GTI efficiency ought to be further explored.
Table 6.
Inter-group data with consistency distance greater than 0.2.
5.3. Sufficiency Analysis of Conditional Grouping
The goal of fsQCA group analysis is to identify the sets of antecedent conditions that lead to the existence of results, that is, which combinations are sufficient conditions that can lead to high or non-high GTI efficiency. When performing configuration analysis, thresholds are set to distinguish whether the configuration meets conformance requirements. Referring to the setting criteria of most literature, this study sets the original consistency threshold to 0.8 to assure the explanatory power of the histories, the PRI threshold to 0.7 to remove the interference of simultaneous subset relations, and the case frequency threshold to 1 [70]. The target of this study is 30 provinces in China, and the geographical conditions and resources vary greatly among provinces, so it is impossible to uniformly judge the role of antecedent conditions on the outcome variables. Therefore, to avoid inappropriate assumptions affecting the comprehensiveness and scientificity of the research findings, this paper does not make any counterfactual combinations of artificial assumptions. Complex solutions, intermediate solutions, and simple solutions are generated during the configuration analysis. The complex solution is generated by streamlining the truth table without using any logical remainder term, and this solution does not change the condition settings. The parsimonious solution uses all logistic residuals but does not assess the plausibility of the logistic residuals. The solution identifies the key antecedent variables, and the analysis results are not influenced by the researcher’s assumptions. Intermediate solutions are solutions between complex and parsimonious solutions that do not allow the necessary conditions to be eliminated during the analysis and incorporate a meaningful logical remainder. We finally report the intermediate solution to reserve the necessary conditions. Among them, the conditions that emerge in both the simple solution and the intermediate solution are the core conditions, and the conditions that appear only in the intermediate solution are the edge conditions [71].
5.3.1. Aggregated Results
Table 7 reveals the results of the grouping analysis for the five conditional implementations of high and non-high GTI efficiency, with each column representing one possible conditional grouping. It can be noticed that the total consistency of high GTI efficiency is 0.928, indicating that 92.8% of the cases meeting this four-condition grouping show high GTI efficiency. The consistency of the four groupings ranged from 0.874 to 0.935 and the original coverage ranged from 0.194 to 0.358, demonstrating that the combination of conditions analyzed above is highly convincing for the outcome variables. The mechanisms of four different groupings leading to high GTI efficiency are detailed below and summarized into different enhancement paths.
Table 7.
Results of the configuration analysis.
Type 1: government–market-driven path. Based on the empirical results, it can be seen that the “government–market-driven” path can be subdivided into “government-supported–external-market driven” and “government–internal-market driven”. At the level of “government-supported–external-market driven”, Configuration H1a reveals high openness, non-high environmental regulation, and non-high public participation as core conditions, complementary high government subsidies as marginal conditions, and no significant role of market competition can contribute to high GTI efficiency. This configuration indicates that in provinces where environmental regulation and public participation are weak, the GTI efficiency can be promoted by strengthening the extent of openness to the outside world and ensuring some government subsidies. Under the government’s supervision and support, the external market can better play its leading role, forming a new pattern of having a government and market open to reasonably promote GTI efficiency. Financial support from the government can reduce the cost of innovation and strengthen independent R&D capabilities. In this context, some provinces are actively implementing opening up to the outside world to improve the efficiency of innovation through government subsidies, and thus, enhance international competitiveness, and gain more investment opportunities in a broader market. A typical example of this configuration is Shanghai. Shanghai, as the country’s leading province in opening up to the outside world, has been making efforts to innovate the foreign investment management system and continuously liberalize foreign access areas; moreover, it has promoted the city’s green development by guiding foreign investment to high-tech, low-energy, and low-pollution industrial sectors. In 2016, the Green Technology Bank was piloted in Shanghai, taking up the mission of industrial innovation, landing transformation, and international transfer of green technology. In recent years, the Green Technology Bank has been promoting international green technology transfer and building international, collaborative green technology innovation alliances. Shanghai gathers international and domestic innovation resources, strengthens innovation synergy, and promotes GTI efficiency development through active external opening measures. At the level of “government–internal-market driven”, Configuration H1b shows that high environmental regulation, high market competition, and non-high public participation are core conditions, complementary high government subsidies are marginal conditions, and no significant role of external openness can lead to high GTI efficiency. Specifically, in a more competitive market environment, even when public participation is not highly motivated, relying on strong government environmental regulation and financial support also achieves high GTI efficiency in a province. With government environmental regulations guiding and restricting, mature competitive market mechanisms can drive the allocation of factor resources to environmentally friendly firms, allowing firms that conform to the green development orientation to capture a larger market share. Appropriate government subsidies effectively broaden the financing channels for corporate innovation, reduce financing costs as well as R&D risks, and provide protection for corporate GTI. The representative city on this path is Tianjin. In 2019, the Tianjin ecological environmental protection regulations were implemented. The regulations strengthened environmental supervision and management and imposed stricter requirements on ecological and environmental supervision and protection. Tianjin actively carried out carbon trading after the launch of the carbon emissions trading pilot in 2013. In 2020, the city’s carbon market trading volume reached 29.09 million tons, ranking second in the country and first in the northern region.
Type 2: market–society-driven path. Configuration H2 indicated high external openness, high market competition, and non-high government subsidies as core conditions, complementary high public participation as marginal conditions, and no significant role of environmental regulation can lead to high GTI efficiency. The grouping emphasizes the significance of market factors. For provinces with weak government subsidies, maintaining a high degree of openness to the outside world can also promote GTI efficiency in a highly competitive market environment. To gain market advantages over the competition, enterprises will be more active in introducing more advanced international technology and experience by opening up to the outside world to meet market demand. At this point, public supervision of the green behavior of enterprises further promotes the green development of enterprises. The coverage of this grouping is the highest among the four groupings, with Guangdong, Fujian, and Jiangsu as representative provinces. Take Guangdong Province as an example: the province actively improves market-oriented GTI efficiency technology. It explores the establishment of a reasonable public environmental letter channel, plays the role of the public’s participation and supervision of green behavior, and promotes green development.
Type 3: government–market–society synergistic promotion path. Configuration H3 shows that high environmental regulation, high openness to the outside world, high public participation, and non-high government subsidies are the core conditions where market competition does not play a significant role and can lead to high GTI efficiency. This grouping suggests that provinces with weak government funding can achieve an increase in GTI efficiency with the help of an active open-door policy with reasonable environmental regulation and social supervision. Under the supervision of the government and society, government support is strengthened to create a highly open and competitive market environment. In this way, we will increase the enthusiasm of provinces to carry out GTI activities and create a multibody collaborative governance model to promote green development. One of the provinces that conforms to this grouping is Zhejiang. In recent years, Zhejiang Province has been actively building an open economic system and has increased its efforts to introduce and support foreign-owned environmental companies. More outstanding environmental technologies and enterprises are encouraged to settle in Zhejiang. Zhejiang Province has signed cooperation agreements on environmental protection and sustainable development with many regions and countries at home and abroad, strengthening external exchanges while promoting environmental regulation. In addition, the Zhejiang government strengthened environmental information disclosure and social supervision mechanisms, establishing the “Zhejiang Province Environmental Status Bulletin” and other platforms to publish environmental information. Moreover, the province has encouraged the public to actively participate in environmental monitoring, complaints, and reports. These measures have synergistically promoted the development of GTI efficiency in Zhejiang.
After the discussion of the four grouping paths, further observation reveals that there are still some intrinsic relationships among government, market, and society in collaborating to achieve high GTI efficiency. First, market factors have a universal effect. In three of the four enhancement paths, high external openness is considered a core condition; actively introducing, digesting, and absorbing advanced international green technologies and enhancing market vitality are conducive to strengthening corporate GTI behavior and improving GTI efficiency to a large extent. Second, there is a substitution relationship between government and social factors. Both high government management and high social participation can achieve high GTI efficiency in the presence of high market conditions. Although the government and society are managed differently, both play a strong regulatory role. The government is responsible for macro-control, guiding the formation of a regulated GTI efficiency system through environmental regulation, incentive policies, and other means. Furthermore, with the increase in public consciousness of environmental protection and the improvement of the petition system, social supervision has also played a role in the green behavior of enterprises.
This paper not only examines high GTI efficiency groupings, but also explores the groupings that lead to non-high GTI efficiency. The total consistency of non-high GTI efficiency is 0.883, and the consistency of both types of grouping is greater than 0.8, which can be regarded as a sufficient condition for the generation of non-high GTI efficiency. Configuration N1 shows high external openness, non-high environmental regulation, and non-high public participation as core conditions, complementary non-high market competition as a marginal condition, and no significant role of government subsidies resulting in non-high GTI efficiency. This means that in the absence of effective government regulation and social supervision, high GTI efficiency cannot be achieved by opening up to the outside world alone. This multifactor scarcity is not conducive to the development of GTI efficiency. Configuration N2 shows that high environmental regulation, non-high external openness, non-high market competition, and high public participation as core conditions and complementary high government subsidies as marginal conditions can lead to non-high GTI efficiency. Specifically, high GTI efficiency cannot be reached solely through the coordination and cooperation of the government and the public, without the participation of the market as the main body. It also proves once again the necessity of market factors. In summary, high GTI efficiency cannot be accomplished with only a single condition or lack of market participation, so an effective combination of government, market, and society is essential.
5.3.2. Inter-Group Results
To further observe whether there is a time effect for each path, we plotted images of the trend of consistency between groups, as shown in Figure 3. It can be detected that the consistency level of all four paths fluctuates above 0.75 in 2016–2020, which is a benign deviation. Among them, “government support–external-market driven” and “government–internal-market driven” have small and relatively stable changes, and there is no significant time effect. This demonstrates that these two elevation paths have consistently had excellent explanatory strength over the years examined. China has been insisting on building a green technology innovation development system that is a combination of being government-led and market-led, providing strong support to promote the green transformation of the development mode. The consistency of “market–society driven” continues to move higher during 2016–2020, indicating an increasing strength of explanation for the high GTI efficiency achieved through this path. This is closely related to the increase in public awareness of environmental protection. In recent years, with the popularity of environmental education and social media, the public’s awareness of ecological civilization has been increasing, and the whole society is actively involved in the supervision of ecological environmental protection. The ever-improving complaint and petition channels also provide a convenient and effective way for social supervision. The consistency of “government–market–society synergistic promotion” shows a decreasing and then increasing trend, with the turning point in 2019. The path has a relatively high strength of interpretation in 2020. During 2020, China will actively promote environmental protection, play the governance functions of government, society, and market, enhance the coordination of the main functions of GTI, and promote green development.
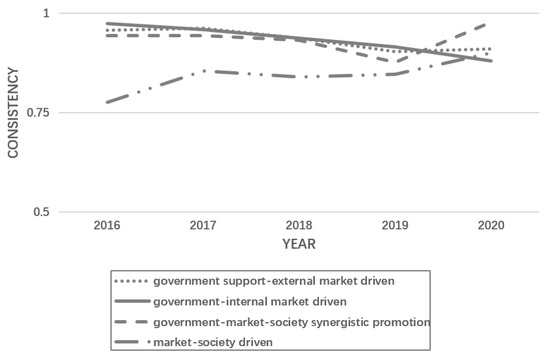
Figure 3.
Inter-group consistency changes between groups.
5.3.3. Intra-Group Results
QCA has not yet developed a measure specifically for regional differences in the groupings. Therefore, we use the KW test to explore whether there are significant differences in the coverage distribution of each path in the eastern, central, and western regions. The results of the test are shown in Table 8. It can be seen that the p-value of the configuration H1a test result is less than 0.05, and thus, that the statistical result is significant, indicating that there is a significant difference in configuration H1a in different regions. While the p-values of the configuration H1b, configuration H2, and configuration H3 test results are greater than 0.05, the statistical results are not remarkable, demonstrating that there are no significant disparities between different regions on these three paths.
Table 8.
Kruskal–Wallis test results.
As shown in Table 9, after calculating the mean value of configuration coverage in each region, we can find that there are regional differences in the spatial distribution of cases, as explained by Configuration H1a. The explanatory cases corresponding to this configuration are mainly distributed in the central region. Since the implementation of the strategy for the rise of the central region, the government has actively increased financial investment in science and technology and broadened funding channels for science and technology innovation. Moreover, it has provided financial support to eligible enterprises through the establishment of a special fund for green technology development. It has also adopted tax incentives and other measures to encourage enterprises to invest in GTI and promote its application. The government has also issued several policies to support the energy conservation and environmental protection industries. These include subsidies for technology development and promotion of environmental protection enterprises and financial support for energy conservation and environmental protection projects. These policies have been introduced to provide strong support for the innovative advancement of the energy-saving and environmental protection industries in the central region. In recent years, to accelerate the process of high-level opening up, the central region has built a business environment that attracts high-quality foreign investment and a new system of export-oriented economy, creating a new plateau of inland opening up with a higher level of opening up. Moreover, the region has begun to actively participate in the “Belt and Road” international cooperation to create a new model of high-level inland opening without the sea, not along the border. Additionally, it has aimed to overcome technical difficulties through international cooperation and provide a broader platform for GTI. Therefore, for the central region, the coordinated effect of high external opening and high government subsidies is more likely to promote the improvement of GTI efficiency.
Table 9.
Regional path coverage mean.
6. Conclusions and Enlightenments
6.1. Conclusions
With the gradual advancement of China’s economic system of “Green, Low-carbon, and Circular development”, GTI has been increasingly regarded as the main force to promote green development. What exactly are the multiple concurrent causalities and multiple pathways of GTI efficiency is the top priority of current research. Based on the pluralistic co-governance theory, this paper investigates the joint effect of the government, market, and society on China’s GTI efficiency from a configuration perspective to discover its driving path. Through theoretical discussion and empirical analysis, the main research conclusions of this paper are shown in Table 10.
Table 10.
Research conclusions based on empirical results.
6.2. Research Contributions
(1) Based on the pluralistic co-governance theory, the driving roles of government, market, and society on GTI efficiency are simultaneously explored, extending the study of GTI efficiency drivers. Previous studies have focused more on policy and market factors when exploring the drivers of GTI efficiency while neglecting the influence of social factors. With the development of society, awareness of public supervision is increasing, and more and more people are involved in GTI through letters and visits. Therefore, this study introduces public participation as a social factor, which not only extends the study of external drivers of GTI efficiency, but also provides support for the joint role of government, market, and society.
(2) The study perspective is broadened by exploring the drivers of GTI efficiency from the configuration perspective. Most previous studies have focused only on the effects of single factors on GTI efficiency, ignoring the interrelationships and interactions among these factors. It was found that multiple factors together had a greater impact on GTI efficiency compared to single factors, which is consistent with Wang et al. [72] and Zhang et al. [73]. This study further explores how government, market, and society can synergistically link up to promote GTI efficiency and advance the sustainable development of technological innovation.
(3) The study of the drivers of GTI efficiency using the dynamic QCA approach enriches the research methodology. Previous studies have mostly used the fsQCA method to explore the factors influencing GTI efficiency, making it difficult to explore the longitudinal group effects over time. This study further analyzes the time effects of the driving paths by using panel data. It also combines the KS test to explore the spatial differences of driving paths and provide a basis for the selection of driving paths.
6.3. Contributions
This study obtains the following contributions:
(1) The synergistic mechanism of GTI governance subjects should be strengthened and GTI efficiency should be effectively enhanced through the benign coupling of government, market, and society. The government should give full play to its driving role and strengthen top-level design, strengthen environmental supervision, and continuously improve environmental quality. Moreover, it should increase market financial support to enhance the vitality of technological innovation from an input perspective. Provinces should strengthen their opening up to the outside world and improve the internationalization of GTI. Moreover, they should accelerate the cultivation of a variety of innovation subjects, relying on the innovation subject of scientific and technological research and development and the transformation of results to promote technological progress. Provinces should improve environmental information disclosure and its feedback mechanism to improve the effectiveness and scientific nature of public participation in environmental reasoning. Moreover, they should promote more effective public participation in environmental governance by establishing a good mechanism for interaction between the public and local environmental authorities.
(2) The GTI should be conducted according to local conditions. GTI activities should be carried according to local conditions, as different provinces have different resource endowments and location conditions. With reference to the four types of paths to generate high GTI efficiency, each region needs to choose a suitable path based on local conditions combined with their own. The “government support–external-market-driven” path can be adopted when the region has low social participation in environmental regulation but is highly open to the outside world. Regions with a better internal market environment can adopt a “government–internal-market-driven” path by increasing government support and supervision. The “government–market–society-synergistic-promotion” path requires the region to actively coordinate the three governance bodies, each with its own role, to jointly promote green development. Government departments can enhance the flexibility of the market through decentralization and fulfill their leading role of social supervision and participation to achieve high efficiency through a “market–society-driven” path.
6.4. Limitations and Prospects
This study has a few limitations. First, this study constructs a theoretical framework of the drivers of GTI efficiency through the pluralistic co-governance theory, but there are still other factors that have not been paid attention to. Moreover, the drivers selected in this study are all external influencing factors, and the internal influencing factors are not explored. Future research can then enrich the external influencing factors and investigate how internal and external factors can synergistically affect GTI efficiency. Secondly, although this study explored the synergistic paths and their temporal effects through dynamic QCA, the spatial effects were still investigated with the help of other methods. The exploration of dynamic QCA methods in terms of spatial effects should be optimized in the future. Finally, this study only stops at the provincial level and fails to refine the analysis to the city level. In future studies, further refinement can be made in terms of regions to make synergistic pathways more targeted.
Author Contributions
Conceptualization, S.R. and X.F.; methodology, S.R.; software, S.R. and Y.L.; validation, S.R. and X.F.; formal analysis, Y.L. and X.F.; investigation, S.R. and X.F.; resources, Y.L. and X.F.; data curation, S.R.; writing—original draft preparation, S.R.; writing—review and editing, X.F.; visualization, Y.L.; supervision, X.F.; project administration, X.F.; funding acquisition, X.F. All authors have read and agreed to the published version of the manuscript.
Funding
The research was funded by the National Natural Science Foundation China (NSFC) (project number: 71703012), the Basic Research Project of Higher Education Institutions of Liaoning Province (project number: J202106) (project number: J2020084), and the Liaoning Province Economic and Social Development Research Topic (project number: 2023lsljdybkt-001).
Institutional Review Board Statement
Not applicable.
Informed Consent Statement
Not applicable.
Data Availability Statement
Not applicable.
Conflicts of Interest
The authors declare no conflict of interest.
References
- Iqbal, A.; Tang, X.; Jahangir, S.; Hussain, S. The dynamic nexus between air transport, technological innovation, FDI, and economic growth: Evidence from BRICS-MT countries. Environ. Sci. Pollut. Res. 2022, 29, 68161–68178. [Google Scholar] [CrossRef]
- Lan, S.; Hu, H. Research on the coupling relationship between manufacturing technology innovation and energy consumption based on intelligent algorithms. J. Therm. Anal. Calorim. 2021, 144, 1689–1696. [Google Scholar] [CrossRef]
- Ren, B. From China’s economic growth miracle to high-quality economic development. Rev. Political Econ. 2022, 13, 3–34. [Google Scholar]
- Zhang, J.; Ouyang, Y.; Ballesteros-Pérez, P.; Li, H.; Philbin, S.P.; Li, Z.; Skitmore, M. Understanding the impact of environmental regulations on green technology innovation efficiency in the construction industry. Sustain. Cities Soc. 2021, 65, 102647. [Google Scholar] [CrossRef]
- Braun, E.; Wield, D. Regulation as a means for the social control of technology. Technol. Ana.l Strateg. Manag. 1994, 6, 259–272. [Google Scholar] [CrossRef]
- Peneder, M.; Arvanitis, S.; Rammer, C.; Stucki, T.; Wörter, M. Policy instruments and self-reported impacts of the adoption of energy saving technologies in the DACH region. Empirica 2022, 49, 369–404. [Google Scholar] [CrossRef] [PubMed]
- Kemp, R.; Smith, K.; Becher, G. How Should We Study the Relationship between Environmental Regulation and Innovation? Springer: Berlin/Heidelberg, Germany, 2000. [Google Scholar]
- Hellström, T. Dimensions of environmentally sustainable innovation: The structure of eco-innovation concepts. Sustain. Dev. 2007, 15, 148–159. [Google Scholar] [CrossRef]
- Wang, M.; Li, Y.; Li, J.; Wang, Z. Green process innovation, green product innovation and its economic performance improvement paths: A survey and structural model. J. Environ. Manag. 2021, 297, 113282. [Google Scholar] [CrossRef] [PubMed]
- Zhang, Y.; Hu, H.; Zhu, G.; You, D. The impact of environmental regulation on enterprises’ green innovation under the constraint of external financing: Evidence from China’s industrial firms. Environ. Sci. Pollut. Res. 2022, 30, 42943–42964. [Google Scholar] [CrossRef]
- Yin, S.; Zhang, N.; Li, B. Improving the effectiveness of multi-agent cooperation for green manufacturing in China: A theoretical framework to measure the performance of green Technology innovation. Int. J. Environ. Res. Public Health 2020, 17, 3211. [Google Scholar] [CrossRef]
- Yao, J.; Li, H.; Shang, D. Review of green technology innovation research and practical enlightenment. Ecol. Econ. 2020, 36, 49–56+113. [Google Scholar]
- Li, X.; Guo, F.; Xu, Q.; Wang, S.; Huang, H. Strategic or substantive innovation? The effect of government environmental punishment on enterprise green technology innovation. Sustain. Dev. 2023. [Google Scholar] [CrossRef]
- Liu, L.; Zhang, Z.; Wang, Z.; Xu, J. Health evaluation and key influencing factor analysis of green technological innovation system. Environ. Sci. Pollut. Res. 2022, 29, 77482–77501. [Google Scholar] [CrossRef] [PubMed]
- Behera, P.; Sethi, N. Nexus between environment regulation, FDI, and green technology innovation in OECD countries. Environ. Sci. Pollut. Res. 2022, 29, 52940–52953. [Google Scholar] [CrossRef]
- Li, M.; Gao, X. Implementation of enterprises’ green technology innovation under market-based environmental regulation: An evolutionary game approach. J. Environ. Manag. 2022, 308, 114570. [Google Scholar] [CrossRef] [PubMed]
- Xu, G.; Tao, M. How can management ability promote green technology innovation of manufacturing enterprises? Evidence from China. Front. Environ. Sci. 2023, 10, 2103. [Google Scholar]
- Wang, P.; Dong, C.; Chen, N.; Qi, M.; Yang, S.; Nnenna, A.B.; Li, W. Environmental regulation, government subsidies, and green technology innovation—A provincial panel data analysis from China. Int. J. Environ. Res. Public Health 2021, 18, 11991. [Google Scholar] [CrossRef] [PubMed]
- Wang, M.; Li, Y.; Liao, G. Research on the impact of green technology innovation on energy total factor productivity, based on provincial data of China. Front. Environ. Sci. 2021, 9, 710931. [Google Scholar] [CrossRef]
- Zhang, R.; Kong, G.; Sun, H. Can New-Type Urbanization Promote Enterprise Green Technology Innovation?—A Study Based on Difference-in-Differences Model. Sustainability 2023, 15, 6147. [Google Scholar] [CrossRef]
- Wang, Q.; Wang, Z. DEA-Malmquist-based measurement of green technology innovation efficiency in China’s manufacturing industry. Technol. Plaza 2023, 222, 65–78. [Google Scholar] [CrossRef]
- Li, D.; Zhong, C. Research on the Efficiency Calculation and Influencing Factors of Green Technology Innovation in Industrial Enterprises Based on DEA-Tobit Model: A Case Study of Hubei Province. J. Shanghai Econ. Manag. Cadre Coll. 2021, 19, 30–41. [Google Scholar] [CrossRef]
- Wang, H.; Yang, T. Research on the Efficiency and Influencing Factors of Green Technology Innovation in Biomass Power Generation Enterprises: Based on Bootstrap DEA Method Testing. Res. Sci. Technol. Manag. 2021, 41, 191–198. [Google Scholar]
- Zhu, Y.; Wang, Z.; Qiu, S.; Zhu, L. Effects of environmental regulations on technological innovation efficiency in China’s industrial enterprises: A spatial analysis. Sustainability 2019, 11, 2186. [Google Scholar] [CrossRef]
- Luo, Q.; Miao, C.; Sun, L.; Meng, X.; Duan, M. Efficiency evaluation of green technology innovation of China’s strategic emerging industries: An empirical analysis based on Malmquist-data envelopment analysis index. J. Clean. Prod. 2019, 238, 117782. [Google Scholar] [CrossRef]
- Xu, X.; Zhou, Q.; Chen, X.; Li, Y.; Jiang, Y. The Efficiency of Green Technology Innovation and Its Influencing Factors in Wastewater Treatment Companies. Separations 2022, 9, 263. [Google Scholar] [CrossRef]
- Zhang, Y.; An, Y.; Wang, Y. Evaluation of Green Industry Innovation Efficiency Based on Three-Stage DEA Model: A Case Study of Chinese Information Technology Industry. Sustainability 2023, 15, 6368. [Google Scholar] [CrossRef]
- Du, J.l.; Liu, Y.; Diao, W.x. Assessing regional differences in green innovation efficiency of industrial enterprises in China. Int. J. Environ. Res. Public Health 2019, 16, 940. [Google Scholar] [CrossRef] [PubMed]
- Jie, H. Overall optimization model of efficiency and performance of green technology innovation. Sustain. Comput. Inform. Syst. 2021, 30, 100501. [Google Scholar] [CrossRef]
- Peng, Y.; Fan, Y.; Liang, Y. A green technological innovation efficiency evaluation of technology-based smes based on the undesirable sbm and the malmquist index: A case of Hebei province in China. Sustainability 2021, 13, 11079. [Google Scholar] [CrossRef]
- Zhang, L.; Ma, X.; Ock, Y.S.; Qing, L. Research on regional differences and influencing factors of Chinese industrial green technology innovation efficiency based on dagum gini coefficient decomposition. Land 2022, 11, 122. [Google Scholar] [CrossRef]
- Shen, W.; Shi, J.; Meng, Q.; Chen, X.; Liu, Y.; Cheng, K.; Liu, W. Influences of environmental regulations on industrial green technology innovation efficiency in China. Sustainability 2022, 14, 4717. [Google Scholar] [CrossRef]
- Xie, Y.; Zhou, L. Asssessing the Green Technology Innovation Efficiency in Yangtze River Delta Region under Dual Carbon Background. Processes 2023, 11, 1082. [Google Scholar] [CrossRef]
- Tian, Z.; Wang, R.; Xiao, Q.; Ren, F. Research on the Efficiency of Green Technology Innovation in Advanced Manufacturing Industry in the Yangtze River Delta Region. J. Anhui Norm. Univ. (Humanit. Soc. Sci. Ed.) 2021, 49, 137–147. [Google Scholar] [CrossRef]
- Chen, W.; Pan, L.; Lin, C.; Zhao, M.; Li, T.; Wei, X. Efficiency evaluation of green technology innovation of China’s industrial enterprises based on SBM model and EBM model. Math. Probl. Eng. 2021, 2021, 6653474. [Google Scholar] [CrossRef]
- Wu, G.; Xu, Q.; Niu, X.; Tao, L. How does government policy improve green technology innovation: An empirical study in China. Front. Environ. Sci. 2022, 9, 723. [Google Scholar] [CrossRef]
- Ma, R.; Li, F.; Du, M. How does environmental regulation and digital finance affect green technological innovation: Evidence from China. Front. Environ. Sci. 2022, 10, 782. [Google Scholar] [CrossRef]
- Wang, X.; Chai, Y.; Wu, W.; Khurshid, A. The Empirical Analysis of Environmental Regulation’s Spatial Spillover Effects on Green Technology Innovation in China. Int. J. Environ. Res. Public Health 2023, 20, 1069. [Google Scholar] [CrossRef]
- Hu, Y.; Dai, X.; Zhao, L. Digital finance, environmental regulation, and green technology innovation: An Empirical Study of 278 Cities in China. Sustainability 2022, 14, 8652. [Google Scholar] [CrossRef]
- Fang, Y.; Shao, Z. Whether green finance can effectively moderate the green technology innovation effect of heterogeneous environmental regulation. Int. J. Environ. Res. Public Health 2022, 19, 3646. [Google Scholar] [CrossRef]
- Yi, M.; Fang, X.; Wen, L.; Guang, F.; Zhang, Y. The heterogeneous effects of different environmental policy instruments on green technology innovation. Int. J. Environ. Res. Public Health 2019, 16, 4660. [Google Scholar] [CrossRef]
- Luo, Y.; Salman, M.; Lu, Z. Heterogeneous impacts of environmental regulations and foreign direct investment on green innovation across different regions in China. Sci. Total Environ. 2021, 759, 143744. [Google Scholar] [CrossRef]
- Bao, Q.; Chai, H. Environmental Regulation, Financial Resource Allocation, and Regional Green Technology Innovation Efficiency. Discret. Dyn. Nat. Soc. 2022, 2022, 7415769. [Google Scholar] [CrossRef]
- Liu, P.; Zhang, L.; Tarbert, H.; Yan, Z. Analysis on spatio-temporal characteristics and influencing factors of industrial green innovation efficiency—From the perspective of innovation value chain. Sustainability 2022, 14, 342. [Google Scholar] [CrossRef]
- Li, T.; Liang, L.; Han, D. Research on the efficiency of green technology innovation in China’s provincial high-end manufacturing industry based on the RAGA-PP-SFA model. Math. Probl. Eng. 2018, 2018, 9463707. [Google Scholar] [CrossRef]
- Shang, L.; Tan, D.; Feng, S.; Zhou, W. Environmental regulation, import trade, and green technology innovation. Environ. Sci. Pollut. Res. Int. 2022, 29, 12864–12874. [Google Scholar] [CrossRef] [PubMed]
- Liu, C.; Gao, X.; Ma, W.; Chen, X. Research on regional differences and influencing factors of green technology innovation efficiency of China’s high-tech industry. J. Comput. Appl. Math. 2020, 369, 112597. [Google Scholar] [CrossRef]
- Guo, H.; Xie, Z.; Wu, R. Evaluating green innovation efficiency and its socioeconomic factors using a slack-based measure with environmental undesirable outputs. Int. J. Environ. Res. Public Health 2021, 18, 12880. [Google Scholar] [CrossRef] [PubMed]
- Song, W.; Han, X. The bilateral effects of foreign direct investment on green innovation efficiency: Evidence from 30 Chinese provinces. Energy 2022, 261, 125332. [Google Scholar] [CrossRef]
- Xu, Y.; Ren, Z.; Li, Y.; Su, X. How does two-way FDI affect China’s green technology innovation? Technol. Anal. Strateg. Manag. 2023, 1–20. [Google Scholar] [CrossRef]
- Liu, T.; Wang, Y.; Zhou, W. The impact of stock liquidity on green technology innovation of new energy enterprises: Evidence from China. Environ. Dev. Sustain. 2023, 1–24. [Google Scholar] [CrossRef]
- Hu, D.; Jiao, J.; Tang, Y.; Han, X.; Sun, H. The effect of global value chain position on green technology innovation efficiency: From the perspective of environmental regulation. Ecol. Indic. 2021, 121, 107195. [Google Scholar] [CrossRef]
- Yang, Y.; Liu, D.; Zhang, L.; Yin, Y. Social trust and green technology innovation: Evidence from listed firms in China. Sustainability 2021, 13, 4828. [Google Scholar] [CrossRef]
- Zhao, L.; Zhang, L.; Sun, J.; He, P. Can public participation constraints promote green technological innovation of Chinese enterprises? The moderating role of government environmental regulatory enforcement. Technol. Forecast. Soc. Chang. 2022, 174, 121198. [Google Scholar] [CrossRef]
- Tone, K.; Tsutsui, M. An epsilon-based measure of efficiency in DEA—A third pole of technical efficiency. Eur. J. Oper. Res. 2010, 207, 1554–1563. [Google Scholar] [CrossRef]
- Andersen, P.; Petersen, N.C. A procedure for ranking efficient units in data envelopment analysis. Manag. Sci. 1993, 39, 1261–1264. [Google Scholar] [CrossRef]
- Wang, Y.; Wu, D.; Li, H. Efficiency measurement and productivity progress of regional green technology innovation in China: A comprehensive analytical framework. Technol. Anal. Strateg. Manag. 2021, 34, 1432–1448. [Google Scholar] [CrossRef]
- Xiang, D.; Chen, J.; Tripe, D.; Zhang, N. Family firms, sustainable innovation and financing cost: Evidence from Chinese hi-tech small and medium-sized enterprises. Technol. Forecast. Soc. Chang. 2019, 144, 499–511. [Google Scholar] [CrossRef]
- Zeng, S.; Li, G.; Wu, S.; Dong, Z. The impact of green technology innovation on carbon emissions in the context of carbon neutrality in China: Evidence from spatial spillover and nonlinear effect analysis. Int. J. Environ. Res. Public Health 2022, 19, 730. [Google Scholar] [CrossRef]
- Shen, T.; Li, D.; Jin, Y.; Li, J. Impact of Environmental Regulation on Efficiency of Green Innovation in China. Atmosphere 2022, 13, 767. [Google Scholar] [CrossRef]
- Fan, F.; Lian, H.; Liu, X.; Wang, X. Can environmental regulation promote urban green innovation Efficiency? An empirical study based on Chinese cities. J. Clean. Prod. 2021, 287, 125060. [Google Scholar] [CrossRef]
- Zhu, L.; Luo, J.; Dong, Q.; Zhao, Y.; Wang, Y.; Wang, Y. Green technology innovation efficiency of energy-intensive industries in China from the perspective of shared resources: Dynamic change and improvement path. Technol. Forecast. Soc. Chang. 2021, 170, 120890. [Google Scholar] [CrossRef]
- Wang, C. How openness to foreign investment affects green Total factor productivity. Econ. Manag. Rev. 2021, 37, 138–149. [Google Scholar] [CrossRef]
- Hou, J.; Chen, H. Research on the performance and driving factors of green transformation of technology innovation in China’s high patent-intensive manufacturing industry. Manag. Rev. 2018, 30, 141–155. [Google Scholar] [CrossRef]
- Ge, T.; Hao, X.; Li, J. Effects of public participation on environmental governance in China: A spatial Durbin econometric analysis. J. Clean. Prod. 2021, 321, 129042. [Google Scholar] [CrossRef]
- Zhang, M.; Du, Y. Application of QCA in organization and management research: Orientation, strategy and direction. J. Manag. 2019, 16, 1312–1323. [Google Scholar]
- Ragin, C.C.; Fiss, P.C. Net effects analysis versus configurational analysis: An empirical demonstration. Redesigning Soc. Inq. Fuzzy Sets Beyond 2008, 240, 190–212. [Google Scholar]
- Schneider, M.R.; Schulze-Bentrop, C.; Paunescu, M. Mapping the institutional capital of high-tech firms: A fuzzy-set analysis of capitalist variety and export performance. J. Int. Bus. Stud. 2010, 41, 246–266. [Google Scholar] [CrossRef]
- Garcia-Castro, R.; Ariño, M.A. A general approach to panel data set-theoretic research. J. Adv. Manag. Sci. Inf. Syst. 2016, 2, 526. [Google Scholar]
- Du, Y.; Liu, Q.; Cheng, J. What kind of business environment produces high entrepreneurial activity in cities?—An analysis based on institutional configuration. Manag. World 2020, 36, 141–155. [Google Scholar] [CrossRef]
- Fiss, P.C. Building better causal theories: A fuzzy set approach to typologies in organization research. Acad. Manag. J. 2011, 54, 393–420. [Google Scholar] [CrossRef]
- Wang, B.; Chen, H.; Ao, Y.; Liao, F. Spatiotemporal Differentiation and Influencing Factors of Green Technology Innovation Efficiency in the Construction Industry: A Case Study of Chengdu–Chongqing Urban Agglomeration. Buildings 2022, 13, 73. [Google Scholar]
- Mingkai, Z.; Xinlan, C.; Guangming, Y. Coupling coordination degree and influencing factors of green science and technology innovation efficiency and digital economy level: Evidence from provincial panel data in China. Front. Environ. Sci. 2023, 11, 1104078. [Google Scholar] [CrossRef]


Disclaimer/Publisher’s Note: The statements, opinions and data contained in all publications are solely those of the individual author(s) and contributor(s) and not of MDPI and/or the editor(s). MDPI and/or the editor(s) disclaim responsibility for any injury to people or property resulting from any ideas, methods, instructions or products referred to in the content. |
© 2023 by the authors. Licensee MDPI, Basel, Switzerland. This article is an open access article distributed under the terms and conditions of the Creative Commons Attribution (CC BY) license (https://creativecommons.org/licenses/by/4.0/).