Article

Revisiting Tourism Development and Economic Growth: A Framework for Configurational Analysis in Chinese Cities

1
School of Tourism Management, Guilin Tourism University, Guilin 541006, China
2
Asean Tourism Research Centre of China Tourism Academy, Guilin Tourism University, Guilin 541006, China
*
Author to whom correspondence should be addressed.
Sustainability 2023, 15(13), 10000; https://doi.org/10.3390/su151310000
Submission received: 22 May 2023 / Revised: 22 June 2023 / Accepted: 23 June 2023 / Published: 24 June 2023

Abstract

:
This paper comparatively analyzes the sufficiency and necessity of tourism’s influence on economic growth in different cities from a systematic configurational perspective. Two important time points in China’s tourism development, 2010 and 2019, are also considered in this paper to explore whether the impact of tourism on urban economic growth is temporally heterogeneous. The results demonstrate that tourism is not necessary for urban economic growth. However, the dependence on the tourism economy plays an important role in several urban economic growth patterns. Only one tourism-driven economic growth pattern exists, where tourism drives economic growth led by investment, and this pattern did not change significantly from 2010 to 2019. A tourism-driven low economic growth model also suggests that a high dependence on tourism leads to low economic growth. Two tourism-constrained low economic growth patterns exist: investment–industrial structure tourism-constrained and investment–innovation tourism-constrained. These two patterns indicate that economic growth rates are difficult to increase if the tourism economy is underdeveloped. In addition, tourism-driven or -constrained economic growth patterns have specific spatial clustering characteristics. This paper argues that tourism should actively seek foreign capital utilization and fixed asset investment, and also constantly reduce its independence and blur its industrial boundaries to better integrate or link with other industries to play its economic growth role. Furthermore, city policymakers should be fully aware of their own (tourism) resource endowment and the internal and external environment changes to choose a suitable economic growth model.

1. Introduction

Urban tourism is a fundamental component of the global tourism industry and holds a crucial position in achieving sustainable development. Consequently, the relationship between urban tourism and economic growth represents an essential aspect of sustainable tourism studies. The positive impact of tourism on regional economic growth has been a prevalent topic in numerous studies [1,2,3,4,5,6]. Such findings provide a solid theoretical basis for promoting tourism at the local level. However, relying solely on statistical significance could lead to the false impression that promoting tourism is a quick fix for economic growth, which might lead to a scenario where the dependence on tourism as the primary source of income results in sluggish growth or a limited level of economic advancement [7]. This scenario is particularly noticeable in China, where urban data indicate a noticeable gap between the level of urban economic expansion and tourism dependence in the region.
For example, the degree of tourism specialization (measured by the proportion of total tourism revenue to GDP) in economically advanced cities such as Guangzhou and Shenzhen were merely 18.85% and 6.37%, respectively, in 2019, whereas prominent destinations such as Huangshan and Guilin exhibited high tourism specialization rates of 80.62% and 89.00%, though their per capita GDPs were only ¥57,853 and ¥41,294. The economic growth rates of 6.54% and 7.74% in Huangshan and Guilin are comparable to the 6.80% in Guangzhou and 6.70% in Shenzhen in 2019. However, certain cities with a specialization in tourism, such as Hezhou and Lijiang (with growth rates of 11.80% and 9.9%, respectively), have notably higher figures (The information in this section was obtained from the 2019 statistical bulletin on national economic and social development for every city.).
Based on the theoretical perception that tourism promotes economic growth, this paper aims to clarify what kind of tourism development can promote economic growth or under what context tourism can promote economic growth. That is, the sufficiency of tourism development for economic growth and its contextual dependence. Is tourism development necessary for economic growth, and how necessary is it? The two questions correspond to two typical variable relationships in social science research: necessity and sufficiency [8]. From an established econometric perspective, the influence of tourism on economic development can be viewed as average effects. While this has significant value in guiding macroeconomic decisions, it may not always fully reflect the nuances of specific cases. Therefore, it is imperative to establish a clear connection between tourism and economic development through a comparative examination of diverse instances, necessitating the exploration of alternative research methodologies distinct from conventional regression analysis.
This paper employs the methodology of fuzzy-set qualitative comparative analysis (fsQCA). This method involves analyzing various cases and examining how the antecedent variables affect the outcome variables and their corresponding solutions (i.e., configuration). This approach takes into account the unique characteristics of each case [9]. The configuration is characterized by a combination of different antecedent variables, yielding a symbiotic, commensal, or competitive relationship between the variables. This approach is additionally appropriate for examining the necessity of antecedent factors for the outcome variable. Therefore, the application of the fsQCA methodology can effectively address the questions of necessity and sufficiency mentioned before. In measurement of necessity, there is a quantitative evaluation, along with the fsQCA approach. In contrast to the fsQCA approach, which is a qualitative test of necessity, the necessity condition analysis (NCA) technique can quantitatively assess the degree of necessity between variables [10]. As a result, it has become increasingly popular for the investigation of necessary relationships. Additionally, the NCA method can gauge the bottleneck level of the antecedent variable, denoting the minimal level the antecedent variable must achieve to produce a specific outcome variable level [11]. For this particular study, the focus is on determining the appropriate level of tourism development that must be met to achieve a specific level of economic growth.
The article introduces two primary innovations. First, this paper diverges from the typical examination of tourism’s average impact on economic growth by instead concentrating on the necessity and sufficiency of tourism in influencing economic growth. Second, this study incorporates the NCA approach with the fsQCA method, effectively addressing the latter’s inadequacy in assessing necessity. This paper makes two theoretical contributions. Firstly, from a configurational perspective, this study extensively and systematically incorporates ecological elements related to tourism and investigates how the coexistence of these elements promotes economic growth in urban areas. It also reveals the various paths through which tourism influences economic growth, as well as the underlying mechanisms and spatial and temporal differences in a symmetrical manner. Secondly, this study investigates whether and to what degree isolated environmental factors related to tourism contribute to urban economic development, thus expanding the current theoretical understanding of the causal relationship between tourism and economic growth.

2. Literature Review
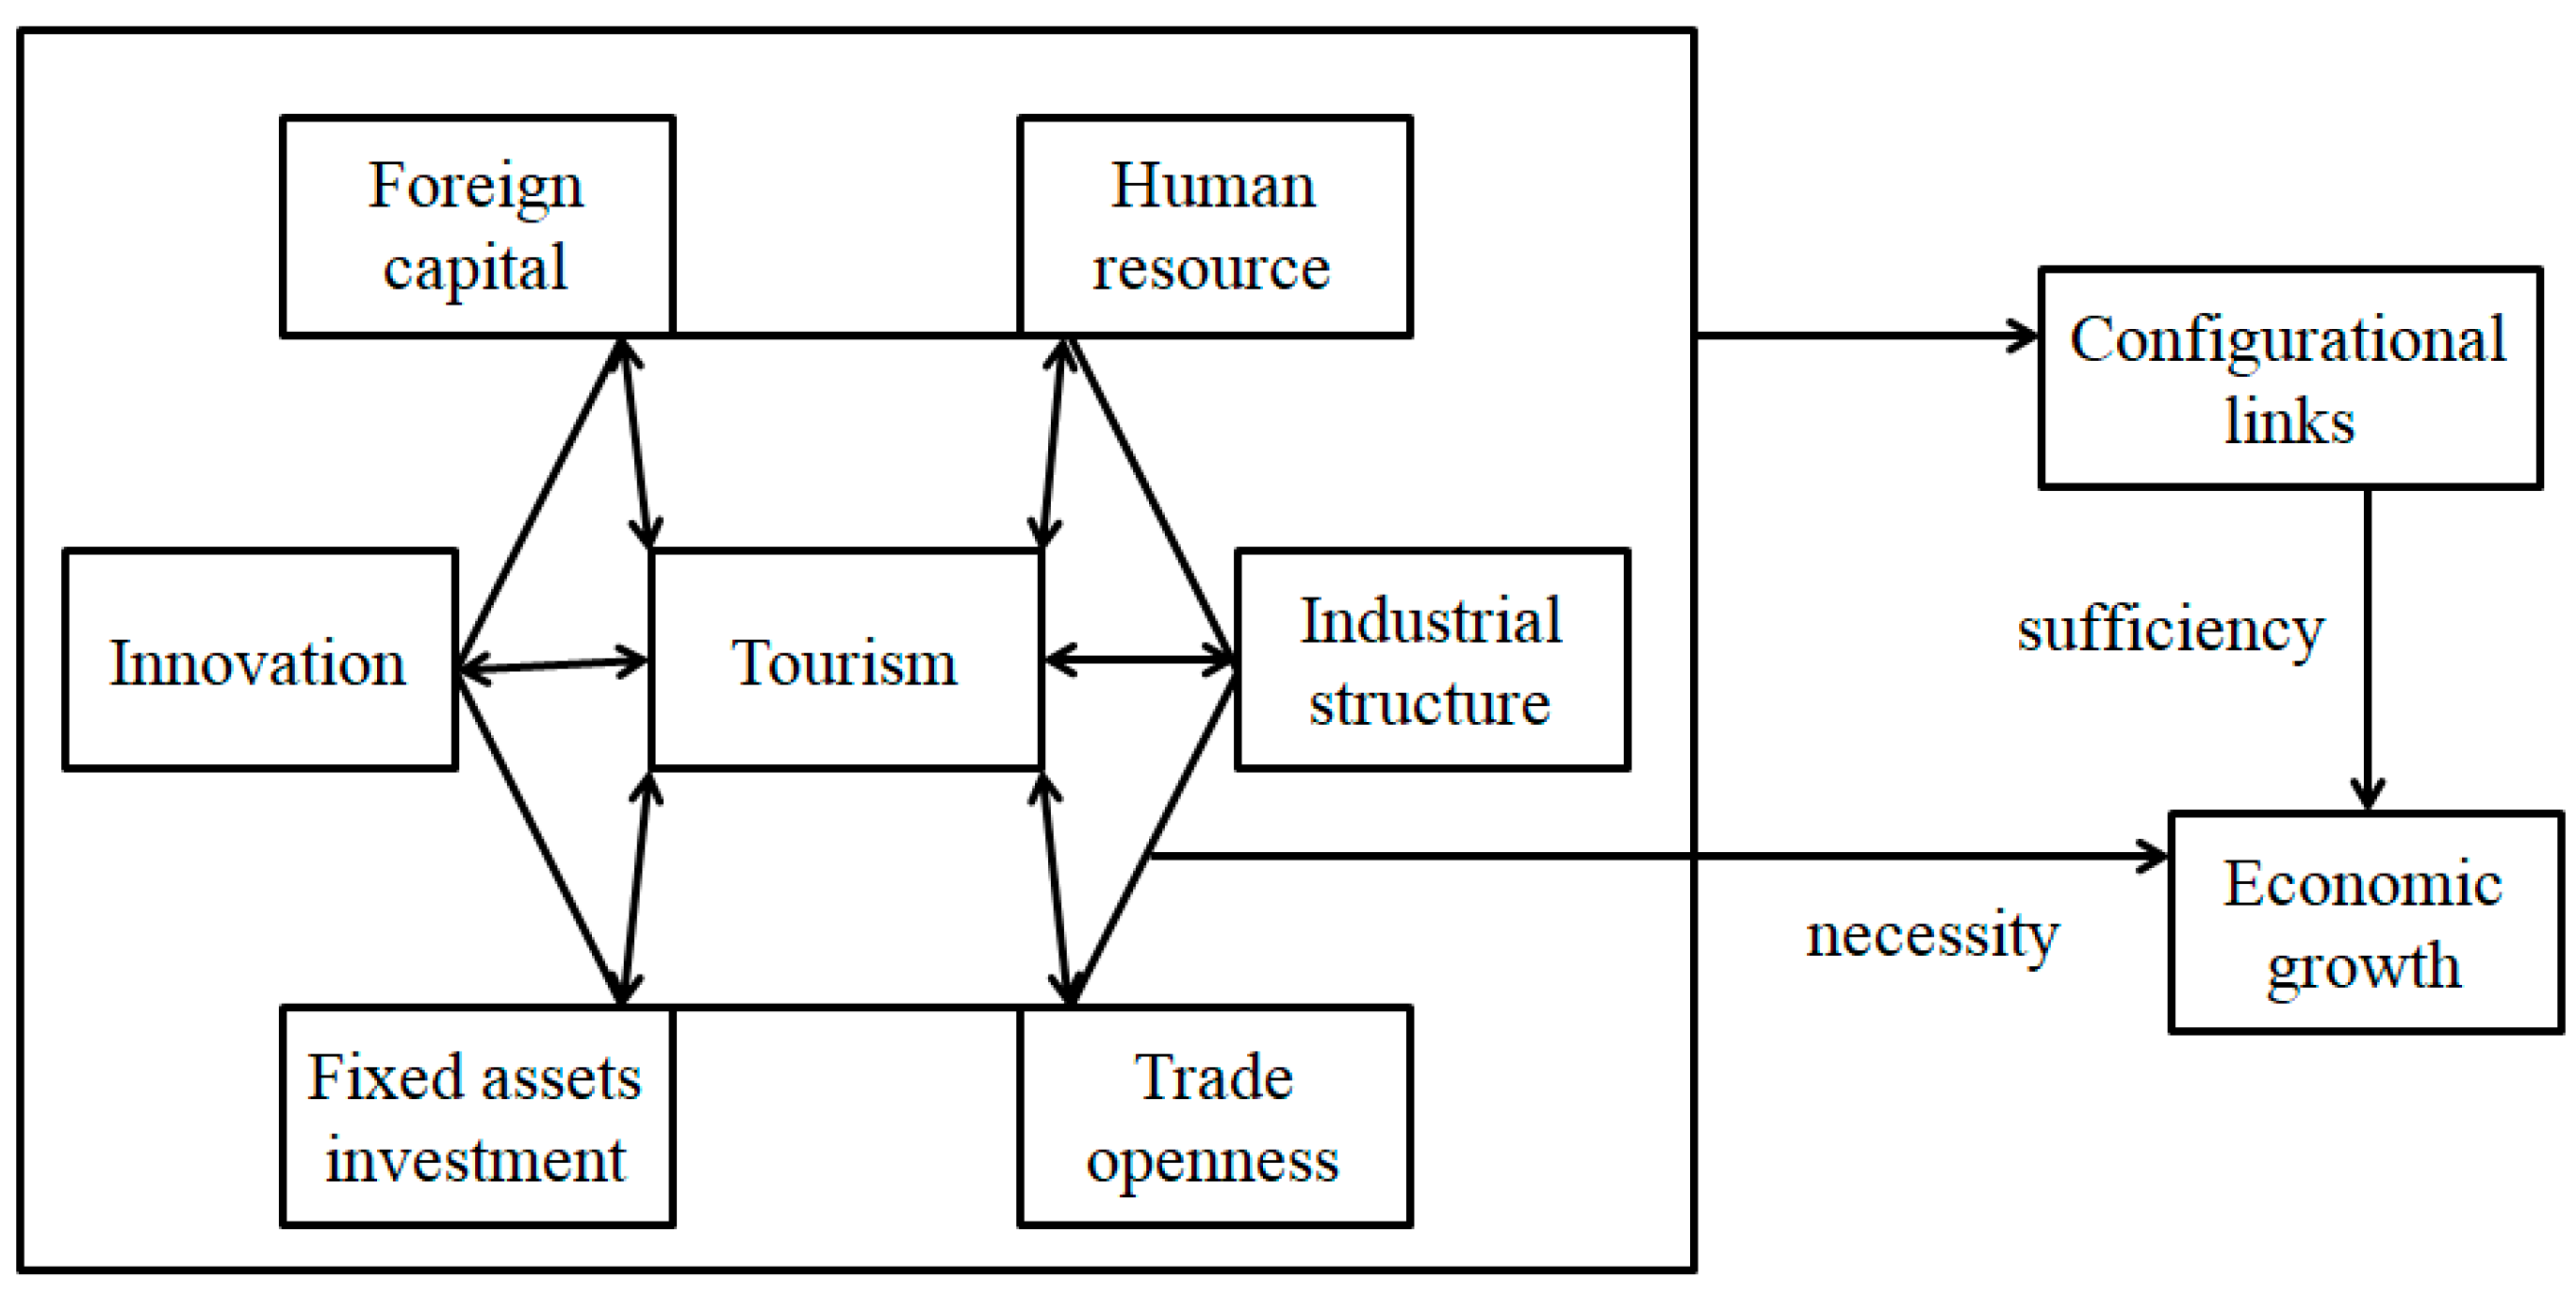
The impact of tourism on regional economic growth has been a prevalent topic in several studies, which have confirmed the positive effects of tourism on economic development [1,2,3,4,5,6]. These studies have also explored the causal relationship between tourism development and economic growth using Granger causality analysis [12,13,14]. However, it has been proved that there is no inevitable positive link between tourism and economic growth. Therefore, the promotion of tourism must involve a holistic approach to achieve sustainable economic growth that is not solely reliant on tourism. As such, the prudent promotion of tourism, coupled with other economic strategies, is necessary to attain sustainable economic development and achieve lasting success in the tourism sector.
According to configuration theory, outcomes result from a combination of factors, and there can be several functionally equivalent paths that lead to high or low outcome variables [15]. The existence of functionally equivalent paths is determined by the manner in which the various elements of the system are integrated. Configuration theory can identify both the shared patterns of outcome generation and the unique aspects of these patterns. Taking into consideration the concept of configuration, the influence of tourism on economic advancement should not merely focus on the tourism industry itself but must also adopt a systemic approach to investigate the synergistic effects of tourism with other significant factors. The diverse impacts of tourism on economic growth are contingent on its interaction with other factors in theory. In summary, configuration theory posits that the complex relationships between economic factors and their fluctuations significantly impact the efficacy of economic systems. However, these connections that involve aspects of necessity, the coupling of multi-condition variables, and asymmetry cannot be adequately examined using standard reductionist research methodologies such as regression analysis.
For instance, the promotion of tourism can improve the destination’s brand reputation and appeal, enhance its level of communication and connectivity, foster the sharing of scientific and technological advancements, and facilitate the attraction of foreign investments [16,17]. Tourism growth can also boost the number of visitors and stimulate related tourism services, diminishing the reliance on conventional agriculture and secondary industries and increasing the portion of tertiary industries, such as services, within the national economy, which, in turn, aids in the enhancement of the industrial structure [18]. Tourism may have a crowding out effect on traditional or other industries due to low barriers to entry for entrepreneurship and employment behavior [19]. Additionally, as tourism is not classified as a science and technology innovation industry [20], it may limit overall innovation capacity in the region and constrain further economic growth. However, the theoretical mechanism underlying the relationship between tourism and market factors, including industrial structure and technological innovation and their systematic impact on regional economic growth, remains unclear. The methodology for configuring tourism environments presents a range of theoretical configurations for different ecologies, providing insight into which configurations may lead to high or low economic growth [21]. Therefore, configuration theory can efficiently support the examination of the intricate sufficiency of tourism’s influence on economic development and its context-specific nature.
In summary, this paper investigates how tourism development can drive economic growth, as analyzed through the framework of configuration theory and employing an integrated approach of fsQCA and NCA methodologies. This paper focuses on two fundamental theoretical inquiries about the necessity and sufficiency of tourism in promoting economic development. The necessity issue concerns whether tourism development is necessary for regional economic growth and how to assess this necessity. The sufficiency query arises within the context of whether tourism can facilitate or hinder economic development—known as the tourism approach for economic growth. Since provincial-level data may overlook intra-regional variations and still be susceptible to the flaws of averaging effects, and county-level data can be hard to acquire, the database used in this paper draws from highly detailed Chinese prefecture-level city data.

3. Methodology

The fsQCA approach is the most popular method among various QCA techniques [22]. The fsQCA method tackles two primary inquiries. One is the necessity of tourism and other antecedent variables for economic growth, and the other is what combination of tourism and other variables can lead to high or low economic growth. This paper employs fsQCA 3.0 software to apply the fsQCA method. The NCA methodology is developed to evaluate the necessity of antecedent factors. It aims to examine hindrances, limitations, and obstacles that impede the realization of desired results. The NCA package, developed by Dul et al. in the R 4.2.1 software [11,13,14], serves as the analysis tool for NCA. According to the results of necessity analysis using fsQCA, the NCA approach enables the validation and further investigation of necessary conditions.
In utilizing the framework of configuration theory, the initial step is to precisely define the boundaries of the system under examination. The topic of this academic research paper identifies tourism as the primary antecedent variable. Furthermore, numerous scholars have pinpointed several crucial factors that greatly impact economic development. The antecedent variables being considered are foreign investment [23,24], innovation [25,26], human resources [27,28], industrial structure [29,30], trade openness [31,32], and fixed asset investment [33,34]. It is vital to note that as economic growth is a complex system, there exist various other factors that significantly impact it, including regional circumstances and the environment. It is pertinent to note that variables are always subject to change, and as such, alterations in local circumstances and the natural environment may not always be noteworthy. Another significant factor is the need to improve decision-making processes, especially as adapting to alterations in the local context and natural environment can prove challenging at decision-making levels. One downside of this research is the limited number of variables available for configuration analysis. An excessive number of variables can result in an overwhelming complexity of possible solutions, whereby the total number of theoretical solutions surpasses the number of actual cases [22]. Ultimately, this paper rigorously identifies seven antecedent variables of economic growth, including tourism, foreign investment, innovation, human resources, industrial structure, trade openness, and fixed asset investment. In line with the configuration theory framework, various complex, symbiotic, and commensal relationships exist among these variables, all of which significantly impact the economic growth performance. In particular, we focus on the potential impact of the complex association between tourism and other antecedent variables on economic growth. The theoretical analysis framework of this paper is illustrated in Figure 1.
Economic growth is commonly measured in terms of GDP per capita [9] and GDP growth rate [35]. Actually, per capita GDP is a better indicator of the level of economic development and does not capture the change over time, whereas GDP growth rate is a better indicator of the impact of policy making on economic development. Thus, this paper employs the GDP growth rate as a measure of economic growth. This paper utilizes the term “tourism specialization” to denote the degree of tourism advancement or development, characterized by the proportion of tourism earnings to GDP [35,36]. This ratio is commonly used to measure tourism specialization in China, as statistical data on tourism value added is limited. Notably, tourism revenue in this study encompasses both inbound and domestic receipts. The paper utilizes a variety of factors to gauge human resources, such as population [37], higher education, and employment [38], represented by urban population density, number of higher education institutions per 100,000 individuals, and year-end employment, respectively. It is obvious that all the three indicators positively affect the level of human resources, so this paper constructs the interaction term of the above three factors to represent the level of human resources.
Innovation is measured by two metrics, namely innovation input and output [38]. Innovation input is gauged by the proportion of scientific input to GDP, while the innovation output is evaluated by the quantity of granted patents [38]. Likewise, innovation input and output have a favorable impact on the degree of innovation. This study creates the interaction term of innovation input and output to depict regional innovation. Foreign trade is typically assessed based on the ratio of imports and exports to GDP [39], while foreign investment is measured by the amount of foreign investment actually used, as indicated by the ratio of such investment to GDP [40]. The primary method for economic development lies in enhancing the share of tertiary industry. As a result, the industrial structure is shaped by the proportion of value added by tertiary industry as compared to that added by secondary industry [41]. Fixed asset investment is measured as the ratio of the amount of fixed assets invested to GDP.
It is important to note that the classical fsQCA approach, despite its unique strengths in necessity and sufficiency analyses, has a natural deficiency in dynamic analysis [42], while economic growth patterns tend to be dynamic. In order to better capture the dynamic changes in the impact of tourism on economic growth, this paper uses a time series fsQCA and NCA approach, i.e., based on homogeneous cases but observing changes in necessity and sufficiency at different points in time. Two time points are identified in this paper: 2010 and 2019. On 25 November 2009, China’s State Council issued the Opinions on Accelerating the Development of Tourism, stating that tourism should be cultivated into a strategic pillar industry of the national economy and a modern service industry that the people are more satisfied with. So, 2010 is an important time for the development of tourism in China. In March 2018, the former Chinese Ministry of Culture and the National Tourism Administration merged into the Ministry of Culture and Tourism, and the administrative mechanism of reform had a huge impact on the development of tourism, thus taking 2019 as the second time point. The examination of landmark tourism development milestones helps to better investigate the impact of tourism and its related variables on economic growth.
Data on tourism revenue for prefecture-level cities are obtained from the 2010 and 2019 national economic and social development statistical bulletins for each city. Data for all other variables are obtained from the 2011 and 2020 China City Statistical Yearbook [43,44]. A total of 272 prefecture-level cities’ variable data are obtained in this paper, and the descriptive statistical results of each variable are shown in Table 1.
Prior to conducting fsQCA analysis, it is essential to calibrate the variable data. The key objective of calibration is to identify the anchor point for each variable. As the variables in this study, such as outcome and antecedent variables, lack theoretical high or low judgment criteria, the article looks to comparable research and utilizes the data percentile as the calibration reference point [38,45]. This paper uses the 95th percentile as the anchor point for fully in, the median as the crossover point, and the 5th percentile as the anchor point for fully out. The calibration anchor points for each variable are shown in Table 2. The calibration outcomes are employed for NCA analysis to enable the comparison of the findings of the necessity analysis.

4. Results

This paper constructs the following fsQCA model.
Economic growth = f (tourism, foreign investment, human resources, innovation, industrial structure, fixed asset investment, import and export)
~Economic growth = f (tourism, foreign investment, human resources, innovation, industrial structure, fixed asset investment, import and export)
where the symbol “~” represents negation or weakness. This paper aims to investigate the necessary and sufficient conditions for high economic growth, as well as those for low or insufficient economic growth.

4.1. Necessity Analysis

In the fsQCA approach, the necessity analysis considers both positive and negative responses of the outcome variable, as well as the presence or absence of the antecedent variable. If the antecedent variable has a consistency of over 0.9, it is deemed necessary for the outcome variable. Table 3 shows that the consistency of the antecedent variables is below 0.9, whether in the context of high or low economic growth. Therefore, neither tourism nor any other individual variable can be considered as necessary for economic growth in both 2010 and 2019. This highlights the fact that economic growth is a complex and multifaceted process, which cannot be attributed to any single indicator alone. Moreover, the current research on the relationship between tourism and economic growth does not fully establish the necessary role of tourism in achieving economic development.
The NCA technique analyzes the necessity through two estimation methods: ceiling regression and ceiling envelopment. Although these two methods are applied to different types of variables (the former for continuous variables and the latter for discrete variables), the results are more robust when the two methods are used together. Therefore, this paper reports the results of the NCA analysis based on both estimation methods. The NCA technique determines the necessity of the antecedent variable by two indicators: effect value and significance. An antecedent condition is generally considered necessary if its effect value is greater than 0.1 while its p-value is less than 0.05. Table 4 shows that the effect values of all variables are below 0.1 in both 2010 and 2019, and only the p-values of human resources and innovation are below 0.05. Therefore, all antecedent variables do not constitute necessary conditions for economic growth, and the results of necessity revealed by the NCA technique are consistent with the fsQCA approach.
Table 5 further reports the results of the bottlenecks analysis levels for 2010 and 2019. The results show that in 2010, 0.6% tourism specialization and no bottlenecks for any other variables were required to achieve 60% economic growth, while 1.0% tourism specialization, 6.7% foreign investment, 1.0% industrial structure, and 1.0% fixed asset investment were required to achieve 100% economic growth and no bottlenecks for any other variables. In 2019, 1.2% of tourism specialization and 0.6% of industrial structure were required to reach 60% of the economic growth level, while 2.0% of tourism specialization, 1.0% of foreign investment, 15.1% of human resources, 38.7% of innovation, 1.0% of industrial structure, and 5.9% of trade openness were required to meet 100% of the economic growth level. The results show a significant increase in the level of bottlenecks of tourism, human resources, innovation, and trade openness for economic growth from 2010 to 2019, although all antecedent variables do not constitute a necessary condition for economic growth.

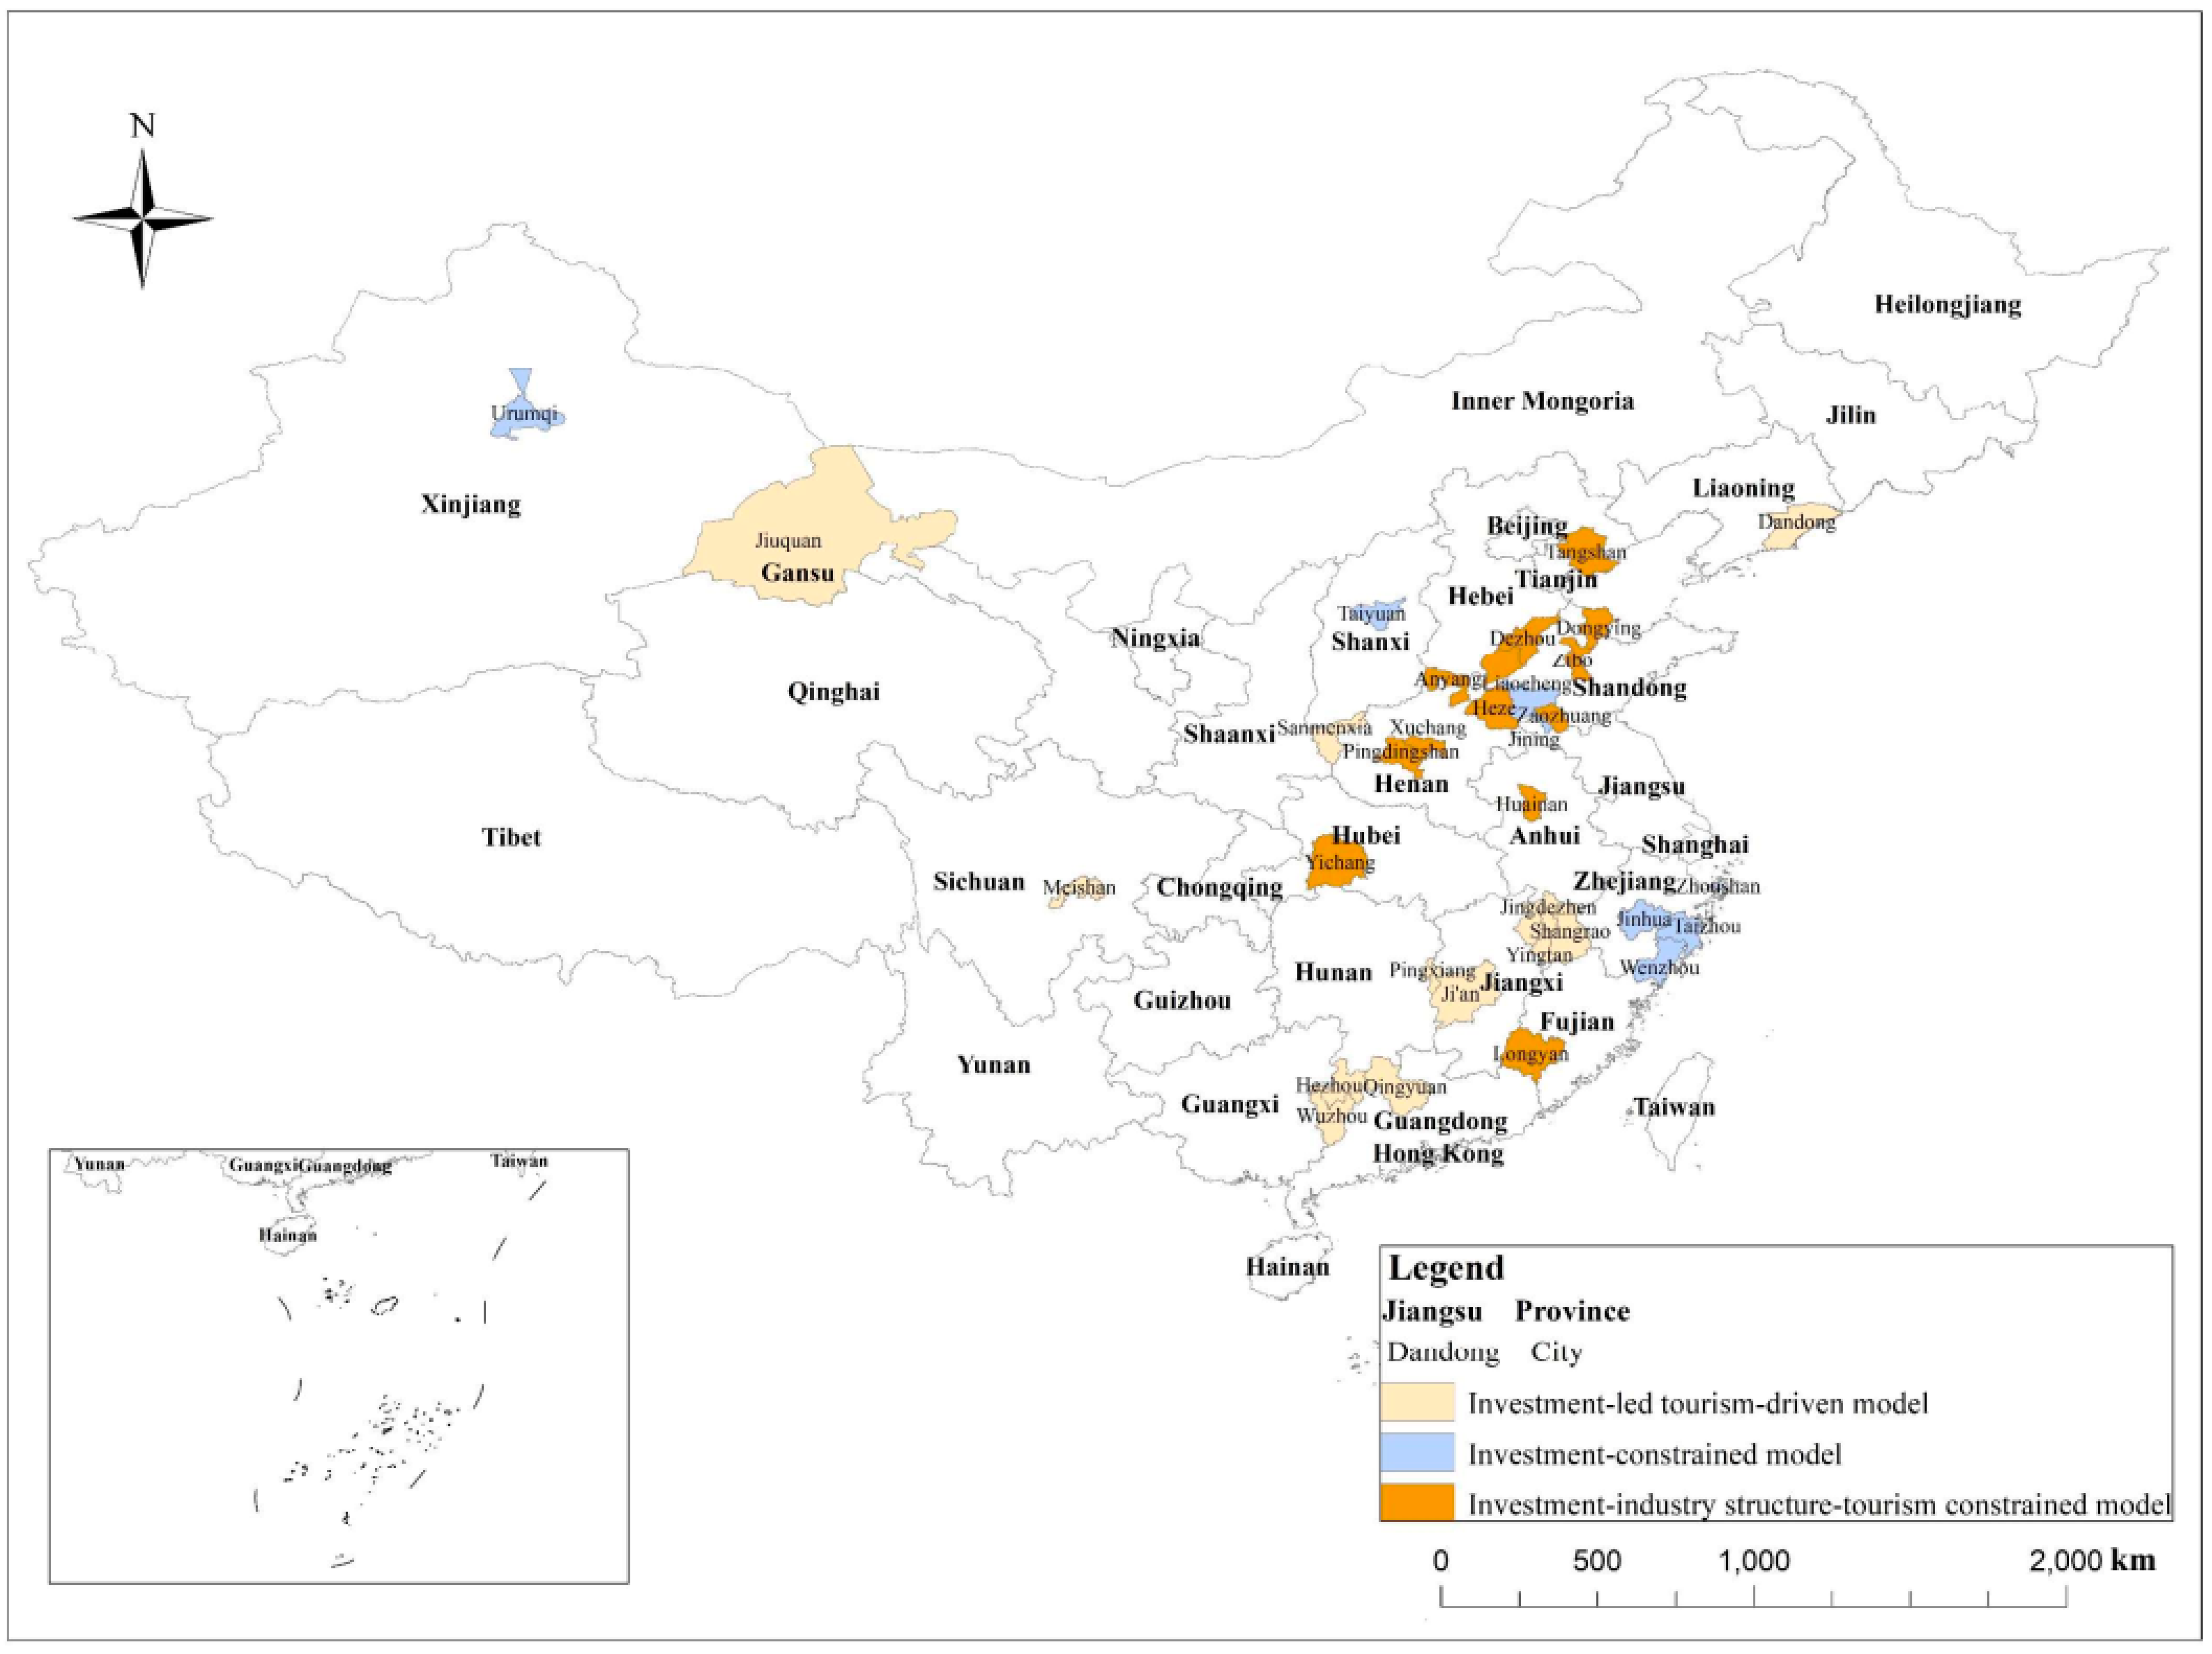
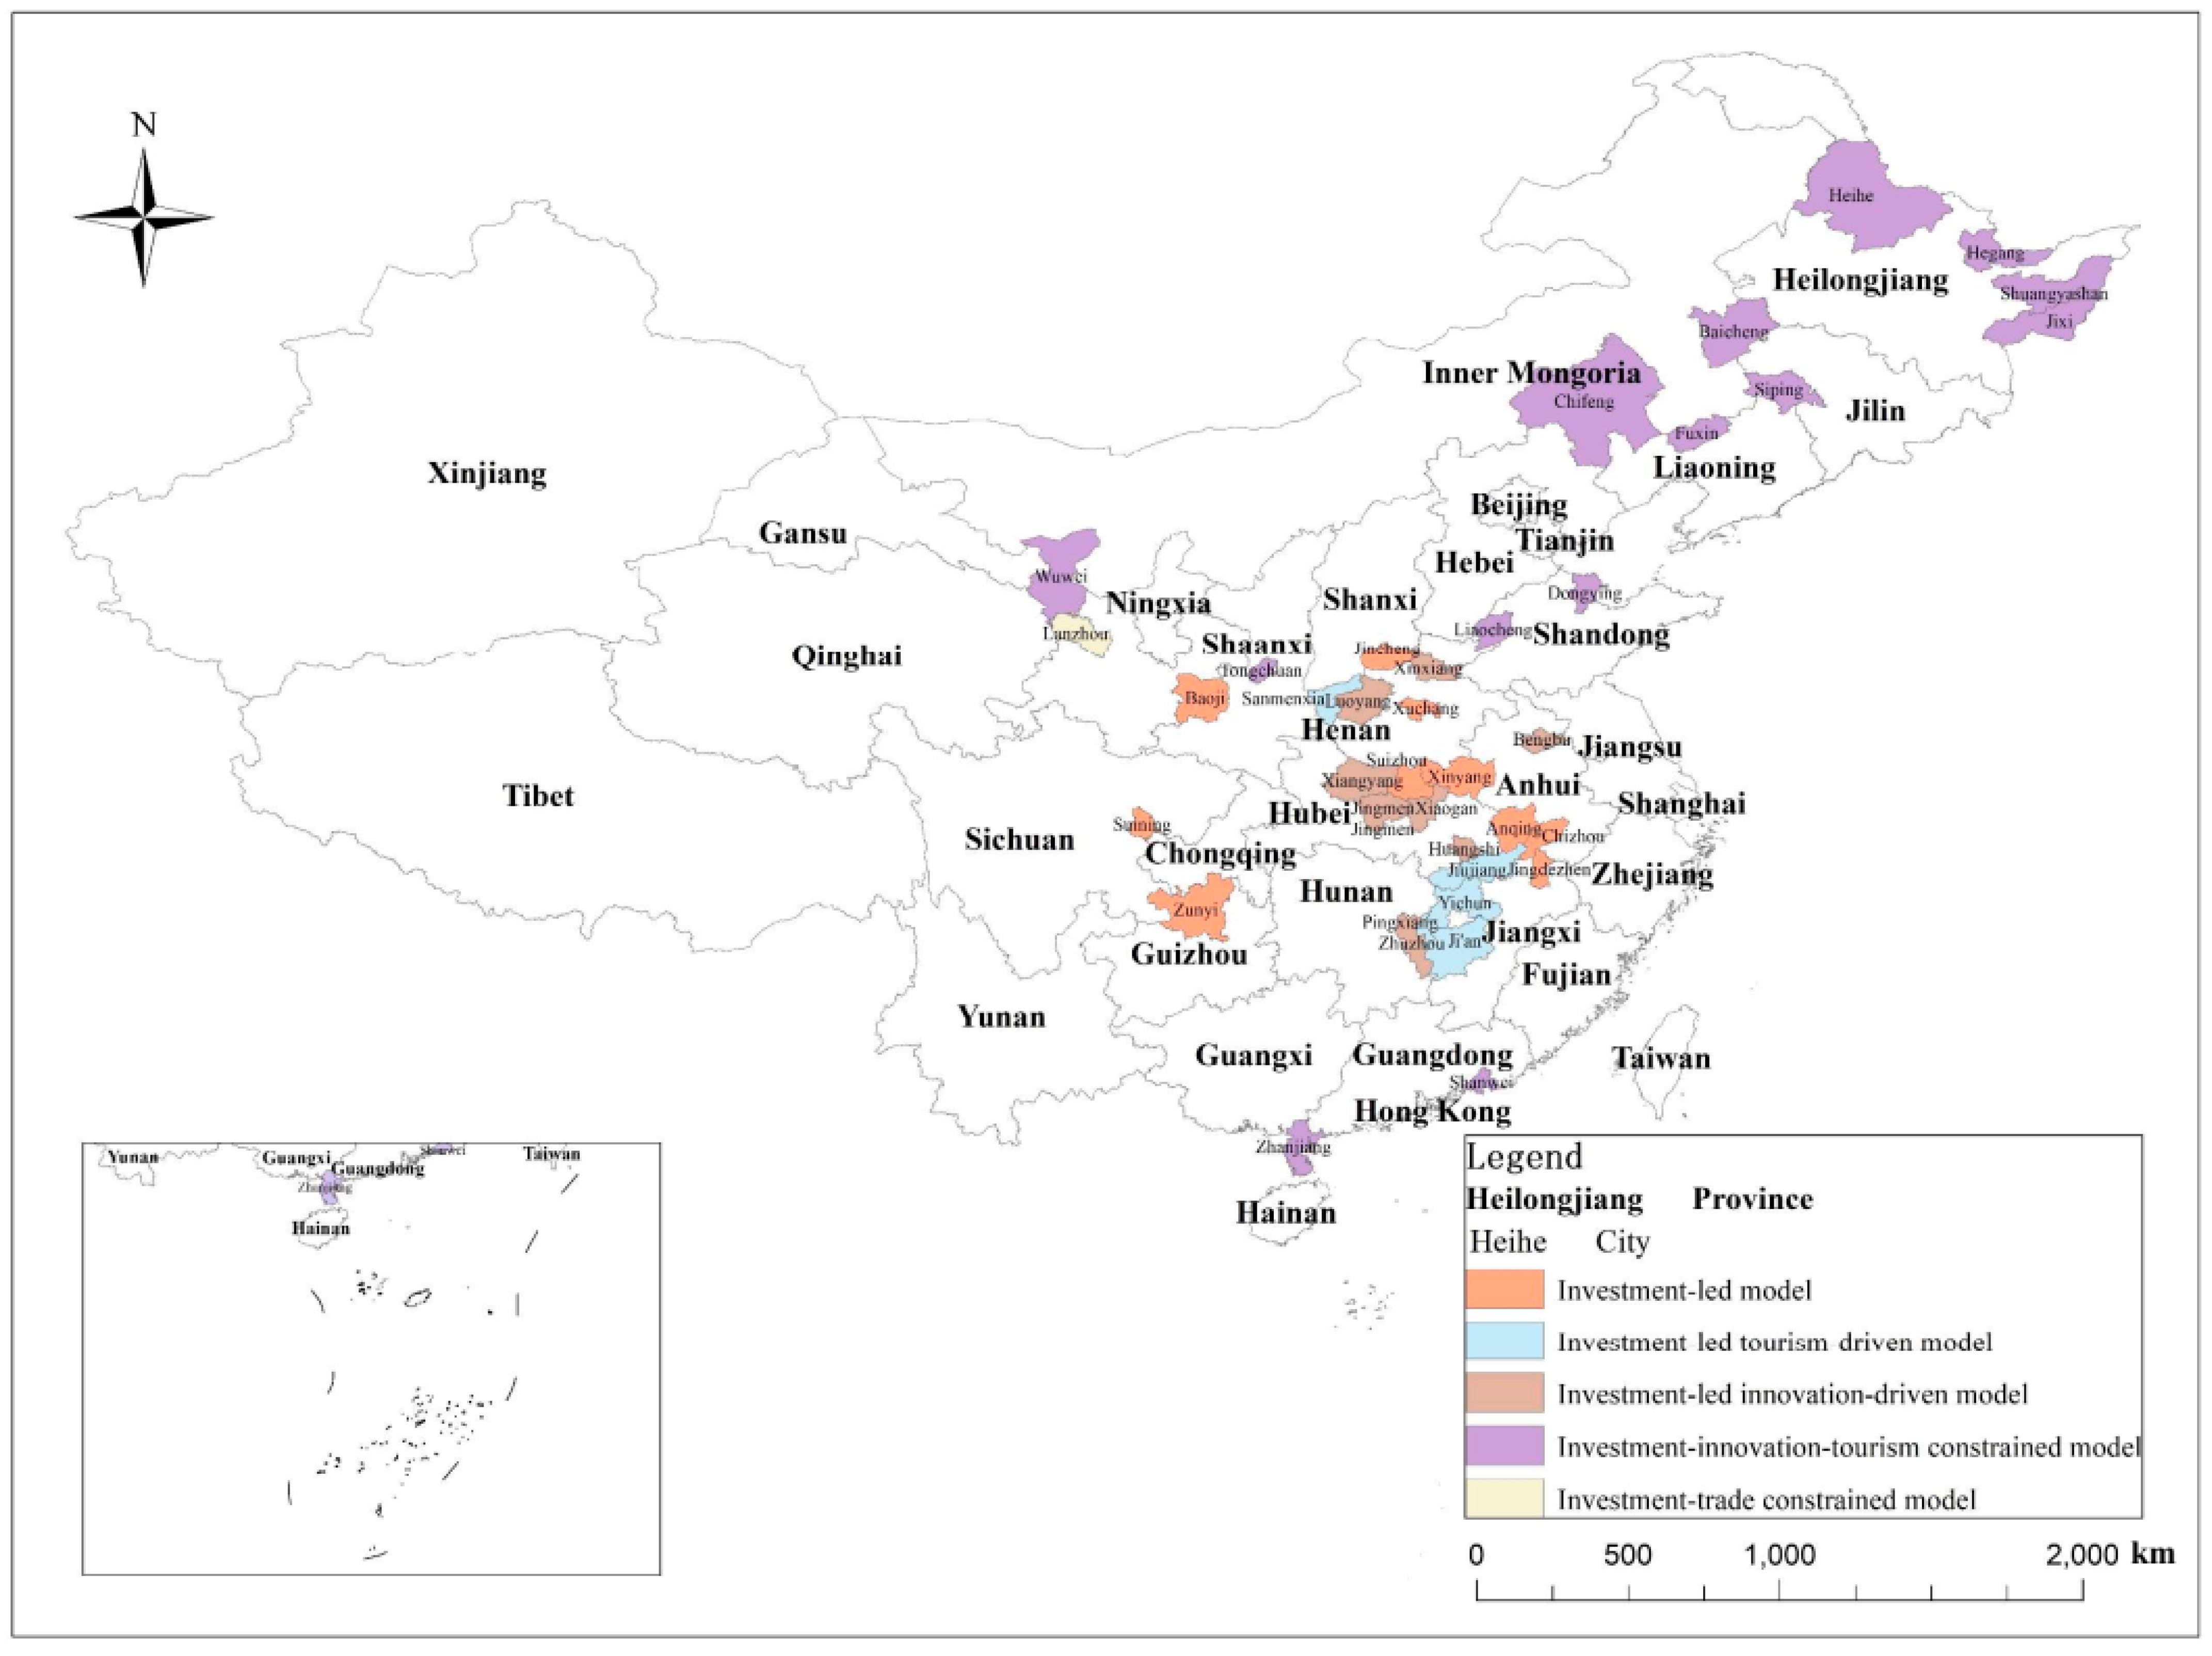
4.2. Sufficiency Analysis

According to the default settings of fsQCA and standard academic criteria, the raw consistency threshold is set at 0.8, the case frequency threshold is set at 1, and the PRI consistency threshold is set at 0.7 for truth table analysis. The fsQCA model offers three solution types: complex, parsimonious, and intermediate. Intermediate approaches have garnered significant attention for their excellent accuracy and versatility [22]. Hence, solely the intermediate solutions of the fsQCA model are presented in this paper. If an antecedent variable is present in both the parsimonious and complex solutions, it is regarded as a core variable. On the other hand, if a condition only emerges in the intermediate solution, it is seen as a peripheral variable [46]. Only configurations with core conditions are analyzed in this study. Table 6 reports the intermediate solutions of the fsQCA model. The results show that the consistency of both the overall and individual solutions is greater than 0.8, indicating the better explanatory power of each configuration for economic growth.
Table 6 shows that in 2010, there was only one solution that generated high economic growth: S1. There were three solutions that generated low economic growth: S2, S3, and S4. S1 indicates that the configuration with the core conditions of high tourism specialization, high foreign capital, low human resources, low innovation, low industrial structure, and high fixed asset investment can sufficiently lead to high economic growth. S2 shows that the configuration with the core conditions of low foreign capital, high human resources, high innovation, low fixed asset investment, and high trade openness can sufficiently lead to low economic growth. S3 shows that the configuration with low tourism specialization, low foreign capital, high innovation, low industrial structure, and low fixed asset investment as core conditions and high human resources as marginal conditions can sufficiently lead to low economic growth. S4 shows that the configuration with low tourism specialization, low foreign capital, high innovation, low industrial structure, and low fixed asset investment as core conditions can sufficiently lead to low economic growth. S3 and S4 have the same core conditions and thus have similar explanatory mechanisms for low economic growth, so they are second-order equivalence configurations. Based on the composition of each configuration, this paper develops the following model of driving or constraining economic growth in Chinese cities in 2010. Figure 2 illustrates the economic growth models’ typical cities in 2010.
The investment-led tourism-driven model corresponds to solution S1, implying that in a scenario where the level of human resources, innovation capacity, and industrial structure are low, cities promote economic growth mainly by increasing investment in fixed assets, attracting foreign investment, and developing the tourism economy. This model confirms the key role of investment in economic growth and the importance of tourism for economic growth. This is similar to the findings of existing studies on the positive impact of tourism on economic development [1,2,3,4,5,6,7,8,9]. The model also reflects a competitive commensal relationship between variables, i.e., investment and tourism growth have a crowding-out effect on the level of human resources, innovation capacity, and industrial structure optimization. In the investment-based economic growth model, the requirements for human resources and innovation capacity are not high, and because investment is mainly concentrated in infrastructure and construction industries, it drives the development of related processing and manufacturing industries and promotes the progress of secondary industries.
Although tourism is a labor-intensive industry, it is generally dominated by small and medium-sized enterprises, especially self-employment, and does not require a high overall quality of labor, so it has the same crowding-out effect on the level of human resources. In the context of China’s scenic-oriented and ticket economy tourism industry, which has become more prominent in past times, such as in 2010, the tourism industry has limited innovation capacity and role in enhancing innovation. Typical cases included in this development model include Ji’an (Jiangxi Province), Wuzhou (Guangxi Zhuang Autonomous Region), Shangrao (Jiangxi Province), Qingyuan (Guangdong Province), Yingtan (Jiangxi Province), Pingxiang (Jiangxi Province), Meishan (Sichuan Province), Jiuquan (Gansu Province), Hezhou (Guangxi Zhuang Autonomous Region), Sanmenxia (Henan Province), Jingdezhen (Jiangxi Province), and Dandong (Liaoning Province). These cities are typically characterized by increased investments in fixed assets, particularly industrial investment, and a strong focus on tourism.
The investment-constrained model corresponds to solution S2, implying that even though human resources, innovation capacity, and trade openness are at high levels, the city’s economic growth rate is low due to the constraints of foreign capital utilization and fixed asset investment. Tourism specialization does not appear in this model, i.e., this model still holds regardless of the high level of tourism development. This development model is clearly inconsistent with the endogenous economic growth theory or the new economic growth theory, which assumes that economic growth relies on technological innovation advances as well as human capital advantages. Typical examples of this model include Taiyuan (Shanxi Province), Zibo (Shandong Province), Wenzhou (Zhejiang Province), Jinhua (Zhejiang Province), Jining (Shandong Province), Taizhou (Zhejiang Province), Dongying (Shandong Province), Urumqi (Xinjiang Uygur Autonomous Region), Zhoushan (Zhejiang Province), Liaocheng (Shandong Province), and Tangshan (Hebei Province). These cities experience limitations in terms of both domestic and foreign investments, resulting in lower rates of economic growth.
The investment–industry structure tourism-constrained model includes solutions S3 and S4, indicating that even with high innovation capacity, supported by high human resources (S3) and high trade openness (S4), cities suffer from low economic growth rates due to underinvestment, lagging industrial structure, and underdeveloped tourism. These cities exhibit strong performance in terms of scientific research inputs and patent output. However, there appears to be a gap between their innovation capacity and actual productivity. Insufficient investment and underdeveloped tertiary sectors, such as tourism, have resulted in below-average urban economic performance. These cities are dominated by traditional industrial cities, but traditional industrial development has hit a bottleneck, and new economic growth points have not worked well. Typical examples of this model include Zibo (Shandong Province), Dongying (Shandong Province), Huainan (Anhui Province), Zaozhuang (Shandong Province), Pingdingshan (Henan Province), Anyang (Henan Province), Xuchang (Henan Province), Yichang (Hubei Province), Dezhou (Shandong Province), Liaocheng (Shandong Province), Tangshan (Hebei Province), Heze (Shandong Province), and Longyan (Fujian Province).
Table 6 shows that there were three configurations generating high economic growth rates in 2019: S5–S7. There were also three configurations generating low economic growth rates: S8–S10. S5 indicates that the configuration with the core conditions of high foreign capital, low human resources, low industrial structure, high fixed asset investment, and low trade openness can be sufficient to achieve high economic growth. S6 shows that the configuration with the core conditions of high tourism specialization, high foreign capital, low human resources, low industrial structure, and high fixed asset investment can sufficiently achieve high economic growth. S7 shows that the configuration with high foreign capital, high innovation, low industrial structure, and high fixed asset investment as the core conditions can sufficiently achieve high economic growth.
S8 shows that the configuration with the core conditions of low tourism specialization, low foreign investment, low human resources, low innovation, high industrial structure, and low fixed asset investment can sufficiently lead to low economic growth. S9 shows that the configuration with the core conditions of low tourism specialization, low foreign investment, high human resources, low innovation, low fixed asset investment, and high trade openness can sufficiently lead to low economic growth. Both low human resources for S8 and high human resources for S9 correspond to low economic growth, and these two configurations are similar in terms of constraints on economic growth, including investment, innovation, and tourism. Therefore, S8 and S9 are approximate second-order equivalence configurations. S10 indicates that the configuration with high tourism specialization, high innovation, high industrial structure, low fixed asset investment, and low trade openness as core conditions and low foreign capital and high human resources as peripheral conditions can sufficiently lead to low economic growth. This paper develops the following economic growth model for Chinese cities in 2019. Figure 3 illustrates the economic growth models’ typical cities in 2019.
The investment-led model aligns with solution S5, demonstrating that the city experiences improved economic growth, irrespective of the extent of tourism development, thanks to favorable investment behavior. Similarly, investment has a certain crowding-out effect on human resources, industrial structure, and trade openness. In this model, economic growth relies heavily on investment in fixed assets and the effective utilization of foreign investment. Typical examples of this model include Xuchang (Henan Province), Jingmen (Hubei Province), Baoji (Shaanxi Province), Jincheng (Shanxi Province), Suining (Sichuan Province), Suizhou (Hubei Province), Chizhou (Anhui Province), Jingdezhen (Jiangxi Province), Zunyi (Guizhou Province), Anqing (Anhui Province), and Xinyang (Henan Province).
The investment-led tourism-driven model represents solution S6, which upholds the influence of S1 on economic growth, with investment playing a dominant role and the tourism sector having a noteworthy impact, highlighting a mutually beneficial commensalism between the two sectors. Typical examples of this model include Ji’an (Jiangxi Province), Chizhou (Anhui Province), Baoji (Shaanxi Province), Jincheng (Shanxi Province), Suining (Sichuan Province), Jingdezhen (Jiangxi Province), Yichun (Jiangxi Province), Sanmenxia (Henan Province), Zunyi (Guizhou Province), Anqing (Anhui Province), Pingxiang (Jiangxi Province), and Jiujiang (Jiangxi Province). These cities demonstrate active investment, a strong focus on tourism, and a significant contribution of this industry to their economic growth. Similar to the examples covered in 2010, cities in Jiangxi Province showed improved performance under this framework.
The investment-led innovation-driven model corresponds to solution S7 and shows that mutually beneficial commensalism of investment and innovation can drive economic growth. The model confirms both the dominant role of investment and innovation in economic growth. According to the new economic growth theory, this is a sustainable development model. Typical examples of this model include Luoyang (Henan Province), Baoji (Shaanxi Province), Bengbu (Anhui Province), Xinxiang (Henan Province), Xiangyang (Hubei Province), Xiaogan (Hubei Province), Zhuzhou (Hunan Province), Anqing (Anhui Province), Xuchang (Henan Province), Jingmen (Hubei Province), Jingdezhen (Jiangxi Province), Zunyi (Guizhou Province), and Huangshi (Hubei Province). This pattern encompasses multiple cities located in the provinces of Henan and Hubei, which in part reflects the current success of these two provinces in transitioning towards an investment- and innovation-driven approach to economic growth.
The investment–innovation tourism-constrained model corresponds to solutions S8 and S9. Despite having a strong industrial structure (S8) or successful trade (S9), the city’s economic growth rate remains low due to inadequate investment and tourism development and low capacity for innovation. Typical examples of this model include Jixi (Heilongjiang Province), Baisheng (Jilin Province), Shuangyashan (Heilongjiang Province), Heihe (Heilongjiang Province), Tongchuan (Shaanxi Province), Hegang (Heilongjiang Province), Liaocheng (Shandong Province), Siping (Jilin Province), Wuwei (Gansu Province), Shanwei (Guangdong Province), Fuxin (Liaoning Province), Chifeng (Inner Mongolia Autonomous Region), Zhanjiang (Guangdong Province), and Dongying (Shandong Province). These cities are basically traditional resource or energy industry-based cities. As a result of resource depletion or shifts in energy usage, the economic growth of these urban centers is being challenged. Constrained by the conventional development paradigm, these urban areas experience impediments to innovation and tourism growth, making transformation a challenging task. Take Hegang and Jixi as examples, both of which are coal energy bases in China. However, with the depletion of coal resources and the promotion of low carbon transition in China, the economic growth of both cities has faced challenges. The limited resources and weak economy have resulted in low fixed asset investment and hindered the ability to attract foreign investment.
The investment–trade-constrained model represents solution S10, which reflects a considerable level of tourism specialization, innovation, and industrial structure, yet insufficient investment and trade constraints hinder economic growth. In this model, the contribution of tourism growth to higher economic growth rates is limited, which contradicts the traditional theoretical view that tourism fosters economic growth. Coupled with the tourism-centric economic growth model discussed earlier, this highlights the complex and unequal effects of tourism on economic development, mandating a contextual analysis of each individual case site. A typical case of this model is Lanzhou (Gansu Province). Lanzhou is an important center of higher education and scientific research in China, and its innovation capacity is ranked 80 out of 272 cities, which is a good performance. Lanzhou is also a cultural city with a long history and was selected as an excellent tourist city in China in 2004. With a tourism specialization level of 0.2702 in 2019, Lanzhou has a high economic status of tourism. However, despite the high level of innovation and tourism development, Lanzhou’s economic growth has not been positively impacted as there are noticeable deficiencies in the areas of investment and trade.
Table A1 and Table A2 in Appendix A present the basic information about the above representative cities.

4.3. Robustness Test

Typically, the resolution offered by fsQCA is dependent on the measurement of variables and their quantification, along with certain predetermined parameters, resulting in less persuasive outcomes from configurational analysis. To verify whether the main results are robust, this paper uses multiple approaches for robustness testing. Tourism specialization in this paper is assessed using the ratio of tourism revenue to GDP. Another measure is the ratio of tourist arrivals to local residents. Both tourism revenue and tourist arrivals are significant indicators of tourism development. Therefore, this paper introduces a novel metric to measure tourism specialization: the ratio of tourist arrivals to the local population [47,48]. An additional robustness test is based on the fsQCA method itself. This paper examines the effect of different calibration methods and parameter settings on fsQCA results. As mentioned previously, because there are no objective criteria and theoretical basis for determining the high and low thresholds for each variable, the calibration anchor points for each variable are used at 95%, 50%, and 5% quartiles. Although this practice is more common in existing studies, it is more subjective. To test the sensitivity of the configurational results to the calibration anchor points, the calibration anchor points are replaced from the fully in 95% quantile and the fully out 5% quantile to the 90% and 10% quantile, respectively, and the crossover points remain unchanged. Then, this paper refers to Du et al. [38], keeping Raw consistency unchanged and changing PRI consistency from 0.7 to 0.65.
If the results of the new configuration are not significantly different from the original results, particularly if the basic conditions of the configurations remain unaltered, then the central explanatory perspective is deemed unchanged, and the original results are robust. Of course, since the configuration analysis is based on the set theory idea, it is normal to have more configurations in the robustness test, but the new configurations should contain the original ones. The number of configurations identified may increase, particularly following the reduction of PRI consistency from 0.7 to 0.65, as the consistency requirement is eased. If the new configurations include all the original ones, the original findings are considered robust. The results of the robustness test indicate that when replacing the measure of tourism specialization, the number of configurations and core conditions for each configuration remained consistent in 2010 and 2019, with only a slight variation in peripheral conditions. When replacing the calibration anchors and PRI consistency thresholds, the number of configurations increases, but all configurations from Table 6 are still included. Therefore, it is confirmed through various tests that the core findings of this paper are robust (As the robustness test comprises several tables, the results of the examination are not presented in this article but can be obtained from the corresponding author upon request.).

5. Discussion

This paper has the following theoretical implications.
First, tourism is not a necessary condition for generating high or low economic growth rates, which complements the understanding of the conclusion that tourism has a significant impact on economic growth, as considered by existing studies. Existing studies have demonstrated that tourism positively affects economic growth or is a Granger cause for economic growth [1,2,3,4,5,6,7,8,9]. The findings presented in this paper indicate that there is no direct causation between tourism and economic growth, challenging the previously perceived limitations of single-variable analyses in past research. Tourism is not essential for economic growth, and the impact of tourism on economic growth is contingent upon a combination of various factors. No single tourism variable can be solely responsible for such growth. This indicates that tourism and other factors may have distinct or mutually supportive functions, and that tourism’s contribution to economic progress should be assessed through a holistic approach, considering the interplay of various factors. This aligns with the approach of coordinated development in sustainable development theory. As shown in configuration S1, tourism can be mutually beneficial commensalism with foreign investment and fixed asset investment to drive economic growth, or it can lead to low economic growth through a combination with innovation and industrial structure (e.g., configuration S10).
Second, the causal impact of tourism on urban economic growth is asymmetric. High levels of tourism specialization can both drive and constrain economic growth, as shown in configurations S1 and S10. The antithesis of the tourism-driven model of high economic growth does not constitute low economic growth. In this paper, no completely opposite configurations are found between high and low economic growth. Similarly, no pattern of high economic growth can be deduced from the opposites of configuration leading to low economic growth. Asymmetric causality is also reflected in equivalent causal chains of similar economic growth. For example, three configurations leading to low economic growth (see S2 to S4) were identified in 2010, and three configurations leading to low economic growth (see S8 to S10) and different but equivalent configurations leading to high economic growth (see S5 to S7) were identified in 2019.
Third, this paper identifies three models of tourism-driven or -constrained economic growth: investment-led tourism-driven, investment–industrial structure tourism-constrained, and investment–innovation tourism-constrained. Each impact model is dependent on its context, which sets it apart from the average results of standard regression analysis based on panel data. While panel data analysis does incorporate exploration of heterogeneity, this heterogeneity is primarily macroscopic and may not fully capture individual-level differences. This paper confirms the diversity of cases in tourism’s impact on economic growth. Tourism development can have a positive impact on economic growth, as evidenced by S1 and S6. However, there is also the possibility of lower economic growth rates, as indicated in S10. This study also reveals sluggish economic growth rates caused by tourism delays, as demonstrated in sections S3, S4, S8, and S9. It is important to note, however, that there is no intrinsic correlation or causality between these development models. The impact of tourism on economic growth remains highly complex and closely linked to local resource endowments, policy measures, and the economic environment.
Fourth, the pattern of tourism-driven economic growth is temporally stable. From 2010 to 2019, no new tourism-driven development patterns emerged, and tourism-driven patterns were largely consistent across time points. This confirms that after a decade of development, the influential role of tourism in China’s urban economic growth has not changed significantly. The coverage of the tourism-driven model also remains largely unchanged, changing only from 29.93% in 2010 to 29.19% in 2019. Therefore, the economic growth function of tourism in China still requires profound changes and more links with other factors to generate more diversified economic growth paths. At present, China’s tourism industry is still more in quantitative growth than qualitative change and cannot assume a leading role in driving urban economic growth.
Finally, tourism-based economic growth follows a spatial clustering pattern, with cities in close proximity showing similar patterns of economic development. This paper finds that the investment-led tourism-driven economic growth pattern mainly covers cities in Jiangxi Province, such as Ji’an, Shangrao, Yingtan, Pingxiang, and Jingdezhen in 2010, and Ji’an, Jingdezhen, Yichun, Pingxiang, and Jiujiang in 2019. This spatial agglomeration pattern may be related to the spatial agglomeration of the tourism industry. The concentration of the tourism industry in a particular area can facilitate economic growth and generate spatial spillover effects [49,50]. The same spatial agglomeration characteristics are found in the tourism-constrained model, where the investment–industrial structure tourism-constrained model in 2010 mainly covers Zibo, Dongying, Zaozhuang, Dezhou, Liaocheng, and Heze in Shandong Province, and the investment–innovation tourism-constrained model in 2019 mainly covers Jixi, Baicheng, Shuangyashan, Hehe, Hegang, Siping, Fuxin, and Chifeng in the northeastern provinces.
This paper puts forward a series of policy implications that are relevant and beneficial to stakeholders involved in the tourism industry. As a first step, the economic impact of tourism should not be limited to the tourism sector alone, especially in cities that heavily rely on tourism. It is important to identify and promote other major industries and resources that exist beyond tourism and actively seek to expand tourism’s intersecting boundaries to foster stronger partnerships with other sectors. Consequently, this will drive regional economic development and support an investment-led tourism-driven model. This model will continuously leverage foreign investment and fixed asset investment for future growth.
Moreover, policymakers need to systematically optimize the urban market environment to achieve optimal economic growth. The integration of tourism and other market factors is crucial in creating conditions that facilitate maximum economic expansion. Conversely, low economic growth can be attributed to a plethora of interconnected factors, such as inadequate market ecosystems and inefficient interactions between key market players. Therefore, policymakers need to pursue policies that foster economic growth by aligning these components of the market landscape in accordance with regional circumstances. This approach must be varied and equitable, while acknowledging spatial and temporal fluctuations.
Given the heterogeneous resource endowments across cities, realistic economic growth models must be adopted. These models should not be mechanically applied from mature models, as different cities have varying levels of development, resources, and technological advancements. Each city must have a clear understanding of its own tourism resources and keep track of any changes in internal and external environments to determine the most suitable economic growth model.
The utilization of foreign capital within the tourism industry is not particularly conspicuous within the Chinese tourism economy. Therefore, Chinese policymakers must contemplate enhancing the use of foreign capital within the tourism industry. This will increase the flow of foreign investment and improve industry contribution to the overall economy. By strengthening investment-led tourism policies, stimulating the development of diverse urban market ecosystems, and adopting realistic economic growth models, the tourism industry will become more sustainable and continue to drive regional economic development.

6. Conclusions

This paper uses fsQCA and NCA techniques based on configuration theory to explore the thesis of sustainable development in tourism and regional economic growth. It provides a comparative analysis of tourism’s role in promoting economic growth in various Chinese cities, examining both its necessity and sufficiency. The study analyzes tourism’s impact on urban economic growth in China at two significant time periods—2010 and 2019—to ascertain temporal heterogeneity and spatial disparities. The research indicates that tourism is not a prerequisite for urban economic growth, but over-dependence on the industry can significantly contribute to different economic development trajectories. The paper identifies a single investment-led tourism-driven economic growth model that has remained unchanged from 2010 to 2019. Additionally, it shows that an over-reliance on tourism can lead to a decline in economic growth, described as configuration S10.
Two tourism-constrained low economic growth models exist: investment–industry structure tourism-constrained model and investment–innovation tourism-constrained model. These two patterns indicate that it is challenging to elevate economic growth rates in instances where tourism specialization is low. Ultimately, significant fixed asset investment serves as a fundamental prerequisite for achieving elevated levels of economic growth, while insufficient fixed asset investment can result in diminished economic growth. The crucial role of fixed asset investment in economic growth is established in various instances. The role of foreign investment is similar. China’s urban economy is heavily reliant on investment, both foreign and fixed asset, to drive economic growth effectively. However, a lack of investment hinders further economic development. This phenomenon has not fundamentally changed from 2010 to 2019. In addition, tourism has an asymmetric causal impact on urban economic growth. The growth pattern of tourism-driven economies is stable over time and tends to cluster spatially. This is important to consider when analyzing the economic benefits and drawbacks of tourism for urban areas.
Future research can further enhance case analysis. Although both involve case-based empirical analysis, fsQCA analysis distinguishes itself from traditional case analysis. This paper conducts a straightforward qualitative analysis of the cases covered, providing empirical evidence for the mechanism of impact on economic growth. Nonetheless, the extensive sample fsQCA investigation lacks the depth and comprehensiveness of a single case study approach. Future research endeavors could involve further in-depth case studies to investigate diverse forms of tourism influencing or impeding economic development. In terms of dynamic analysis, this paper compares two different time periods, which may introduce some degree of randomness into the cross-sectional comparison, making it difficult to account for a continuous time series such as panel analysis. In the future, fsQCA can potentially incorporate advanced time series analysis techniques, providing a more accurate representation of dynamic shifts in economic growth within tourism-based frameworks. Regarding the scope of the configuration analysis, the article focuses only on the interrelationship between tourism and six additional variables. However, economic growth is a complex undertaking influenced by various factors, such as pollution [51], resources [52], and transportation [53]. Further investigation is required to thoroughly consider and integrate multiple variables. Finally, a network approach can be highly effective in analyzing the complex interaction of various tourism factors and their impact on economic growth.

Author Contributions

Conceptualization, Y.Z.; methodology, J.Z.; software, J.Z.; validation, Y.Z. and J.Z.; data curation, J.Z.; writing—original draft preparation, Y.Z.; writing—review and editing, Y.Z.; visualization, Y.Z.; supervision, Y.Z.; project administration, Y.Z.; funding acquisition, Y.Z. All authors have read and agreed to the published version of the manuscript.

Funding

This research received no external funding.

Institutional Review Board Statement

Not applicable.

Informed Consent Statement

Not applicable.

Data Availability Statement

The data that support the findings of this study are available from the corresponding author upon reasonable request.

Conflicts of Interest

The authors declare no conflict of interest.

Appendix A

Table A1. Brief information on typical cities in 2010.
CityProvincePopulation Density (People per Km2)Tourism Revenue (100 Million
Yuan)
Tourist Arrivals (10,000
Person-Times)
Investment-led tourism-driven model
Ji’anJiangxi190 100 1415
WuzhouGuangxi229 52 665
ShangraoJiangxi289 143 1987
QingyuanGuangdong194 108 667
YingtanJiangxi316 45 612
PingxiangJiangxi484 48 731
MeishanSichuan413 65 991
JiuquanGansu7 38 406
HezhouGuangxi166 38 504
SanmenxiaHenan213 80 1459
JingdezhenJiangxi302 67 1325
DandongLiaoning160 219 2281
Investment-constrained model
TaiyuanShanxi602 230 2023
ZiboShandong760 214 2561
WenzhouZhejiang754 332 3526
JinhuaZhejiang490 284 2945
JiningShandong722 233 3018
TaizhouZhejiang594 273 3296
DongyingShandong247 45 640
UrumqiXinjiang226 75 782
ZhoushanZhejiang769 142 2139
LiaochengShandong671 51 876
TangshanHebei534 77 1538
Investment–industry structure tourism-constrained model
ZiboShandong760 214 2561
DongyingShandong247 45 640
HuainanAnhui422 26 602
ZaozhuangShandong817 61 948
PingdingshanHenan622 69 898
AnyangHenan700 105 1401
XuchangHenan862 32 608
YichangHubei191 104 1542
DezhouShandong538 47 971
LiaochengShandong671 51 876
TangshanHebei534 77 1538
HezeShandong682 36 669
LongyanFujian134 70 987
Table A2. Brief information on typical cities in 2019.
CityProvincePopulation Density (People per Km2)Tourism Revenue (100 Million Yuan)Tourist Arrivals (10,000
Person-Times)
Investment-led model
XuchangHenan893 214 3197
JingmenHubei234 198 3269
BaojiShaanxi208 937 12,267
JinchengShanxi250 669 7329
SuiningSichuan599 563 5831
SuizhouHubei230 179 2835
ChizhouAnhui177 777 7043
JingdezhenJiangxi319 719 5523
ZunyiGuizhou205 2106 19,300
AnqingAnhui349 818 7754
XinyangHenan344 282 4830
Investment-led tourism-driven model
Ji’anJiangxi195983 7790
ChizhouAnhui177777 7043
BaojiShaanxi208937 12,267
JinchengShanxi250669 7329
SuiningSichuan599563 5831
JingdezhenJiangxi319669 7329
YichunJiangxi299910 7987
SanmenxiaHenan217381 4391
ZunyiGuizhou2052106 19,300
AnqingAnhui349818 7754
PingxiangJiangxi507704 5830
JiujiangJiangxi2481161 9115
Investment-led innovation-driven model
LuoyangHenan4541692 14,146
BaojiShaanxi208669 7329
BengbuAnhui573356 5122
XinxiangHenan701356 5202
XiangyangHubei288478 6185
XiaoganHubei553195 3022
ZhuzhouHunan358638 6466
AnqingAnhui349818 7754
XuchangHenan893214 3197
JingmenHubei234198 3269
JingdezhenJiangxi319719 5523
ZunyiGuizhou2052106 19,300
HuangshiHubei539192 2839
Investment–innovation tourism-constrained model
JixiHeilongjiang75 83 1233
BaichengJilin73 95 530
ShuangyashanHeilongjiang62 32 934
HeiheHeilongjiang23 115 1313
TongchuanShaanxi201 163 2493
HegangHeilongjiang67 64 669
LiaochengShandong707 220 2517
SipingJilin221 26 550
WuweiGansu56 113 1957
ShanweiGuangdong620 173 971
FuxinLiaoning169 118 1632
ChifengInner Mongolia48 421 1987
ZhanjiangGuangdong555 601 2845
DongyingShandong264 206 2018
Investment–trade-constrained model
LanzhouGansu287 7678211

References

  1. Zhang, Y.; Zhang, J. Tourist Attractions and Economic Growth in China: A Difference-in-Differences Analysis. Sustainability 2023, 15, 5649. [Google Scholar] [CrossRef]
  2. Adedoyin, F.F.; Erum, N.; Bekun, F.V. How does institutional quality moderates the impact of tourism on economic growth? Startling evidence from high earners and tourism-dependent economies. Tour. Econ. 2021, 28, 1311–1332. [Google Scholar] [CrossRef]
  3. Faber, B.; Gaubert, C. Tourism and Economic Development: Evidence from Mexico’s Coastline. Am. Econ. Rev. 2019, 109, 2245–2293. [Google Scholar] [CrossRef] [Green Version]
  4. Harb, G.; Bassil, C. Harnessing cross-region disparities to assess the impact of tourism on regional growth in Europe. Curr. Issues Tour. 2020, 24, 1491–1504. [Google Scholar] [CrossRef]
  5. Nunkoo, R.; Seetanah, B.; Jaffur, Z.R.K.; Moraghen, P.G.W.; Sannassee, R.V. Tourism and Economic Growth: A Meta-regression Analysis. J. Travel Res. 2020, 59, 404–423. [Google Scholar] [CrossRef]
  6. Aratuo, D.N.; Etienne, X.L. Industry level analysis of tourism-economic growth in the United States. Tour. Manag. 2018, 70, 333–340. [Google Scholar] [CrossRef]
  7. Moyle, C.L.; Carmignani, F.; Moyle, B.; Anwar, S. Beyond Dutch Disease: Are there mediators of the mining–tourism nexus? Tour. Econ. 2021, 27, 744–761. [Google Scholar] [CrossRef]
  8. Dul, J. Necessary condition analysis (NCA) logic and methodology of “necessary but not sufficient” causality. Organ. Res. Methods 2016, 19, 10–52. [Google Scholar] [CrossRef]
  9. Zhang, J.; Zhang, Y. A qualitative comparative analysis of tourism and gender equality in emerging economies. J. Hosp. Tour. Manag. 2021, 46, 284–292. [Google Scholar] [CrossRef]
  10. Dul, J. Conducting Necessary Condition Analysis for Business and Management Students; Sage: London, UK, 2019. [Google Scholar]
  11. Dul, J.; van der Laan, E.; Kuik, R. A Statistical Significance Test for Necessary Condition Analysis. Organ. Res. Methods 2020, 23, 385–395. [Google Scholar] [CrossRef] [Green Version]
  12. Gao, J.; Xu, W.; Zhang, L. Tourism, economic growth, and tourism-induced EKC hypothesis: Evidence from the Mediterranean region. Empir. Econ. 2019, 60, 1507–1529. [Google Scholar] [CrossRef]
  13. Pulido-Fernández, J.I.; Cárdenas-García, P.J. Analyzing the Bidirectional Relationship between Tourism Growth and Economic Development. J. Travel Res. 2021, 60, 583–602. [Google Scholar] [CrossRef]
  14. Zhang, J.; Zhang, Y. Tourism, economic growth, energy consumption, and CO2 emissions in China. Tour. Econ. 2021, 27, 1060–1080. [Google Scholar] [CrossRef]
  15. Furnari, S.; Crilly, D.; Misangyi, V.F.; Greckhamer, T.; Fiss, P.C.; Aguilera, R.V. Capturing Causal Complexity: Heuristics for Configurational Theorizing. Acad. Manag. Rev. 2021, 46, 778–799. [Google Scholar] [CrossRef]
  16. Richards, G. Designing creative places: The role of creative tourism. Ann. Tour. Res. 2020, 85, 102922. [Google Scholar] [CrossRef]
  17. Ong, C.E.; Liu, Y. State-directed tourism urbanisation in China’s Hengqin. Ann. Tour. Res. 2022, 94, 103379. [Google Scholar] [CrossRef]
  18. Wang, Y.; Han, L.; Ma, X. International tourism and economic vulnerability. Ann. Tour. Res. 2022, 94, 103388. [Google Scholar] [CrossRef]
  19. Ferreira, J.-P.; Ramos, P.N.; Lahr, M.L. The rise of the sharing economy: Guesthouse boom and the crowding-out effects of tourism in Lisbon. Tour. Econ. 2020, 26, 389–403. [Google Scholar] [CrossRef]
  20. Kofler, I.; Marcher, A.; Volgger, M.; Pechlaner, H. The special characteristics of tourism innovation networks: The case of the Regional Innovation System in South Tyrol. J. Hosp. Tour. Manag. 2018, 37, 68–75. [Google Scholar] [CrossRef]
  21. Douglas, E.J.; Shepherd, D.A.; Prentice, C. Using fuzzy-set qualitative comparative analysis for a finer-grained understanding of entrepreneurship. J. Bus. Ventur. 2020, 35, 105970. [Google Scholar] [CrossRef]
  22. Rihoux, B.; Ragin, C. Configurational Comparative Methods: Qualitative Comparative Analysis (QCA) and Related Techniques; Sage: London, UK, 2009. [Google Scholar]
  23. Baharumshah, A.Z.; Thanoon, M.A.-M. Foreign capital flows and economic growth in East Asian countries. China Econ. Rev. 2006, 17, 70–83. [Google Scholar] [CrossRef]
  24. Cicea, C.; Marinescu, C. Bibliometric analysis of foreign direct investment and economic growth relationship. A research agenda. J. Bus. Econ. Manag. 2020, 22, 445–466. [Google Scholar] [CrossRef]
  25. Hasan, I.; Tucci, C.L. The innovation–economic growth nexus: Global evidence. Res. Policy 2010, 39, 1264–1276. [Google Scholar] [CrossRef] [Green Version]
  26. Wang, R.; Tan, J. Exploring the coupling and forecasting of financial development, technological innovation, and economic growth. Technol. Forecast. Soc. Chang. 2020, 163, 120466. [Google Scholar] [CrossRef]
  27. Rahim, S.; Murshed, M.; Umarbeyli, S.; Kirikkaleli, D.; Ahmad, M.; Tufail, M.; Wahab, S. Do natural resources abundance and human capital development promote economic growth? A study on the resource curse hypothesis in Next Eleven countries. Resour. Environ. Sustain. 2021, 4, 100018. [Google Scholar] [CrossRef]
  28. Jahanger, A.; Usman, M.; Murshed, M.; Mahmood, H.; Balsalobre-Lorente, D. The linkages between natural resources, human capital, globalization, economic growth, financial development, and ecological footprint: The moderating role of technological innovations. Resour. Policy 2022, 76, 102569. [Google Scholar] [CrossRef]
  29. Li, L.; Hong, X.; Peng, K. A spatial panel analysis of carbon emissions, economic growth and high-technology industry in China. Struct. Chang. Econ. Dyn. 2019, 49, 83–92. [Google Scholar] [CrossRef]
  30. Zhao, J.; Tang, J. Industrial structure change and economic growth: A China-Russia comparison. China Econ. Rev. 2018, 47, 219–233. [Google Scholar] [CrossRef]
  31. Yanikkaya, H. Trade openness and economic growth: A cross-country empirical investigation. J. Dev. Econ. 2003, 72, 57–89. [Google Scholar] [CrossRef]
  32. Huchet-Bourdon, M.; Le Mouël, C.; Vijil, M. The relationship between trade openness and economic growth: Some new insights on the openness measurement issue. World Econ. 2018, 41, 59–76. [Google Scholar] [CrossRef] [Green Version]
  33. Li, J.; Li, S. Energy investment, economic growth and carbon emissions in China—Empirical analysis based on spatial Durbin model. Energy Policy 2020, 140, 111425. [Google Scholar] [CrossRef]
  34. Wang, Q.; Jiang, R. Is China’s economic growth decoupled from carbon emissions? J. Clean. Prod. 2019, 225, 1194–1208. [Google Scholar] [CrossRef]
  35. Croes, R.; Ridderstaat, J.; Bąk, M.; Zientara, P. Tourism specialization, economic growth, human development and transition economies: The case of Poland. Tour. Manag. 2021, 82, 104181. [Google Scholar] [CrossRef]
  36. Biagi, B.; Ladu, M.G.; Royuela, V. Human Development and Tourism Specialization. Evidence from a Panel of Developed and Developing Countries. Int. J. Tour. Res. 2017, 19, 160–178. [Google Scholar] [CrossRef] [Green Version]
  37. Adeosun, O.T.; Popogbe, O.O. Population growth and human resource utilization nexus in Nigeria. J. Humanit. Appl. Soc. Sci. 2020, 3, 281–298. [Google Scholar] [CrossRef]
  38. Du, Y.; Liu, Q.; Chen, K.; Li, S. Ecosystem of doing business, total factor productivity and multiple patterns of high-quality development of Chinese cities: A configuration analysis based on complex systems view. Manag. World 2022, 38, 127–145. (In Chinese) [Google Scholar]
  39. Chen, S.; Zhang, H.; Wang, S. Trade openness, economic growth, and energy intensity in China. Technol. Forecast. Soc. Chang. 2022, 179, 121608. [Google Scholar] [CrossRef]
  40. Li, X.; Lu, Y.; Huang, R. Whether foreign direct investment can promote high-quality economic development under environ-mental regulation: Evidence from the Yangtze River Economic Belt, China. Environ. Sci. Pollut. Res. 2021, 28, 21674–21683. [Google Scholar] [CrossRef]
  41. Song, M.; Du, J.; Tan, K.H. Impact of fiscal decentralization on green total factor productivity. Int. J. Prod. Econ. 2018, 205, 359–367. [Google Scholar] [CrossRef]
  42. Vis, B.; Woldendorp, J.; Keman, H. Examining variation in economic performance using fuzzy-sets. Qual. Quant. 2013, 47, 1971–1989. [Google Scholar] [CrossRef]
  43. National Bureau of Statistics. 2011 China City Statistical Yearbook; China Statistics Press: Beijing, China, 2011.
  44. National Bureau of Statistics. 2020 China City Statistical Yearbook; China Statistics Press: Beijing, China, 2020.
  45. Greckhamer, T.; Gur, F.A. Disentangling combinations and contingencies of generic strategies: A set-theoretic configurational approach. Long Range Plan. 2021, 54, 101951. [Google Scholar] [CrossRef]
  46. Fiss, P.C. Building better causal theories: A fuzzy set approach to typologies in organization research. Acad. Manag. J. 2011, 54, 393–420. [Google Scholar] [CrossRef] [Green Version]
  47. De Vita, G.; Kyaw, K.S. Tourism specialization, absorptive capacity, and economic growth. J. Travel Res. 2017, 56, 423–435. [Google Scholar] [CrossRef]
  48. Zuo, B.; Huang, S. Revisiting the Tourism-Led Economic Growth Hypothesis: The Case of China. J. Travel Res. 2018, 57, 151–163. [Google Scholar] [CrossRef]
  49. Kim, Y.R.; Williams, A.M.; Park, S.; Chen, J.L. Spatial spillovers of agglomeration economies and productivity in the tourism industry: The case of the UK. Tour. Manag. 2020, 82, 104201. [Google Scholar] [CrossRef]
  50. Cao, Y.; Liu, J. The Spatial Spillover Effect and Its Impact on Tourism Development in a Megacity in China. Sustainability 2022, 14, 9188. [Google Scholar] [CrossRef]
  51. Rao, C.; Yan, B. Study on the interactive influence between economic growth and environmental pollution. Environ. Sci. Pollut. Res. 2020, 27, 39442–39465. [Google Scholar] [CrossRef]
  52. Haseeb, M.; Kot, S.; Hussain, H.I.; Kamarudin, F. The natural resources curse-economic growth hypotheses: Quantile–on–Quantile evidence from top Asian economies. J. Clean. Prod. 2021, 279, 123596. [Google Scholar] [CrossRef]
  53. Banerjee, A.V.; Duflo, E.; Qian, N. On the road: Access to transportation infrastructure and economic growth in China. J. Dev. Econ. 2020, 145, 102442. [Google Scholar] [CrossRef] [Green Version]
Figure 1. Theoretical framework of this study.
Sustainability 15 10000 g001
Figure 2. Illustrative instances of divergent economic growth models observed in 2010.
Sustainability 15 10000 g002
Figure 3. Illustrative instances of divergent economic growth models observed in 2019.
Sustainability 15 10000 g003
Table 1. Results of descriptive statistics.
VariableUnitMeanSTD. DEVMin.Max.
20102019201020192010201920102019
Economic growth%14.586.442.161.989.60−3.6025.1011.80
Tourism/0.10040.30880.08960.24470.00910.03310.78322.2796
Foreign capital/0.01820.01280.01780.01460.00000.00000.12770.0613
Human resources/982117,950403,60175,39500404,020786,890
Innovation/6.644752.955926.3843232.36730.00850.0058348.83003393.3000
Industrial structure/0.75021.37220.36400.65580.08330.42703.06054.9456
Fixed asset investment/0.72630.87100.25300.35350.10630.18821.64512.4108
Trade openness/0.21900.16320.56330.26160.00020.00077.84622.4834
Table 2. Calibration anchor points.
VariableFully inCrossover PointsFully Out
201020192010201920102019
Economic growth18.409.0014.206.8011.502.80
Tourism0.19960.72850.08070.24650.02290.0743
Foreign capital0.05510.04700.01290.00640.00030.0001
Human resources44,07684,4296971142 4262
Innovation30.7825199.5719 0.54376.5965 0.04890.2660
Industrial structure1.22872.64020.6851.20900.34440.6855
Fixed asset investment1.17701.43710.70080.85950.35290.3096
Trade openness0.74120.55200.07660.07080.00680.0070
Table 3. Analysis of necessary conditions.
ConditionEconomic Growth
(Consistency)
~Economic Growth
(Consistency)
2010201920102019
Tourism0.66030.63280.63250.6052
~tourism0.66710.66700.69230.7159
Foreign capital0.62850.63800.59190.5395
~foreign capital0.68410.64540.71820.7640
Human resources0.60300.57160.60320.6198
~human resources0.73220.74180.72930.7160
Innovation0.52470.57420.63760.5715
~innovation0.81320.73040.69760.7548
Industrial structure0.63740.59130.69260.6761
~industrial structure0.70820.73110.65020.6693
Fixed asset investment0.69090.71540.62700.6107
~fixed asset investment0.64670.60660.70780.7342
Trade openness0.55340.56970.61470.6161
~trade openness0.76730.72420.70350.6988
Table 4. NCA results (CR indicates ceiling regression, and CE indicates ceiling envelopment).
ConditionMethodsAccuracyCeiling ZoneScopeEffect Size (d)p-Value
2010201920102019201020192010201920102019
TourismCR100%100%0.0040.0100.940.940.0050.0100.6450.377
CE100%100%0.0090.0140.940.940.0090.0150.4810.244
Foreign capitalCR99.3%100%0.0080.0020.930.930.0080.0020.2440.480
CE100%100%0.0080.0040.930.930.0080.0040.2780.413
Human resourceCR100%100%0.0000.0070.920.890.0000.0081.0000.005
CE100%100%0.0000.0140.920.890.0000.0161.0000.001
InnovationCR100%96.7%0.0000.0670.930.940.0000.0711.0000.000
CE100%100%0.0000.0690.930.940.0000.0731.0000.000
Industrial structureCR100%100%0.0000.0040.920.930.0000.0050.6000.278
CE100%100%0.0000.0090.920.930.0000.0090.5970.102
Fixed asset investmentCR100%99.6%0.0010.0030.960.950.0010.0030.9450.683
CE100%100%0.0020.0040.960.950.0020.0040.9420.707
Trade opennessCR100%100%0.0000.0000.950.930.0000.0001.0001.000
CE100%100%0.0000.0000.950.930.0000.0001.0001.000
Table 5. Analysis of bottleneck level.
Economic GrowthTourismForeign CapitalHuman ResourcesInnovationIndustrial StructureFixed Asset InvestmentTrade Openness
0NN/NNNN/NNNN/NNNN/NNNN/NNNN/NNNN/NN
10NN/0.2NN/NNNN/NNNN/NNNN/0.0NN/NNNN/NN
200.1/0.4NN/NNNN/NNNN/NNNN/0.1NN/NNNN/NN
300.2/0.6NN/NNNN/NNNN/NNNN/0.2NN/NNNN/NN
400.3/0.8NN/NNNN/NNNN/NNNN/0.4NN/NNNN/NN
500.5/1.0NN/NNNN/NNNN/NNNN/0.5NN/NNNN/NN
600.6/1.2NN/NNNN/NNNN/NNNN/0.6NN/NNNN/NN
700.7/1.4NN/0.2NN/NNNN/7.1NN/0.7NN/NNNN/NN
800.8/1.61.3/0.5NN/NNNN/17.6NN/0.80.2/NNNN/NN
900.9/1.84.0/0.8NN/0.6NN/28.1NN/0.90.6/0.0NN/NN
1001.0/2.06.7/1.0NN/15.1NN/38.71.0/1.01.0/5.9NN/NN
Note: Forward slashes before and after indicate the results of the bottleneck analyses in 2010 and 2019, respectively. “NN” indicates “not necessary”.
Table 6. Configurational analysis results.
Condition20102019
Economic Growth~Economic GrowthEconomic Growth~Economic Growth
S1S2S3S4S5S6S7S8S9S10
Tourism
Foreign capital
Human resources
Innovation
Industrial structure
Fixed assets investment
Trade openness
Raw coverage0.29930.29250.28840.25780.34720.29190.30530.34110.25340.1864
Unique coverage0.29930.05270.04860.01800.01590.03120.01880.11960.04050.0193
Consistency0.91550.94580.94460.94500.90840.90940.92320.91330.93170.9503
Solution coverage0.29930.35920.39720.4049
Solution consistency0.91550.93430.90360.9066
Note: ● means core variables are present and ⊗ means core variables are absent; ■ means periphery variables are present and ○ means periphery variables are absent.
Disclaimer/Publisher’s Note: The statements, opinions and data contained in all publications are solely those of the individual author(s) and contributor(s) and not of MDPI and/or the editor(s). MDPI and/or the editor(s) disclaim responsibility for any injury to people or property resulting from any ideas, methods, instructions or products referred to in the content.

