
Impact of Economic Policy Uncertainty on Agribusiness Technology Innovation: Evidence from 231 Listed Firms in China


Abstract
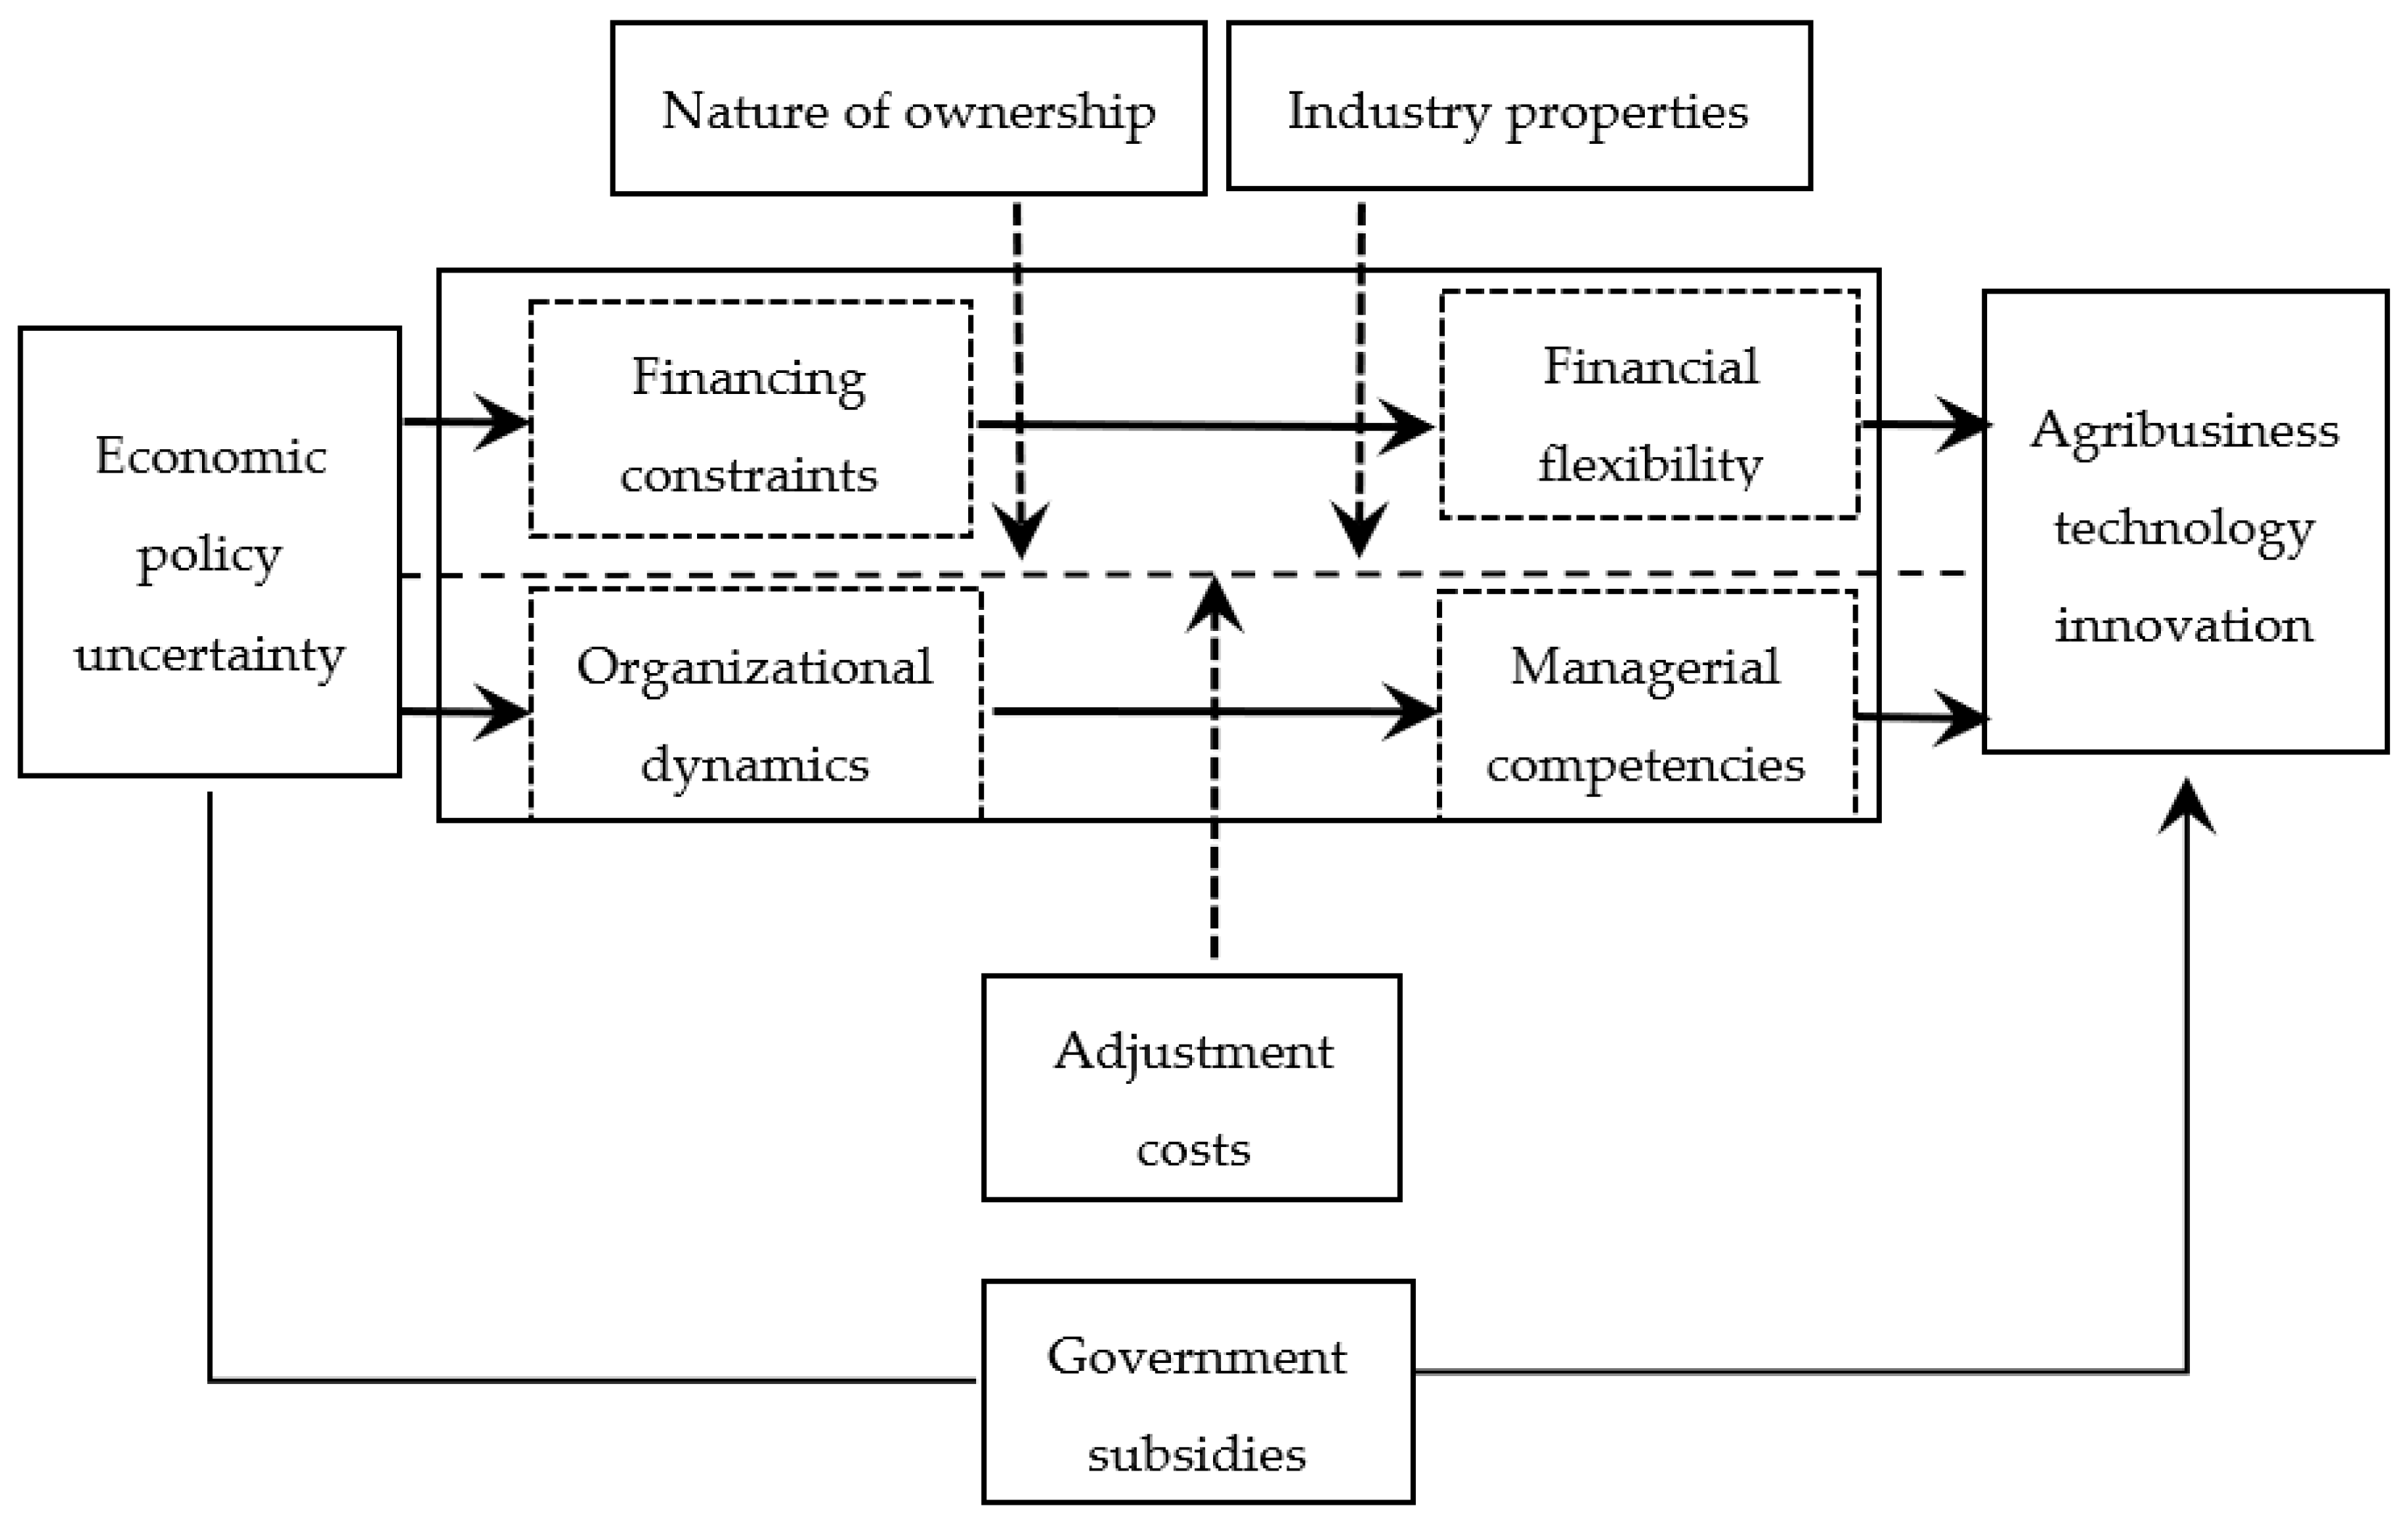
:1. Introduction
2. Theoretical Analysis and Research Hypotheses
2.1. Analysis of the Impact of Economic Policy Uncertainty on Technological Innovation in Agribusiness
2.2. Analysis of the Influence Mechanism of Economic Policy Uncertainty on the Impact of Technological Innovation in Agricultural Enterprises
2.2.1. Financial Flexibility
2.2.2. Managerial Capacity
2.3. Moderating Effect of Government Subsidies on Economic Policy Uncertainty and Technological Innovation in Agribusiness
3. Empirical Research Design
3.1. Sample Selection and Data Sources
3.2. Variables
3.2.1. Dependent Variables
3.2.2. The Core Independent Variable
3.2.3. Moderating Variable
3.2.4. Other Control Variables
3.3. Descriptive Statistics
3.4. Empirical Model
4. Empirical Results
4.1. Analysis of Baseline Regression Results
4.2. Heterogeneity Analysis
4.2.1. Heterogeneity of Agribusiness Nature of Property Rights
4.2.2. Heterogeneity of Agribusiness Industry Attributes
4.2.3. Heterogeneity of Agribusiness Adjustment Costs
4.3. Robustness Checks
4.3.1. Discussion of the Endogeneity Issue
4.3.2. The Core Independent Variable Replacements
4.3.3. The Dependent Variables Replacements
4.3.4. Replacement of the Regression Method
5. Further Discussion
5.1. Mechanism Analysis
5.1.1. Financial Flexibility
5.1.2. Managerial Competence
5.2. The Moderating Effect of Government Subsidies
5.3. Identifying the Effects of Environmental Uncertainty
5.4. Discussion
6. Conclusions and Policy Implications
6.1. Conclusions
6.2. Recommendations
Author Contributions
Funding
Institutional Review Board Statement
Informed Consent Statement
Data Availability Statement
Conflicts of Interest
References
- Zhang, L.; Zhang, X. A study on the impact of external shocks on price volatility of agricultural products in China based on the perspective of agricultural industry chain. J. Manag. World 2011, 208, 71–81. [Google Scholar]
- Jiang, Z. The incentive of government innovation support enterprises’s R&D investment under different supervision situations: Eviendence from agriculture listed companies. Econ. Theory Bus. Manag. 2021, 41, 55–70. [Google Scholar]
- Miao, R.; Khanna, M.; Huang, H. Responsiveness of crop yield and acreage to prices and climate. Am. J. Agric. Econ. 2016, 98, 191–211. [Google Scholar] [CrossRef] [Green Version]
- Wang, H.; Liu, C.; Yang, Y. An empirical study of management incentives and firm performance—Based on empirical data of listed agricultural companies. Agric. Technol. Econ. 2014, 229, 113–120. [Google Scholar]
- Pastor, L.; Veronesi, P. Uncertainty about government policy and stock prices. J. Financ. 2012, 67, 1219–1264. [Google Scholar] [CrossRef] [Green Version]
- Wang, H.; Yan, Z.; Guo, G. Digital infrastructure policy and enterprise digital transformation: “empowerment” or “negative energy”? J. Quant. Technol. Econ. 2023, 40, 5–23. [Google Scholar]
- Luo, S.; Ou, X. Political affiliation approach and agribusiness performance-based on empirical data of listed agricultural companies from 2004–2012. Issues Agric. Econ. 2015, 36, 43–52+111. [Google Scholar]
- Wang, P.; Li, G. Does policy uncertainty inhibit agribusiness investment. J. Agrotech. Econ. 2021, 316, 20–31. [Google Scholar]
- Peng, S.; Li, H.; Zhang, R. Research on the model and mechanism of deep integration of production-university-research in agricultural enterprises based on elemental synergy—Wen’s-led production-university-research as an example. Issues Agric. Econ. 2023, in press. [Google Scholar]
- Solow, R. Investment and Technical Progress. Math. Methods Soc. Sci. 1960, 1, 48–93. [Google Scholar]
- Hsieh, C.T. Endogenous Growth and Obsolescence. J. Dev. Econ. 2001, 66, 153–171. [Google Scholar] [CrossRef]
- Nicholas, B.; Stephen, T. Using Disasters to Estimate the Impact of Uncertainty. 2020. Available online: http://people.bu.edu/stephent/files/BBT.pdf (accessed on 17 June 2023).
- Zhang, F.; Liu, X.; Wu, L. Product innovation or service transformation:economic policy uncertainty and manufacturing innovation choices. China Ind. Econ. 2019, 376, 101–118. [Google Scholar]
- Hao, W.; Wei, W.; Wen, J. How does economic policy uncertainty affect firm innovation?—A perspective on the mechanism of action of real options theory. Bus. Manag. J. 2016, 38, 40–54. [Google Scholar]
- Bian, Z.; Tang, S.; Guo, J. Business environment uncertainty and firm innovation-based on the perspective of dual macroeconomic and local policy uncertainty. Ind. Econ. Res. 2021, 113, 85–98. [Google Scholar]
- Gu, X.; Zhang, X. Economic policy uncertainty, rising labor costs and firm innovation. Res. Financ. Econ. Issues 2019, 430, 102–110. [Google Scholar]
- Li, E.; Zhang, C.; Wan, S. Innovation decisions under economic policy uncertainty: A firm resilience perspective. Contemp. Financ. Econ. 2022, 455, 102–114. [Google Scholar]
- Gu, X.; Chen, Y.; Pan, S. Economic policy uncertainty and innovation-an empirical analysis based on Chinese listed companies. Econ. Res. J. 2018, 53, 109–123. [Google Scholar]
- Yang, Z.; Chen, J.; Wu, N. “Embrace” or “reject”: Economic policy uncertainty and corporate digital transformation. Economist 2023, 289, 45–54. [Google Scholar]
- Yang, Z.; Ling, H.; Chen, J. Economic policy uncertainty, corporate social responsibility and corporate technological innovation. Stud. Sci. Sci. 2021, 39, 544–555. [Google Scholar]
- Gulen, H.; Ion, M. Policy uncertainty and corporate investment. Rev. Financ. Stud. 2016, 29, 523–564. [Google Scholar] [CrossRef] [Green Version]
- Xu, C.; Wang, W.; Wang, F. The impact of economic policy uncertainty on macroeconomics—An empirical and theory-based dynamic analysis. China Econ. Q. 2019, 18, 23–50. [Google Scholar]
- Xie, J.; Chen, F.; Chen, K. Trade policy uncertainty and exporters’ markup rates: Theoretical mechanisms and China’s experience. China Ind. Econ. 2021, 394, 56–75. [Google Scholar]
- Du, J.; Liu, S. Economic policy uncertainty, financial development and technological innovation. Inq. Into Econ. Issues 2020, 461, 32–42. [Google Scholar]
- Kang, W.; Lee, K.; Ratti, R.A. Economic policy uncertainty and firm-level investment. J. Macroecon. 2014, 39, 42–53. [Google Scholar] [CrossRef] [Green Version]
- Sun, L.; Wang, X.; Jin, Y. The evolution of science and technology innovation capability of Chinese agriculture-related firms and the path to enhance it: Empirical evidence from listed agriculture-related firms. Issues Agric. Econ. 2022, 516, 4–18. [Google Scholar]
- Bloom, N. The Impact of Uncertainty Shocks. Econometrica 2009, 77, 623–685. [Google Scholar]
- Campello, M.; Cortes, G.S.; d’Almeida, F.; Kankanhalli, G. Exporting Uncertainty: The Impact of Brexit on Corporate America. J. Financ. Quant. Anal. 2022, 57, 3178–3222. [Google Scholar] [CrossRef]
- Teece, D.; Pisano, G.; Shuen, A. Dynamic capabilities and strategic management. Strateg. Manag. J. 1997, 18, 509–533. [Google Scholar] [CrossRef]
- Zhang, Y. The moderating effect of dynamic environment on the relationship between corporate entrepreneurial strategy and performance. China Ind. Econ. 2008, 238, 105–113. [Google Scholar]
- Jiao, H. The construction path of competitive advantage in dual-type organizations: An empirical study based on dynamic capability theory. J. Manag. World 2011, 21, 76–91+188. [Google Scholar]
- Li, Y.; Li, G.; Shao, W. The effects of government subsidies and environmental regulations on technological innovation inputs. Stud. Sci. Sci. 2019, 37, 1694–1701. [Google Scholar]
- Yu, F. Analysis of the strategy for improving the independent innovation capacity of state-owned enterprises. Econ. Rev. J. 2021, 427, 87–93. [Google Scholar]
- Zhang, Y.; Cheng, Y.; She, G. Can government subsidies promote independent innovation in high-tech enterprises?—Evidence from Zhongguancun. J. Financ. Res. 2018, 460, 123–140. [Google Scholar]
- Yuan, S.; Yu, L.; Zhong, C. Does innovation policy promote innovation quantity or innovation quality?—The case of high technology industry. China Soft Sci. 2020, 351, 32–45. [Google Scholar]
- Guo, Y.; Zhu, Y. Intentional or reluctant—The “de-realization” of enterprises under the uncertainty of economic policy. Bus. Manag. J. 2020, 42, 40–55. [Google Scholar]
- Ya, K.; Luo, F.; Li, Q. Economic policy uncertainty, financial asset allocation and innovative investment. Financ. Trade Econ. 2018, 39, 95–110. [Google Scholar]
- Xue, Y.; Hu, L. Institutional environment, government subsidies and innovation motivation of manufacturing firms: An analysis of incentive effects and heterogeneity. Econ. Surv. 2020, 37, 88–96. [Google Scholar]
- Tao, F.; Zhu, P.; Qiu, C. Research on the impact of digital technology innovation on the market value of enterprises. J. Quant. Technol. Econ. 2023, 40, 68–91. [Google Scholar]
- Baker, S.R.; Bloom, N.; Davis, S.J. Measuring Economic Policy Uncertainty. Q. J. Econ. 2016, 131, 1593–1636. [Google Scholar] [CrossRef]
- Campello, M.; Kankanhalli, G.; Muthukrishnan, P. Corporate Hiring under COVID-19: Labor Market Concentration, Downskilling, and Income Inequality; NBER Working Paper; National Bureau of Economic Research: Cambridge, MA, USA, 2020. [Google Scholar]
- Campello, M.; Kankanhalli, G.; Kim, H. Delayed Creative Destruction: How Uncertainty Shapes Corporate Assets; NBER Working Paper; National Bureau of Economic Research: Cambridge, MA, USA, 2021. [Google Scholar]
- Baker, S.R.; Bloom, N.; Davis, S.J.; Terry, S.J. COVID-Induced Economic Uncertainty; NBER Working Paper; National Bureau of Economic Research: Cambridge, MA, USA, 2020. [Google Scholar]
- Kong, D.; Liu, S.; Wang, Y. Market competition, property rights and government subsidies. Econ. Res. J. 2013, 48, 55–67. [Google Scholar]
- Fang, X.; Hu, D. Corporate ESG performance and innovation-evidence from A-share listed companies. Econ. Res. J. 2023, 58, 91–106. [Google Scholar]
- Li, J.; Wang, F.; Xu, C. The impact of private equity investment characteristics on the value of investee companies--a study based on empirical data of IPO companies from 2008–2012. Nankai Bus. Rev. 2015, 18, 151–160. [Google Scholar]
- Li, C.; Yan, X.; Song, M. Financial technology and corporate innovation-evidence from NSS listed companies. China Ind. Econ. 2020, 382, 81–98. [Google Scholar]
- He, Y.; Yu, W.; Dai, Y. Executive career experience and corporate innovation. J. Manag. World 2019, 35, 174–192. [Google Scholar]
- Stock, J.; Yogo, M. Testing for Weak Instruments in Linear IV Regression; National Bureau of Economic Research: Cambridge, MA, USA, 2002. [Google Scholar]
- Newspaper-Based Uncertainty Indices for China. Available online: https://www.policyuncertainty.com/china_epu.html (accessed on 4 May 2023).
- Sung, B. Do government subsidies promote firm-level innovation? Evidence from the Korean renewable energy technology industry. Energy Policy 2019, 132, 1333–1344. [Google Scholar] [CrossRef]
- Zhao, Q.; Wang, Y. Pay gap, inventor promotion and firm technological innovation. J. World Econ. 2019, 42, 94–119. [Google Scholar]
- Minton, B.; Schrand, C. The impact of cash flow volatility on discretionary investment and the costs of debt and equity financing. J. Financ. Econ. 1999, 54, 423–460. [Google Scholar] [CrossRef] [Green Version]
- Zeng, A.; Fu, Y.; Wei, Z. Financial crisis shocks, financial flexibility reserves and corporate financing behavior: Empirical evidence from Chinese listed companies. J. Financ. Res. 2011, 376, 155–169. [Google Scholar]
- Bergh, D.; Lawless, M. Portfolio restructuring and limits to hierarchical governance: The impact of environmental uncertainty and diversification strategies. Organ. Sci. 1998, 9, 87–102. [Google Scholar] [CrossRef]
- Dess, G.; Beard, D. Dimensions of organizational task environments. Adm. Sci. Q. 1984, 29, 52–73. [Google Scholar] [CrossRef]
- Han, H.; Nguyen, N.; Nguyen, H. Policy uncertainty and firm cash holdings. J. Bus. Res. 2019, 95, 71–82. [Google Scholar]
- Hayward, M.; Hambrick, D. Explaining the premiums paid for large acquisitions: Evidence of CEO arrogance. Adm. Sci. Q. 1997, 42, 103–127. [Google Scholar] [CrossRef]
- Li, F.; Yang, M. Does economic policy uncertainty inhibit corporate investment--an empirical study based on the China economic policy uncertainty index. J. Financ. Res. 2015, 418, 115–129. [Google Scholar]
- Rao, P.; Yue, H.; Jiang, G. A study on economic policy uncertainty and firms’ investment behavior. J. World Econ. 2017, 40, 27–51. [Google Scholar]
- Shen, H.; Yu, P.; Wu, L. State-owned equity, environmental uncertainty and investment efficiency. Econ. Res. J. 2012, 47, 113–126. [Google Scholar]
- Ghosh, D.; Olsen, L. Environmental uncertainty and managers’ use of discretionary accruals. Account. Organ. Soc. 2009, 34, 188–205. [Google Scholar] [CrossRef]
- Liu, J.; Luo, F.; Wang, J. Environmental uncertainty and firms’ innovation investment—The moderating role of government subsidies and industry-finance integration. Bus. Manag. J. 2019, 41, 21–39. [Google Scholar]
- O’Hara, M.; Shaw, W. Deposit insurance and wealth effects: The value of being “too big to fail”. J. Financ. 1990, 45, 1587–1600. [Google Scholar]
- Gandhi, P.; Lustig, H. Size anomalies in us bank stock returns. J. Financ. 2015, 70, 733–768. [Google Scholar] [CrossRef]
- Calomiris, C.W.; Haber, S.H. Fragile by Design; Princeton University Press: Princeton, NJ, USA, 2014. [Google Scholar]
- Ewert, R.; Wagenhofer, A. Economic relations among earnings quality measures. Abacus 2015, 51, 311–355. [Google Scholar] [CrossRef]
- Ewert, R.; Wagenhofer, A. Why more forward-looking accounting standards can reduce financial reporting quality. Eur. Account. Rev. 2016, 25, 487–513. [Google Scholar] [CrossRef]
- Dantas, M.; Merkley, K.J.; Silva, F.B.G. Government Guarantees and Banks’ Income Smoothing. J. Financ. Serv. Res. 2023, 63, 123–173. [Google Scholar] [CrossRef]
- Cortes, G.S.; Gao, G.P.; Silva, F.B.; Song, Z. Unconventional Monetary Policy and Disaster Risk: Evidence from the Subprime and COVID–19 Crises. J. Int. Money Financ. 2022, 122, 102543. [Google Scholar] [CrossRef] [PubMed]
- Iacoviello, M.; Navarro, G. Foreign Effects of Higher US Interest Rates. J. Int. Money Financ. 2019, 95, 232–250. [Google Scholar] [CrossRef]
- Dedola, L.G.; Georgiadis, J.; Gräb, A. Mehl. Does a Big Bazooka Matter? Quantitative Easing Policies and Exchange Rates. J. Monet. Econ. 2021, 117, 489–506. [Google Scholar] [CrossRef]
- Born, B.; Müller, G.J.; Schularick, M.; Sedlácek, P. The Costs of Economic Nationalism: Evidence from the Brexit Experiment. Econ. J. 2019, 129, 2722–2744. [Google Scholar] [CrossRef] [Green Version]

| Type | Name | Symbols | Definition |
|---|---|---|---|
| Dependent Variables | R&D investment | lnR&D | Add one to the amount of R&D investment and take the natural logarithm |
| Patent output | lnPat | The patents filed in the current year are added by one and the natural logarithm is taken. | |
| The core independent variable | Economic Policy Uncertainty | epu | Economic Policy Uncertainty Index, which converts monthly indicators into annual indicators through arithmetic averages. |
| Moderating Variable | Government subsidies | sub | Ratio of government subsidies to revenue from main business |
| Control variables | Shareholding ratio of the first largest shareholder | top1 | Number of shares held by the first largest shareholder as a percentage of the total number of shares |
| Operating income growth rate | growth | Ratio of current year operating income to prior period operating income of listed agricultural enterprises minus 1 | |
| Minority interests as a percentage of | mino | Minority interests as a percentage of owners’ equity | |
| Tangible assets ratio | tangibility | Tangible assets as a percentage of total company assets | |
| Cash Flow Ratio | cashflow | Corporate cash flow as a percentage of total assets | |
| Enterprise Value | tq | Ratio of market capitalization to total assets of a company | |
| Number of years on the market | lnage | Take logarithm of the number of years the company has been listed | |
| Board Size | board | The number of directors of the company is taken as a logarithm | |
| return on total assets | roa | Net profit as a percentage of total assets | |
| Return on Net Assets | roe | Net income as a percentage of shareholders’ equity | |
| Corporate Cash Flow | cfo | Cash flows from operating activities as a percentage of assets | |
| Dummy Variables | Nature of ownership | soe | Dummy variable, 1 for state-owned enterprises, 0 for non-state-owned enterprises |
| Industry Properties | ind | Dummy variable, 1 for basic agribusiness, 0 for manufacturing agribusiness | |
| Adjustment costs | adjust | Dummy variable, R&D investment above the industry average is 1, otherwise it is 0 |
| Variables | Mean | Sd | Min | Med | Max |
|---|---|---|---|---|---|
| lnR&D | 16.830 | 2.409 | 0 | 17.04 | 21.430 |
| lnPat | 2.441 | 1.460 | 0 | 2.565 | 6.161 |
| epu | 5.861 | 0.649 | 4.594 | 5.899 | 6.674 |
| sub | 38.630 | 1107 | 0 | 0.011 | 355.00 |
| top1 | 0.370 | 0.144 | 0.085 | 0.363 | 0.779 |
| growth | 0.236 | 0.488 | 0.001 | 0.156 | 13.960 |
| mino | 0.047 | 0.075 | −0.074 | 0.016 | 0.406 |
| tangibility | 0.934 | 0.061 | 0.561 | 0.951 | 1 |
| cashflow | −1.002 | 13.230 | −54.78 | −0.088 | 45.860 |
| tq | 2.466 | 1.749 | 0.891 | 1.931 | 16.920 |
| lnage | 2.013 | 0.951 | 0 | 2.138 | 3.367 |
| lnboard | 2.119 | 0.203 | 1.609 | 2.197 | 2.773 |
| roa | 0.071 | 0.072 | −0.263 | 0.062 | 0.324 |
| roe | 0.096 | 0.119 | −1.195 | 0.089 | 0.487 |
| cfo | 0.085 | 0.088 | −0.300 | 0.079 | 0.515 |
| soe | 0.343 | 0.475 | 0 | 0 | 1 |
| ind | 0.177 | 0.382 | 0 | 0 | 1 |
| adjust | 0.472 | 0.499 | 0 | 0 | 1 |
| (1) | (2) | (3) | (4) | |
|---|---|---|---|---|
| Variables | lnRDi,t | lnPatenti,t | lnRDi,t+1 | lnPatenti,t+1 |
| epu | 0.673 *** | 0.498 *** | 0.853 *** | 0.346 *** |
| (4.46) | (4.82) | (3.45) | (3.03) | |
| sub | ||||
| epu × sub | ||||
| top1 | 0.118 | −0.112 | −0.142 | −0.261 |
| (0.29) | (−0.41) | (−0.28) | (−0.78) | |
| growth | −0.037 | −0.053 *** | −0.037 | −0.057 *** |
| (−1.63) | (−3.62) | (−0.83) | (−2.77) | |
| mino | 2.897 *** | 1.960 *** | 3.194 *** | 1.574 ** |
| (3.36) | (3.73) | (2.58) | (2.35) | |
| tangibility | −1.484 | 0.501 | −0.573 | 1.026 |
| (−1.35) | (0.87) | (−0.40) | (1.52) | |
| cashflow | 0.002 | −0.014 *** | 0.002 | −0.014 *** |
| (0.28) | (−3.47) | (0.24) | (−2.84) | |
| tq | −0.033 | −0.077 *** | −0.065 | −0.079 ** |
| (−0.83) | (−3.52) | (−1.14) | (−2.39) | |
| age | 0.040 | 0.241 *** | 0.074 | 0.261 *** |
| (0.41) | (5.01) | (0.58) | (4.23) | |
| board | −0.162 | 0.302 | 0.255 | 0.165 |
| (−0.49) | (1.63) | (0.54) | (0.75) | |
| roa | 3.959 * | 2.781 ** | 9.581 *** | 1.802 |
| (1.83) | (2.18) | (3.74) | (1.04) | |
| roe | 0.411 | 0.327 | −0.842 | 1.249 |
| (0.38) | (0.53) | (−0.54) | (1.29) | |
| cfo | 1.959 * | 2.461 *** | 0.791 | 3.224 *** |
| (1.78) | (3.90) | (0.47) | (4.13) | |
| Constant | 14.092 *** | −3.674 *** | 11.144 *** | −2.786 ** |
| (8.73) | (−4.03) | (5.07) | (−2.55) | |
| n | 1504 | 1534 | 1040 | 1054 |
| R-squared | 0.159 | 0.223 | 0.163 | 0.219 |
| Industry | YES | YES | YES | YES |
| Year | YES | YES | YES | YES |
| Innovation Input | Innovation Output | |||
|---|---|---|---|---|
| Variables | (1) State Enterprise | (2) Non-State Enterprise | (3) State Enterprise | (4) Non-State Enterprise |
| lnR&D | lnR&D | lnPatent | lnPatent | |
| epu | 0.772 ** | 0.686 ** | 0.620 *** | 0.434 *** |
| (2.44) | (2.60) | (3.99) | (2.63) | |
| top1 | 1.465 * | −0.585 | −0.789 * | 0.339 |
| (1.74) | (−0.86) | (−1.90) | (0.92) | |
| growth | −0.037 | −0.032 | −0.278 ** | −0.043 *** |
| (−0.12) | (−0.76) | (−1.98) | (−4.11) | |
| mino | 2.084 | 3.536 *** | 1.902 *** | 2.371 *** |
| (1.28) | (2.93) | (2.75) | (3.38) | |
| tangibility | −6.358 *** | 2.516 * | 0.045 | 1.823 ** |
| (−3.09) | (1.74) | (0.05) | (2.44) | |
| cashflow | −0.001 | 0.003 | −0.008 | −0.015 *** |
| (−0.10) | (0.29) | (−1.28) | (−2.96) | |
| tq | −0.136 * | 0.043 | −0.039 | −0.069 ** |
| (−1.84) | (0.73) | (−1.29) | (−2.40) | |
| age | −0.060 | 0.121 | 0.267 *** | 0.264 *** |
| (−0.30) | (0.98) | (3.22) | (4.23) | |
| board | 0.391 | −0.299 | 0.269 | 0.479 * |
| (0.65) | (−0.62) | (0.95) | (1.93) | |
| roa | 5.927 * | 2.296 | 4.120 *** | 0.632 |
| (1.79) | (0.80) | (3.23) | (0.41) | |
| roe | 0.151 | 0.328 | −0.673 | 1.303 * |
| (0.10) | (0.23) | (−1.20) | (1.74) | |
| cfo | 1.600 | 3.033 ** | 0.934 | 3.215 *** |
| (0.82) | (2.03) | (1.06) | (3.80) | |
| Constant | 16.426 *** | 10.842 *** | −3.603 | −5.242 *** |
| (4.84) | (3.57) | (−1.66) | (−2.73) | |
| n | 638 | 866 | 642 | 892 |
| R-squared | 0.294 | 0.141 | 0.383 | 0.222 |
| Industry | YES | YES | YES | YES |
| Year | YES | YES | YES | YES |
| Chow Test | 6.49 *** | 2.56 *** | ||
| Variables | Innovation Input | Innovation Output | ||
|---|---|---|---|---|
| (1) Basic Agribusiness | (2) Manufacturing Agribusiness | (3) Basic Agribusiness | (4) Manufacturing Agribusiness | |
| lnRDi,t | lnRDi,t | lnPatenti,t | lnPatenti,t | |
| epu | 2.019 ** | 0.510 *** | 0.690 *** | 0.459 *** |
| (2.38) | (3.53) | (3.17) | (3.64) | |
| top1 | 2.346 | 0.390 | −1.272 ** | 0.235 |
| (1.59) | (0.91) | (−2.09) | (0.74) | |
| growth | 0.001 | −0.040 * | −0.071 | −0.053 *** |
| (0.00) | (−1.74) | (−0.46) | (−4.08) | |
| mino | 8.205 *** | 1.261 | 2.713 *** | 1.611 ** |
| (3.93) | (1.40) | (3.42) | (2.54) | |
| tangibility | −12.422 *** | 0.782 | 0.342 | 1.026 |
| (−3.15) | (0.75) | (0.28) | (1.55) | |
| cashflow | 0.037 * | −0.004 | −0.007 | −0.015 *** |
| (1.73) | (−0.60) | (−0.74) | (−3.36) | |
| tq | −0.049 | −0.038 | −0.029 | −0.100 *** |
| (−0.50) | (−0.91) | (−0.53) | (−4.14) | |
| age | −0.467 * | 0.144 | −0.369 *** | 0.358 *** |
| (−1.77) | (1.35) | (−2.86) | (6.88) | |
| board | 1.325 * | −0.176 | 0.836 ** | 0.302 |
| (1.94) | (−0.48) | (2.35) | (1.37) | |
| roa | −15.503 | 4.856 ** | −7.419 ** | 4.117 *** |
| (−1.65) | (2.34) | (−2.30) | (3.19) | |
| roe | 12.334 ** | −0.816 | 4.829 *** | −0.223 |
| (2.38) | (−0.82) | (2.89) | (−0.38) | |
| cfo | −3.330 | 3.758 *** | −0.342 | 3.114 *** |
| (−1.18) | (3.71) | (−0.29) | (4.29) | |
| Constant | 13.564 ** | 12.689 *** | −3.815 * | −5.177 *** |
| (2.07) | (4.62) | (−1.76) | (−3.17) | |
| n | 321 | 1183 | 325 | 1209 |
| R-squared | 0.358 | 0.100 | 0.315 | 0.204 |
| Industry | YES | YES | YES | YES |
| Year | YES | YES | YES | YES |
| Chow Test | 7.29 *** | 8.06 *** | ||
| Variables | Innovation Input | Innovation Output | ||
|---|---|---|---|---|
| (1) High Adjustment Cost Companies | (2) Low Adjustment Cost Companies | (3) High Adjustment Cost Companies | (4) Low Adjustment Cost Companies | |
| lnR&D | lnR&D | lnPat | lnPat | |
| epu | 2.986 *** | 4.148 * | 1.348 *** | 0.687 |
| (4.09) | (1.76) | (3.01) | (1.42) | |
| top1 | 0.871 ** | −1.098 | 1.281 *** | −1.397 *** |
| (1.98) | (−1.25) | (2.98) | (−2.68) | |
| growth | −0.025 | −0.975 * | −0.143 | 0.150 |
| (−0.35) | (−1.70) | (−1.16) | (0.61) | |
| mino | 1.793 | 4.051 *** | 3.317 *** | 0.673 |
| (1.43) | (3.37) | (2.90) | (0.96) | |
| tangibility | −0.116 | −0.746 | 2.348 ** | −0.933 |
| (−0.13) | (−0.58) | (2.31) | (−1.12) | |
| cashflow | −0.008 | −0.002 | −0.011 | −0.013 ** |
| (−1.08) | (−0.23) | (−1.52) | (−2.47) | |
| tq | −0.032 | 0.065 | −0.111 ** | 0.020 |
| (−0.63) | (1.31) | (−2.34) | (0.56) | |
| age | 0.485 *** | −0.228 | 0.528 *** | 0.092 |
| (5.07) | (−1.38) | (6.10) | (1.17) | |
| board | −0.252 | −0.263 | 0.384 | 0.388 |
| (−0.47) | (−0.58) | (1.21) | (1.20) | |
| roa | 4.390 | 2.451 | 2.474 | 1.792 |
| (1.26) | (0.65) | (0.65) | (0.91) | |
| roe | 0.917 | −0.364 | 1.238 | −0.269 |
| (0.39) | (−0.25) | (0.44) | (−0.32) | |
| cfo | 1.051 | 2.763 * | 1.400 | 1.123 |
| (0.61) | (1.68) | (1.09) | (1.24) | |
| Constant | −1.781 | −7.000 | −11.572 *** | −3.054 |
| (−0.45) | (−0.48) | (−3.51) | (−0.93) | |
| n | 499 | 555 | 499 | 555 |
| R-squared | 0.276 | 0.177 | 0.282 | 0.245 |
| Industry | YES | YES | YES | YES |
| Year | YES | YES | YES | YES |
| Chow test | 6.11 *** | 8.28 *** | ||
| Variables | Innovation Input: lnR&D | Innovation Output: lnPat | ||||
|---|---|---|---|---|---|---|
| Baseline Return 1 | Phase I | Phase II | Baseline return | Phase I | Phase II | |
| lnx1 | 0.761 *** | 0.502 *** | 0.527 *** | 0.522 *** | ||
| (6.95) | (3.53) | (10.08) | (7.27) | |||
| iv | 1.707 *** | 1.717 *** | ||||
| (41.77) | (42.84) | |||||
| top1 | 0.153 | 0.010 | 0.133 | −0.131 | −0.009 | −0.308 |
| (0.38) | (0.12) | (0.26) | (−0.47) | (−0.10) | (−1.17) | |
| growth | −0.028 | −0.011 | −0.035 | −0.050 *** | −0.009 | −0.048 ** |
| (−1.18) | (−1.55) | (−0.87) | (−3.17) | (−1.37) | (−2.28) | |
| mino | 2.883 *** | −0.330 ** | 2.731 *** | 1.776 *** | −0.423 *** | 1.104 ** |
| (3.28) | (−2.08) | (2.89) | (3.43) | (−2.85) | (2.41) | |
| tangibility | −1.425 | −0.169 | −1.468 | 0.437 | −0.197 | 0.363 |
| (−1.31) | (−0.88) | (−1.28) | (0.77) | (−1.05) | (0.63) | |
| cashflow | −0.000 | −0.001 | −0.002 | −0.014 *** | −0.001 | −0.017 *** |
| (−0.02) | (−0.88) | (−0.28) | (−3.53) | (−1.09) | (−4.44) | |
| tq | 0.000 | −0.025 *** | −0.002 | −0.065 *** | −0.025 *** | −0.081 *** |
| (0.01) | (−3.29) | (−0.04) | (−3.07) | (−3.37) | (−3.55) | |
| age | 0.052 | 0.084 *** | 0.095 | 0.244 *** | 0.076 *** | 0.231 *** |
| (0.54) | (5.20) | (0.97) | (5.02) | (4.94) | (4.82) | |
| board | −0.248 | −0.363 *** | −0.419 | 0.214 | −0.354 *** | 0.154 |
| (−0.74) | (−5.93) | (−1.12) | (1.14) | (−6.24) | (0.86) | |
| roa | 2.837 | 0.035 | 3.128 | 2.618 * | 0.006 | 2.921 *** |
| (1.32) | (0.09) | (1.44) | (1.96) | (0.02) | (2.66) | |
| roe | 0.417 | −0.312 * | 0.280 | 0.527 | −0.302 * | 0.459 |
| (0.39) | (−1.78) | (0.27) | (0.82) | (−1.75) | (0.86) | |
| cfo | 2.514 ** | 1.158 *** | 2.998 ** | 2.405 *** | 1.191 *** | 2.940 *** |
| (2.28) | (5.93) | (2.53) | (3.82) | (6.32) | (4.96) | |
| Constant | 13.032 *** | −2.207 *** | 14.795 *** | −3.328 *** | −2.194 *** | −2.219 *** |
| (9.19) | (−7.00) | (8.85) | (−4.46) | (−7.24) | (−2.67) | |
| Observations | 1504 | 1504 | 1504 | 1534 | 1534 | 1534 |
| R-squared | 0.141 | 0.589 | 0.137 | 0.197 | 0.588 | 0.153 |
| Industry | YES | YES | YES | YES | YES | YES |
| Cragg-Donald Wald F | 1787.330 | 1835.452 | ||||
| Variables | (1) | (2) | (3) | (4) |
|---|---|---|---|---|
| lnR&Di,t | lnPati,t | lnR&Di,t+1 | lnPati,t+1 | |
| epu | 0.715 *** | 0.530 *** | 0.920 *** | 0.374 *** |
| (4.46) | (4.82) | (3.45) | (3.03) | |
| top1 | 0.118 | −0.112 | −0.142 | −0.261 |
| (0.29) | (−0.41) | (−0.28) | (−0.78) | |
| growth | −0.037 | −0.053 *** | −0.037 | −0.057 *** |
| (−1.63) | (−3.62) | (−0.83) | (−2.77) | |
| mino | 2.897 *** | 1.960 *** | 3.194 *** | 1.574 ** |
| (3.36) | (3.73) | (2.58) | (2.35) | |
| tangibility | −1.484 | 0.501 | −0.573 | 1.026 |
| (−1.35) | (0.87) | (−0.40) | (1.52) | |
| cashflow | 0.002 | −0.014 *** | 0.002 | −0.014 *** |
| (0.28) | (−3.47) | (0.24) | (−2.84) | |
| tq | −0.033 | −0.077 *** | −0.065 | −0.079 ** |
| (−0.83) | (−3.52) | (−1.14) | (−2.39) | |
| age | 0.040 | 0.241 *** | 0.074 | 0.261 *** |
| (0.41) | (5.01) | (0.58) | (4.23) | |
| board | −0.162 | 0.302 | 0.255 | 0.165 |
| (−0.49) | (1.63) | (0.54) | (0.75) | |
| roa | 3.959 * | 2.781 ** | 9.581 *** | 1.802 |
| (1.83) | (2.18) | (3.74) | (1.04) | |
| roe | 0.411 | 0.327 | −0.842 | 1.249 |
| (0.38) | (0.53) | (−0.54) | (1.29) | |
| cfo | 1.959 * | 2.461 *** | 0.791 | 3.224 *** |
| (1.78) | (3.90) | (0.47) | (4.13) | |
| Constant | 14.256 *** | −3.553 *** | 11.298 *** | −2.724 ** |
| (8.94) | (−3.96) | (5.20) | (−2.53) | |
| n | 1504 | 1534 | 1040 | 1054 |
| R-squared | 0.159 | 0.223 | 0.163 | 0.219 |
| Industry | YES | YES | YES | YES |
| Year | YES | YES | YES | YES |
| (1) | (2) | (3) | (4) | |
|---|---|---|---|---|
| Variables | lnR&Di,t | lnPati,t | lnR&Di,t+1 | lnPati,t+1 |
| epu | 0.697 *** | 0.517 *** | 0.886 *** | 0.360 *** |
| (4.46) | (4.82) | (3.45) | (3.03) | |
| top1 | 0.118 | −0.112 | −0.142 | −0.261 |
| (0.29) | (−0.41) | (−0.28) | (−0.78) | |
| growth | −0.037 | −0.053 *** | −0.037 | −0.057 *** |
| (−1.63) | (−3.62) | (−0.83) | (−2.77) | |
| mino | 2.897 *** | 1.960 *** | 3.194 *** | 1.574 ** |
| (3.36) | (3.73) | (2.58) | (2.35) | |
| tangibility | −1.484 | 0.501 | −0.573 | 1.026 |
| (−1.35) | (0.87) | (−0.40) | (1.52) | |
| cashflow | 0.002 | −0.014 *** | 0.002 | −0.014 *** |
| (0.28) | (−3.47) | (0.24) | (−2.84) | |
| tq | −0.033 | −0.077 *** | −0.065 | −0.079 ** |
| (−0.83) | (−3.52) | (−1.14) | (−2.39) | |
| age | 0.040 | 0.241 *** | 0.074 | 0.261 *** |
| (0.41) | (5.01) | (0.58) | (4.23) | |
| board | −0.162 | 0.302 | 0.255 | 0.165 |
| (−0.49) | (1.63) | (0.54) | (0.75) | |
| roa | 3.959 * | 2.781 ** | 9.581 *** | 1.802 |
| (1.83) | (2.18) | (3.74) | (1.04) | |
| roe | 0.411 | 0.327 | −0.842 | 1.249 |
| (0.38) | (0.53) | (−0.54) | (1.29) | |
| cfo | 1.959 * | 2.461 *** | 0.791 | 3.224 *** |
| (1.78) | (3.90) | (0.47) | (4.13) | |
| Constant | 13.955 *** | −3.776 *** | 10.960 *** | −2.861 *** |
| (8.55) | (−4.08) | (4.91) | (−2.58) | |
| n | 1504 | 1534 | 1040 | 1054 |
| R-squared | 0.159 | 0.223 | 0.163 | 0.219 |
| Industry | YES | YES | YES | YES |
| Year | YES | YES | YES | YES |
| Variables | R&D Innovation Intensity1 | R&D Innovation Intensity2 | Replacement of Sample Data | |||
|---|---|---|---|---|---|---|
| (1) R&D1i,t | (2) R&D1i,t+1 | (3) R&D2i,t | (4) R&D2i,t+1 | (5) R&Di,t | (6) R&Di,t+1 | |
| epu | 0.003 *** | 0.002 *** | 0.009 *** | 0.007 *** | 0.005 *** | 0.003 *** |
| (7.77) | (2.81) | (11.17) | (7.58) | (10.99) | (4.20) | |
| top1 | −0.004 * | −0.005 ** | −0.006 ** | −0.008 ** | −0.003 * | −0.005 ** |
| (−1.87) | (−2.05) | (−2.18) | (−2.25) | (−1.80) | (−1.97) | |
| growth | −0.000 * | −0.000 * | −0.000 | −0.000 | −0.000 * | −0.000 |
| (−1.88) | (−1.75) | (−0.62) | (−0.24) | (−1.71) | (−1.31) | |
| mino | −0.001 | −0.001 | −0.011 *** | −0.008 | −0.000 | −0.001 |
| (−0.26) | (−0.26) | (−2.83) | (−1.57) | (−0.18) | (−0.22) | |
| tangibility | −0.006 | −0.003 | −0.002 | 0.006 | −0.007 * | −0.003 |
| (−1.62) | (−0.81) | (−0.34) | (0.94) | (−1.83) | (−0.84) | |
| cashflow | −0.000 | −0.000 | −0.000 | −0.000 * | −0.000 | −0.000 |
| (−1.22) | (−0.10) | (−0.81) | (−1.76) | (−1.35) | (−0.37) | |
| tq | 0.000 ** | 0.000 | 0.000 | 0.000 | 0.000 | 0.000 |
| (2.02) | (1.31) | (1.48) | (0.85) | (0.73) | (0.98) | |
| age | −0.002 *** | −0.002 *** | −0.002 *** | −0.002 ** | −0.002 *** | −0.002 *** |
| (−4.59) | (−3.78) | (−3.87) | (−2.54) | (−4.77) | (−3.97) | |
| board | −0.002 * | −0.002 | −0.000 | 0.002 | −0.002 | −0.002 |
| (−1.69) | (−1.08) | (−0.15) | (0.58) | (−1.52) | (−1.11) | |
| roa | 0.006 | 0.013 | −0.000 | 0.011 | 0.008 | 0.013 |
| (0.93) | (1.38) | (−0.05) | (0.86) | (1.17) | (1.43) | |
| roe | 0.003 | 0.003 | 0.004 | −0.001 | 0.003 | 0.003 |
| (1.13) | (0.71) | (1.00) | (−0.22) | (1.02) | (0.81) | |
| cfo | 0.009 ** | −0.003 | −0.002 | −0.001 | 0.010 ** | −0.001 |
| (2.08) | (−0.45) | (−0.26) | (−0.18) | (2.47) | (−0.16) | |
| Constant | 0.005 | 0.010 | −0.018 ** | −0.022 ** | −0.005 | 0.003 |
| (0.90) | (1.36) | (−2.37) | (−2.38) | (−0.95) | (0.40) | |
| n | 1486 | 1033 | 1446 | 1011 | 1534 | 1054 |
| R-squared | 0.186 | 0.178 | 0.232 | 0.244 | 0.206 | 0.194 |
| Industry | YES | YES | YES | YES | YES | YES |
| Year | YES | YES | YES | YES | YES | YES |
| Variables | (1) | (2) | ||
|---|---|---|---|---|
| lnRDi,t | t-Value | lnPati,t | t-Value | |
| epu | 0.680 *** | 2.94 | 0.746 *** | 5.11 |
| top1 | 0.116 | 0.22 | −0.118 | −0.36 |
| growth | −0.037 | −0.88 | −0.057 ** | −2.26 |
| mino | 2.953 *** | 3.08 | 2.588 *** | 4.42 |
| tangibility | −1.569 | −1.35 | 0.239 | 0.33 |
| cashflow | 0.002 | 0.32 | −0.016 *** | −3.43 |
| tq | −0.034 | −0.73 | −0.113 *** | −3.68 |
| age | 0.034 | 0.34 | 0.257 *** | 4.22 |
| board | −0.166 | −0.44 | 0.406 * | 1.74 |
| roa | 3.977 * | 1.81 | 3.053 ** | 2.17 |
| roe | 0.419 | 0.40 | 0.725 | 1.04 |
| cfo | 1.909 | 1.60 | 2.906 *** | 3.89 |
| Constant | 14.151 *** | 7.24 | −5.613 *** | −4.55 |
| Observations | 1504 | 1534 | ||
| Controls | control | control | ||
| Industry | YES | YES | ||
| Year | YES | YES | ||
| Variables | Innovation Input | Innovation Output | ||||
|---|---|---|---|---|---|---|
| (1) | (2) | (3) | (4) | (5) | (6) | |
| lnR&Di,t | Financiali,t | lnR&Di,t | lnPati,t | Financiali,t | lnPati,t | |
| epu | 0.673 *** | −0.055 *** | 0.631 *** | 0.455 *** | −0.055 *** | 0.456 *** |
| (4.46) | (−3.20) | (4.25) | (4.35) | (−3.20) | (4.35) | |
| Financial | −1.341 *** | −0.770 *** | ||||
| (−2.81) | (−3.32) | |||||
| top1 | 0.118 | 0.034 | 0.142 | −0.089 | 0.034 | −0.086 |
| (0.29) | (0.84) | (0.35) | (−0.33) | (0.84) | (−0.31) | |
| growth | −0.037 | −0.001 | −0.037 * | −0.054 *** | −0.001 | −0.053 *** |
| (−1.63) | (−0.20) | (−1.66) | (−3.60) | (−0.20) | (−3.61) | |
| mino | 2.897 *** | −0.050 | 2.781 *** | 1.910 *** | −0.050 | 1.921 *** |
| (3.36) | (−0.71) | (3.25) | (3.61) | (−0.71) | (3.63) | |
| tangibility | −1.484 | 0.447 *** | −0.866 | 0.863 | 0.447 *** | 0.844 |
| (−1.35) | (5.03) | (−0.81) | (1.48) | (5.03) | (1.45) | |
| cashflow | 0.002 | 0.003 *** | 0.006 | −0.012 *** | 0.003 *** | −0.012 *** |
| (0.28) | (4.85) | (0.87) | (−2.96) | (4.85) | (−2.97) | |
| tq | −0.033 | 0.005 | −0.027 | −0.073 *** | 0.005 | −0.073 *** |
| (−0.83) | (1.38) | (−0.65) | (−3.35) | (1.38) | (−3.36) | |
| age | 0.040 | −0.066 *** | −0.048 | 0.188 *** | −0.066 *** | 0.191 *** |
| (0.41) | (−8.76) | (−0.48) | (3.70) | (−8.76) | (3.76) | |
| board | −0.162 | −0.057 ** | −0.271 | 0.249 | −0.057 ** | 0.258 |
| (−0.49) | (−2.01) | (−0.82) | (1.34) | (−2.01) | (1.39) | |
| roa | 3.959 * | 1.645 *** | 6.195 *** | 4.074 *** | 1.645 *** | 4.047 *** |
| (1.83) | (9.83) | (2.75) | (3.13) | (9.83) | (3.12) | |
| roe | 0.411 | −0.622 *** | −0.435 | −0.145 | −0.622 *** | −0.152 |
| (0.38) | (−7.77) | (−0.40) | (−0.24) | (−7.77) | (−0.25) | |
| cfo | 1.959 * | −0.171 * | 1.702 | 2.283 *** | −0.171 * | 2.329 *** |
| (1.78) | (−1.88) | (1.57) | (3.63) | (−1.88) | (3.72) | |
| Constant | 14.092 *** | 0.327 ** | 14.395 *** | −3.409 *** | 0.327 ** | −3.422 *** |
| (8.73) | (2.21) | (8.99) | (−3.76) | (2.21) | (−3.77) | |
| Observations | 1504 | 1534 | 1504 | 1532 | 1534 | 1534 |
| R-squared | 0.159 | 0.229 | 0.167 | 0.232 | 0.229 | 0.234 |
| Industry | YES | YES | YES | YES | YES | YES |
| Year | YES | YES | YES | YES | YES | YES |
| Variables | Innovation Input | Innovation Output | ||||
|---|---|---|---|---|---|---|
| (1) | (2) | (3) | (4) | (5) | (6) | |
| lnR&Di,t | Manageri,t | lnR&Di,t | lnPati,t | Manageri,t | lnPati,t | |
| epu | 0.673 *** | 0.028 ** | 0.712 *** | 0.498 *** | 0.028 ** | 0.536 *** |
| (4.46) | (2.58) | (4.71) | (4.82) | (2.58) | (5.13) | |
| Manager | −1.599 *** | −1.338 *** | ||||
| (−2.69) | (−5.00) | |||||
| top1 | 0.118 | 0.046 * | 0.198 | −0.112 | 0.046 * | −0.050 |
| (0.29) | (1.67) | (0.50) | (−0.41) | (1.67) | (−0.18) | |
| growth | −0.037 | 0.010 *** | −0.021 | −0.053 *** | 0.010 *** | −0.040 *** |
| (−1.63) | (3.31) | (−0.91) | (−3.62) | (3.31) | (−3.07) | |
| mino | 2.897 *** | 0.106 * | 3.017 *** | 1.960 *** | 0.106 * | 2.102 *** |
| (3.36) | (1.92) | (3.54) | (3.73) | (1.92) | (4.23) | |
| tangibility | −1.484 | −0.107 | −1.679 | 0.501 | −0.107 | 0.358 |
| (−1.35) | (−1.62) | (−1.58) | (0.87) | (−1.62) | (0.65) | |
| cashflow | 0.002 | 0.001 ** | 0.003 | −0.014 *** | 0.001 ** | −0.013 *** |
| (0.28) | (2.02) | (0.45) | (−3.47) | (2.02) | (−3.29) | |
| tq | −0.033 | 0.008 *** | −0.021 | −0.077 *** | 0.008 *** | −0.066 *** |
| (−0.83) | (3.24) | (−0.51) | (−3.52) | (3.24) | (−3.18) | |
| age | 0.040 | −0.003 | 0.035 | 0.241 *** | −0.003 | 0.237 *** |
| (0.41) | (−0.64) | (0.36) | (5.01) | (−0.64) | (4.95) | |
| board | −0.162 | −0.183 *** | −0.462 | 0.302 | −0.183 *** | 0.057 |
| (−0.49) | (−9.11) | (−1.38) | (1.63) | (−9.11) | (0.29) | |
| roa | 3.959 * | −0.078 | 3.907 * | 2.781 ** | −0.078 | 2.677 ** |
| (1.83) | (−0.45) | (1.81) | (2.18) | (−0.45) | (2.27) | |
| roe | 0.411 | 0.069 | 0.487 | 0.327 | 0.069 | 0.420 |
| (0.38) | (0.73) | (0.45) | (0.53) | (0.73) | (0.75) | |
| cfo | 1.959 * | −0.113 * | 1.766 | 2.461 *** | −0.113 * | 2.310 *** |
| (1.78) | (−1.79) | (1.58) | (3.90) | (−1.79) | (3.72) | |
| Constant | 14.092 *** | 0.786 *** | 15.425 *** | −3.674 *** | 0.786 *** | −2.623 *** |
| (8.73) | (7.98) | (9.85) | (−4.03) | (7.98) | (−2.81) | |
| Observations | 1504 | 1534 | 1504 | 1534 | 1534 | 1534 |
| R-squared | 0.159 | 0.163 | 0.164 | 0.223 | 0.163 | 0.236 |
| Industry | YES | YES | YES | YES | YES | YES |
| Year | YES | YES | YES | YES | YES | YES |
| Variables | (1) | (2) | ||
|---|---|---|---|---|
| lnR&Di,t | t-Value | lnPati,t | t-Value | |
| epu | 0.665 *** | 4.41 | 0.492 *** | 4.74 |
| sub | −0.005 ** | −2.28 | −0.011 *** | −6.80 |
| epu∗sub | 0.001 ** | 2.29 | 0.002 *** | 6.85 |
| top1 | 0.102 | 0.25 | 0.038 | 0.14 |
| growth | −0.063 * | −1.75 | −0.070 ** | −2.50 |
| mino | 3.052 *** | 3.42 | 2.007 *** | 3.78 |
| tangibility | −1.560 | −1.31 | 0.369 | 0.61 |
| cashflow | 0.003 | 0.41 | −0.015 *** | −3.57 |
| tq | −0.028 | −0.69 | −0.080 *** | −3.66 |
| age | 0.021 | 0.21 | 0.275 *** | 5.67 |
| board | −0.194 | −0.58 | 0.359 * | 1.93 |
| roa | 3.745 * | 1.72 | 2.879 ** | 2.26 |
| roe | 0.475 | 0.44 | 0.239 | 0.39 |
| cfo | 1.950 * | 1.75 | 2.548 *** | 4.01 |
| Constant | 14.310 *** | 8.52 | −3.767 *** | −4.09 |
| n | 1477 | 1506 | ||
| R-squared | 0.163 | 0.235 | ||
| Industry | YES | YES | ||
| Year | YES | YES | ||
| Variables | (1) | (2) | (3) | (4) |
|---|---|---|---|---|
| lnR&Di,t | lnPati,t | lnR&Di,t+1 | lnPati,t+1 | |
| epu | 0.742 *** | 0.446 *** | 0.943 *** | 0.367 *** |
| (4.68) | (4.13) | (3.62) | (3.05) | |
| eu | −0.320 *** | −0.229 *** | −0.341 *** | −0.225 *** |
| (−3.76) | (−6.28) | (−2.77) | (−5.20) | |
| top1 | −0.188 | −0.547 * | −0.660 | −0.865 ** |
| (−0.40) | (−1.82) | (−1.07) | (−2.38) | |
| growth | 0.070 ** | 0.024 ** | 0.082 ** | 0.024 |
| (2.55) | (2.02) | (2.44) | (1.41) | |
| mino | 2.705 *** | 1.891 *** | 3.257 ** | 1.568 ** |
| (3.01) | (3.71) | (2.42) | (2.44) | |
| tangibility | −1.585 | 0.682 | −0.569 | 1.182 * |
| (−1.38) | (1.19) | (−0.37) | (1.77) | |
| cashflow | 0.001 | −0.020 *** | −0.001 | −0.020 *** |
| (0.12) | (−4.09) | (−0.07) | (−3.29) | |
| tq | −0.034 | −0.063 *** | −0.093 | −0.086 ** |
| (−0.79) | (−2.89) | (−1.48) | (−2.53) | |
| age | −0.105 | 0.287 *** | −0.120 | 0.255 *** |
| (−0.75) | (4.35) | (−0.59) | (3.13) | |
| board | −0.340 | 0.024 | 0.103 | −0.124 |
| (−0.93) | (0.12) | (0.19) | (−0.54) | |
| roa | 5.136 ** | 3.450 *** | 11.959 *** | 3.228 ** |
| (2.15) | (2.70) | (4.31) | (1.97) | |
| roe | −0.184 | −0.016 | −1.818 | 0.580 |
| (−0.17) | (−0.03) | (−1.17) | (0.72) | |
| cfo | 1.784 | 2.729 *** | 0.890 | 3.730 *** |
| (1.31) | (3.93) | (0.41) | (4.33) | |
| Constant | 15.048 *** | −2.703 *** | 11.994 *** | −1.983 * |
| (8.95) | (−2.91) | (5.14) | (−1.75) | |
| Observations | 1266 | 1288 | 855 | 864 |
| R-squared | 0.178 | 0.272 | 0.182 | 0.285 |
| Industry | YES | YES | YES | YES |
| Year | YES | YES | YES | YES |
Disclaimer/Publisher’s Note: The statements, opinions and data contained in all publications are solely those of the individual author(s) and contributor(s) and not of MDPI and/or the editor(s). MDPI and/or the editor(s) disclaim responsibility for any injury to people or property resulting from any ideas, methods, instructions or products referred to in the content. |
© 2023 by the authors. Licensee MDPI, Basel, Switzerland. This article is an open access article distributed under the terms and conditions of the Creative Commons Attribution (CC BY) license (https://creativecommons.org/licenses/by/4.0/).
Share and Cite
Li, L.; Gao, Y.; Wang, X. Impact of Economic Policy Uncertainty on Agribusiness Technology Innovation: Evidence from 231 Listed Firms in China. Sustainability 2023, 15, 10037. https://doi.org/10.3390/su151310037
Li L, Gao Y, Wang X. Impact of Economic Policy Uncertainty on Agribusiness Technology Innovation: Evidence from 231 Listed Firms in China. Sustainability. 2023; 15(13):10037. https://doi.org/10.3390/su151310037
Chicago/Turabian StyleLi, Lanlan, Yanlei Gao, and Xiudong Wang. 2023. "Impact of Economic Policy Uncertainty on Agribusiness Technology Innovation: Evidence from 231 Listed Firms in China" Sustainability 15, no. 13: 10037. https://doi.org/10.3390/su151310037