In this section, the results obtained in a study aiming to assess literacy to biotechnological solutions for environmental sustainability conducted in Portugal are presented. Among the 500 questionnaires distributed, 29 (5.8%) were discarded from the study due to the absence of responses to the second section. Therefore, the results presented below are based on the responses of 471 participants.
4.1. Frequency of Response Analysis
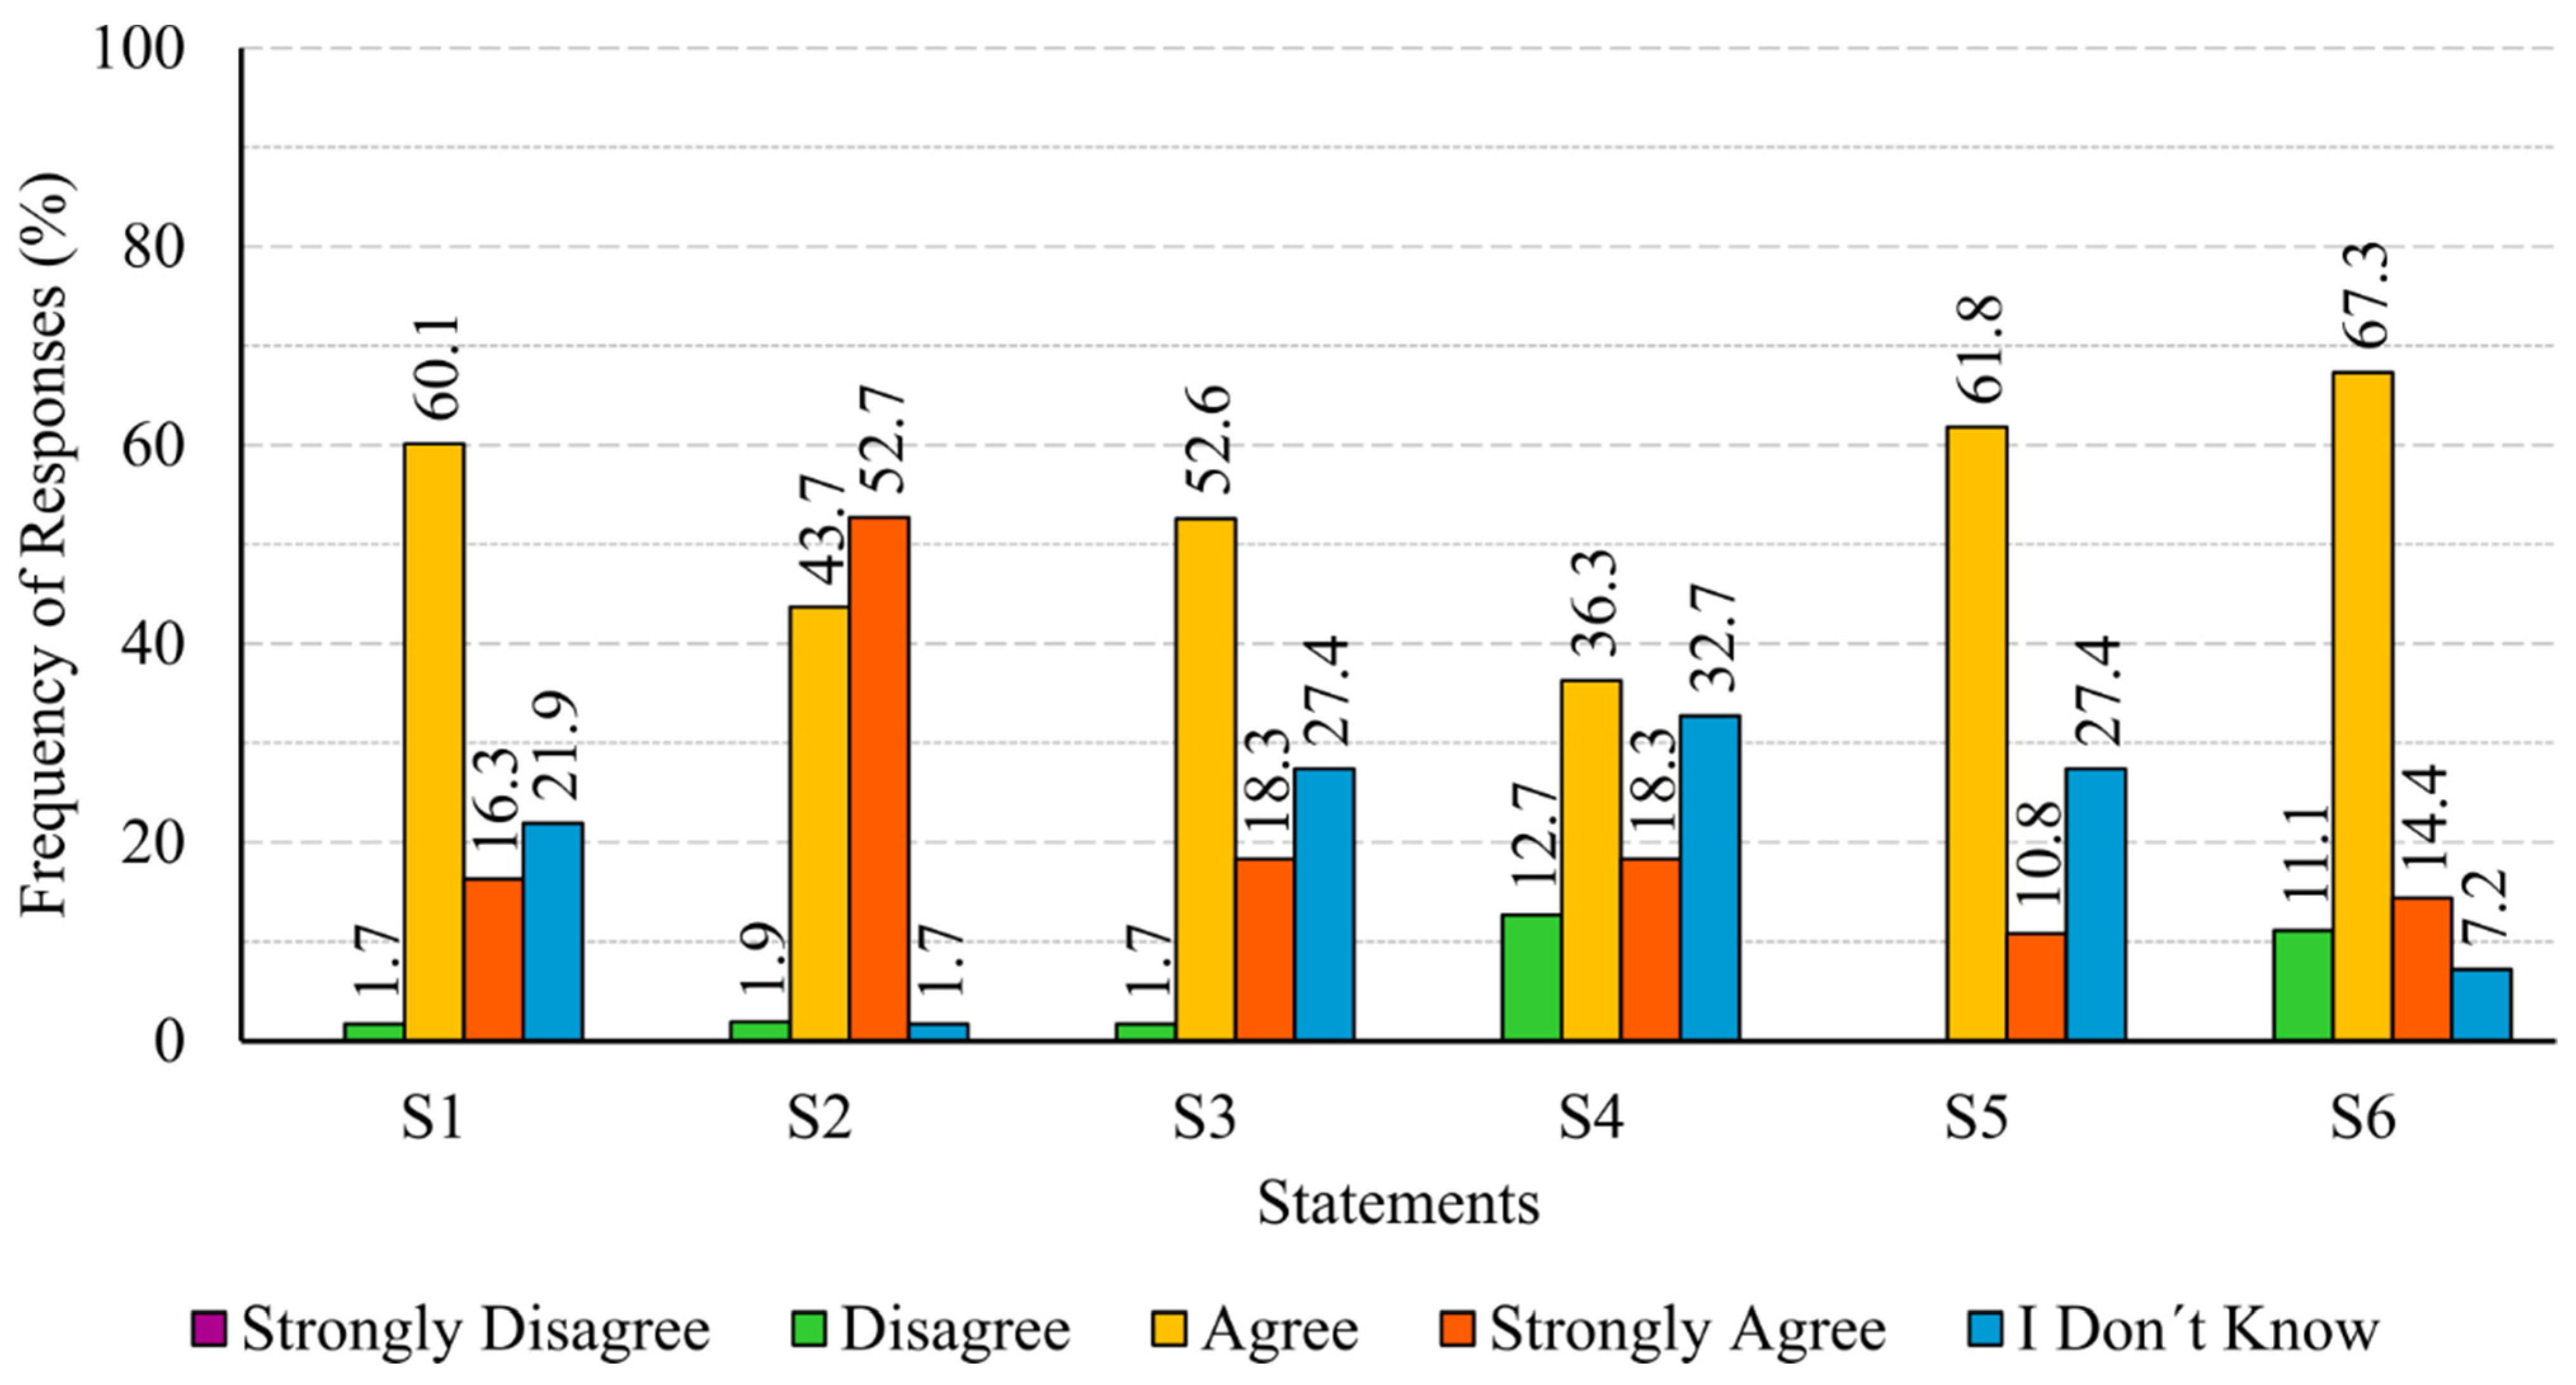
The graph presented in
Figure 1 shows the frequencies of responses relative to the statements included in the Air Pollution theme. Its analysis shows that the response most often given to statements 1, 3, 4, 5, and 6 was agree, and the mean values for Likert scale responses varied between 3.04 and 3.23. In the case of statement 1 (related to the use of biofuels), the response frequency was 60.1%. Regarding statement 3 (related to the use of biofilters), the respective frequency was 52.6%. Concerning statement 4 (related to the use of activated carbon), 36.3% of participants selected the option agree, while for statements 5 (related to the use of catalytic converters) and 6 (related to contamination by pesticides/fertilizers), those frequencies were 61.8% and 67.3%, respectively. In statement 2 (related to the use of combustion engines), the most chosen option was strongly agree (52.7%), followed by the option agree (43.7%). In this case, the mean value for Likert scale responses was 3.52.
None of the participants who chose the option strongly disagree. The option disagree was selected by less than 2% of participants for statements 1, 2, and 3, while for statements 4 and 6, more than 10% of participants marked this option.
Finally, it is worth highlighting that the option I don’t know was selected in all statements. Statement 4 obtained the highest number of responses I don’t know, with 32.7%, followed by statements 3 and 5, both with 27.4%, and statement 1, with 21.9%. Concerning statements 6 and 2, this percentage was lower (i.e., 7.2% and 1.7%, respectively).
The results presented in
Figure 1 shows that the issues related to biofuels, biofilters, activated carbon, and catalytic converters are unknown to a considerable percentage of participants. However, they show that the level of literacy regarding some issues (combustion engines and pesticides/fertilizers) of the topic of Air Pollution is high. These results are in accordance with those obtained by other authors who have conducted studies on this subject [
6,
52,
53].
The graph presented in
Figure 2 shows the frequency of responses related to the statements included in the topic of Aquatic Pollution. Its analysis shows that the response most frequently given to statements 7, 8, 9, 10, and 12 was agree, and the mean values for Likert scale responses varied between 3.11 and 3.44. In the case of statement 7 (related to the use of microorganisms for decontamination), the frequency of response was 43.5%. Regarding statement 8 (related to the use of plants for decontamination), the respective frequency was 51.0%. Concerning statement 9 (related to pollution by fertilizers/pesticides), 60.1% of participants selected the option agree, while in statements 10 (related to contamination by chemical products) and 12 (related to the environmental awareness of beach users), these frequencies were 67.3% and 54.6%, respectively. In statement 11 (related to the dumping of industrial sewage), the most chosen option was strongly agree (67.3%). In this case, the mean value for Likert scale responses was 3.67. It should be noted that in statement 12, most participants answered agree (54.6%), but there was also a high percentage (43.5%) who answered strongly agree.
None of the participants chose the option strongly disagree. The option disagree was selected by less than 2% of participants for statements 7 and 9 (i.e., 1.9% and 1.7%, respectively), while for statement 8, this option was ticked by 10.8% of participants. Finally, with regard to the option I don’t know, statements 7 and 8 obtained the highest percentage of responses I don’t know (36.3% and 18.2%, respectively). For the remaining statements, this percentage did not exceed 6%.
The results obtained regarding the topic of Aquatic Pollution (
Figure 2) show that the issues related to bioremediation/phytoremediation are unknown to a considerable percentage of participants. However, when considered as a whole, the results show high levels of literacy regarding this topic. This result disagrees with those obtained by O’Halloran and Silver [
74] and Steel et al. [
75]. This discrepancy may be related to the fact that the samples include individuals from different countries with very different habits and cultures.
The graph presented in
Figure 3 shows the frequency of responses related to statements included in the theme of Global Warming. The analysis of the graph shows that the response most often given to statements 13, 14, 15, and 16 was agree, and the mean values for Likert scale responses varied between 3.27 and 3.42. In the case of statement 13 (related to the use of fossil fuels), the frequency of response was 63.7%. Concerning statement 14 (related to polar ice melting), the respective frequency was 60.1%, whereas for statement 15 (related to deforestation) and statement 16 (related to the use of CFCs), the frequency of response was 58.2% and 49.9%, respectively. Regarding statement 17 (related to adopting more sustainable behaviors), the most chosen option was strongly agree (51.0%), followed by the option agree (49.0%). In this case, the mean value for Likert scale responses was 3.51. Regarding the options strongly disagree and disagree, it was not chosen by any of the participants, except for statements 14 and 15, where the option disagree was marked by 1.9% and 1.7% of participants, respectively.
In this set of statements, the one in which the option I don’t know was chosen by the highest percentage of participants was statement 16, with 31.0%, followed by statements 13 and 15, both with 12.7%. In the remaining statements, this percentage did not exceed 2%.
The overall analysis of the results presented in
Figure 3 shows that participants exhibit a high level of literacy regarding some issues (glaciers melting and adoption of sustainable behaviors) of the topic of Global Warming. However, a high percentage of participants are unaware of the role of CFC in the depletion of the ozone layer. These findings are consistent with the results reported by other authors [
6,
49,
50].
The graph presented in
Figure 4 shows the frequency of responses related to the statements included in the topic of Energy Resources. Upon analyzing the graph, it can be observed that the option agree was the most selected in all statements of this group, and the mean values for Likert scale responses varied between 2.89 and 3.49. In the case of statement 18 (related to the use of renewable energy), the percentage of participants who selected this option was 54.6%. In statements 19 (related to the use of biogas) and 20 (related to the inexhaustibility of renewable energy), the percentage of responses agree was 47.3%, while in statements 21 (related to the environmental impact of renewable energy) and 22 (related to CO
2 emissions) the percentage of responses agree were 67.3% and 43.7%, respectively. Furthermore, it can be noted that for statements 18, 21, and 22, the second most commonly selected option was strongly agree, with percentages of 43.5%, 21.9%, and 41.8%, respectively.
It should also be noted that statement 20 was the only one in which the option strongly disagree was selected (3.6%). Concerning the option disagree, it was marked by 1.7% and 14.4% of participants in statements 19 and 20, respectively.
Finally, with regard to the option I don’t know, statements 19 and 20 obtained the highest number of responses (45.5% and 21.9%, respectively). In statements 21 and 22, this percentage was not beyond 15%, and it was only 1.9% in statement 18.
The results depicted in
Figure 4 indicate that a relatively high percentage of participants demonstrate a lack of knowledge regarding issues related to biogas and the inexhaustibility of renewable energy. Nevertheless, with respect to the remaining issues covered under the topic of Energy Resources, the results demonstrate a high/medium level of literacy. These outcomes are consistent with findings reported by other authors who have conducted studies on this subject [
6,
50,
52].
4.2. Influence of Socio-Demographic Characteristics
To examine the impact of participants’ socio-demographic characteristics on their literacy to biotechnological solutions for environmental sustainability, the responses obtained in the second part of the questionnaire were analyzed separately according to age group (
Table 3), gender (
Table 4), academic qualifications (
Table 5), and regions of Portugal (
Table 6).
The analysis of
Table 3 reveals that the option I don’t know was predominantly selected by participants included in the age group above 65 years old. Particularly noteworthy are statements 3, 4, 16, and 19, where this option was chosen by over 75% of these participants, and statements 1, 5, 7, 20, 21, and 22, where the aforementioned option was selected by over 50% of these participants. The option I don’t know was also chosen by a considerable number of participants in the age group under 25 years old. In fact, this option was selected by more than 45% of these participants in statements 3, 4, 7, 16, and 19. Regarding the option I don’t know, the difference between the frequencies of response provided by participants in the age groups of 26 to 40 years old and 41 to 50 years old was less than 3%, except for statements 3, 6, and 8, where the difference was 3.7%, 8.9%, and 5.7%, respectively. Concerning the option strongly agree, it was found that the age groups under 25 years old and above 65 years old exhibit lower frequencies of response than the other age groups. Additionally, the difference between the frequencies of response provided by participants in the age groups of 26 to 40 years old, 41 to 50 years old, and 51 to 65 years old do not exceed 5%.
Regarding the influence of gender on literacy to biotechnological solutions for environmental sustainability, the analysis of
Table 4 shows that the difference between the frequencies of responses given in Part II of the questionnaire by women and men was less than 2%. These findings are consistent with the results reported by Sasa et al. [
6], which point out that gender does not influence literacy levels.
Concerning the influence of academic qualifications, the analysis of
Table 5 reveals that the option I don’t know was mainly selected by both participants who completed basic education and those who completed secondary education. It should be noted that in statement 19, this option was chosen by more than 50% of these participants. Conversely, the option I don’t know was selected by less than 5% of participants with a degree or a post-graduation. The option strongly agree, in turn, was chosen by more than 50% of participants with a degree or post-graduation, except for statement 19, which was ticked by less than 35% of these participants. In the case of participants with secondary education, the frequency of the response strongly agree was less than 50%, except for statements 2, 11, and 17, where these percentages were 74.7%, 73.0%, and 56.3%, respectively. Regarding participants with basic education, the frequency of this response was less than 33%, except for statements 11 and 17, where these percentages were 55.5% and 35.5%, respectively. Finally, excluding statement 19, the option agree was selected by a higher percentage of participants with basic or secondary education than those with a degree or a post-graduation. These outcomes are in agreement with the results reported by other authors [
7,
53], who have found positive correlations between the levels of education and the levels of environmental literacy.
Regarding the influence of the place of residence on literacy to biotechnological solutions for environmental sustainability, the analysis of
Table 6 shows that the difference between the frequencies of responses given in Part II of the questionnaire was less than 2%, regardless of the region of Portugal where the participants’ residence is located. Regarding the place of residence, some studies have examined the influence of urban and rural areas and concluded that this socio-demographic variable influences environmental literacy levels [
52,
53]. However, it is important to note that the results of the present study cannot be directly compared to those studies as this research considers geographical regions of Portugal, which encompass both urban and rural areas.
4.3. Literacy Assessment
Figure 5 shows the options ticked by participant one to the second part of the questionnaire, whereas
Figure 6 displays the quantification of participant one’s non-numerical information, which was carried out according to the methodological approach recommended by Fernandes et al. [
66]. The procedure can be demonstrated by analyzing the selections made by participant one for the statements included in the thematic area of Air Pollution. Thus, to display the selections of the six statements included in the aforementioned thematic area, a circle with a radius of
was divided into six sections, with each response option corresponding to a mark on the axis (
Figure 6). Considering that participant one ticked agree for statements 1, 3, and 5, the correspondent area assigned to each selected response is calculated as
. Regarding statement 2, the option selected was strongly agree, corresponding to the area
. In the case of statement 4, the option ticked was I don’t know, resulting in an area of zero. Finally, for statement 6, the option disagree was selected, corresponding to the area
. The quantitative value that corresponds to the options selected by participant one for the Air Pollution statements set is equal to the sum of the individual areas, i.e., 0.49. The process for the other thematic areas is similar, and the resulting values are listed in
Table 7.
The values present in
Table 7 were used as input variables to training ANNs to predict literacy to biotechnological solutions for environmental sustainability. RNAs are computational tools inspired by the functioning of the human brain. The unidirectional architecture is one of the most widespread network architectures, in which artificial neurons (or nodes) are arranged in layers with only direct connections [
54,
55,
56]. In order to determine the most effective ANN for evaluating literacy to biotechnological solutions for environmental sustainability, different network structures were elaborated and evaluated. The coincidence matrices were used to compare the performance of the ANN models. Out of the various network topologies that were evaluated, the 4-3-1-1 network (
Figure 7) exhibited the most favorable response.
Table 8 provides the coincidence matrix for the ANN model depicted in
Figure 7, with the values representing the average of 25 experiments. Based on the values presented in
Table 8, the model’s accuracy was calculated for both the training set (90.8%, corresponding to 285 correctly classified out of 314) and the test set (86.6%, corresponding to 136 properly labeled out of 157). Thus, the 4-3-1-1 ANN model exhibits high performance in the evaluation of literacy to biotechnological solutions for environmental sustainability, with accuracy rates surpassing 85%.
The overall interpretation of
Table 8 in terms of columns allows evaluating the number of participants identified by the model at each literacy level (i.e., low, medium, or high). Thus, the model identifies 124 participants as having a low level of literacy, which corresponds to 26.3% of the sample. Out of the identified cases, 106 were correctly classified, while the remaining 18 participants classified as low had a medium level of literacy. Regarding the 249 participants identified by the model as having a medium level of literacy (52.9% of the sample), 230 were correctly classified, while 12 were wrongly classified as low and 7 as high. Finally, concerning the 98 participants identified by the model as having a high level of literacy (20.8% of the sample), 85 were correctly classified, while 12 were wrongly classified as medium and one as low. Based on the values presented earlier, it is possible to compute the confidence that can be placed in the model’s predictions. Thus, regarding the prediction of the participants with levels of literacy low, medium, and high, the confidence in the model’s responses is 85.5%, 92.4%, and 86.7%, respectively.
In addition, the overall interpretation of
Table 8 in terms of rows allows for evaluating the model’s performance regarding the actual number of participants at each literacy level. Thus, out of the 119 participants with low levels of literacy (25.3% of the sample), the model correctly identified 106, while 12 participants were wrongly classified as medium and one as high. Regarding the 260 participants with a medium level of literacy (55.2% of the sample), the model identified 230 correctly, whereas 18 were wrongly classified as low and 12 as high. Finally, concerning the 92 participants with high levels of literacy (19.5% of the sample), the model identified 85 correctly, whereas 7 were wrongly classified as medium.
Aiming to calculate the sensitivity, specificity, Positive Predictive Value (PPV) and Negative Predictive Value (NPV) of the 4-3-1-1 ANN model, the coincidence matrix for every potential output was created (
Table 9). Sensitivity is a measure of the proportion of positive cases (i.e., Low, Medium, or High) that are well labeled as positive, whereas specificity refers to the proportion of negative cases (i.e., No-Low, No-Medium, or No-High) that are well classified as negative. PPV indicates the proportion of correctly classified Low, Medium, or High cases, while NPV reflects the proportion of accurately labeled No-Low, No-Medium, or No-High cases [
76,
77].
Table 10 presents the values computed for the metrics mentioned above. The high values of sensitivity and specificity, ranging from 0.85 to 0.97, suggesting that the model performs well in assessing the levels of literacy for biotechnological solutions for environmental sustainability. This statement is supported by the values obtained for PPV and NPV, which also show high values ranging from 0.81 to 0.97.
The sensitivity analysis based on variance [
78] was performed to examine the impact of ANN inputs on the outputs. The resulting relative importance (RI) of each input provides insights into their influence on the outputs. The results show that the literacy to biotechnological solutions for environmental sustainability is strongest affected by the topics Energy Resources (RI = 0.35) and Air Pollution (RI = 0.30), whereas the topics Global Warming (RI = 0.21) and Aquatic Pollution (RI = 0.14) have a lesser influence. These findings are corroborated by those reported in
Section 4.1. In fact, the high number of responses I don’t know to Energy Resources and Air Pollution topics means that even minor changes in the responses to these topics can have a strong impact on literacy levels.


