Review

The Use of Recycled Tire Rubber, Crushed Glass, and Crushed Clay Brick in Lightweight Concrete Production: A Review

1
Structural Engineering Department, Mansoura University, Mansoura 35516, Egypt
2
Engineering Department, King’s College, Wilkes-Barre, PA 18711, USA
*
Author to whom correspondence should be addressed.
Sustainability 2023, 15(13), 10060; https://doi.org/10.3390/su151310060
Submission received: 11 May 2023 / Revised: 17 June 2023 / Accepted: 19 June 2023 / Published: 25 June 2023

Abstract

:
Worldwide, vast amounts of waste are produced every year and most waste is sent directly to landfills or burnt, which has severe and harmful impacts on the environment. Recycling waste materials is considered the most visible solution to protect the environment. Using scraps in concrete production is a proper method for getting rid of wastes, improving the characteristics of concrete, reducing the consumption of natural aggregates, and can be used as cementitious materials that decrease cement production so that the CO2 that is produced during cement manufacturing decreases. This review paper summarizes the use of recycled waste materials, including rubber tires, crushed glass, and crushed clay brick in concrete, as a fractional replacement of aggregates, cement, etc., to develop eco-friendly lightweight construction materials. It has been concluded that the dry density of sustainable concrete decreased to 4, 21.7, and 31.7% when crushed glass, clay brick, and rubber tire were incorporated into the concrete instead of traditional aggregate, respectively. Waste rubber has good results in sulfate, thermal, and impact resistance, while glass powder and finely crushed clay brick helped to improve mechanical properties by increasing reach by 33% for glass and a slight increase for crushed clay brick, as well as thermal resistance compared to normal concrete. Moreover, due to the low particle density of these waste materials compared to that of normal-weight aggregates, these materials can be utilized efficiently to produce lightweight concrete for structural and non-structural applications such as road engineering, flooring for mounting machinery, highway and rail crash barriers, permeable pavement, interlocking bricks, insulation, filling concrete, and bearing walls.

1. Introduction

Lightweight concrete (LWC) is considered a multifunctional material that has attracted the interest of many researchers due to its various advantages compared to conventional concrete [1,2]. LWC is a material produced by the substitution of normal-weight aggregate with lightweight aggregate and has an oven dry density ranging between 800 and 2000 kg/m3 (EN 206-1) and a compressive strength ranging from 1 to more than 60 MPa. Lightweight concrete has several advantages over traditional concrete, such as better thermal conductivity (1.2 to 1.5 W/mK for normal concrete and 0.1 to 1.2 W/mK for lightweight concrete [3]), acoustic insulation (the coefficient of sound absorption of normal concrete was 0.05–0.1, while it was 0.13–0.75 for lightweight concrete [4], and reducing the weight of the structure, which results in fewer structural components; steel reinforcement; and lower cost of construction [1,2,3,4,5]. One of the main drawbacks of lightweight concrete production is the high cost of lightweight aggregate (LWA), which increases the total cost of building. Additionally, the most available types of LWA are artificial, which need intensive energy in the manufacturing process and have harmful impacts on the environment [5,6]. In order to overcome these disadvantages of lightweight aggregate, lightweight waste materials can be used, so the cost is reduced and intensive energy is decreased. Different types of LWA with various characteristics may be utilized in the production of lightweight concrete with different densities and strength classes, which have a direct impact on the properties of LWC. In the following section, a description of various types of lightweight aggregate is presented.

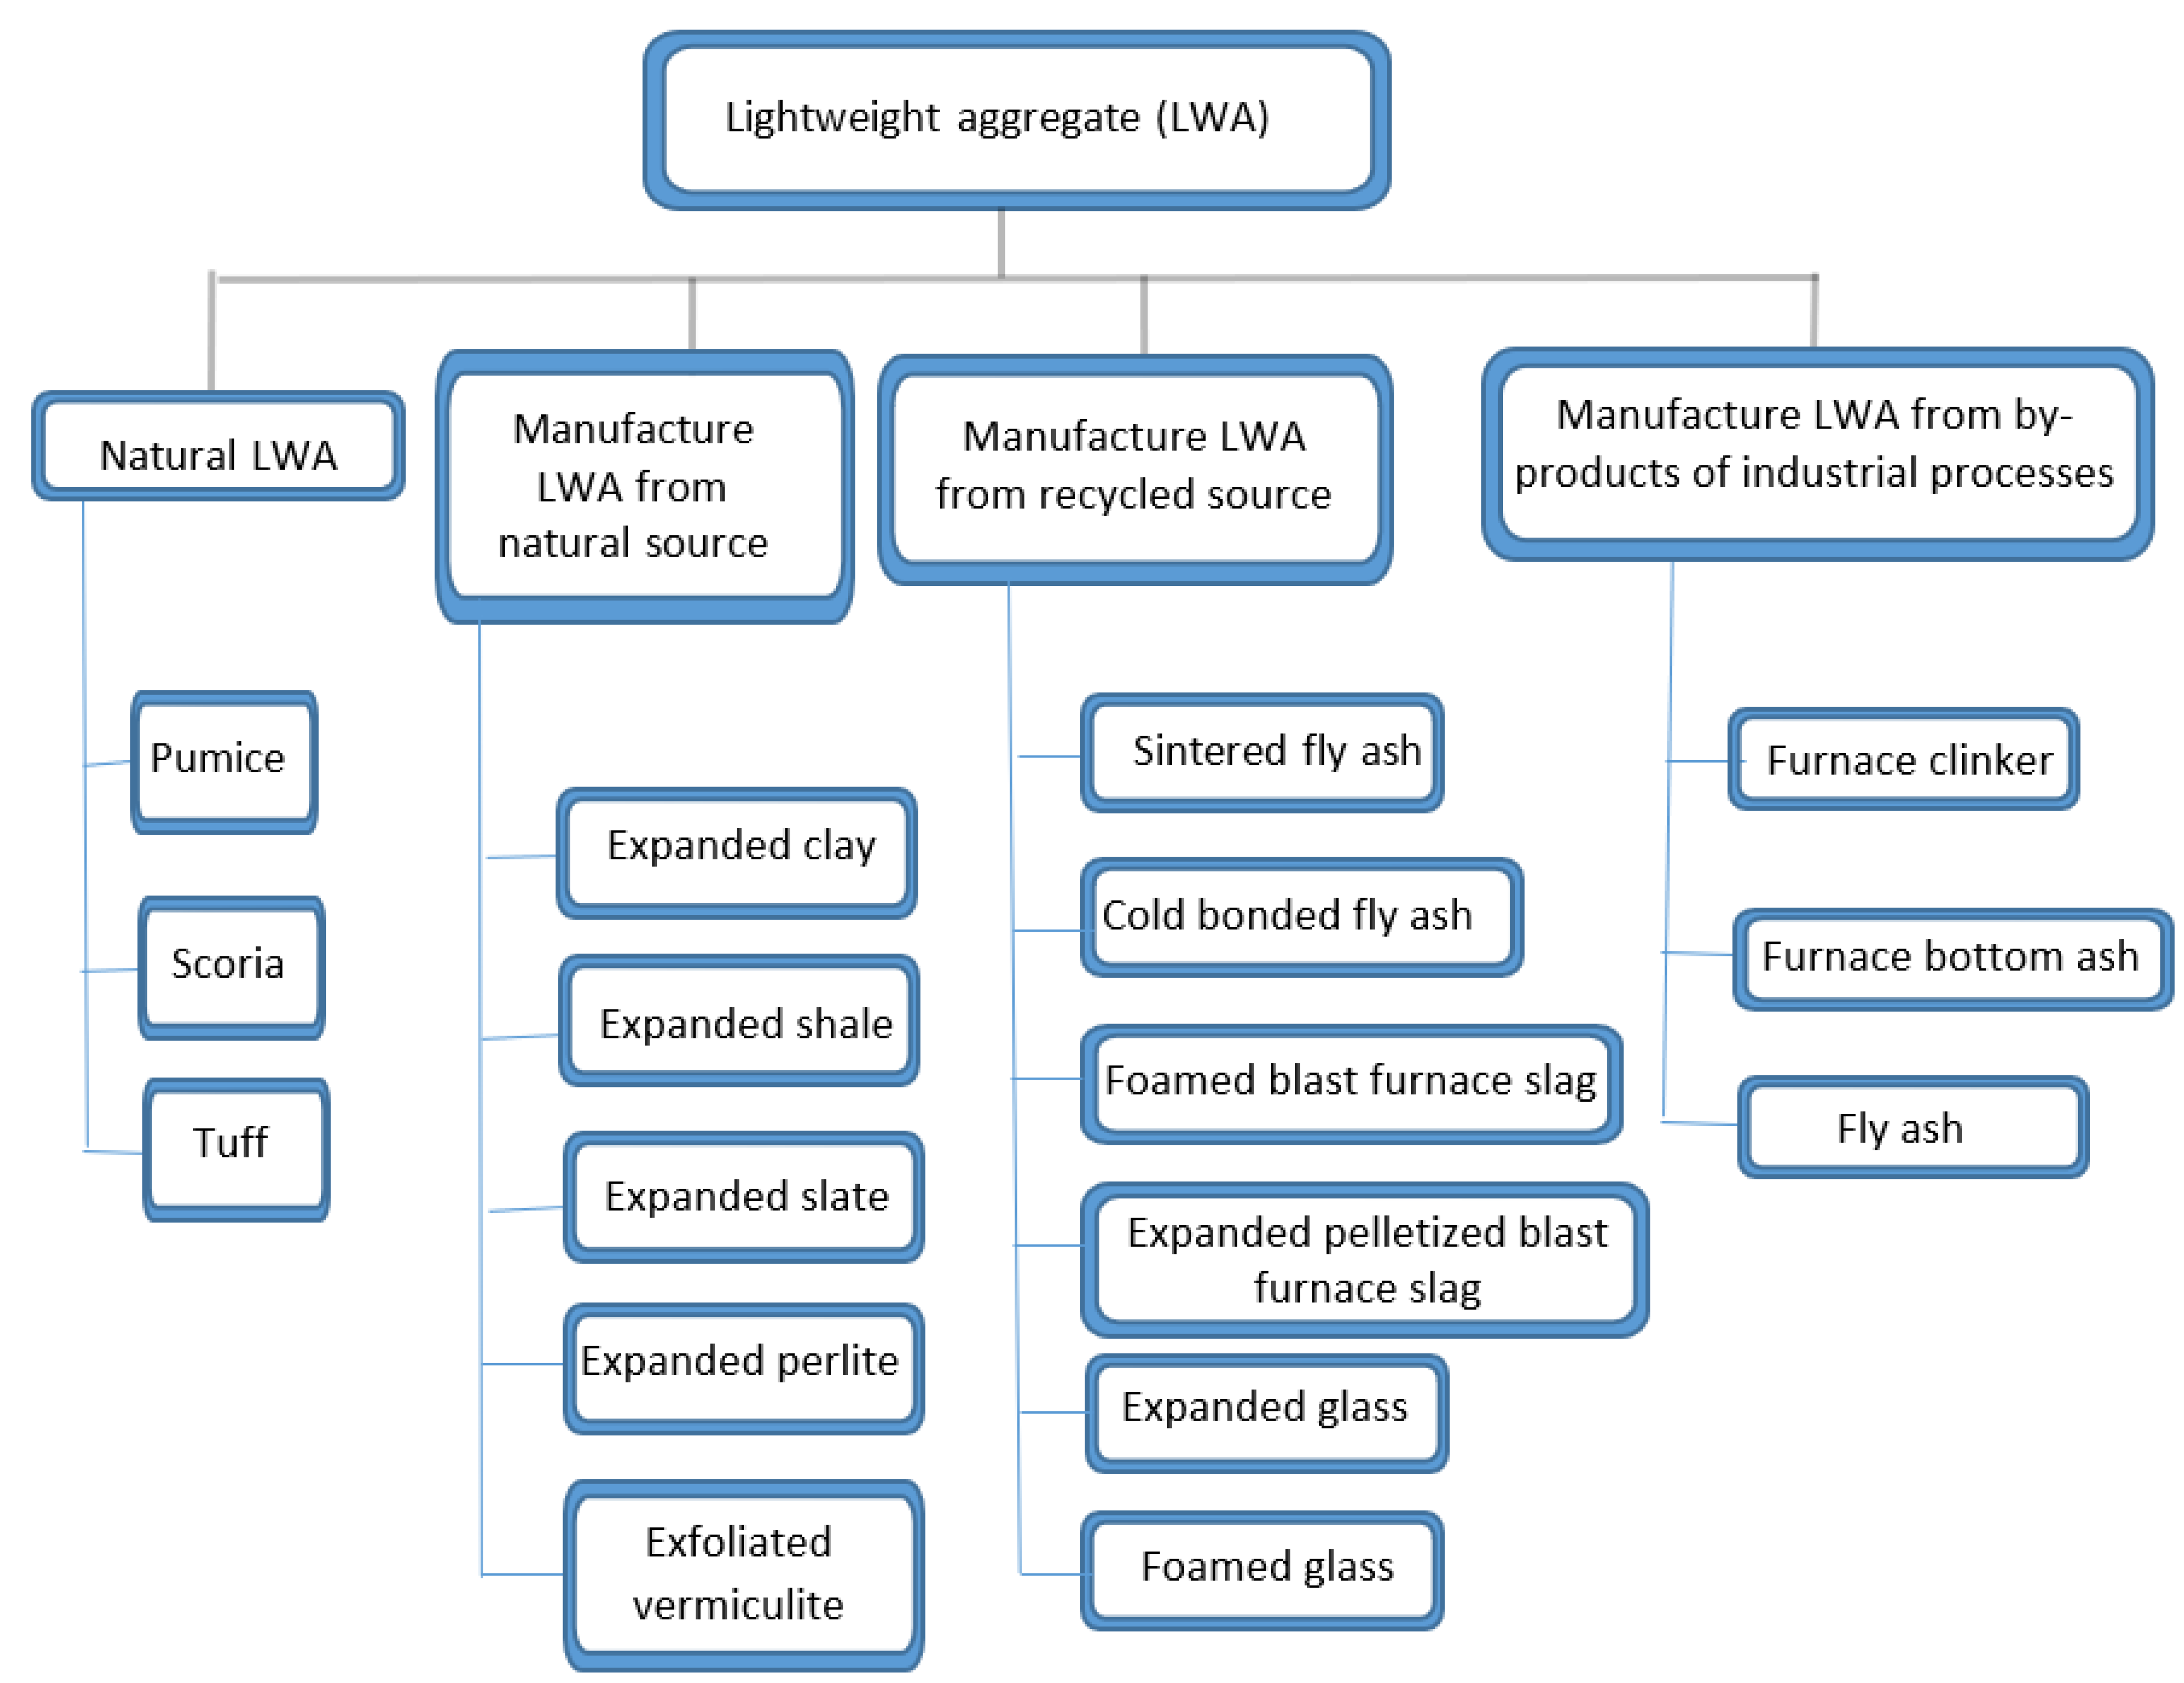
1.1. Types of Lightweight Aggregate (LWA)

The European Standard (EN 206-1) describes LWA as a granular material having a particle density of less than 2000 kg/m3 or a loose bulk density of less than 1200 kg/m3 [7]. According to their resources, LWA can be classified into three categories: natural, artificial, and by-product. Natural LWA can be found in mineral sources that need only mechanical processing in order to satisfy the concrete requirements. It has some advantages: it is cheap and does not produce a high amount of pollution or consume a large amount of energy. However, its sources are limited to certain places in the world, so global production of LWC has been restricted. The earliest known natural LWA are pumice and scoria, which were widely employed throughout the Roman era. These can be utilized in their natural condition since they are light and strong enough to use. When the silica-rich lava from a volcano’s violent eruption cools, pumice is created. The substance that is in a molten condition freezes when it is suddenly cooled. Scoria is a comparable substance; however, it has a deeper color than pumice. It has separate, bigger shells with more standardized shapes [8]. The second type is artificial LWA, which has a mineral origin resulting from natural sources or industrial processes involving thermal or other treatment processes. The most famous artificial LWA is foamed glass. In this process, glass is ground to a powder state using a ball mill, and then foaming agents like carbon black, natural graphite, etc., are added. Finally, this mix was added to the rotary kiln to produce a spherical shape; the other types of artificial LWA had almost the same manufacturing process [9]. The third type is by-product LWA, which is produced as a secondary material from industrial processes and can be used directly in concrete after mechanical processing. The most well-known by-product LWA is fly ash aggregates, which are made primarily from fly ash as the raw material. Fly ash is combined with 5% bentonite, 10% limestone powder, and water in a pan pelletizer to produce pellets with a diameter of 5 to 20 mm. In a rotary kiln, silica stone powder is burnt alongside the pellets at 1200–1300 °C to act as an anti-adhesion agent on the aggregate [8]. Compared to natural and by-product LWA, artificial has a severe impact on the environment due to its high energy consumption, as well as the production of harmful pollutants, toxic materials, and gases that are burned and released into the atmosphere, such as carbon dioxide emissions, which are caused by the combustion of fossil fuels and cause a huge portion of climate change, or global warming. Examples of different types of LWA that have already been implemented in the production of LWC can be found in Figure 1 [10]. On the other hand, in the coming years, building manufacturers have the challenge of blending sustainability into their manufacturing processes, either by looking for new raw materials and products with minimum harmful impact on the environment and/or contributing to the decrease in CO2 emissions in the ecosystem. The possibility of blending waste from other industrial activities into the production processes of LWC can assist with this aim [3,11,12].
This review summarizes the research outputs about utilizing some solid waste, including tire rubber, crushed glass, and crushed clay bricks, to generate sustainable lightweight concrete.

1.2. Lightweight Aggregate from Waste Materials (LWAWM)

1.2.1. Rubber Tires

The annual worldwide production of tires is about 1.4 billion tires, which corresponds to a predicted 17 million tons of used tires each year. China, the European Union (EU), the United States, Japan, and India produced the most waste tire, accounting for nearly 88% of all withdrawn tires worldwide [13]. When people consider the environmental effects of tires, they commonly think of tire disposal at the end of their beneficial lives (end-of-life tires (ELTs)). Every year, an estimated 1 billion ELTs are generated globally, with the amount projected to reach 1.2 billion by 2030. However, over half of the ELTs are dumped in landfills or stockpiles around the world without being processed [14,15]. Owing to their complex go-related shape and the additives used during production to prolong the life of tire rubber, they take a long time to degrade naturally [16,17]. Due to landfill site degradation and other environmental issues, landfilling and stockpiling of waste tire rubber is not always the best choice [18,19,20]. Burning ELTs is usually the cheapest and simplest way to decompose them. However, the emissions caused by such a large volume of smoke make this practice illegal in many countries. As a result, novel strategies for recycling ELTs appear to be needed [21,22]. Recycling ELTs not only helps to relieve landfill capacity and mitigate other environmental issues but also helps to preserve natural assets [23,24].
Recycled ELTs can be used in concrete as aggregate [1,25,26,27,28,29,30] and have different names depending on their size, such as shredded/chipped tires ranging in size from 13 mm (0.5 in.) to 76 mm (3 in.), ground rubber ranging in size from 0.15 mm (No. 100 sieve) to 19 mm (or 3/4 in.), and crumb rubber ranging in size from 4.75 (No. 4 Sieve) to less than 0.075 mm (No. 200 Sieve) [31]. Rubber fiber is classified based on its size as follows: fiber 8 is particles with a size between 1.18 and 2.36 mm, while fiber 4 is particles with a size between 2.36 and 4.75 mm [32]. Shredded tires are successfully utilized in a variety of civil engineering projects, such as artificial turf pitches [33], embankments, soil reinforced by tire shreds, road insulation, field drains, jetty bumpers, and asphalt. Tires are suitable for such applications because they are permeable; well-insulated; shock-absorbent; noise-absorbent; durable; have appropriate physical, mechanical, and dynamic properties; have good abrasion resistance; and are cheap [16,34,35]. End-of-life rubber has been extensively researched as a binder or as a conglomerate (cement and gypsum) to create revolutionary composites in buildings [17].

1.2.2. Crushed Glass

Glass is a non-metallic, inorganic substance that cannot be incinerated or decomposed, but it can be recycled without sacrificing product quality [36]. Waste glass occupies an enormous proportion of domestic solid waste. The disposal of waste glass in landfills pollutes the environment significantly, particularly in developing countries [37]. Waste glass is stacked on the ground with no effective recycling. Recycling and repurposing waste glass are relevant research topics that can help to conserve primary raw materials and reduce CO2 emissions that develop during cement production [38,39]. FEVE (the European Container Glass Federation) provided statistical data on waste glass recycling rates in several countries [39]. Recycled crushed glass can be utilized in concrete production as an alternative to aggregate or cement and as an asphalt aggregate substitute for sand and gravel. Backfill material, embankment fills, and pavements have all been proposed as possible applications for recycled glass [36,40,41].

1.2.3. Crushed Clay Bricks

Clay brick represents one of the main materials that are used in the construction sector. However, a huge amount of waste bricks are generated from either new or demolished buildings [42]. Waste clay bricks (CB) are often disposed of in landfills, which not only take up valuable land but additionally pollute the water and soil because of the dissolution of harmful substances [43,44]. The total amount of CB and clay tile produced was 12,147,000 tons, with 1,559,255 tons being reused as aggregate in concrete (about 13%). More efforts are needed in order to research the possibility of reusing CB in larger amounts [45] to reduce the harmful impacts on the environment and save natural results [43,46,47]. CB can be crushed and reused in concrete to partially or fully replace fine and/or coarse aggregate. It can also be finely ground to partially replace cement without significant deterioration in concrete performance [48]. According to prior studies, utilizing crushed brick aggregates as replacement aggregates has the key benefits of lowering concrete density, requiring less natural aggregate, and being an environmentally benign method. On the other hand, these issues might provide significant obstacles to recycling applications and operations. These challenges can be summed up as follows: 1. The current specifications are inadequate. 2. High porosity, rapid absorption, and quality variance. 3. Lack of confidence and expertise in using these materials, as well as uncertainty about regular supply, are seen to be the main obstacles.

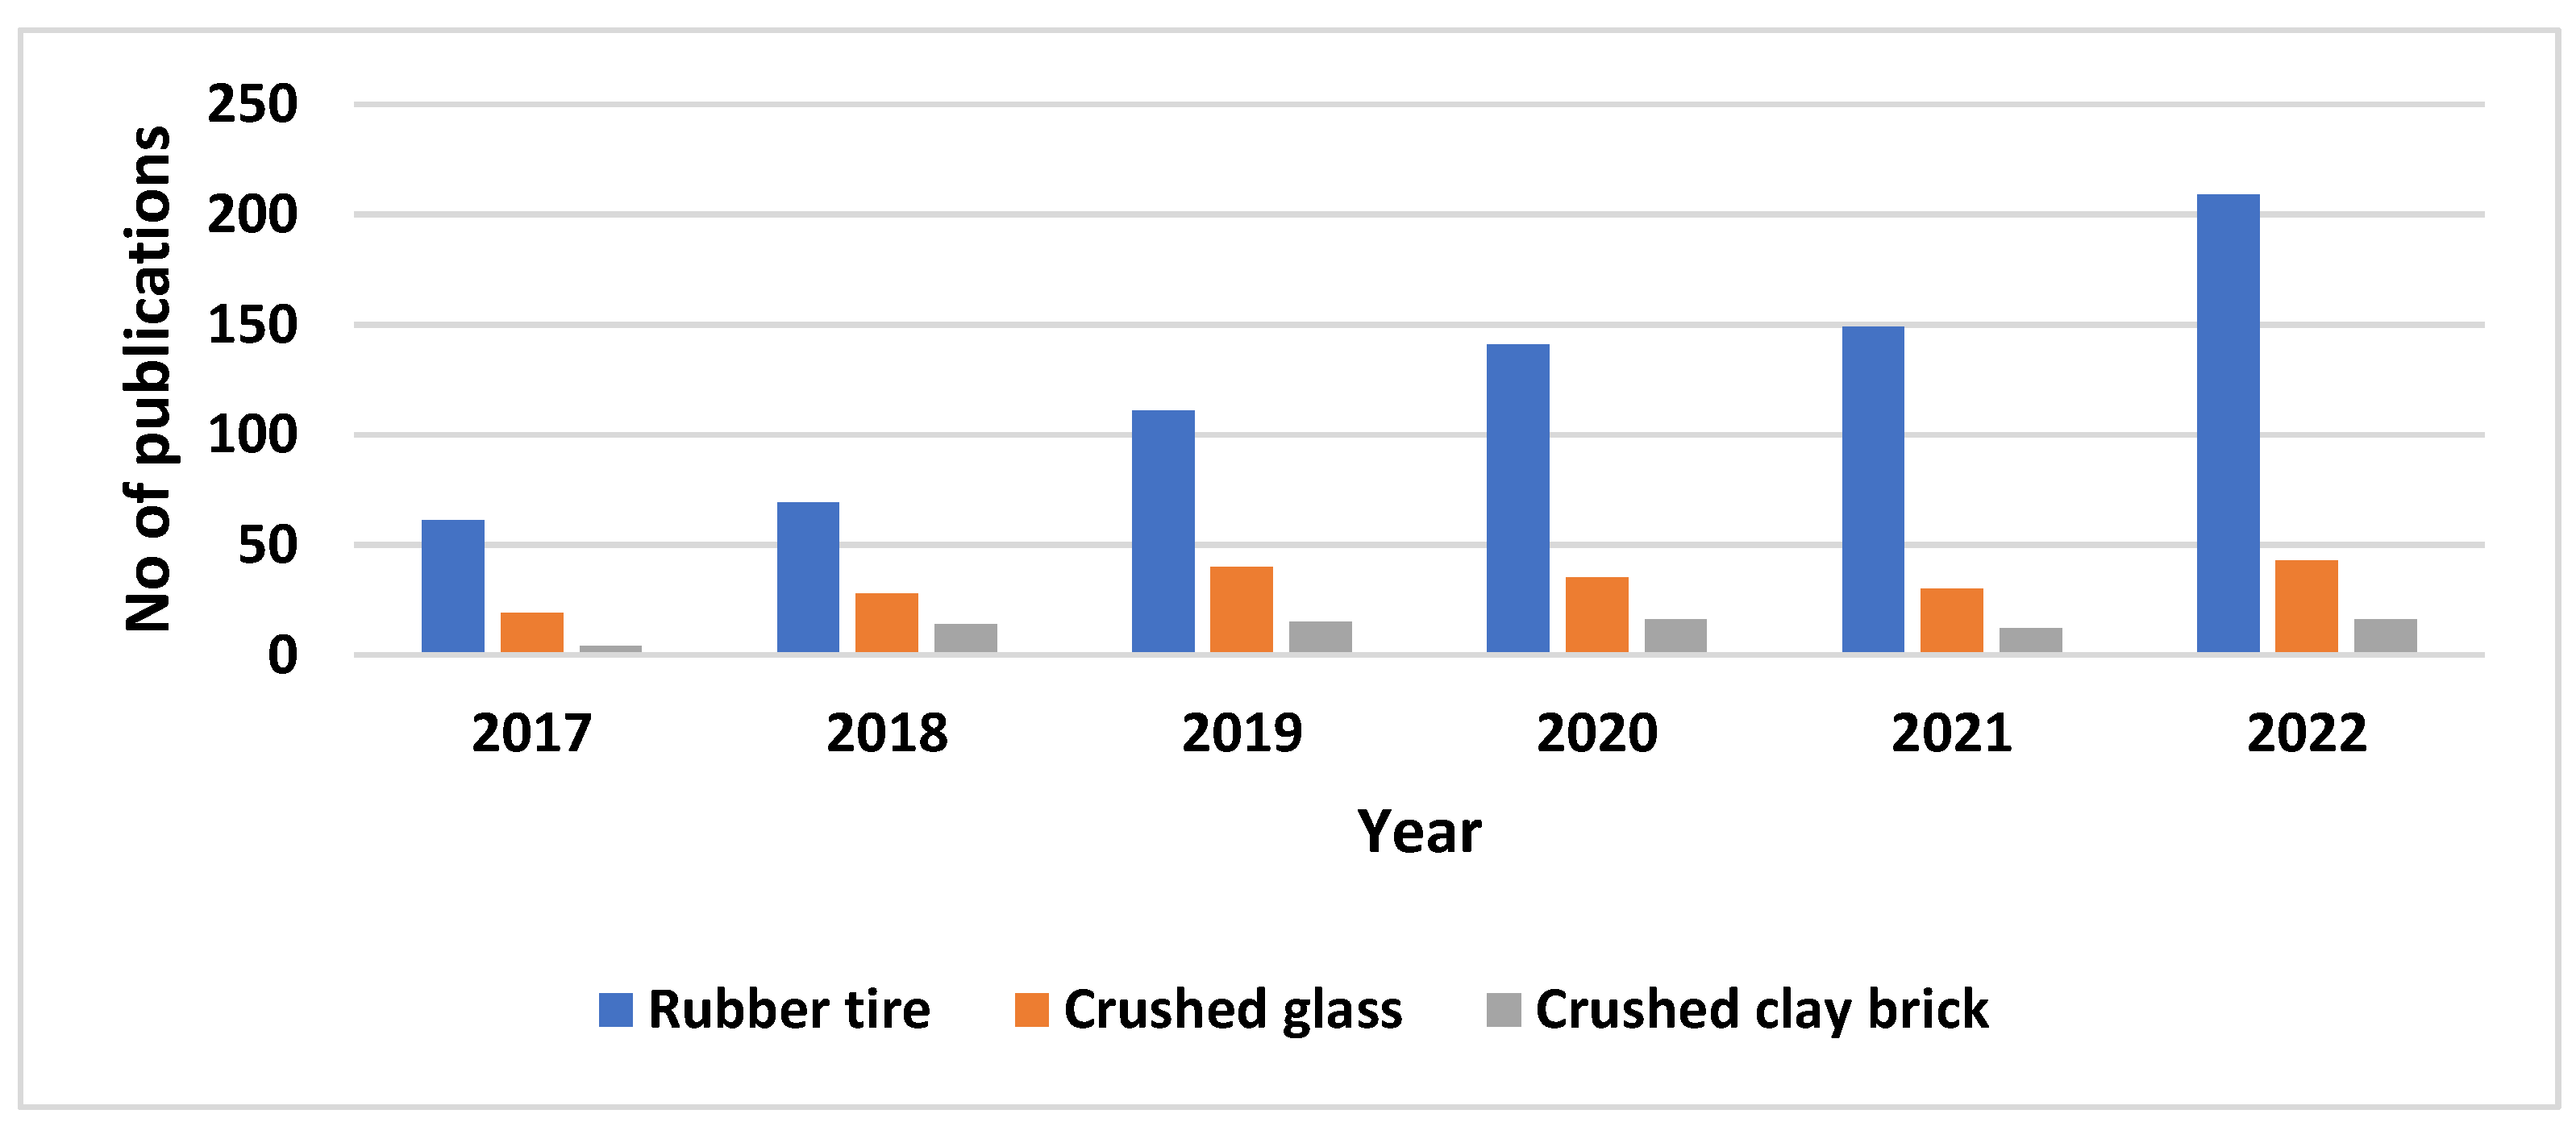
2. Methodology Used in This Review

The primary aim of this review is to understand the performance of sustainable concrete that uses waste materials such as rubber tires, crushed glass, and crushed clay brick as aggregates or as supplementary cementitious materials. Moreover, we aim to discuss the possibility of obtaining lightweight concrete using these wastes. Additionally, the hardened and sustainability performance of waste concrete were studied because there was a strong relationship between mechanical behavior, sustainability, and the mixture of this concrete. According to the review strategy at the first stage of literature collection, publications were obtained from Science Direct, Web of Science, Scopus, Google Scholar, and other peer-reviewed databases. Researchers in various fields have previously used related methods in their studies [49]. The second stage was completed by obtaining research from the database using the following keywords: “rubberized concrete, crushed glass concrete, crushed clay brick concrete”. Figure 2 shows the number of research articles obtained from Scopus published on the use of rubber tires, crushed glass, and crushed clay bricks in concrete for the last six years. According to review’s inclusion criteria, it was obvious that the research on rubberized concrete was very high compared to crushed clay brick and crushed glass concrete. As a result, specific keywords were used to further limit the collected articles. These keywords were ‘Rubber tire aggregate, Recycled rubber tire as aggregate in cement based concrete, Mechanical properties of lightweight rubberized concrete, Durability properties of rubberized concrete, Recycled glass in cement based concrete, Crushed glass aggregate, Mechanical properties of lightweight glass concrete, Durability properties of glass concrete, Recycled clay brick in cement based concrete, Crushed clay brick aggregate, Mechanical properties of lightweight clay brick concrete, Durability properties of clay brick concrete’. However, all samples were selected as cement-based, and all research used was published between 2012 and 2023. For further limitation of the number of studies, the following research questions were then developed in order to find research publications that were extremely relevant to the present study:
  • What substances were utilized in the study to substitute for the natural fine aggregate?
  • Does the study material share the same physical characteristics as fine natural aggregates?
  • What concrete mechanical and durability characteristics were studied?
  • Do the characteristics assessed in the study align with the most recent review?
  • Does the study’s fine aggregate exhibit pozzolanic behavior? If so, is the additional cementitious material firmly established?
The quality assessment of sustainable concrete was based on the concrete’s workability, its hardening properties, and its sustainability. The reporting system used in this study was figures and tables to facilitate this comparison. The scientific research was compiled based on the research words mentioned before. The research was chosen after a summary reading and after making sure that it would help in the comparison between the three waste materials. Some capabilities were also used to reduce these results, such as those found on the Scopus site, where the latest scientific research was selected for the three materials that have almost the same properties; then, the comparison process took place.

3. Properties of Lightweight Aggregate from Waste Materials

The effects of aggregate characteristics on concrete’s main properties are profound, and a detailed analysis of these effects is critical for the manufacturing of high-quality concrete. The physical properties of waste material that can be utilized as aggregates to produce sustainable lightweight concrete are size, particle density, and water absorption, as can be seen in Table 1.

3.1. Size of Particles

Particle packing and aggregate interlocking within concrete composites are strongly influenced by aggregate size and grading. For rubberized concrete, the required size of rubber tire aggregate can be obtained via several methods. Hunag et al. obtained fine rubber with a max size of 4.75 mm by using water jet technology [50]. However, S. H. Helmy et al. generated rubber aggregate via mechanical cutting from the exterior surface of scrap tires, then sieving to the required sizes [70,71]. On the other hand, Eldin and Senouci obtained rubber particles with a size of 6.35 mm via cryogenic grinding [72]. Many studies have been carried out on rubberized concrete, but these studies differ from each other in the shape and size of the rubber used. Generally, the smaller the rubber particle size, the higher the cost associated with its production [73]. Sukontasukkul and Tiamlom studied the effect of rubber particle size on concrete performance and stated that rubberized concretes with large-crumb rubber appear to absorb more water than concretes with small-crumb rubber. However, both small and large sizes of crumb rubber decrease compressive strength significantly depending on their content. Compared to that of small size, the large-sized rubber created concrete with high expansion and low shrinkage [74]. Srivastava et al. studied the effects of rubber fiber with different aspect ratios when it was used to replace coarse aggregate with percentages of 5, 10, 15, 20, and 25% by weight. Rubber fibers with a constant cross-section of 7 mm × 7 mm were cut into different lengths of 25, 50, and 75 mm with different diameters of holes of 4, 5, and 6 mm. The optimum compressive and tensile strength results were found in specimens with a 50 mm length, a 5 mm diameter hole, and 10% replacement [75].
Yang et al. studied the effect of crushed glass aggregate size on the properties of dry-mix concrete blocks (moist earth concrete). Four different sizes of waste glass (4.75–0.3 mm, 2.36–0.3 mm, 1.18–0.3 mm, and 0.6–0.3 mm) were examined. All the dry-mix blocks were generated with a fixed aggregate/cement ratio of 2.25 and a w/c ratio of 0.23. Different sizes of glass aggregate were used to substitute all river sand to study the effect of glass size on the properties of concrete. It was reported that when the particle size of glass aggregate decreases, the thermal conductivity and density of the blocks decrease while compressive strength increases due to the large surface area of the glass that works as a binding material. The size of the crushed clay bricks has a strong influence on concrete properties [76]. Dang et al. discussed the influence of finely crushed clay brick particle size on the properties of cement mortar. Waste clay brick was used in two groups, 0–5 mm and 0.15–5 mm, to replace sand with percentages of 25, 50, and 75% by weight. Particle size has little effect on the flowability and strength of recycled mortar. It was reported that waste clay brick with a particle size of 0–5 mm is optimal due to its micro filler ability. On the other hand, finely ground crushed clay brick powder can be used partially to replace cement [62]. Zhao et al. studied the influence of the particle size of waste clay brick powder (CBP) on the characteristics of blended cement mortar. The waste clay bricks were ground into powders of various particle sizes, and those CBP were utilized to substitute 30% cement to produce pastes or mortars. The authors stated that as the particle size of clay bricks decreases, early-age hydration accelerates, the setting time decreases, compressive strength grows faster, more calcium hydroxide is used to react, resulting in a denser microstructure, increased compressive strength at later ages, and increase in the pozzolanic activity of CBP [77].

3.2. Specific Gravity

The specific gravity of aggregates plays an important role in determining the physical and mechanical properties of concrete. Specific gravity is defined as the mass of material divided by an equal volume of water at a temperature of 23 °C [78]. Based on studies done by various researchers, all three types of waste aggregate—rubber, crushed glass, and crushed bricks—have different values of specific gravity, which are approximately less than the specific gravity of normal aggregates of 2.5–2.75 and fall between 0.48 and 2.548, as shown in Table 1. Rubber aggregates have a specific gravity ranging from 0.48 to 1.27. A specific gravity of 0.48 was reported by Gesoǧlu et al. [21], while Zaldívar et al. reported a maximum specific gravity of 1.27 [51]. Crushed clay brick aggregates have a specific gravity of 1.046–2.548. The specific gravity of 1.046 was reported by Hoque et al. [63], while Dang and Zhao reported the highest of 2.548 [64]. This discrepancy in specific gravity for rubber and crushed clay brick aggregate might be attributed to the fact that the aggregates come from various sources and are treated in different ways in the industry. The specific gravity of crushed glass aggregates lies in the range of 2.4–2.524, which was reported by several researchers. Topçu and Canbaz recorded the lowest specific gravity of 2.4 [57], while Castro and Brito recorded the highest specific gravity of 2.524 [58].

3.3. Water Absorption

The water absorption of aggregate directly affects the fresh and hardened properties of concrete. Therefore, it is an important property to be investigated deeply. Tire rubber or crushed glass (without any treatment) used in concrete as a lightweight aggregate have a lower tendency to absorb water due to the difference in their internal structural components. The 24 h water absorption of these aggregates ranges from 0 to 8.9%, as shown in Table 1. Zhang and Poon observed a negligible value of water absorption for rubber aggregate [24], while Raffoul et al. recorded the highest value of 8.9% [52]. For glass aggregate, Jiao et al. recorded a zero value of water absorption [38], while Lu et al. recorded the highest value of 0.36 [59]. On the other hand, the water absorption of crushed clay brick varies between 3.6 and 22.07%. Zhang et al. recorded the lowest water absorption of 3.6% [42], while Ge et al. recorded the highest water absorption of 22.07%, depending on the size and source of the used aggregate [65]. It can be concluded from Table 1 that the lowest specific gravity of the researched waste materials belongs to tire rubber, followed by crushed clay bricks and then crushed glass. Additionally, the water absorption of both tire rubber and glass was very low, while it was very high for clay brick due to its porous characteristics.

4. Development of Lightweight Concrete (LWC) Incorporating Lightweight Aggregate from Waste Materials

4.1. Concrete Mix Proportioning

The characteristics of raw materials, dose of chemical and mineral admixtures, types of aggregate used, packing density, water-to-cement ratio (w/c), and design methods have significant impacts on the performance of sustainable lightweight concrete. As shown in Table 2, the majority of researchers used rubber as an alternative to fine aggregates because the small size of rubber particles leads to little effect on mechanical properties compared to coarse particles. Aliabdo et al. studied the influence of fine rubber aggregate on normal concrete properties when it was used in a specified amount as a replacement for regular fine aggregate. To achieve a specific gradation, three different sizes of rubber particles were employed: 0.42, 1, and 2 mm. Then, rubber particles were mixed into a portion of 1:1:1 [32]. In comparison, Wu et al. reported the influence of coarse rubber aggregate on normal concrete properties. They generated rubberized concrete using chipped waste rubber with a max size of 20 mm to substitute coarse aggregate with percentages of 10, 15, 20, 30, 40, 50, 80, and 100% by volume [25]. Other studies discuss the effects of both fine and coarse rubber particles on normal concrete properties. Záleská et al. used two sizes of rubber aggregate: 0–4 mm as fine aggregate and 4–8 mm as coarse aggregate [26].
A number of studies have been carried out to look into the effects of rubber particles on the mechanical and physical characteristics of special types of concrete instead of normal concrete. Hunag et al. produced low-strength rubberized concrete using waste tire rubber with a max size of 4.75 mm to substitute fine aggregate with percentages of 10, 20, 30, and 40% by weight [50]. Gesoǧlu et al. generated pervious rubberized concrete by using waste rubber with three different particle sizes: tire chips, crumb rubber, and fine crumb rubber with sizes of 10, 5, and 1 mm, respectively. Each size of rubber was used individually or with another size to substitute normal river aggregate with percentages of 10 and 20% by volume [21]. Si et al. studied the effect of rubber aggregate on self-compacted rubberized concrete (SCRC) properties. The authors replaced fine aggregate with crumb rubber granules with percentages of 15 and 25% by volume [53]. However, Aslani and Kelin produced SCRC using Scoria aggregates to substitute normal coarse aggregates by 80% by volume and rubber aggregates with a size of 2–5 mm to substitute fine aggregates by 20% by volume [18]. Zhang and Poon studied the effect of rubber on concrete properties when it was used to replace furnace bottom ash (FBA). The authors used lightweight expanded clay aggregate (LECA) with a size of 6 mm as a coarse aggregate with a fixed content of 323 kg/m3, FBA as a fine aggregate with an initial content of 637 kg/m3, and crumb rubber with a particle size of 1.18–5 mm. Crumb rubber aggregates were used to substitute FBA at a ratio of 25, 50, 75, and 100% by volume [24]. Zaldívar et al. used a single type of plaster instead of cement to make mortar. Three different sizes of rubber, 0–0.6, 0.5–2.5, and 2.5–4.0 mm, were used with a content of 30, 40, 50, and 60% by weight of plaster [51]. Thakur et al. generated rubberized lightweight concrete bricks by substituting coarse sand with crumb rubber, which was sieved according to the Bureau of Indian Standards with percentages of 5, 10, 15, and 20% by volume [54].
The majority of researchers utilized crushed glass as an alternative to fine aggregates, similar to rubber, as seen in Table 2. Yang et al. used glass aggregate to substitute river sand with a percentage of 25, 50, 75, and 100% by volume [37]. Arivalagan and Sethuraman studied concrete properties when sand was substituted with glass powder with a size lower than 2.36 mm in percentages of 10, 20, and 30% by volume. Cement, fine aggregate, and coarse aggregate were mixed in a volume ratio of 1:1.5:3 [61]. However, Terro reported the influence of fine and coarse crushed glass when they were used in normal concrete. The author made three mixes: the first mix was produced by replacing natural desert sand with finely crushed glass in percentages of 10, 25, 50, and 100% by volume; the second mix was produced by replacing (3/4 in.) gabbro aggregates with coarse crushed glass in percentages of 10, 25, 50, and 100% by volume; and the final mix was produced by replacing both fine and coarse aggregates with fine and coarse crushed glass in percentages of 10, 25, 50, and 100% by volume [79]. Balasubramanian et al. reported the influence of glass powder with a particle size of 50 μm when it was used to substitute ordinary Portland cement with percentages of 5, 10, 15, and 20% by volume. The mix ratio of cement, sand, and granite was 1:1.425:3.10, respectively [60].
According to special types of concrete, Lu et al. produced pervious glass concrete using ordinary Portland cement, silica fume, and crushed granite with a size of 2.36–5 mm, which was substituted with crushed glass with percentages of 25, 50, 75, and 100% by volume [59]. Some researchers studied glass concrete properties using other types of cement instead of ordinary Portland cement, such as Castro and Brito, who used CEM II A-L 42.5 R to produce three mixes of glass concrete. The difference between the mixes is that the first one was made by replacing sand with glass aggregate, the second one was made by replacing crushed gravel aggregate with glass aggregate, and the final mix was made by replacing both fine and coarse aggregate with glass aggregate. The replacement percentages for the three mixes were 5, 10, and 20% by volume [58]. Meanwhile, Topçu and Canbaz used CEM II/B-M 32.5 R to produce glass concrete by partially replacing normal aggregate with waste glass [57].
Dang and Zhao produced concrete using waste clay bricks and mortar with a particle size of 0–5 mm to replace sand with percentages of 25, 50, 75, and 100% by volume. Additional water volume was added to the mix, which was evaluated by the water absorption of waste clay bricks and mortar [64]. Dang et al. produced clay brick concrete by using waste clay brick with a size of less than 5 mm to replace sand with percentages of 50 and 100% by volume [66]. Aliabdo et al. produced recycled paste, mortar, and concrete using waste crushed brick. According to recycled paste, cement was replaced with clay brick powder with percentages of 15 and 25% by weight of cement. Recycled mortar was developed by substituting cement with clay brick powder with percentages of 5, 10, 15, 20, and 25% by weight. For concrete, fine, coarse, and both fine and coarse clay brick were used to replace sand, limestone, and both sand and limestone, respectively, with percentages of 25, 50, 75, and 100% by volume. The authors also generated recycled concrete masonry brick with dimensions of 390 × 190 × 90 mm. There were two series of mixed proportions, similar to recycled concrete. Fine, coarse, and both fine and coarse clay brick were used to replace sand, limestone, and both sand and limestone, respectively, with percentages of 50 and 100% by volume [67]. Bektas et al. produced clay brick mortar using crushed clay brick with a size of 0–5 mm, which was used to replace sand in percentages of 10 and 20% by weight for mechanical properties assessment; 30% replacement was used for flowability tests; and 5, 30, 50, and 100% replacement were used for alkali-silica reaction [68]. Dang et al. generated clay brick mortar using crushed clay bricks with two sizes, 0–5 mm and 0.15–5 mm, and two states, a fully saturated surface dry and partially saturated surface dry, to substitute sand with percentages of 25, 50, and 75% by weight [62]. The same mix was also used by Huang et al., but the authors only used crushed clay brick with a size of 0–5 mm [69]. However, Ge et al. generated clay brick concrete using crushed clay brick with three different size distributions: 0.35–0.015, 0.3–0.004, and 0.2–0.001 mm. Every size of crushed clay brick was used to substitute cement with percentages of 10, 20, and 30% by volume [65]. It can be concluded from Table 2 that the majority of research used tire rubber, crushed clay bricks, and crushed glass as fine materials, not as coarse materials, due to their high mechanical properties and ease of preparation. Additionally, researchers used glass powder and crushed clay brick powder as cementitious materials or as aggregate, but rubber was used as an aggregate only. Most studies used plasticizers when tire rubber or crushed clay bricks were used, except for crushed glass, in which fewer studies used plasticizers. The maximum water-to-cement ratio used in crushed clay brick concrete and rubberized concrete was 0.7, while it was 0.58 for glass concrete due to its smooth surface, which increases workability.
Table 2. Influence of waste material on the fresh and hardened properties of concrete, mortar, and masonry bricks.
RefReplaced Aggregate TypeType of Concrete ProducedContent (%)WM Size (mm)Cement
(kg/m3)
SCM (kg/m3)Chemical Admixture (kg/m3)Fine Agg (kg/m3)Coarse Agg
(kg/m3)
w/bSlump (mm)Dry Density (kg/m3)Compre-ssive Strength (MPa)Split Tensile (MPa)Flexure Strength (MPa)E-Modulus (GPa)Thermal Conductivity K(W/m °C)
Waste rubber tire
[1]
0.25 to 1%
Steel fiber
FineConcrete10–200–5418.531.5 SFFLOWCEM R900741–57610000.45--750–350 KN
Crushing load
----
[18]
0.05 to 0.2%
PP fiber
FineConcrete202–5180135 FA
+101.25 G
+33.75 SF
2.4 L/m3-Type SN
+1.6 L/m3-Type HWR
+1.3 L/m3-Type SN-VMA
443.541520.45680–650
slump flow
-14.7–182–2.2-11–28-
0.25 to 1%
steel fiber
650–610
slump flow
17.5–222–2.726–48
[21]CoarsePV Concrete10–20
10–20
10–20
5 + 5–10 + 10
5 + 5–10 + 10
<10
4
1
<10 + 4
<10 + 1
450NoNoNo1275–14350.27-2025–1900
2125–2025
2237–2175
2075–1940
2080–1970
14.5–9.1
19–13.1
21.6–14
9.7–6.54
13.2–7.5
1.6–1.1
1.5–1.1
1.5–1.4
1.3–0.7
0.8–0.6
-9.4–5.3
16.9–16.4
15.1–15.9
10.5–6.2
8.2–4.5
-
[24] Unpretreated FineConcrete25–1001.18–5550No4 L/m3-ADVA109478-03230.34-1670–155010.7–8--18.9–11.1
DYN
-
pretreated1662–155021.2–5.117.1–9.5
DYN
[25]CoarseConcrete10–10020286.3No-535.5635–00.4825–50 -24–4--21–1
[26]FineConcrete10–300–4450NoNo540–2706750.5-1935–145728–3.5-5.7–1.518–31.314–0.534
Coarse10–304–8675540–2701914–154326–4.55.1–1.718–3.41.275–0.653
Fine + Coarse10–200–4 + 4–8608–540608–5401933–176531–144.9–2.919–101.329–0.953
[32]FineConcrete20–1000.42–1–2–4400NoSP-Type F564–010500.4515–252220–194023–3.7-3.3–0.8-0.96–0.6
[34]FineConcrete5–302–5423NoNo650–47912550.5582–75-29.1–19.2-2.6–3.6 -
[50]FineConcrete10–40<4.7517020 FA9
Acceleration agent
1058–7054001.5239–197-4–1.5----
[51]Its amount was percentage of plaster weightMortar30–600–0.6PlasterNoNoNoNo0.5–0.8-1032–6545.5–0.5-3.2–0.8--
30–600.5–2.50.45–0.71140–7585–0.93–1
30–502.5–40.5–0.61077–8934.2–1.52.6–1.5
[53]
Pretreated
Untreated
Pretreated
untreated
FineConcrete15–251.44–2.83430120 FA2.42-ADVA Cast575672–5937770.39665–600-45–244.3–3.5---
15430120 FA2.42-ADVA Cast575671.57770.39662234
15–25435174 FA3-ADVA Cast 575138–09000.42251–218--
15435174 FA3-ADVA Cast 5751389000.42235
Slump flow
--
[54]FineBricks5–20Sieved accord to indian Standards1NoNo3.1–2.62.10.437–252010–18307.5–5.70.9–0.5---
Waste crushed glass
[37]FineConcrete25–100<5440--742–0-0.25–0.23zero-37 to 35---2.1 to 2.3
0.05 to 0.15 SP0.47190
Flow table
41 to 380.9 to 1.8
[38]Fine (quartz sand)Concrete25–100600 μm850196 SF42.5 SP935–0-0.1919–124-117–14412–12.7521–22--
Fine (river sand)126–16212–1320–21--
[57]CoarseConcrete15–604–16350--1206478–2250.54
21.7–12.1
100–80-21.7–12.12.34–1.65.3–360–23
DYN
-
[58]FineConcrete5–20<11.2-----0.55–0.58121–125-0.9–0.8%----
Coarse0.55131–1341–0.95%
Fine + Coarse0.55–0.57125–1290.95–0.75%
[59]FinePV concrete25–1002.36–527230 SF-1133–0-0.29–0.32-1988–191932–25---0.62 for 50%
0.5 for 100%
[60]CementConcrete5–2050 μm1
ratio
--1.425 ratio3.1
ratio
0.578–982398–236927–282.96–33.8–3.9--
[61]FineConcrete10–30<2.361 (ratio)--1.5 ratio3
ratio
0.4595–65-26.9–22.83.4–3.044.01–3.9--
[79]FineConcrete1r-417-2.7 SP606–0-0.4880–105-40–23----
Coarse-996–085–13543–30
Fine + Coarse606–0996–085–21536–12
Waste crushed clay brick
[42] PPCoarseConcrete305–20
487.5
487.5-9.75 SP631804.30.4158–159-53–543.1–3.54---
PE154–15851–52.54–5.4
[62] TFineMortar25–750–5450--1013–338-0.5162–158-35–38-7–6.8--
T0.15–5162–15834–326.8–7
P0–5130–110
Flowability
45–427.8–7.5
[64] DFineConcrete25–500–5514-5.14 SP504–33610520.35180 ± 202180–229968–645.15–5.08-34.7–34.5-
P25–100504–056–594.75–4.8730.3–31.6
T25–100504–061–594.69–4.8530.6–32.4
[65]CementConcrete10–300.001–0.2446–347-HRWR-SPcoarse + fine = 17590.28144–222410–246055–474.3–2.98.5–627–19-
0.004–0.3150–262445–246055–454.2–3.87–5.928–16
0.15–0.35160–302445–249052–425–3.46.8–724–17
[66] DFineConcrete500–5327-SP41510560.55180 ± 20------
DFineConcrete500–5514-SP33610520.35180 ± 20------
PFineConcrete50–1000–5327-SP415–010560.55180 ± 20------
PFineConcrete50–1000–5514-SP336–010520.35180 ± 20------
TFineConcrete50–1000–5327-SP415–010560.55180 ± 20------
TFineConcrete50–1000–5514-SP336–010520.35180 ± 20------
[67]FineConcrete25–1000.15–4.75350-HRWR-SP554–011080.5120 ± 10-38.5–293.6–2.8-30.3–23-
FineConcrete25–1000.15–4.75250-HRWR-SP579–011580.7120 ± 10-23–15.62.4–1.4-28–12-
CoarseConcrete25–1004.75–19350-HRWR-SP739831–00.5120 ± 10-34.5–243–2.3-32–20.1-
CoarseConcrete25–1004.75–19250-HRWR-SP772868–00.7120 ± 10-21–15.62.2–1.2-27.2–16-
Fine + CoarseConcrete50–1000.15–19350-HRWR-SP369–0554–00.5120 ± 10-30–23.42.9–1.6-23.6–13.6-
Fine + CoarseConcrete50–1000.15–19250-HRWR-SP386–0579–00.7120 ± 10-22.5–162.3–1.8-21.6–8.4-
FineConcrete
MB
50–1000.15–4.75350-HRWR-SP372–011160.5zero1080–9806.8–5.5---0.175–0.19
(R)
FineConcrete
MB
50–1000.15–4.75250-HRWR-SP389–011660.7zero1060–9605.1–4.1---0.18–0.195
(R)
CoarseConcrete
MB
50–1002.36–9.75350-HRWR-SP774558–00.5zero1080–9905.6–4---0.185–0.21
(R)
CoarseConcrete
MB
50–1002.36–9.75250-HRWR-SP777583–00.7zero1060–9504.2–2.8---0.195–0.22
(R)
Fine + CoarseConcrete
MB
50–1000.15–9.75350-HRWR-SP372–0558–00.5zero980–9005.2–2.8---0.2–0.235
(R)
Fine + CoarseConcrete
MB
50–1000.15–9.75250-HRWR-SP389–0583–00.7zero980–9003.5–2.2---0.205–0.235
(R)
[68]FineMortar10–200–5500--1350-0.5--60–58----
[69] PresoakingFineMortar25–100<5450--1012–0-0.690–112-40–27.5-8–5.6--
DryFineMortar25–100<5450--1012–0-0.648–20-48–67-9–9.7--
WM: Waste materials, PP: polypropylene fiber, PE: polyester fiber, FA: fly ash, G: slag, SF: silica fume, LP: limestone powder, HRWR: high-range water reducer, SP: super plasticizer, ST: stabilizer, VMA: viscosity modifying admixture, DYN: dynamic modulus of elasticity, CS I: crushed stone with size 4–16 mm, CS II: crushed stone with size 16–32 mm, D: no extra water, P: partially extra water (75% water absorption of waste clay bricks), T: totally extra water (100% water absorption of waste clay bricks), R: thermal resistance (M2 K/W), MB: masonry brick.

4.2. Treatment Methods of Lightweight Aggregate from Waste Materials

Some types of waste materials, such as tire rubber, have a weak bond with cement paste due to the characteristics of their surface and shape. Therefore, pre-treatment is very beneficial in order to improve their performance when it was used in concrete. Aliabdo et al. exposed rubber particles to surface treatment in order to improve the bond between rubber particles and the cementitious material. The rubber particles were treated with polyvinyl acetate (PVA) for 30 min just before being blended with the cement [32]. Záleská et al. treated scrap-tire-rubber particles by soaking them in a 1 M NaOH solution for 1 h at room temperature for pre-modification. The rubber particles were cleaned with tap water after pretreatment until the pH of the washing water was near 7. Finally, at room temperature, the treated rubber particles were left to air dry [26], while Si et al. soaked rubber in the same solution but left it in the solution for around 20 min [53]. The previous research used a suitable treatment without studying whether it was effective or not. Zhang and Poon treated rubber particles by coating them with a cement matrix and air-drying them for 7 days. The w/c ratio of the cement paste used for rubber surface pretreatment was 0.8. The rubber aggregate and the fresh paste were combined in the mixing machine. After complete mixing, the mix was put on plastic sheets to air dry. It was found that there was an increase in compression strength of 2% [24]. A. Swilam et al. treated rubber by heating it in the oven with a temperature of 200 °C and time of heat up to 2 h; the recovery in compression strength reached up to 25% [80]. Aslani and Kelin soaked rubber aggregates in water for 24 h to guarantee a saturated surface dry (SSD) and poured them through a sieve to surface-dry before being added to the concrete mix. It was found that compression strength increased by 22% [18]. Youssf et al. studied the effect of NaOH when it was used to treat rubber particles with a concentration of 10% for different periods (0.5, 1, and 2 h). It was found that the best treatment period was 0.5 h, and the compression strength increased by 17% [81]. R. Roychand et al. pretreated rubber by soaking it in water for various times, reaching up to 24 h. It was concluded that the best behavior was found after 2 h soaking; the compression strength increased by 12% [12]. From the above information, it is obvious that the best treatment for rubber is heating. According to glass aggregates, the recommended pretreatment is washing then drying at 105 °C for a specific time [37,57]. Crushed clay brick was treated by pre-wetting it in water to achieve the required properties [42,67,68,82].

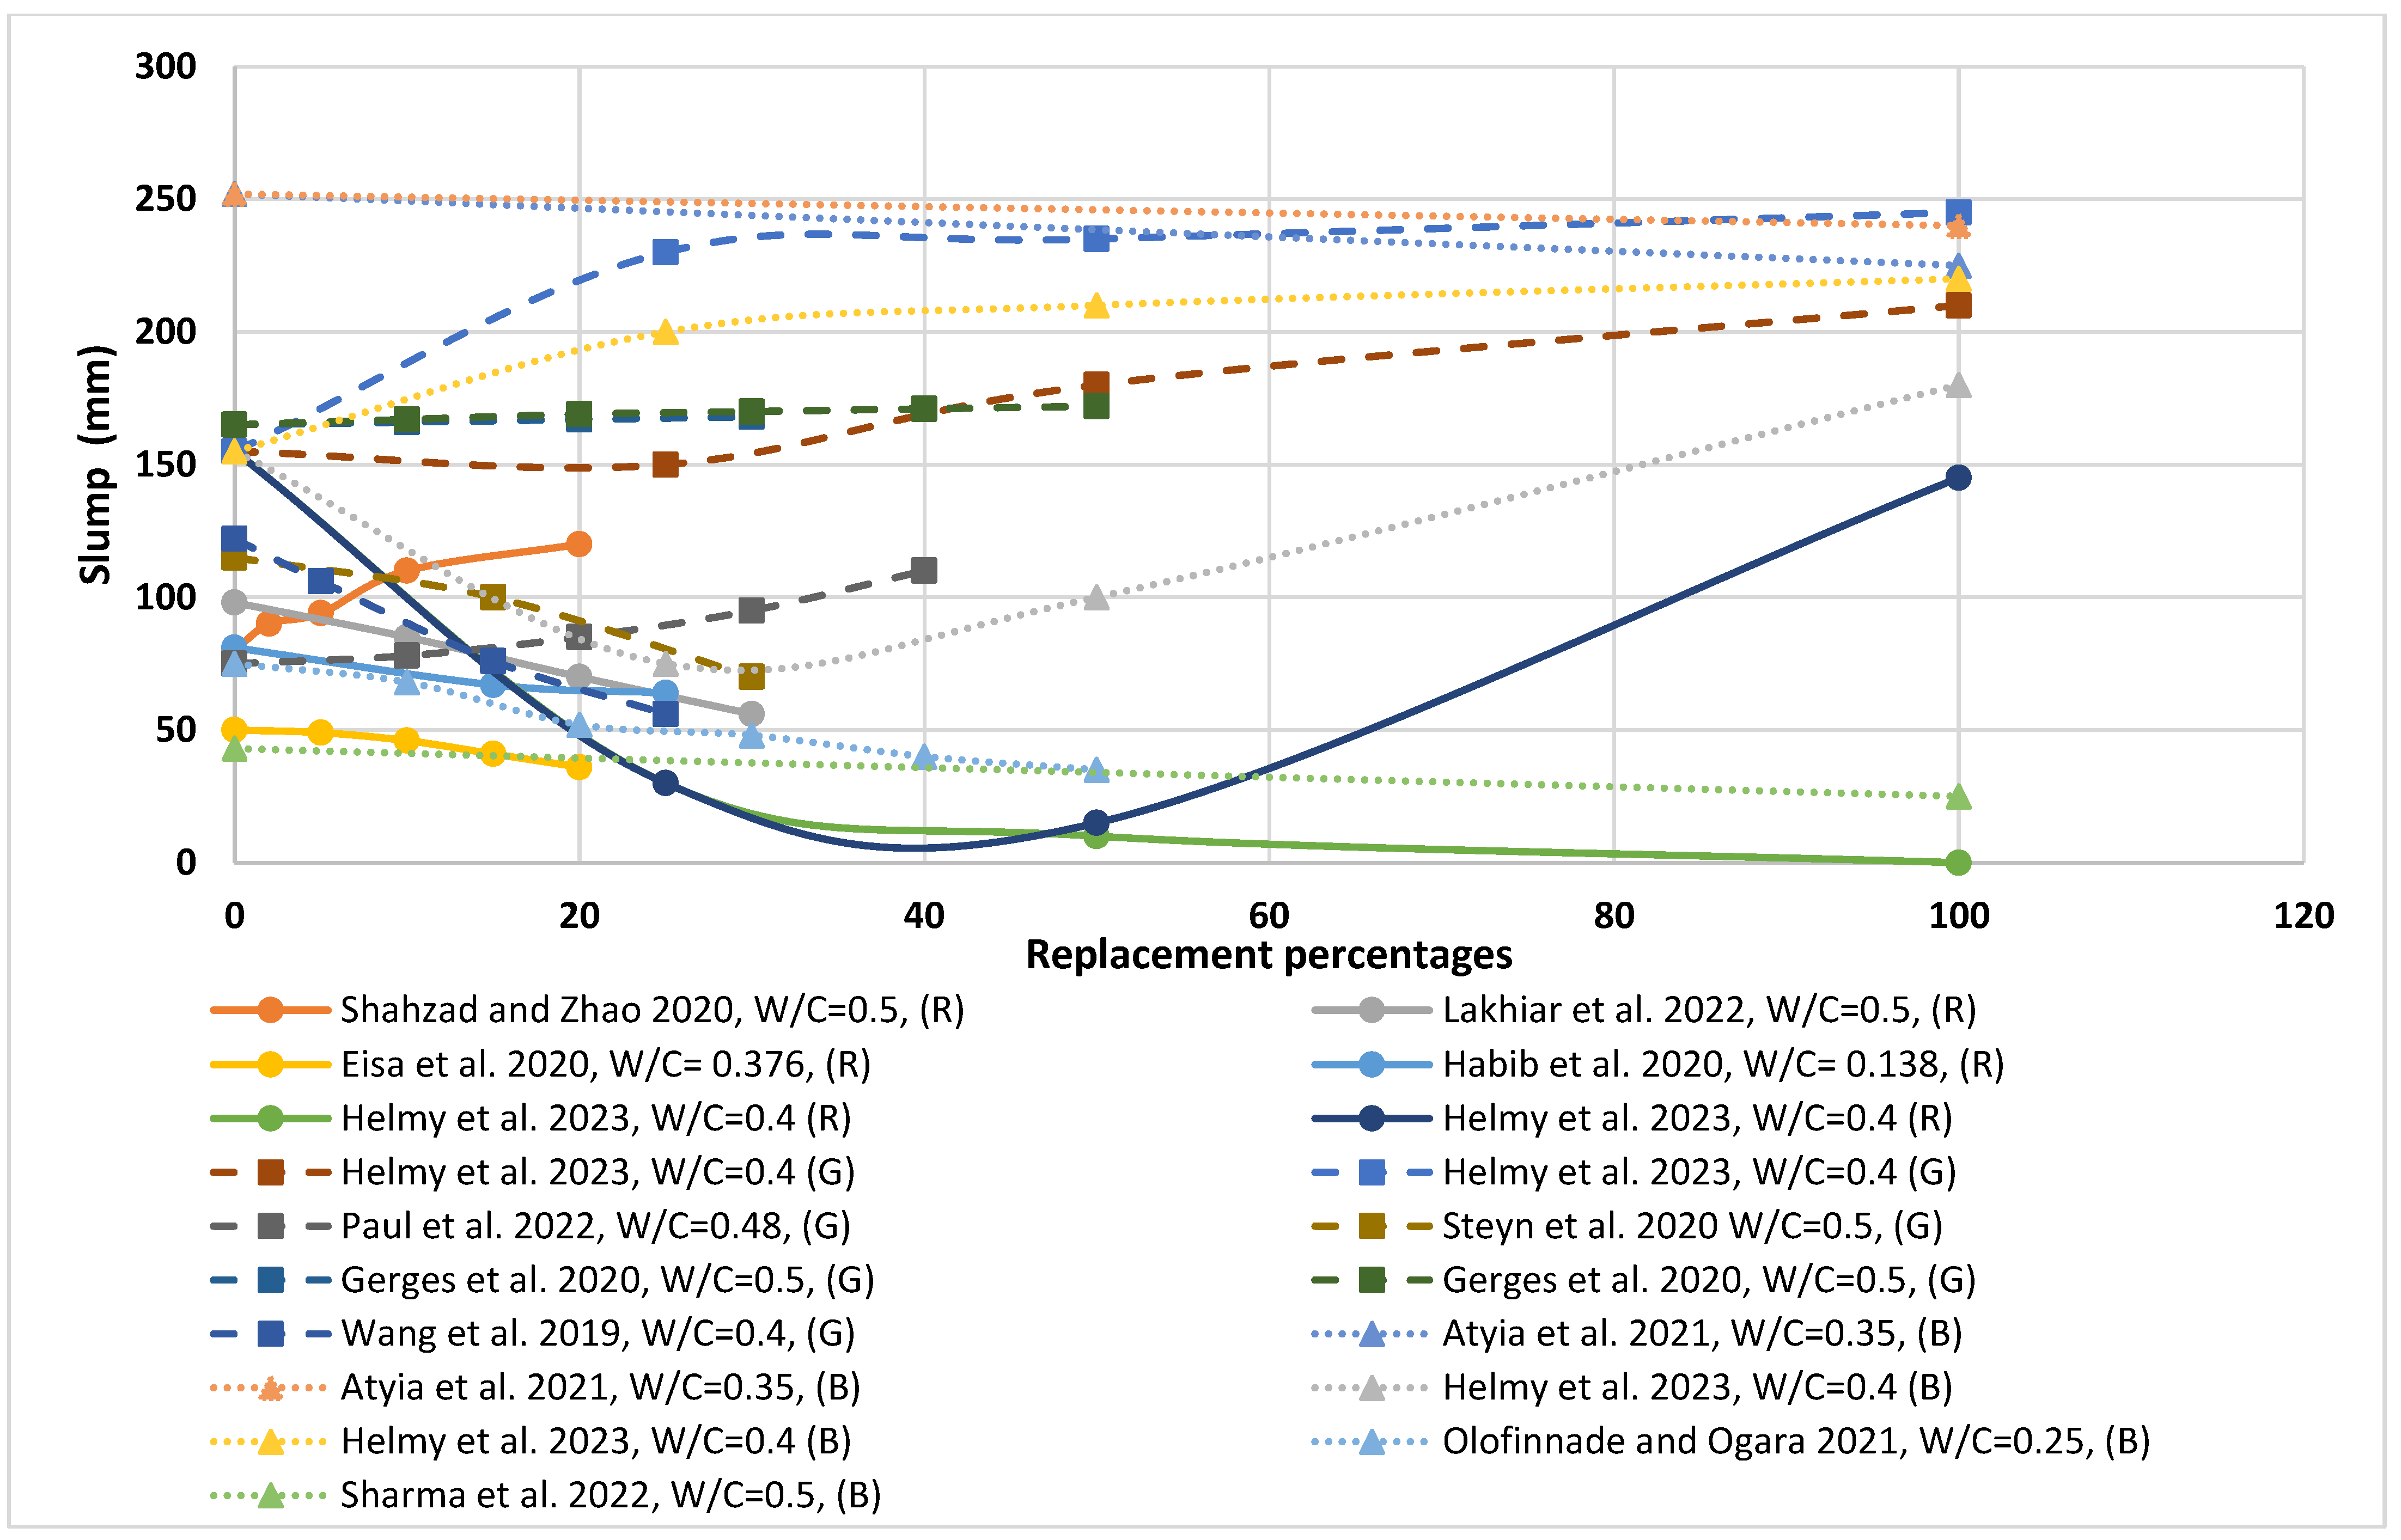
5. Workability of LWC Incorporating Lightweight Aggregate from Waste Materials

The incorporation of waste materials into concrete as an aggregate replacement has a significant impact on the fresh properties of concrete, as shown in Table 2. Hunag et al. found that the slump of fresh concrete increased with the substitution of fine aggregate with fine rubber particles (4 mm) up to 10%, while with higher substitution, the slump started to decrease. The increase at 10% was related to the chemical admixture used, and when the amount of rubber increases with the fixed content of chemical addition, workability decreases [50]. Wu et al. substituted coarse aggregate (granite) with chipped rubber at different percentages and found that there was no discernible influence on the workability of the concrete mixtures; no bleeding or segregation was observed, and the slump of all mixtures was between 25 and 50 mm [25]. On the other hand, Záleská et al. found that the slump increased as the amount of rubber in the mix increased. They attributed this behavior to the absence of wetting particles in the rubber, which increased the flowability of the freshly mixed concrete [26]. In contrast, Mohammed and Breesem produced rubberized concrete by substituting fine aggregate with rubber (<1 mm) in percentages of 10, 20, and 30%. The slump value of the control specimen was 4 cm, which decreased to 3.2 cm, 2.8 cm, and 2.6 cm, corresponding to 10, 20, and 30%, respectively [83]. On the other hand, Zaldívar et al. used a single type of plaster instead of cement to make mortar using different sizes and percentages of rubber. The authors reported that when the amount of rubber in the mortars increased, the segregation of the mortars increased, and the workability of the mortars worsened. When increasing the rubber content above 50%, the mixing process was difficult, and it was impossible at 60% [51]. Thakur et al. manufactured lightweight masonry bricks by using crumb rubber and found that the slump in the control mix was 5 mm, but it grew as the proportion of crumb rubber increased. The greatest slump achieved during the test was 25 mm for specimens containing 20% crumb rubber. The increase in the slump might be attributed to crumb rubber’s hydrophobic nature, which repels water, as well as the pre-soaking of crumb rubber in water, which could be released after mixing, making the mix more workable [54]. Si et al. developed rubber-modified self-consolidating concrete (RSCC) by treating crumb rubber granules to replace fine aggregate by 15 and 25% by volume. The authors found that filling ability and passing ability decreased when rubber aggregate was involved in the SCC mixture. The results of slump flow, T500, and U-Box height for mixtures with 15% rubber aggregate satisfy standard specifications for SCC in both cases, treated or untreated. At the same rubber aggregate content, the slump flow of treated RSCC was higher than that of untreated RSCC due to the flowability of RSCC being improved when the NaOH solution was used as a surface treatment. In addition, the NAOH surface treatment of rubber aggregate had a favorable effect on V-funnel flow time reduction and a negligible effect on U-box filling height [53].
R. Chylík et al. generated rubberized concrete by replacing fine natural aggregate with rubber with a size below 3 mm. The author reported that workability decreased when rubber was involved in the mix due to its larger surface area [35]. A. S. Sidhu et al. developed rubber concrete by substituting fine aggregate with rubber with a size of <12 mm in percentages of 10 to 30%. The workability decreased as the amount of rubber increased due to its water absorption [84]. G. K. Chaturvedy et al. obtained rubberized concrete by substituting natural aggregate with rubber with replacement percentages of 5 to 15%. The authors reported that workability decreased as the amount of rubber increased, and the reduction reached 15% [85]. M. M. Islam et al. developed rubberized concrete by using rubber as coarse aggregate with a size of <25 mm and replacement percentages of 100%. The authors reported that workability decreased as the amount of rubber increased [86]. From the above information and from Figure 3, the majority of the research reported the worst effect of rubber on workability.
Terro found that the slump value increases when glass content increases due to the smooth surface of glass aggregates. The author obtained a high value of slump when fine and coarse crushed glass substituted both normal fine and coarse aggregate in the same mix [79]. However, Castro and Brito obtained a high slump value when crushed glass was involved in the mix as a coarse aggregate [58]. Jiao et al. prepared ultra-high-performance glass concrete by replacing fine aggregate with fine glass in percentages of 25, 50, 75, and 100%. The authors reported that the slump increased as the glass replacement ratio increased, particularly when the replacement ratio exceeded 50% due to the low water absorption of glass aggregate as well as the smoothness of the surface [38]. Contrary, Topçu and Canbaz produced glass concrete by replacing crushed stone with waste glass with a particle size of 4–16 mm. The authors concluded that as glass percentages increased, the slump value and time of the VB test decreased [57]. Arivalagan and Sethuraman substituted sand with glass powder in percentages of 10, 20, and 30% by volume. The authors reported that as the amount of glass powder in concrete increased, its workability decreased. For the reference mix, it was 97 mm and decreased gradually to 95, 72, and 65 mm for mixes with 10, 20, and 30% by volume, respectively [61]. Balasubramanian et al. substituted cement with waste glass powder in percentages of 5, 10, 15, and 20% by volume and found an increase in slump value when the percentage of waste glass powder increased. The increase in slump ranged between 8 and 36% compared to the control specimen, depending on the replacement level [60].
Zhang et al. generated clay brick concrete by replacing basalt as a coarse aggregate with waste clay brick (CB) at a percentage of 30% by volume. The slump value decreased when the amount of CB increased due to the higher water absorption of CB [42]. Bektas et al. produced clay brick mortar by replacing sand with CB in percentages of 10, 20, and 30% by weight. Because of high water absorption and the angular shape of CB, the workability decreased as the amount of CB increased. It was found that there was a linear relationship between CB percentages and the reduction in workability [68]. Similarly, Olofinnade and Ogara produced eco-friendly concrete by substituting fine aggregate with CB (<4.75 mm) in percentages of 10, 20, 30, 40, and 50% by weight. Additionally, it was reported that the slump value decreased as the content of CB increased due to the high water absorption of CB [87]. Dang et al. used two different sizes of CB to substitute sand with different replacement ratios to produce clay brick mortar. CB was used in two states: fully saturated and partially saturated (75% of fully saturated). The authors reported that the effect of CB particle size on the flowability of mortar is very small, but the replacement ratio and additional water amount have a significant effect on the flowability of recycled mortar. The flowability of mortar increased when the replacement ratio of CB increased in the case of a fully saturated state. In contrast, partially saturated CB reduced workability [62]. Huang et al. generated clay brick mortar by substituting sand with CB in different percentages. CB was used in two states; dry and pre-soaked for 24 h. The consistency of the recycled mortar decreased as the dry CB replacement content increased due to the absorption of the water mixture. However, the presoaked CB was in the opposite situation [69]. When Ge et al. generated clay brick concrete by substituting cement with clay brick powder, three types of clay-brick-powder (CBP) with different particle sizes were available. The authors reported that concrete with a coarser and lower CBP content had the highest slump because its water demand is much lower than that of a finer one [65].
In the above section, the main problem with using crushed clay brick as an aggregate is its high water absorption and irregular particle shape, which leads to a decrease in its workability depending on its replacement level. The higher water absorption of crushed clay brick makes the water demand in the concrete mixes higher compared to the control. In contrast to natural aggregates, which are typically spherical and smoother in shape, the geometry of the crushed clay brick particles is angular and uneven, facilitating the easy flow and sliding of the binding paste. Contrarily, the angular particles experience some friction, which interferes with the flow. Some researchers tried to solve this problem by using aggregate saturated with surface drying or partially saturated with surface drying. Others used a higher w/c ratio or water-reducing admixtures to improve the workability.
Figure 3 shows most of the recent scientific research conducted in 2019 in order to compare the workability of rubberized, glass, and crushed clay brick cement-based concrete. In the figure, the glass and crushed clay brick concrete have almost similar results on workability. Crushed clay brick should be used on a fully or partially saturated surface to give similar results as glass concrete. When increasing the waste clay brick (WCB) percentage, crushed clay brick concrete became more workable. This was due to the new mortar’s real water-cement ratio being raised as a result of some additional water from the SSD WCB being released into the mortar during mixing. Crushed glass has a smooth surface, which makes crushed glass concrete easier to work with as the crushed glass concentration increases. Rubberized concrete had the worst effect on workability. Additionally, the workability gets worse when the amount of rubber increases, in contrast to glass and clay brick concrete, due to the irregular surface texture of the rubber, which causes higher inter-particle friction.

6. Mechanical Properties of LWC Incorporating Lightweight Aggregate from Waste Materials

The strength of concrete, which governs its mechanical performance, depends mainly on the cement matrix, aggregate characteristics, and the transition zone between them. Since the aggregate from waste materials is completely different from normal-weight aggregates, it has a different mechanical performance. In the following section, brief information is provided about the effect of rubber, glass, and crushed brick aggregates on the mechanical properties of concrete.

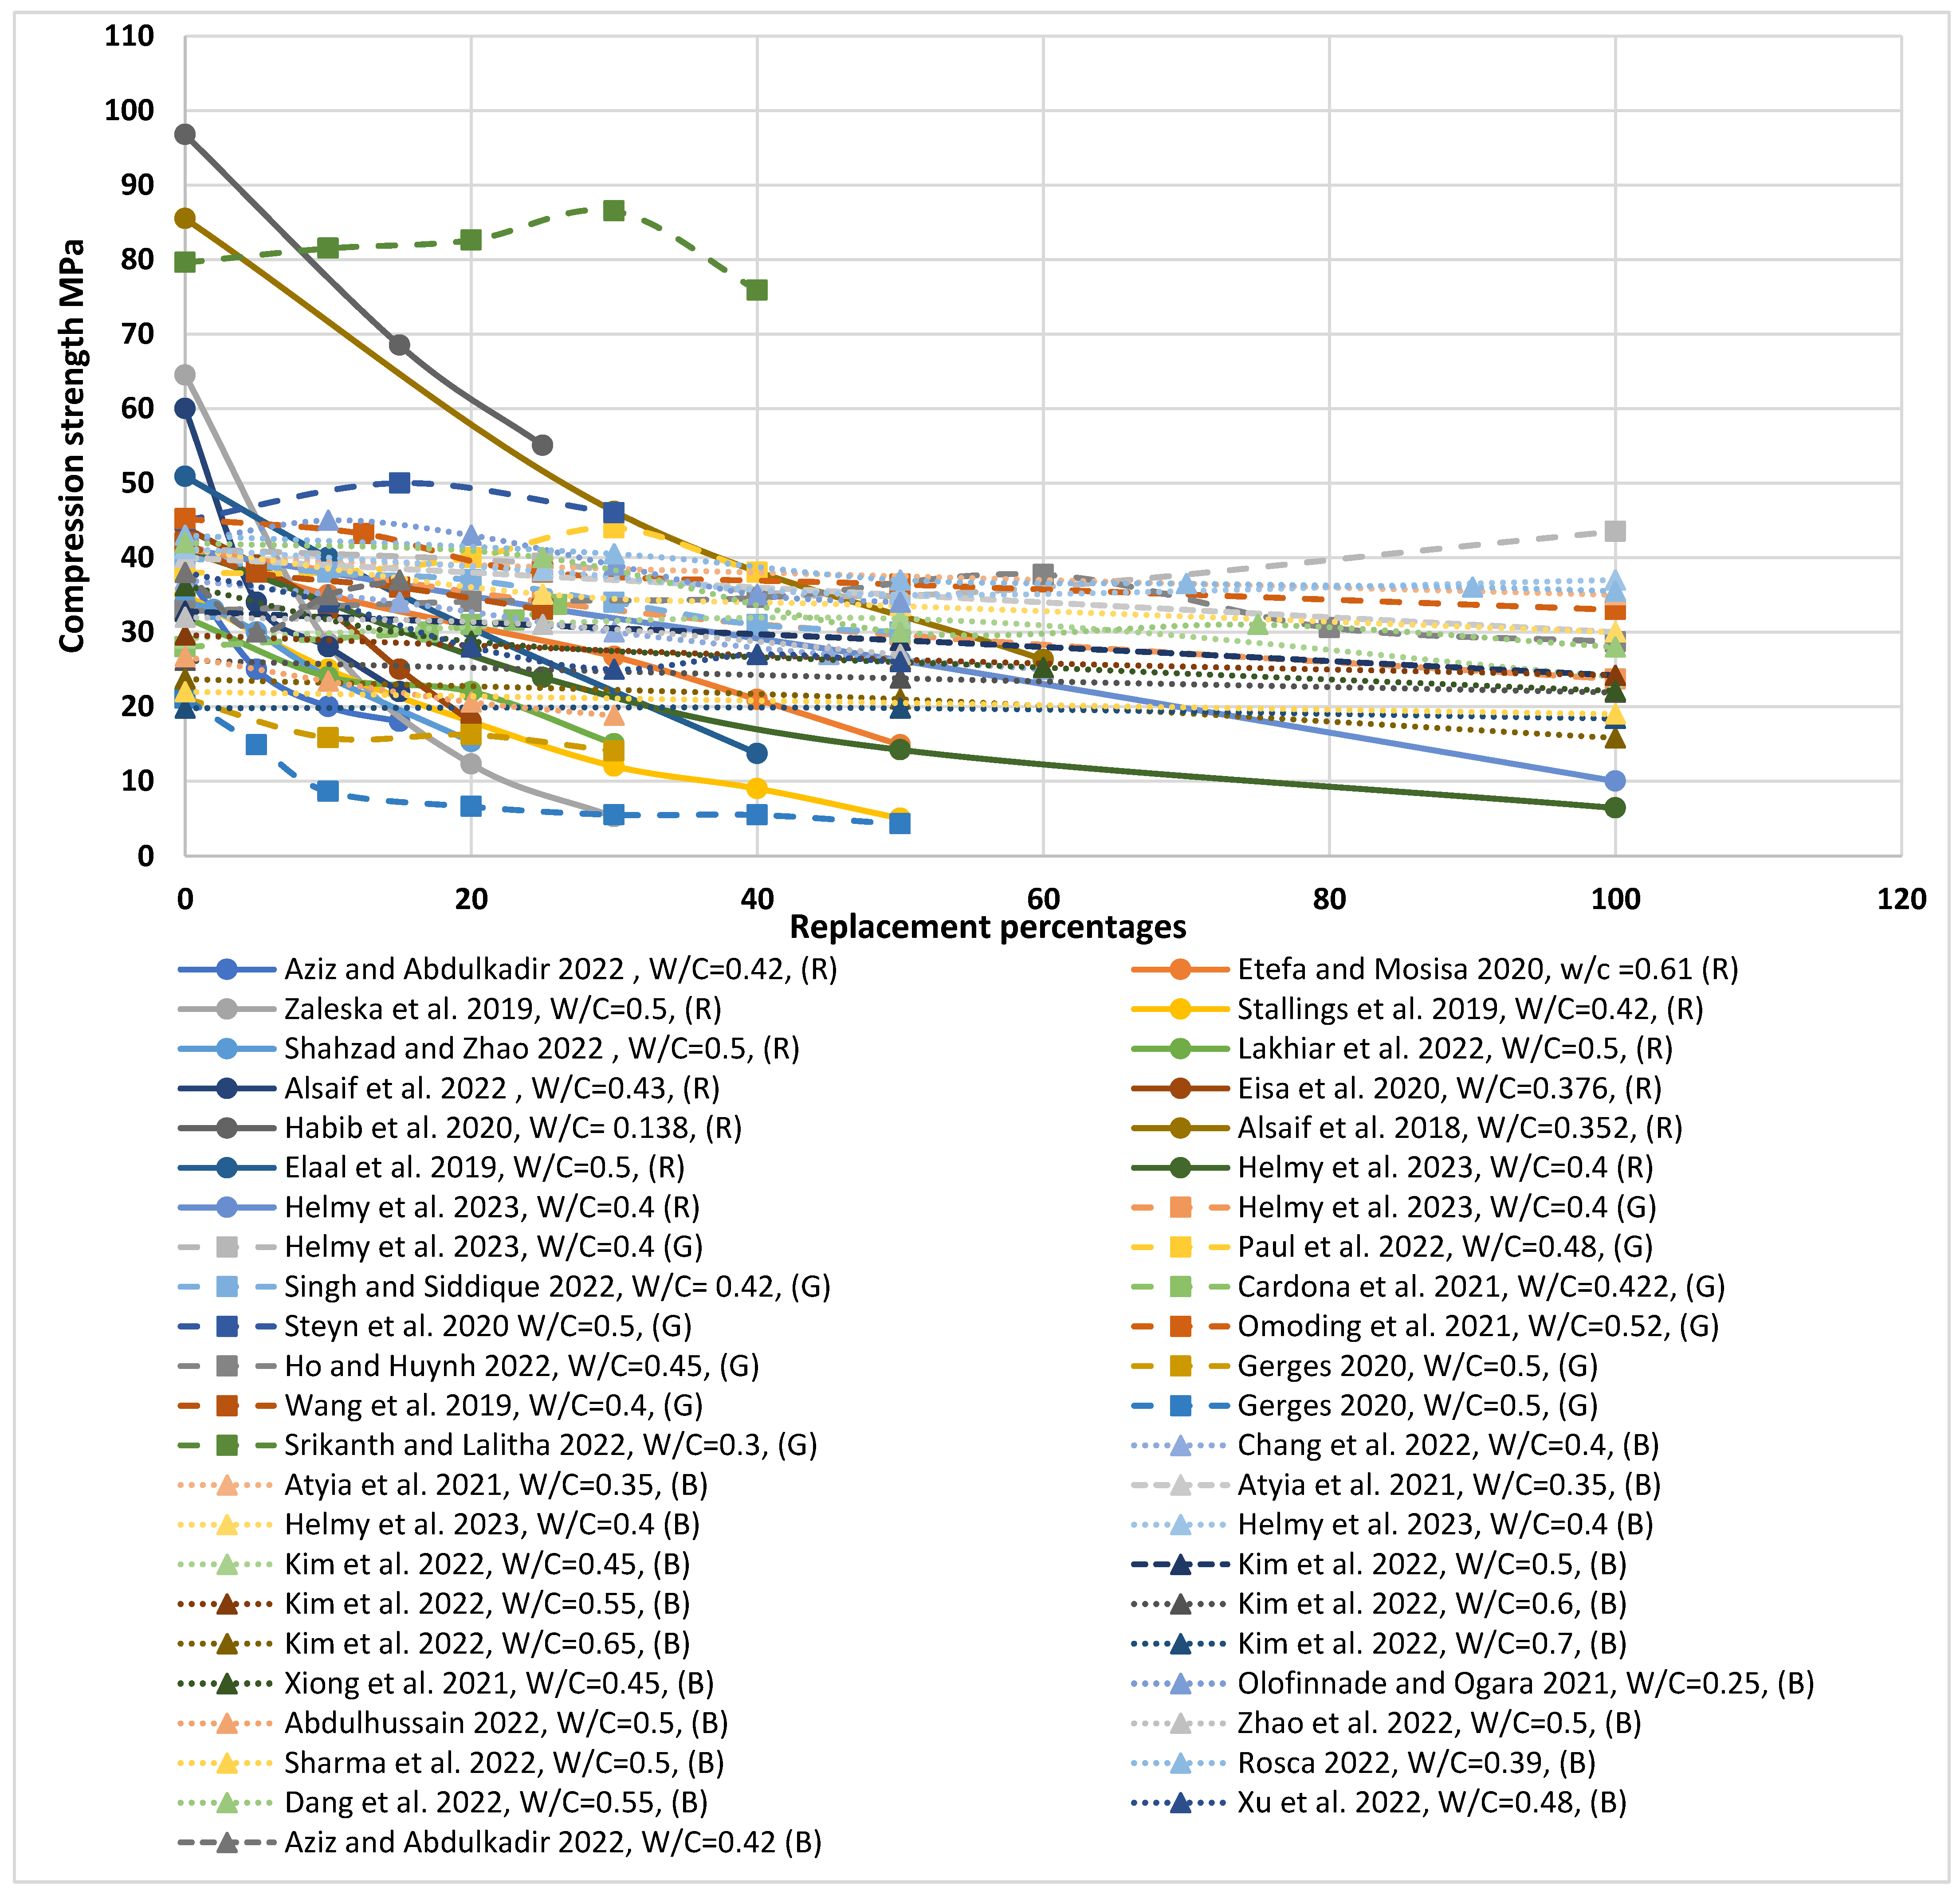
6.1. Compressive Strength

The compressive strength of cement-based materials is significantly influenced by the structure of raw materials, the amount of chemical and mineral additives, types of aggregate, and the water-to-binder ratio (w/b), as shown in Table 2 [97]. Wu et al. studied the effects of casting under compact for rubberized concrete when rubber was used as coarse aggregate. Compressed specimens have higher compressive strength than uncompressed specimens for all replacement ratios due to their small voids and pores. For uncompressed specimens, the concrete strength ranged between 4 and 24 MPa depending on the replacement ratio, while it was 31 MPa for the reference concrete. This reduction happened due to the elastic properties of rubber and the weak bond between the rubber and the cement matrix. Compressed specimens with up to 30% replacement can be produced with similar or even higher strength than normal aggregate concrete, so they can be utilized in structural buildings [25]. However, Hunag et al. found that the compressive strength of rubberized concrete deteriorated when the rubber amount increased. At 1 day, the compressive strength of rubberized concrete with 20% sand replacement was lower than control concrete at the same age [50]. Aliabdo et al. reported that the compressive strength of rubberized concrete with 100% replacement of sand by rubber was reduced by 93.3% because the rubber particles are much softer than the surrounding matrix. As a result, fractures will form quickly around the rubber particles in the mix [32].
Záleská et al. reported that the compressive strength of rubberized concrete ranged from 26.8 to 3.1 MPa when fine sand (<4 mm) was substituted with rubber, with replacement levels of 10 to 30% by weight, while it ranged from 28.5 to 5.2 MPa when coarse sand (4–8 mm) was replaced with rubber. Rubberized concrete, in which fine and coarse sand were replaced by fine and coarse rubber at percentages of 10 and 20% by weight, had a compressive strength of 27.8 and 13.6 MPa, respectively, whereas normal concrete exhibited a compressive strength of 64.5 MPa. The reasons for this reduction are as follows: weak adhesion between rubber and the cement matrix, higher elasticity of rubber cement paste, lower mechanical resistance of rubber aggregate than natural ones, and increased voids volume associated with increasing rubber aggregate [26].
Zhang and Poon reported that when furnace bottom ash, which was used as a fine aggregate in lightweight concrete, was replaced with pre-treatment crumb rubber by up to 25% by volume replacement, compression strength increased compared to untreated crumb rubber. The opposite happens when replacement percentages exceed 25%. The treatment used in this study was to coat rubber particles with cement paste before using them in the mix [24]. Gesoǧlu et al. reported that the use of rubber led to a decline in the compressive strength of pervious concrete. The loss in strength ranged from 16 to 68% according to the type and replacement levels of rubber [21]. Zaldívar et al. reported that the compressive strength of plaster mortar was 23.53 MPa, but when the plaster was replaced with rubber with a size of 0–0.6 mm in percentages of 30 to 60% by weight, the compressive strength ranged from 5.55 to 0.55 MPa, respectively. Additionally, it ranged from 5.07 to 0.87 MPa when it was replaced with rubber with a size of 0.5–2.5 mm and from 4.24 to 1.56 MPa when rubber with a size of 2.5–4 mm was involved in the mix [51]. The negative effect of using rubber as a replacement for normal aggregate is continued in [1,53,54].
Jiao et al. generated ultra-high-performance glass concrete by substituting sand with glass powder (<2 μm) in percentages of 25 to 100% by weight. Compressive strength increased as the glass replacement ratio increased [38]. Alharishawi et al. developed glass concrete by substituting fine aggregate with glass powder (<150 µm) in percentages ranging from 5 to 50% by weight. There was an improvement in compression strength as glass powder content increased, and the highest increase was found in specimens containing 20% glass powder [98]. In contrast, Castro and Brito generated three mixes of glass concrete by replacing sand, gravel, and both sand and gravel with fine, coarse, and both fine and coarse glass, respectively, with percentages of 5, 10, and 20%. The compressive strength of glass concrete decreased when glass content increased due to the weak bond between glass and cement paste. The strength deterioration was obvious in mixes in which crushed glass substituted both normal fine and coarse aggregate by 20% [58]. Topcu and Canbaz produced glass concrete by replacing crushed stone with a particle size of 4–16 mm with waste glass of the same size in percentages that ranged from 15 to 60%. The reduction in compressive strength reached 49% compared to normal concrete due to the high brittleness of glass, weak adhesion between glass and cement matrix, the geometry of glass, and the non-homogenous distribution of glass aggregates [57].
Terro studied the performance of glass concrete at high temperatures. Three mixes of glass concrete were prepared by replacing natural fine, coarse, and both fine and coarse aggregate with fine, coarse, and both fine and coarse glass aggregate, respectively, in percentages of 10, 25, 50, and 100%. In all three mixes, the compressive strength was higher than the conventional mix above 150 °C up to 700 °C for 10% replacement only. With larger substitution percentages of aggregates, fine glass concrete exhibited higher compressive strengths than other glass mixes at ambient and rising temperatures. However, when the temperature reaches 700 °C, the influence of glass aggregate size is negligible in terms of compressive strength [79]. Yang et al. attributed the strength reduction in glass concrete to the smooth glass surface and poor adhesion between glass and the cement matrix. When temperatures between 600 °C and 800 °C were exposed to mixes, the compressive strength increased when glass content increased due to the pores in concrete being filled with melted glass [37].
Dang and Zhao produced clay brick concrete by replacing sand with waste clay bricks (CB) with a particle size of 0–5 mm in percentages of 25, 50, 75, and 100% by volume. Additional water was introduced in mixes, which was represented by the water required to achieve 100% saturated surface dry of CB (TSSD) and 75% saturated surface dry of CB (PSSD). The compressive strength of waste clay brick concrete (WCBC) increased when the curing age increased, like in normal concrete. The compressive strength of WCBC with no extra water was the maximum, followed by WCBC with PSSD and, finally, WCBC with TSSD. The reason is that WCBC, with no additional water, can absorb free water from the concrete mix, which leads to a reduction in the w/c ratio effect. However, additional water forms more voids, which leads to a decrease in compressive strength [64]. Bektas et al. produced recycled mortar by substituting sand with CB in percentages of 10 and 20% by weight. Due to the pozzolanic action produced by the extremely fine part of the brick, the compressive strength increased with the curing age. There was no significant difference between compressive strength for control mortar and mortar prepared with fine clay brick [68]. Aliabdo et al. produced recycled mortar and concrete by using CB of various sizes. When clay brick powder (CBP) was used to replace cement with percentages that fluctuated from 5 to 25% by weight of cement, the reduction in the compressive strength of mortar ranged between 8.3 and 25.2%. However, a slight increase in compressive strength was observed when CBP was used as an additive to cement [67].
Olofinnade and Ogara produced eco-friendly concrete by substituting fine aggregate with CB (<4.75 mm) in percentages of 10, 20, 30, 40, and 50% by weight. The compression strength decreased when CB content increased, except at replacement levels of 10% and 20%, which had higher values than the control specimen [87]. Vieira et al. generated WCBC by replacing fine aggregate with fine crushed red clay ceramic bricks in percentages of 20%, 50%, and 100% by volume. The reduction in compression strength at 28 days reached 9.7%, while the strength increased with time compared to control concrete due to the pozzolanic activity of CB [99]. Ge et al. produced WCBC by replacing cement with CBP in percentages ranging from 10 to 30% by weight. The compression strength decreased when CBP increased [65].
Figure 4 shows most of the recent scientific research conducted in 2019 in order to compare the compression strengths of rubberized, glass, and crushed clay brick cement-based concrete. In the figure, it is clear that glass concrete has the highest compression strength, followed by concrete containing crushed clay brick, and finally, rubberized concrete, which has the lowest strength. In the figure, we notice that in glass concrete, by increasing the percentage of glass, the resistance increases, unlike rubberized concrete and concrete containing crushed clay brick. The reduction in compressive strength in rubberized concrete was attributed to the fact that the rubber particles are much softer than the surrounding matrix. As a result, fractures form quickly around the rubber particles in the mix. Glass concrete had the highest compression strength, especially when it was used in powder form, due to its packing density and pozzolanic reaction. Additionally, according to ACI 213R-87 [3], lightweight concrete is classified into three types: insulation, filling, and structural lightweight concrete, depending on density and compression strength. It was obvious that rubberized concrete could be used for insulation and filling. Additionally, crushed clay brick concrete can be used as a filling in structural lightweight concrete. All the above information may be changed due to varied mix components, especially the w/c ratio. Thus, research has studied the effects of three waste materials with the same condition and found the same results mentioned above: glass concrete had the highest compression strength, followed by crushed clay brick concrete, and the lowest was found in rubberized concrete [70].

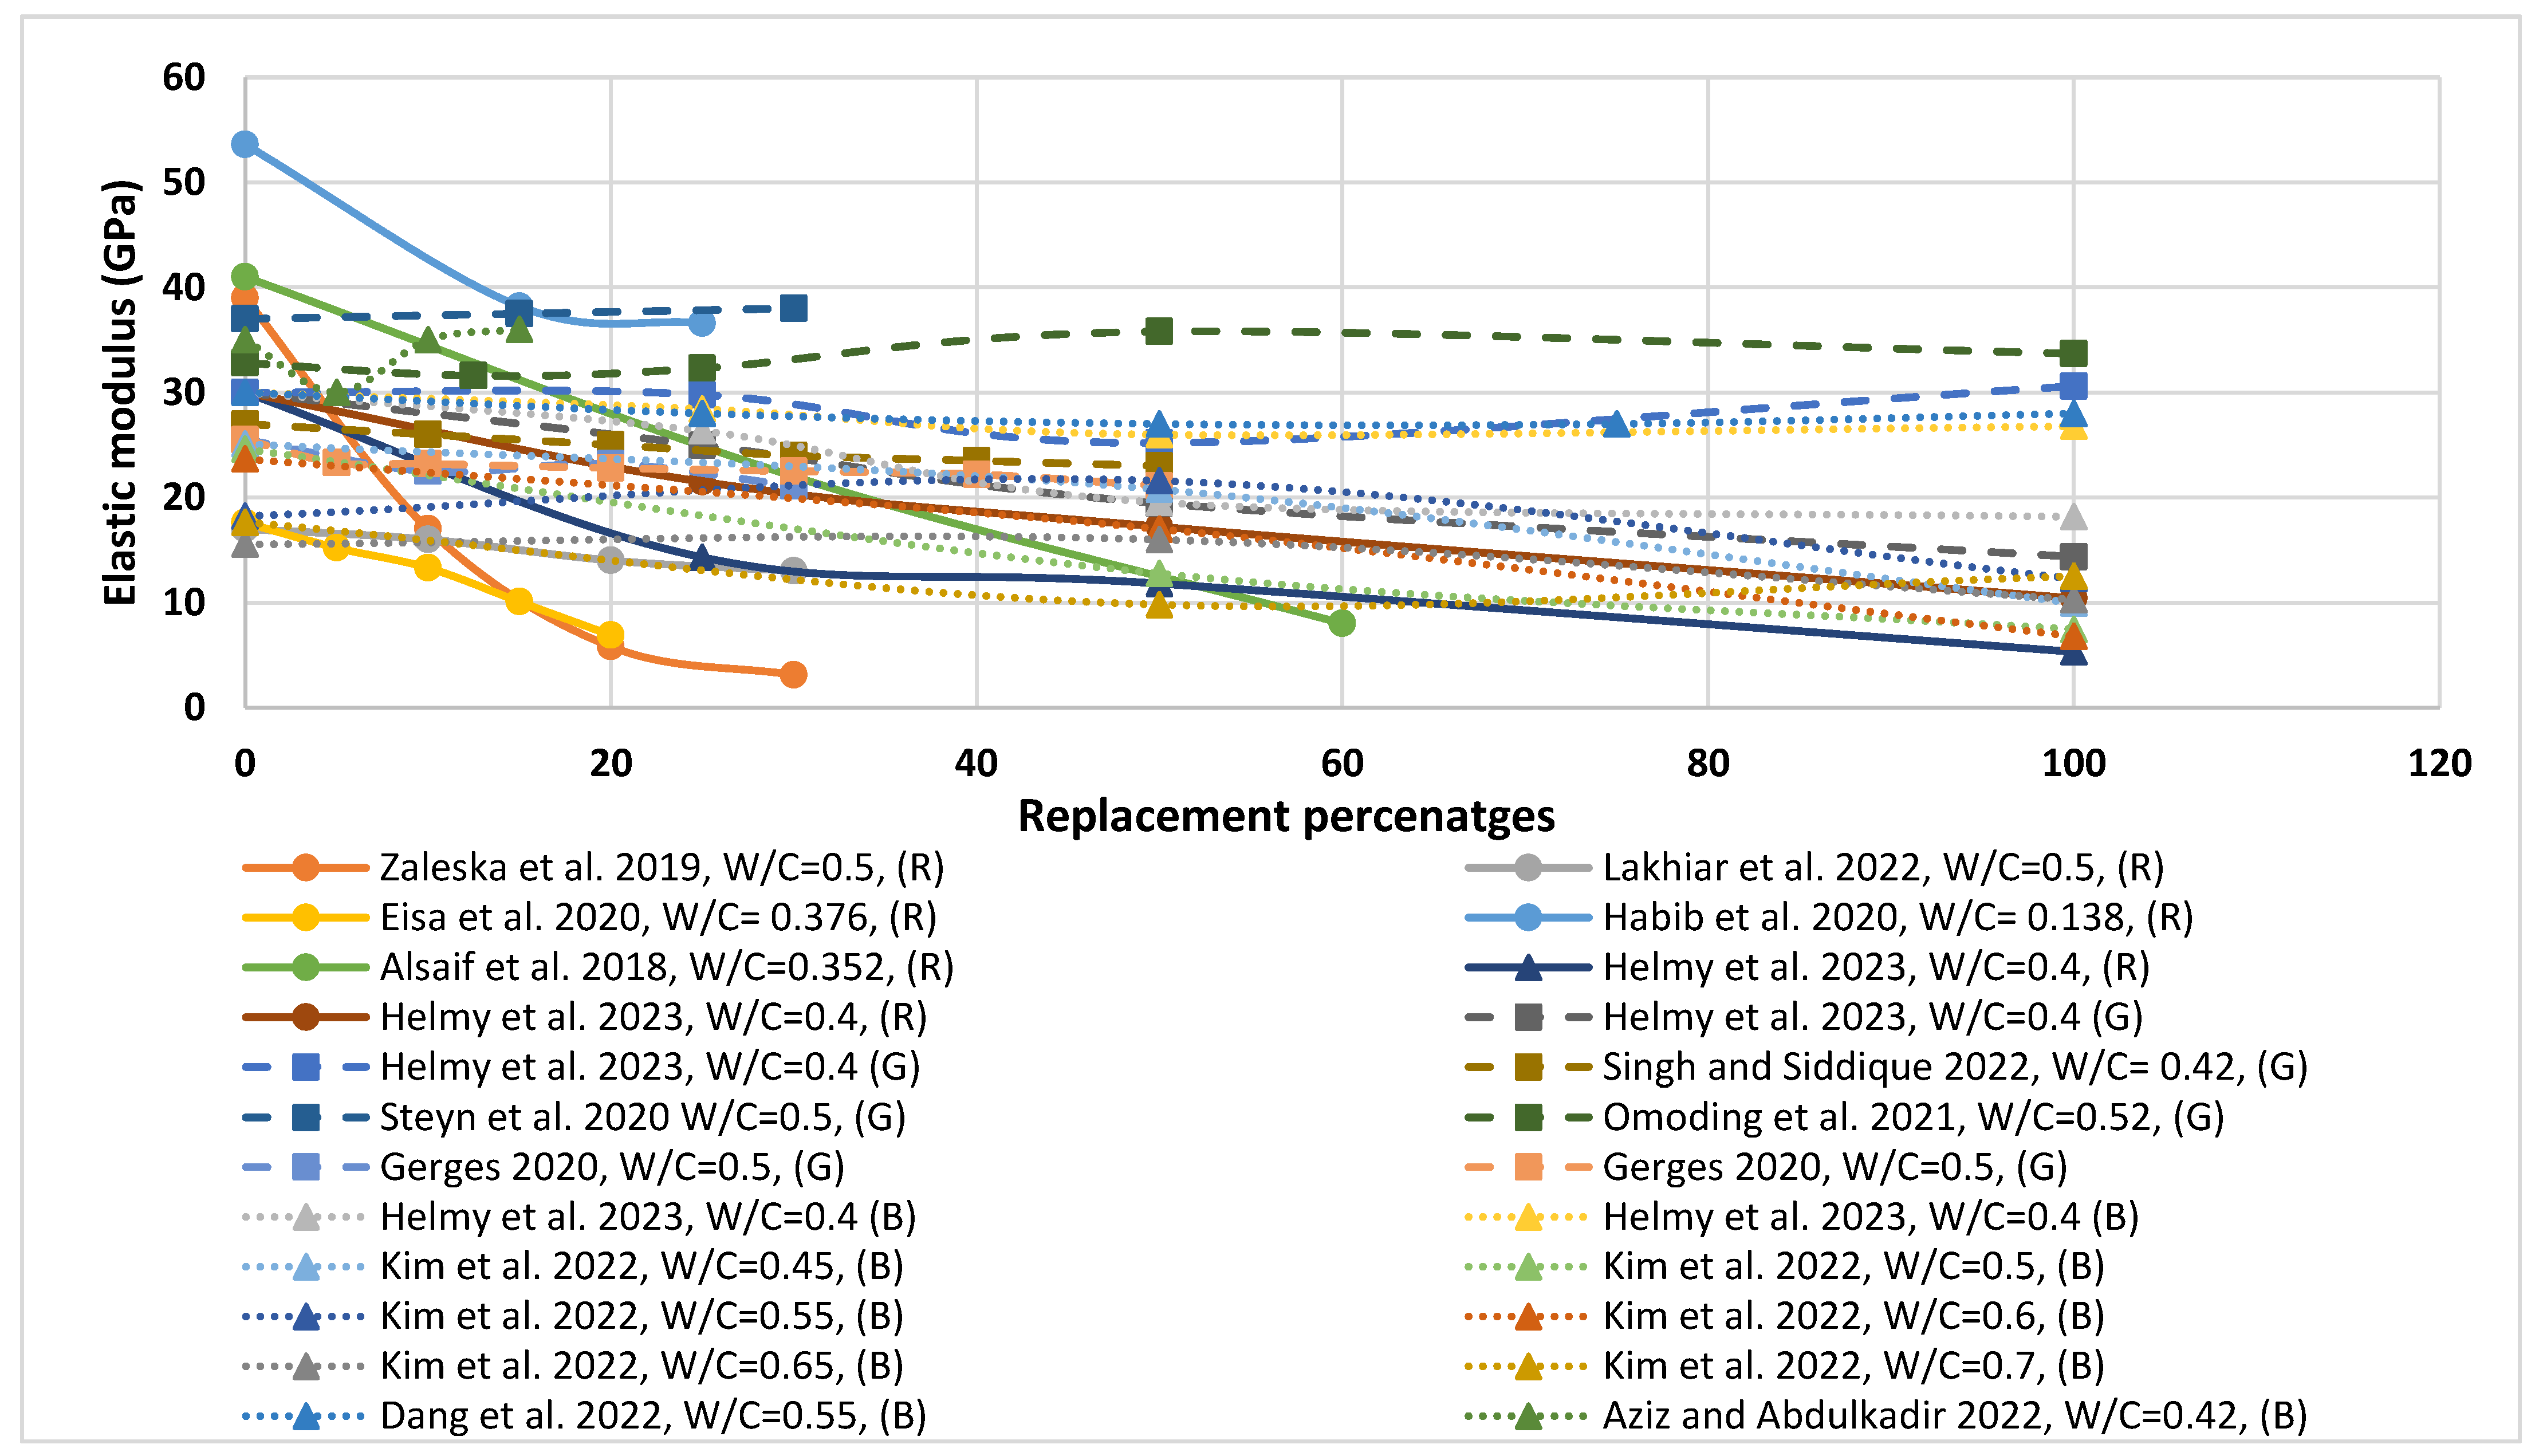
6.2. Elastic Modulus

The modulus of elasticity (E value) is used to determine the stiffness of a material by measuring the immediate elastic deformation. Wu et al. substituted granite with chipped rubber in percentages of 10 to 100% by volume. The authors cast specimens under a compact load, which was maintained for 24 h, and other specimens without a compact. The modulus of elasticity for compressed specimens was larger than uncompressed specimens for all the same rubber replacement ratios. The elastic modulus of compressed specimens with a rubber replacement ratio of up to 30% was greater or similar to that of regular concrete specimens, so they can be used in construction without any problems [25]. Záleská et al. found that the secant modulus of elasticity for rubberized concrete, in which fine sand (<4 mm) was substituted by fine rubber in percentages of 10, 20, and 30% by weight, was reduced to 17.6, 9.1, and 3 GPa. However, it was reduced to 18, 6.2, and 3.4 GPa when coarse sand (4–8 mm) was replaced with coarse rubber. Rubberized concrete, in which both fine and coarse sand were substituted by fine and coarse rubber in percentages of 10 and 20% by weight, was reduced to 19.3 and 9.8 GPa, respectively. This is compared to normal concrete, which has a secant modulus of elasticity equal to 30 GPa [26]. Zhang and Poon generated lightweight rubberized concrete by replacing furnace bottom ash (FBA), which was used as a fine aggregate, with crumb rubber aggregates in percentages ranging from 25 to 100% by volume. Two mixtures were developed, one with treated rubber and the other without treatment. There was no significant change in the dynamic Young’s modulus value between treated and untreated rubber when the aggregate percentage was set at 25%. When treated rubber content increased, the dynamic Young’s modulus was lower than the specimens developed with untreated rubber aggregates. The treatment used in this study was to coat rubber particles with cement paste before using them in the mix [24]. Gesoǧlu et al. generated pervious concrete by replacing coarse aggregate (10–12.5 mm) with three types of rubber: (0.1–1 mm), (0.1–4 mm), and (0.1–10 mm) with replacement percentages of 0–20%. It was reported that pervious concrete with a rubber size < 1 mm had a modulus of elasticity of 9.4–5.3 GPa, corresponding to replacement percentages of 10 and 20%. It was 16.9 and 16.4 GPa for previous concrete with rubber size < 4 mm and 15.1–15.9 GPa for previous concrete with rubber size 10 mm. Another mix contains both rubber sizes < 1 mm and <4 mm with replacement percentages of 10 and 20%, and another mix contains sizes <1 mm and <10 mm with the same replacement percentages. The elastic modulus for the first one was 10.5–9.2 GPa, and 8.2–4.5 GPa for the second. Meanwhile, the control mix had a modulus of elasticity equal to 28 GPa [21].
Topcu and Canbaz produced glass concrete by replacing crushed stone with waste glass with a size of 4–16 mm in percentages of 15, 30, 45, and 60%. The dynamic modulus of elasticity decreased when the waste glass content increased. The reduction in dynamic modulus of elasticity for glass concrete produced reached 39% according to the replacement ratio [57]. Yan and Liang produced glass concrete by replacing coarse aggregate with coarse glass in percentages of 20%, 40%, 60%, 80%, and 100%. When the coarse glass content increased, the Young’s modulus decreased [120]. In contrast, Alharishawi et al. developed glass concrete by substituting fine aggregate with glass powder (<150 µm) in percentages ranging from 5 to 50% by weight. There was a continuous increase in the modulus of elasticity as the glass powder content increased. The value of the increase was 13% when the glass content was 50% [98]. Mohammed and Hama generated glass concrete by replacing cement with 15% glass powder (<0.3 mm) by weight. The modulus of elasticity increased by 6.01% when glass powder was involved in the mix [121]. However, Dang and Zhao produced clay brick concrete (WCBC) by replacing sand with waste clay bricks (CB), with percentages ranging from 25 to 100% by volume, and additional water was added depending on the water absorption of CB. The modulus of elasticity of WCBC decreased when the replacement ratio increased due to the weak stiffness and lower strength of CB. When no additional water was added, the elastic modulus of the WCBC value was close to normal concrete (NC). However, the elastic modulus of WCBC gradually decreased when additional water was added due to additional porosity and voids that developed from the extra water added [64]. Aliabdo et al. stated that elastic modulus decreased when the CB content increased. The reduction in mixes containing coarse CB (4.75–19 mm) was greater than in mixes containing fine CB (0.15–4.75 mm) [67].
Figure 5 shows most of the recent scientific research conducted in 2019 in order to compare the elastic modulus of rubberized, glass, and crushed clay brick cement-based concrete. In the figure, it is clear that glass concrete has the highest elastic modulus strength, followed by clay brick concrete, and finally, rubberized concrete, which has the lowest strength. It is obvious that elastic modulus followed the same trend as compression strength.

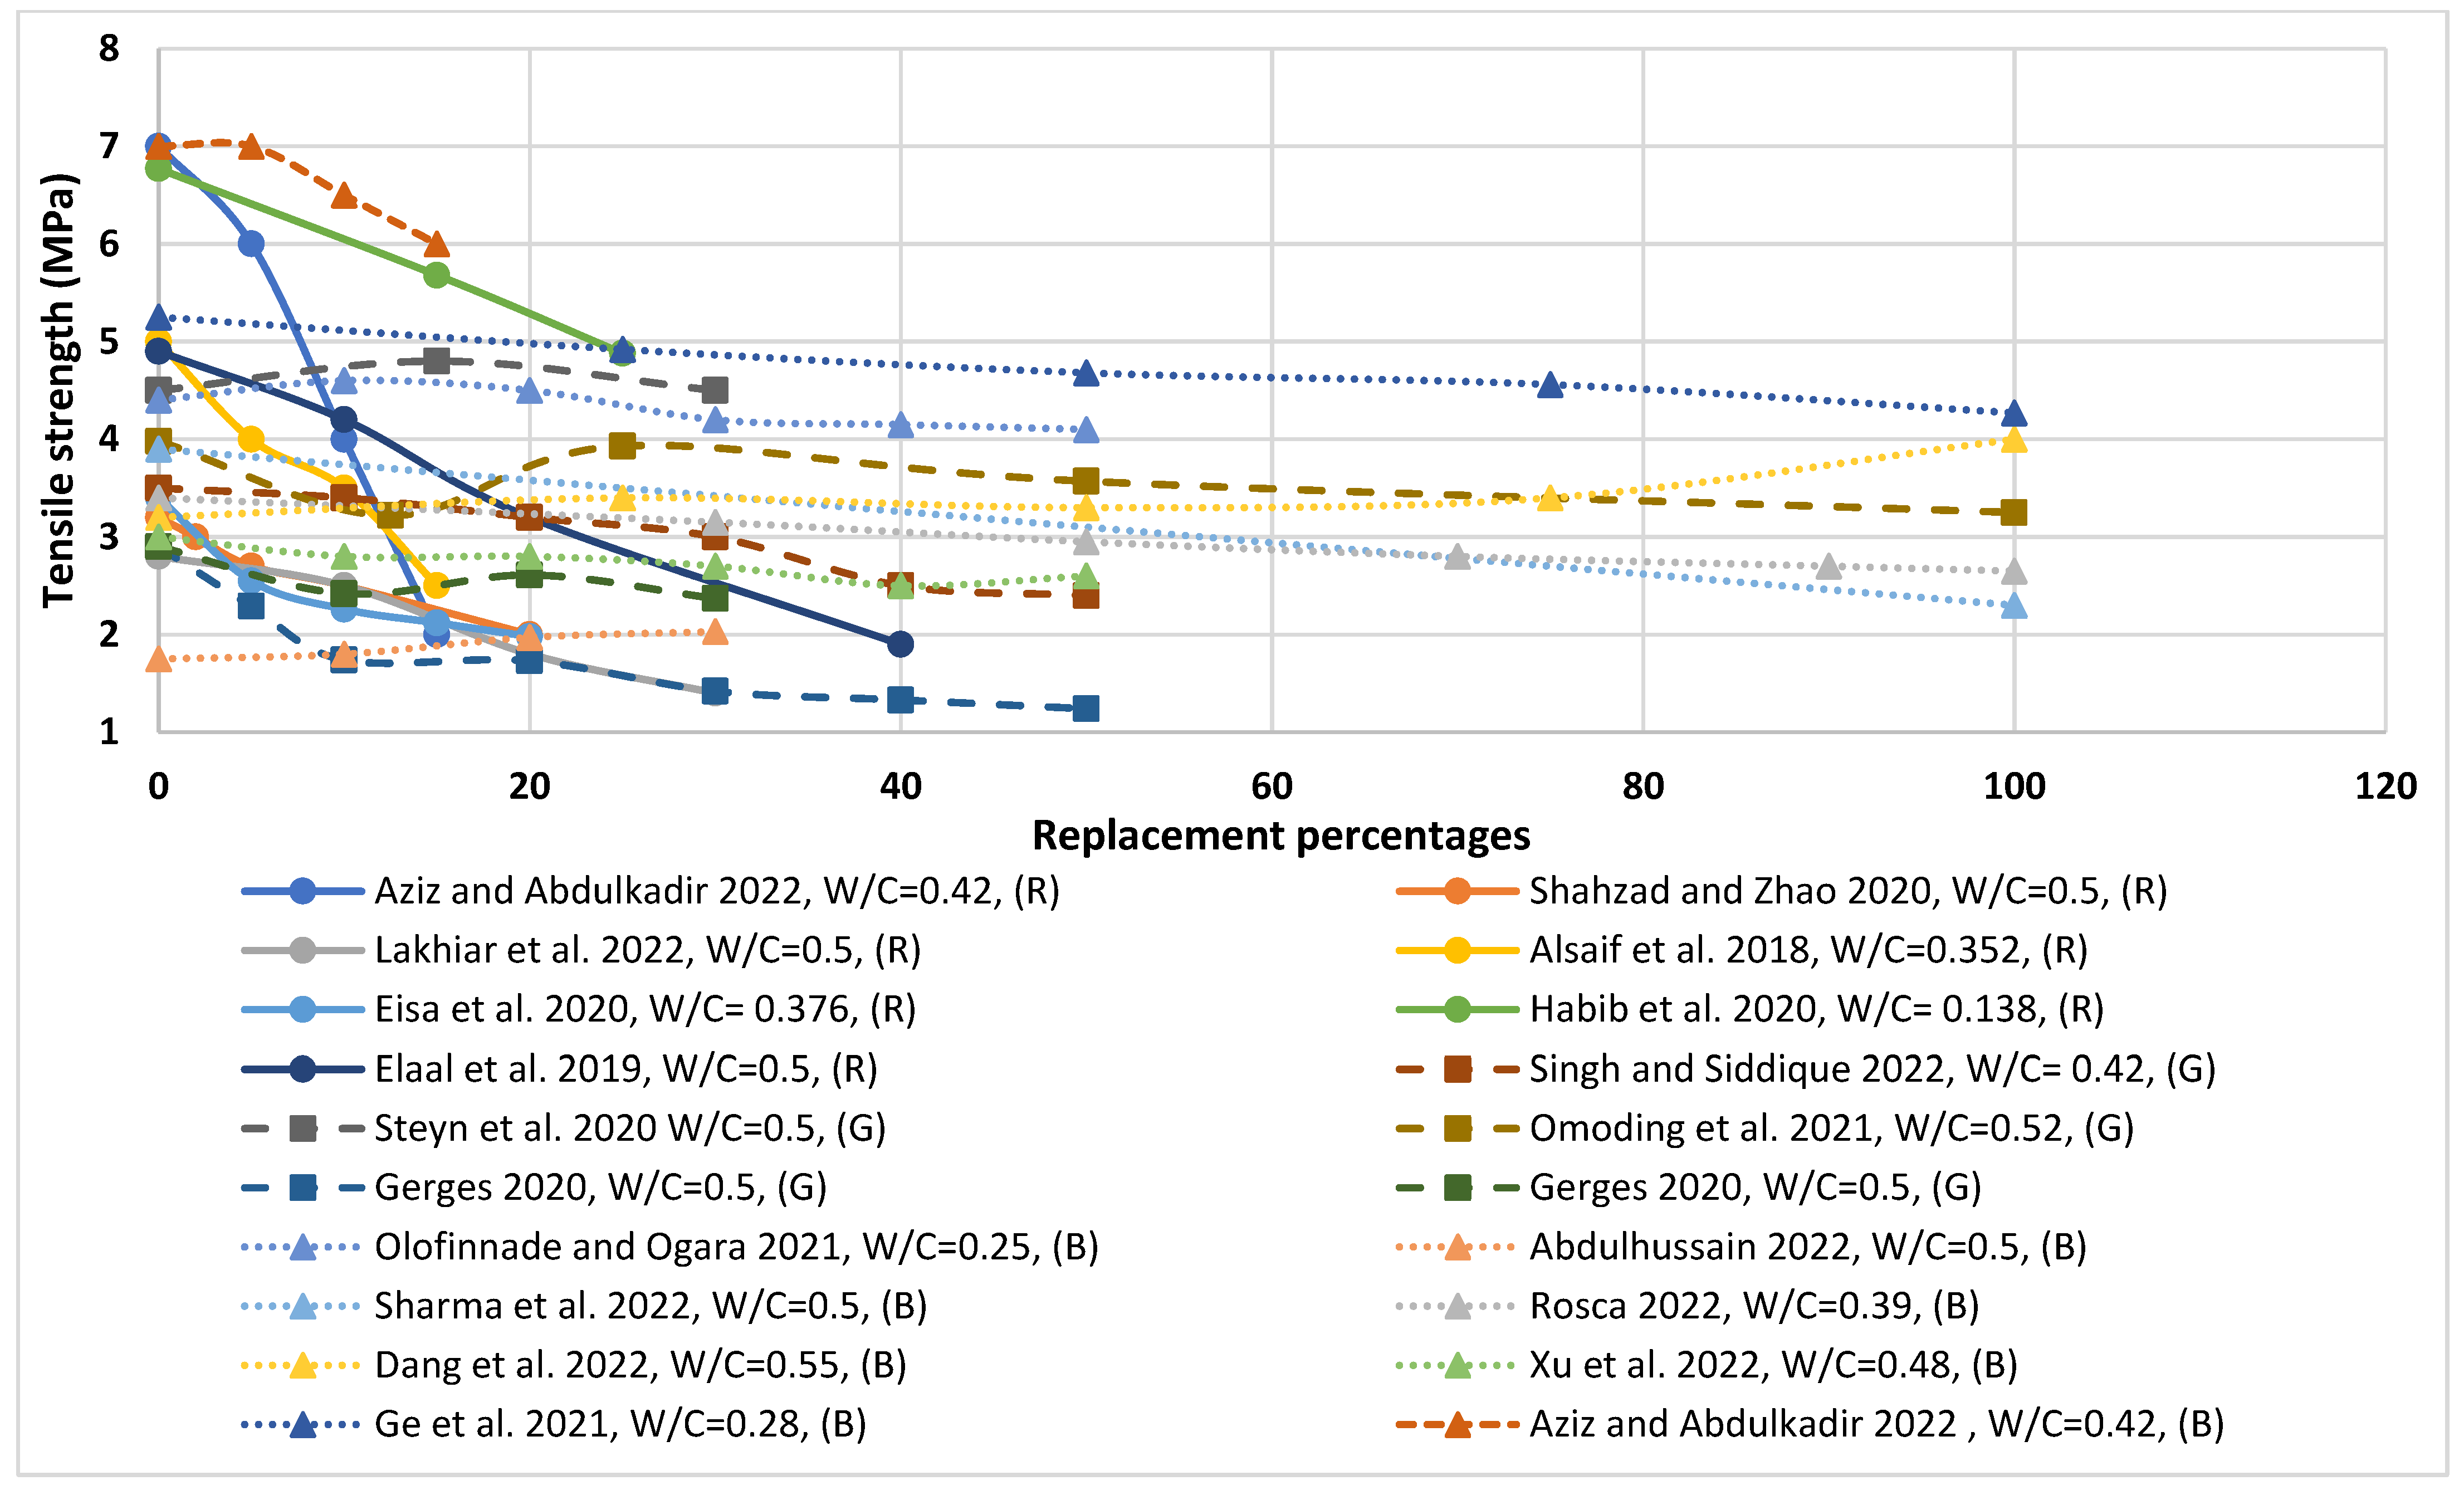
6.3. Splitting Tensile Strength

Concrete is a heterogeneous material characterized by its appropriate compressive strength, but it suffers from low tensile strength. The following section introduces the influence of waste material on concrete tensile strength. Gesoǧlu et al. reported that the reduction in splitting tensile strength of rubberized concrete reached 66% when coarse aggregate with a size of (10–12.5 mm) was replaced by rubber with a replacement percentage of 20% [21]. Thakur et al. generated rubberized lightweight bricks by replacing coarse sand with a max size of 6 mm by crumb rubber in percentages of 5, 10, 15, and 20% by volume. The tensile strength of the normal mix was found to be 1.04 MPa, but it was reduced to 0.92, 0.69, 0.54, and 0.46 MPa, corresponding to 5, 10, 15, and 20%, respectively. The reason for this reduction was poor adhesion between rubber and the cement matrix [54]. Si et al. generated rubberized self-consolidating concrete (RSCC) by replacing sand with treated crumb rubber in percentages of 15 and 25% by volume. The splitting tensile strength decreased by 19.6 and 33.24%, corresponding to 15 and 25% replacement, respectively. At the same replacement percentages, the splitting tensile strength of SCC with treated rubber was greater than SCC with untreated rubber by 5.9% [53].
Jiao et al. generated ultra-high-performance glass concrete by replacing fine aggregate (sand) with glass powder (<2 µm) in percentages of 25, 50, 75, and 100% by weight. There was a small increase in splitting tensile strengths with the variation in replacement ratios compared to the control specimen. Steel fiber showed an important role in tension resistance when UHPGC was under tension [38]. Alharishawi et al. developed glass concrete by substituting fine aggregate with glass powder (<150 µm) in percentages ranging from 5 to 50% by weight. There was a continuous increase in splitting tensile strength as glass powder content increased. The value of split tensile strength was 3.98 MPa when glass content was 50%, while it was 2.527 MPa for the control specimen [98]. In contrast, Asa et al. generated glass concrete by replacing sand with crushed glass in percentages ranging from 5 to 20% by volume. The reduction in splitting tensile strength ranged from 3.9 to 16.4% at 21 days compared to the control mixes due to a weaker bond between the glass aggregate and the cement matrix [122]. Topcu and Canbaz produced glass concrete by replacing crushed stone with sizes of 4–16 mm with waste glass in percentages of 15, 30, 45, and 60%. The indirect tensile strength value for the control mix was 2.59 MPa, which decreased to 2.34, 2.24, 2.35, and 1.63 MPa, corresponding to 15, 30, 45, and 60% replacement, respectively [57]. Mohammadinia et al. produced glass concrete by replacing coarse aggregate with coarse glass in percentages ranging from 10 to 50%. The indirect tensile strength decreased when glass aggregate content increased due to the low aggregate crushing resistance [123].
Dang and Zhao produced clay brick concrete by replacing fine aggregate with waste clay bricks (CB) with percentages of 25, 50, 75, and 100% by volume. Additional water volume was evaluated by the water absorption of CB, which was represented by T (100% saturated surface dry state of CB) and P (75% saturated surface dry state of CB). The splitting tensile strength of waste clay brick concrete (WCBC) was greater than normal concrete (NC) for all replacement ratios due to the rough surface of CB, which improves the bond between CB and cement paste and intensifies the interfacial tradition zone (ITZ). Additionally, the splitting tensile strength of WCBC increased with the curing age. The splitting tensile strength of WCBC, including no extra water, was the maximum, followed by WCBC with P, and finally, WCBC with T. This is due to the porous structure of CB, which absorbs some of the free water, lowering the effective w/c ratio and increasing cement paste and ITZ toughness [64]. Olofinnade and Ogara produced eco-friendly concrete by substituting fine aggregate with CB (<4.75 mm) in percentages of 10, 20, 30, 40, and 50% by weight. The splitting tensile strength of mixes containing 10, 20, and 30% replacement showed proper improvement compared to the control specimen [87]. Zhang et al. generated clay brick concrete by replacing basalt with CB at a percentage of 30% by volume. The splitting tensile strength decreased by 53.1% when CB content was involved in the mix due to the crushing index of CB being higher than basalt [42]. Aliabdo et al. produced recycled concrete in two series: the first with a cement content of 250 kg/m3 and a w/c ratio of 0.7, and the second with a cement content of 350 kg/m3 and a w/c ratio of 0.5. Fine, coarse, and both fine and coarse CB were used to replace sand, limestone, and both sand and limestone, respectively, with percentages of 25, 50, 75, and 100% by volume. The splitting tensile strength decreased when the CB content increased, except for fine clay brick with a 25% replacement in series two, which increased by 12.2% compared to normal concrete [67]. Figure 6 shows most of the recent scientific research conducted in 2019 in order to compare the split tensile strengths of rubberized, glass, and crushed clay brick cement-based concrete. In the figure, it is clear that crushed clay brick concrete has the highest split tensile strength, followed by concrete containing crushed glass, and finally, rubberized concrete, which has the lowest strength. Additionally, the split tensile strengths of waste concrete decreased as the amount of waste increased.

6.4. Impact Resistance

The impact resistance is determined by the number of blows corresponding to the first visible crack and the number of blows corresponding to the fracture according to ACI 544.2R-89 [125]. Aliabdo et al. reported that the number of blows corresponding to the first visible crack for rubberized concrete was reduced by 29, 69, 78, 86, and 71% when sand was replaced by rubber with percentages of 20, 40, 60, 80, and 100% by volume, respectively. The number of strikes required to propagate a crack was reduced when rubber replacement percentages increased [32]. Dezhampanah et al. generated rubberized concrete by substituting sand with crumb rubber (CR) in percentages of 10 and 20% by volume. The number of blows for the first crack and failure rose by 1.43 and 1.45 times, respectively, when the percentage of CR was 10%. When the percentage of rubber was increased to 20%, the number of blows for the first crack and failure were reduced to 0.22 and 0.24 times, respectively [1]. Thakur et al. generated rubberized lightweight bricks by replacing coarse or fine sand with crumb rubber in percentages of 5, 10, 15, and 20% by volume. For control, the number of drops required to develop a fracture was three, while specimens with 5% crumb rubber broke at four blows [54]. Gerges et al. generated rubberized concrete by replacing sand with rubber powder in percentages of 5, 10, 15, and 20%. When rubber powder replaced sand in the control mix with a compressive strength above 50 MPa, the impact energy outperformed the control concrete [126]. Given the above information, all studies developed rubberized concrete by replacing sand with fine rubber <5 mm and w/c < 0.45 in order to make a fair comparison. It was found that rubberized concrete had good behavior when replacement percentages were below 10% but when the w/c ratio was below 0.45 to obtain a high compression strength. The only paper [32] from the above stated that impact resistance decreased due to the replacement percentages used in this study, which started from 20 to 100%, or in other words, there was no 10% replacement. According to the author’s knowledge, there was a lack of information about the impact resistance of glass and crushed clay brick mixes.

7. Physical Properties of LWC Incorporating Lightweight Aggregate from Waste Materials
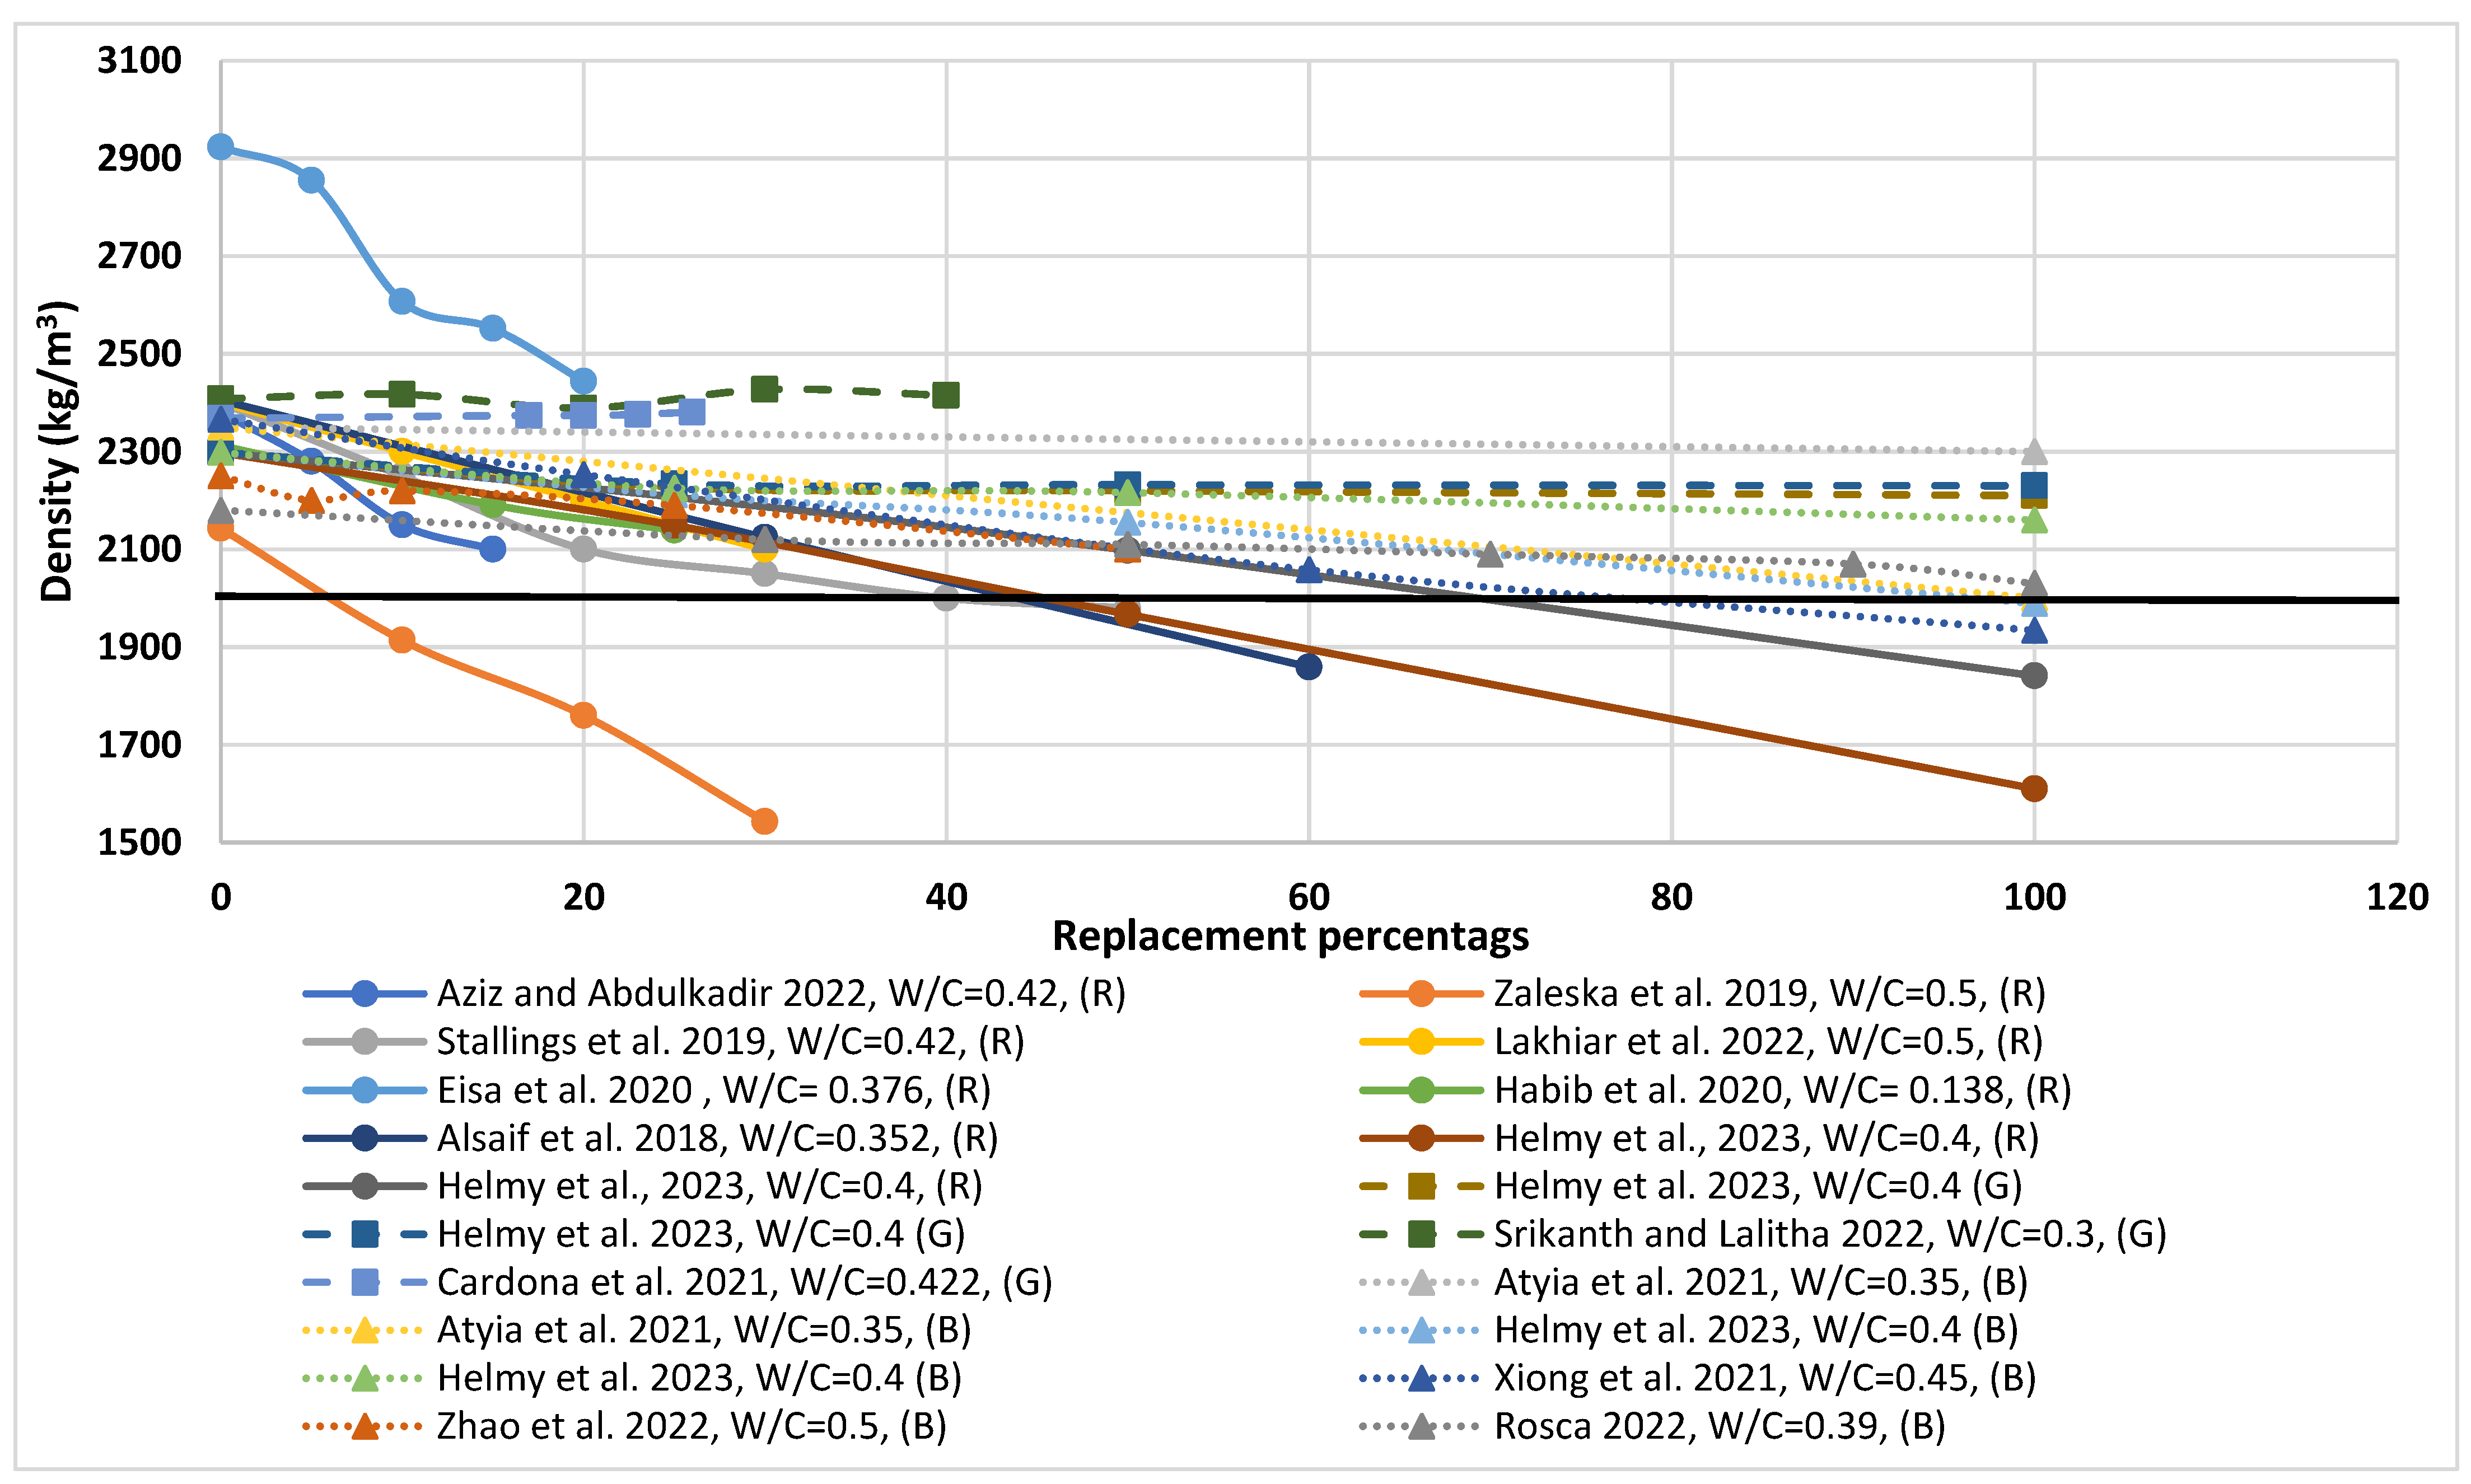
7.1. Density

Table 2 presents the measured densities of concrete incorporating waste materials as aggregate. Aliabdo et al. found that the dry density decreased gradually when the rubber content increased. This phenomenon might be explained by the rubber’s lower density. The reduction in density was 9, 13, 15, 18, and 20% when sand was substituted by rubber in percentages of 20, 40, 60, 80, and 100%, respectively [32]. Záleská et al. reported that the dry density of control concrete was 2134 kg/m3, which was reduced to 1935, 1737, and 1457 kg/m3 when fine sand (<4 mm) was replaced by fine rubber in percentages of 10, 20, and 30%. However, it was reduced to 1914, 1760, and 1543 kg/m3 when coarse sand (4–8 mm) was substituted by coarse rubber. The density of rubberized concrete in which both fine and coarse sand were replaced by fine and coarse rubber in percentages of 10 and 20% was reduced to 1765 and 1933 kg/m3 [26]. Zhang and Poon reported that treated crumb rubber had no effect on the density of the rubberized concrete [24]. Gesoǧlu et al. generated rubberized pervious concrete by using three different sizes of rubber: crumb rubber (<5 mm), tire chips (<10 mm), and fine crumb rubber (<1 mm) to replace coarse aggregate in different percentages. Adding tire chips and crumb rubber to pervious concrete decreases fresh density by about 2–11%, depending on the replacement ratio. However, the fresh density increased by about 2–5% when fine crumb rubber was used in mixes [21]. Zaldívar et al. reported that the apparent density of plaster mortar was 1222.3 kg/m3, which decreased to 1032.4, 901.6, 771.5, and 653.9 kg/m3 when plaster was replaced by rubber with a size of 0–0.6 mm in percentages of 30, 40, 50, and 60% by weight, respectively. When it was replaced by rubber with a size of 0.5–2.5 mm, the density decreased to 1140.2, 1021.5, 891, and 758.2 kg/m3. However, the density was reduced to 1076.9, 960.9, and 893.4 kg/m3 when rubber with a size of 2.5–4 mm was involved in the mix with percentages of 30, 40, and 50% by weight [51]. Thakur et al. generated masonry lightweight concrete bricks by using crumb rubber to substitute coarse sand aggregate with percentages of 5, 10, 15, and 20% by volume. The control specimen had a dry density of 2080 kg/m3, which decreased to 2010, 1970, 1910, and 1830 kg/m3, corresponding to 5, 10, 15, and 20%, respectively, due to the lower specific gravity of crumb rubber and the air trapped on the surface of rubber particles created during casting [54].
Yang et al. produced glass concrete by replacing fine aggregate (sand) with glass aggregate in percentages of 25, 50, 75, and 100%. The reduction in fresh density for glass mixes reached 1.83%, depending on the replacement ratio [37]. Castro and Brito generated three mixes of glass concrete by substituting natural fine or coarse or both fine and coarse with glass aggregate in percentages of 5, 10, and 20% by volume. The reduction in the fresh density reached 2.83% depending on the replacement ratio and the size of the glass used [58]. Topcu and Canbaz produced glass concrete by replacing crushed stone (CS I) with a particle size of 4–16 mm with a waste glass of the same size in percentages of 15, 30, 45, and 60% by volume. The fresh density of mixes decreased when the amount of waste glass increased due to the density of waste glass being lower than CS I [57]. Lu et al. produced pervious glass concrete when fine aggregate was substituted with crushed glass with a size of 2.36–5 mm in percentages of 25, 50, 75, and 100% by volume. The dry density was between 1800 and 2000 kg/m3, which was lower than the control concrete (about 2400 kg/m3) [59]. In contrast, Balasubramanian et al. produced glass concrete by replacing cement with glass powder with a size of 50 μm in percentages of 5, 10, 15, and 20% by volume. Compared to control concrete, the authors discovered a small increase in dry density ranging from 0.1 to 1% [60].
Dang and Zhao produced crushed clay brick concrete by replacing sand with waste clay bricks in percentages of 25, 50, 75, and 100% by volume, and additional water was added in three different forms: no water, water required to make the clay brick fully saturated, and partially saturated. The dry density of normal concrete (NC) was 2328 kg/m3, whereas, for waste clay brick concrete (WCBC), it ranged from 2180 to 2290 kg/m3, depending on the replacement ratio. The curing age has less of an impact on NC with higher density, whereas the curing age has an impact on WCBC with lower density [64]. Aliabdo et al. produced masonry blocks using crushed clay brick. The authors stated that increasing the percentage of crushed clay brick reduces the dry density of the masonry block. The reduction in dry density reached 25% when fine and coarse aggregate were completely replaced with crushed clay brick aggregate. Full replacement of coarse aggregate produces lightweight masonry brick that satisfies the standard [67]. Ge et al. generated clay brick concrete by substituting cement with crushed clay brick powder (CBP) with percentages of 10, 20, and 30% by volume. Three different sizes of CBP were used: 0.35–0.015, 0.3–0.004, and 0.2–0.001 mm. Regardless of the particle size or replacement percentages, the concrete containing CBP had a similar fresh density to regular concrete. The fresh density was in the range of 2400–2500 kg/m3 [65].
Figure 7 shows most of the recent scientific research conducted in 2019 in order to compare the densities of rubberized, glass, and crushed clay brick cement-based concrete. In the figure, it is clear that glass concrete has the highest density, followed by clay brick concrete, and finally, rubberized concrete, which has the lowest density. According to the EN 206-1 code, mixes that are considered lightweight concrete have a density lower than 2000 kg/m3. In the figure, rubberized concrete can be used as lightweight concrete, and clay brick concrete can also be considered at high volume replacement. The lowest and highest densities of waste concrete were attributed to the specific gravity of the materials used.

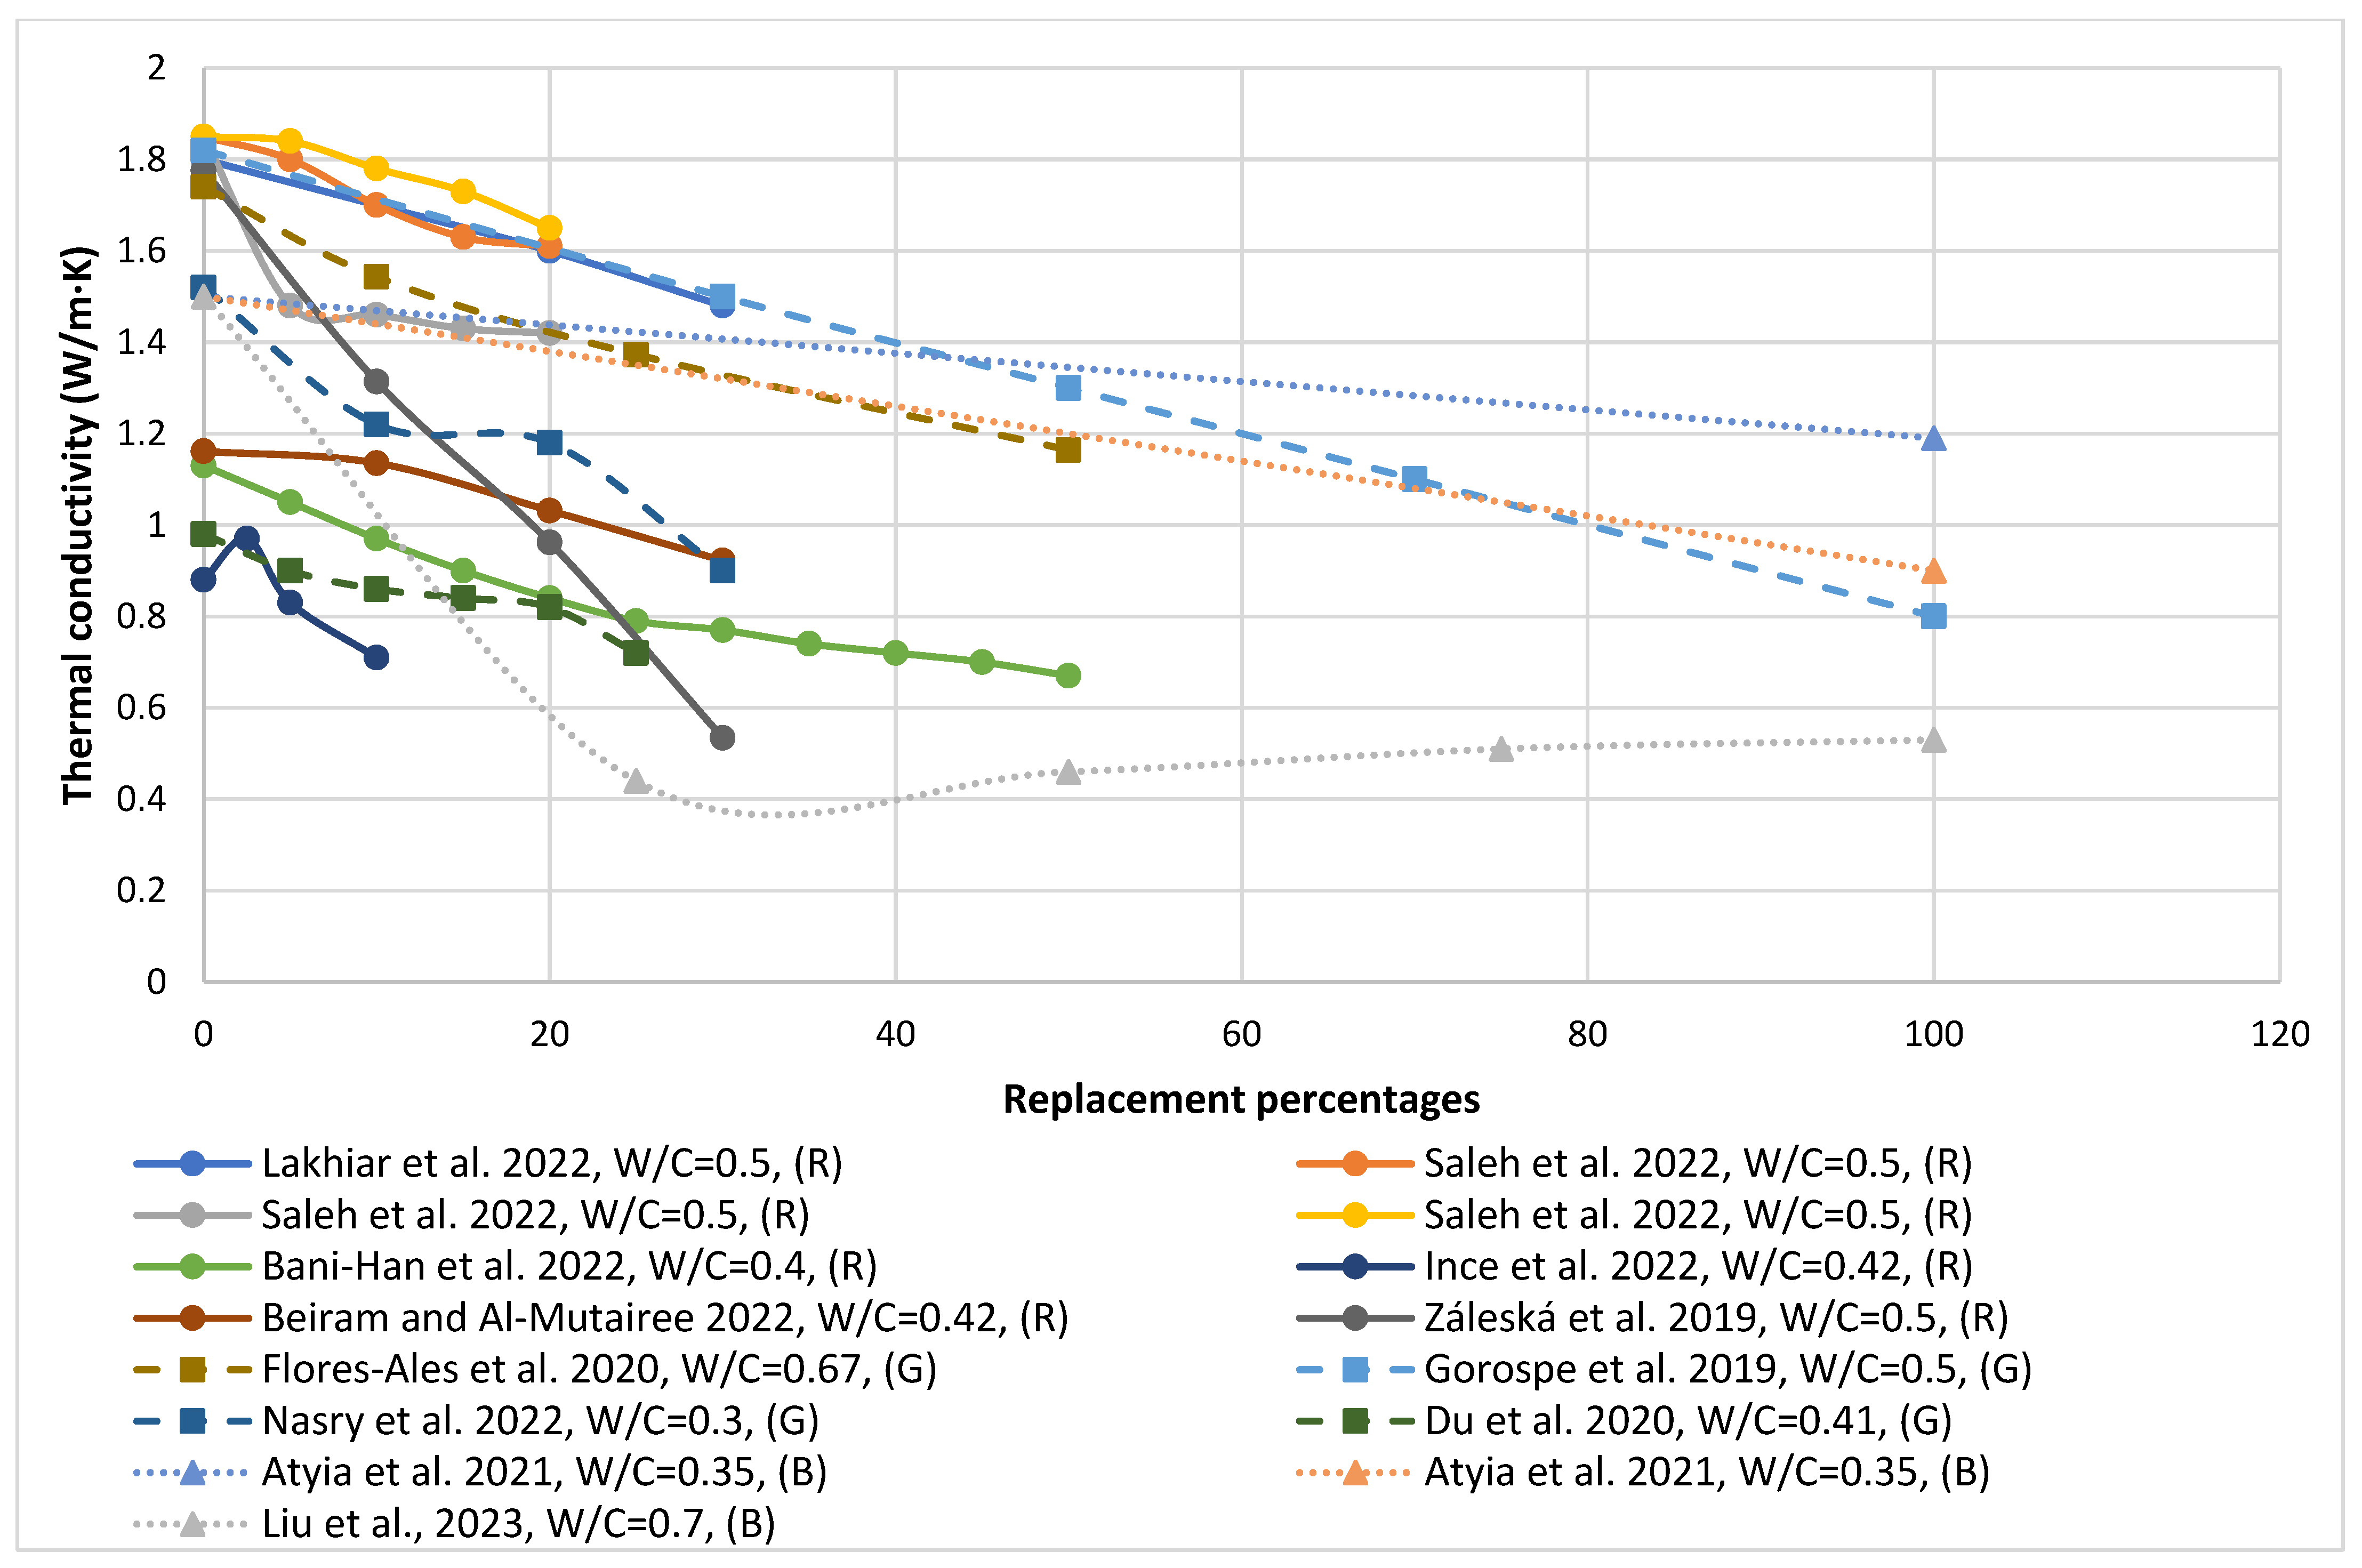
7.2. Thermal Conductivity
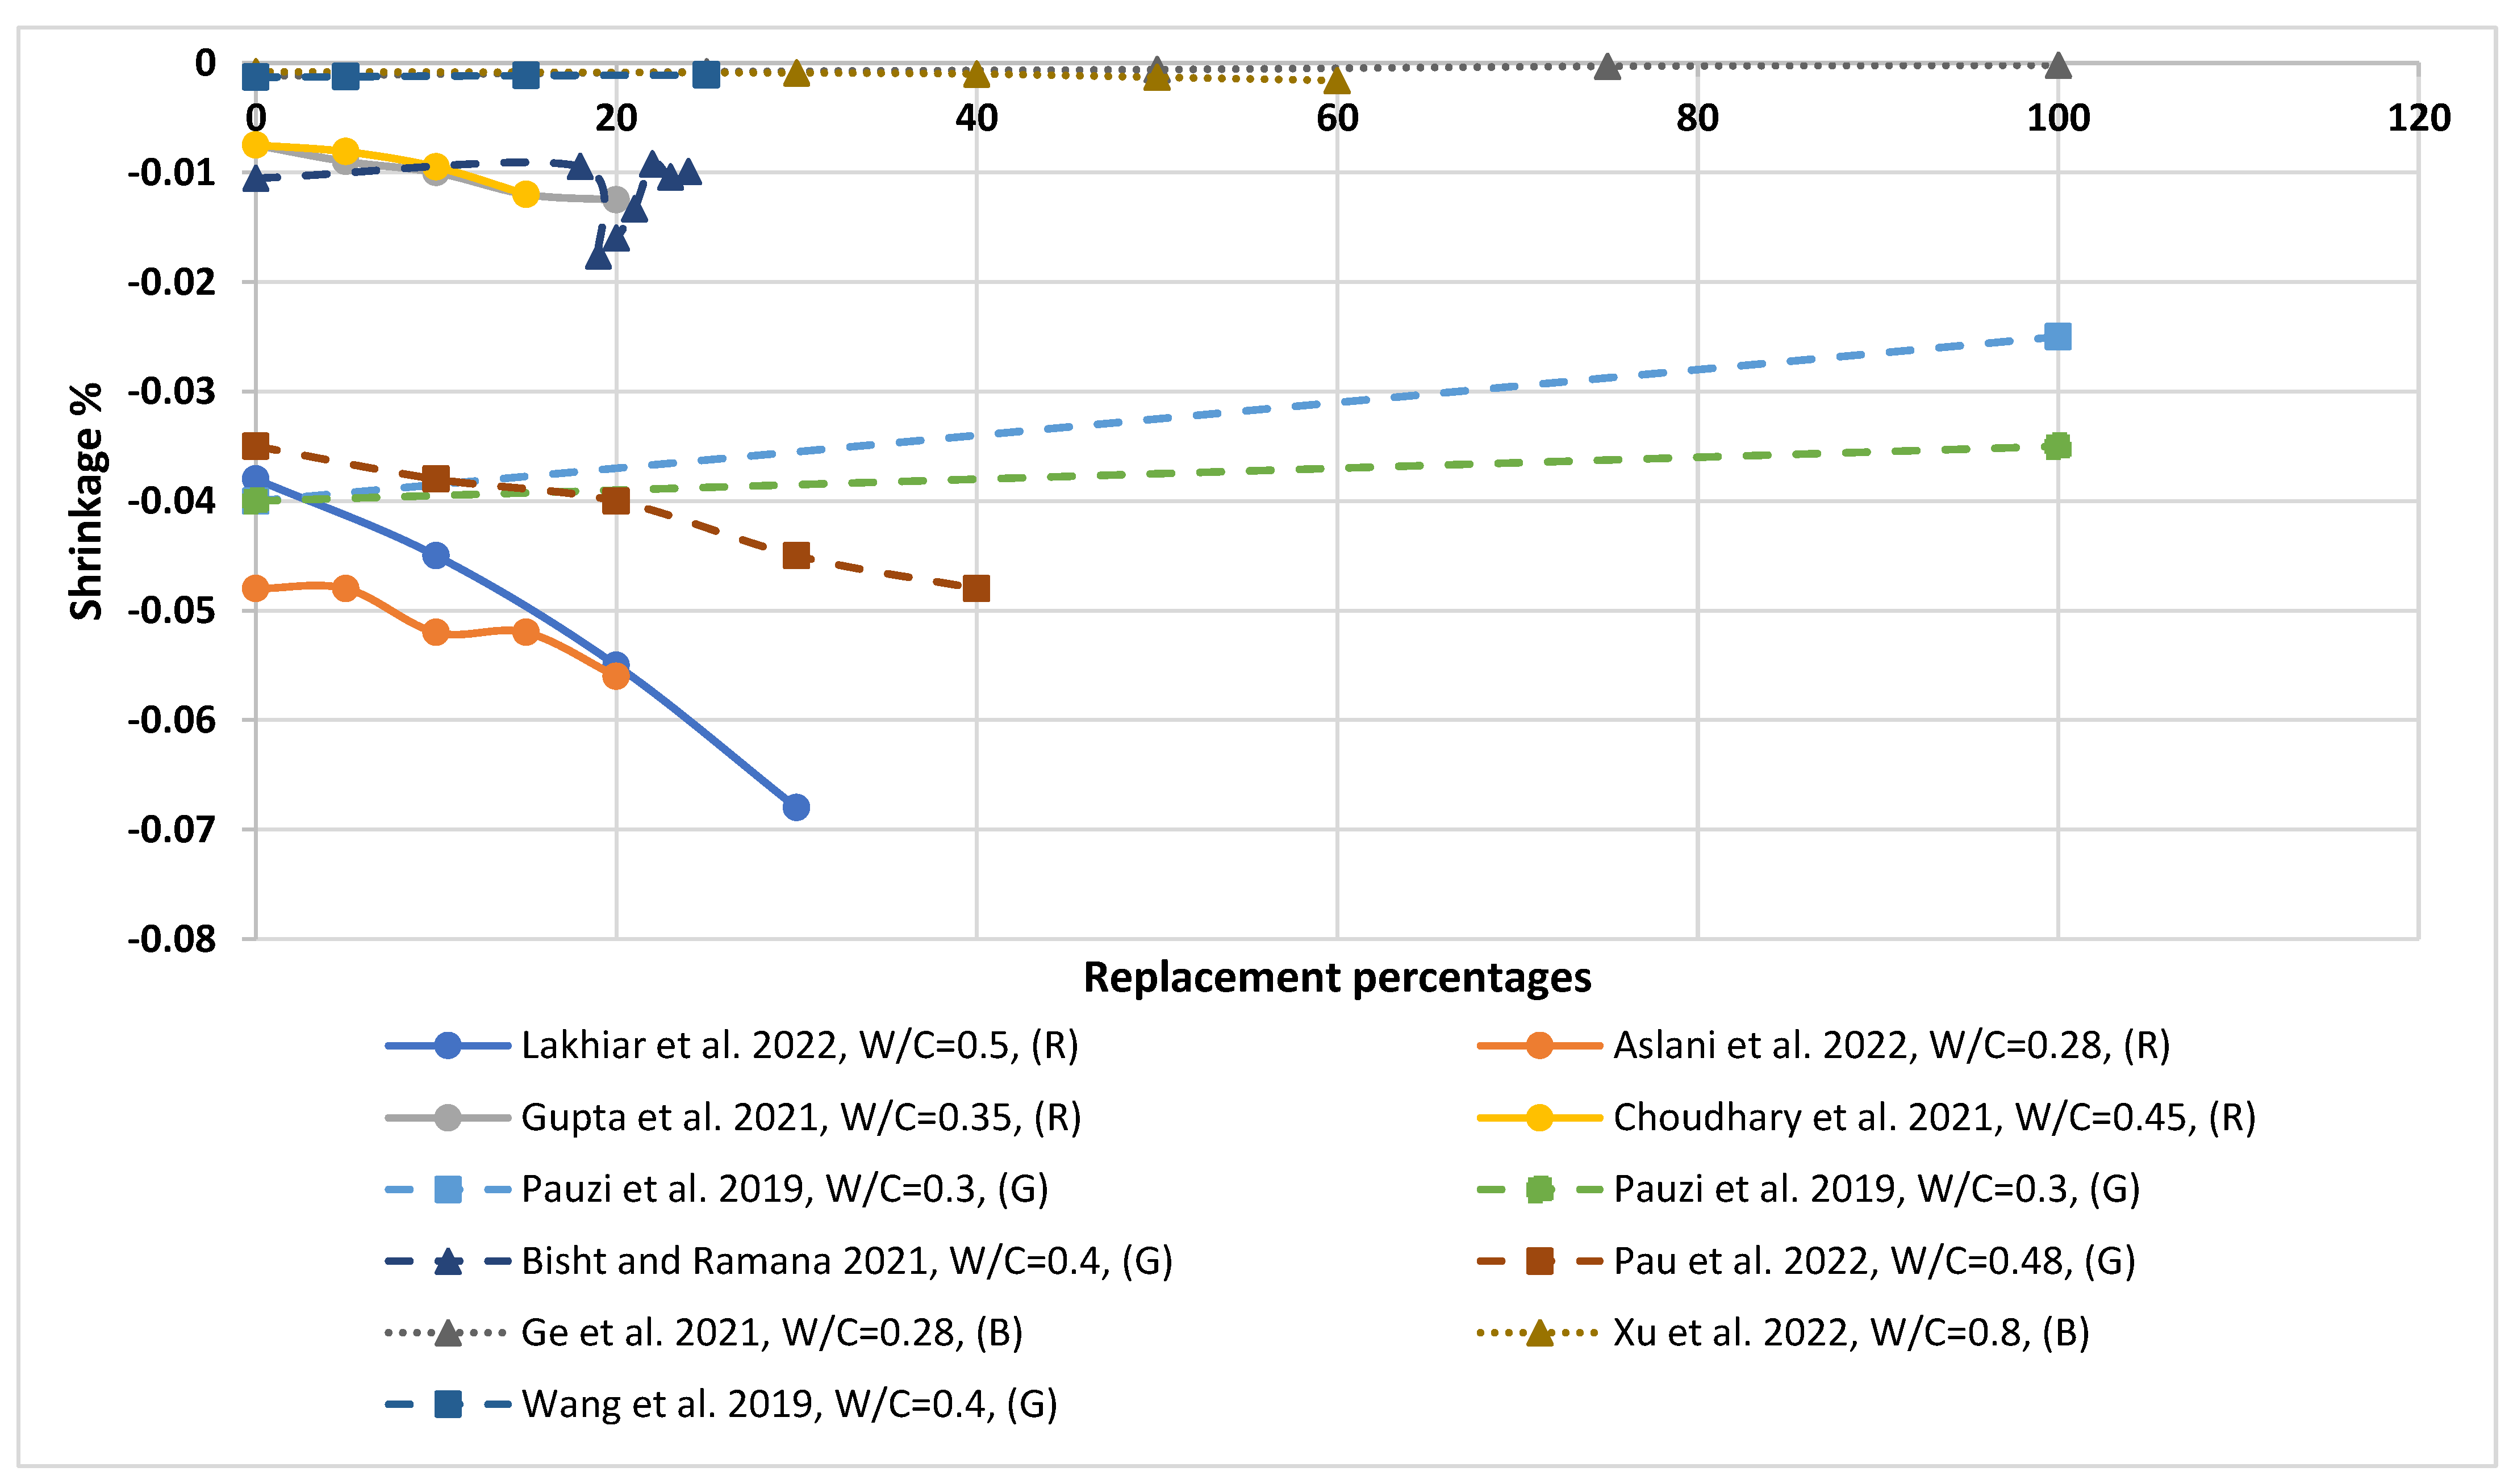
Thermal conductivity (k) is a characteristic of a substance that shows how well it conducts heat. If there is a temperature gradient in a solid medium, conduction will occur. Due to higher temperatures being connected with more molecular energy, conductive heat flow happens in the direction of declining temperatures [127]. Aliabdo et al. reported that the k-value of rubberized concrete decreased when rubber content increased due to the reduced density of produced concrete and the high porosity of rubber. The k-value of rubberized concrete was 0.96, 0.85, 0.73, 0.67, and 0.6 W/m °C when the rubber volume fraction was 20, 40, 60, 80, and 100%, respectively, while the k-value for the control specimen was 1.45 W/m °C [32]. Záleská et al. discovered that the k-value decreased when the amount of rubber increased due to an increase in air entrapment and porosity caused by non-wetting rubber particles during concrete preparation as well as the rubber’s poor thermal conductivity. The best thermal insulation was observed when coarse sand (4–8 mm) was replaced with coarse rubber with a percentage of 30% [26]. However, Yang et al. produced glass concrete by replacing fine aggregate (sand) with fine glass. The k-value of glass concrete decreased when the content of glass increased due to the lower thermal conductivity of glass, which ranged between 0.8 and 0.93 W/mK, compared to sand, which ranged between 1.83 and 2.90 W/mK [37]. Lu et al. produced pervious glass concrete by substituting crushed granite with a size < 5 mm with crushed glass in percentages of 25, 50, 75, and 100% by volume. The k-value decreased when crushed glass content increased due to the lower thermal conductivity of glass compared to natural granite aggregate [59].
However, Aliabdo et al. produced masonry blocks from crushed clay brick concrete by replacing sand, limestone, and both sand and limestone with fine, coarse, and both fine and coarse crushed clay brick, respectively. The authors discovered that using crushed clay brick in concrete masonry brick reduced the k-value because crushed clay brick had a lower unit weight than natural aggregate. The highest results in k-value were found in fine crushed clay masonry brick, and the lowest were found in mixes containing both fine and coarse crushed clay brick [67]. Ahmed et al. produced sustainable geopolymer concrete using clay brick powder as a replacement for metakaolin with percentages reaching 20% by weight and as a coarse aggregate in other mixes with percentages reaching 30% by volume. The k-value for the control mix was 1.5295 W/m·K, which was reduced to 0.8217 W/m·K when the content of clay brick powder was 20% and decreased to 0.7025 W/m·K when the clay brick was used as a coarse aggregate [128].
Figure 8 shows most of the recent scientific research conducted in 2019 in order to compare the thermal conductivity of rubberized, glass, and crushed clay brick cement-based concrete. In the figure, it is clear that rubberized concrete has the lowest thermal conductivity, followed by glass concrete and, finally, crushed clay brick concrete. Additionally, all waste concrete reduces thermal conductivity when the waste material content increases. This is due to the lower thermal conductivity of wastes compared to that of the cement mortar matrix and to the entrapped air, which increased with the waste content due to the poor connection of the cement mortar to the crumb rubber particles surface [129].

7.3. Shrinkage

Hunag et al. investigated the shrinkage behavior of rubberized concrete produced by substituting sand with rubber in percentages ranging from 10 to 40%. As the amount of rubber replacement increased, the drying shrinkage also increased. With a 40% replacement of rubber, the drying shrinkage increased by about 100% compared to normal concrete [50]. Si et al. generated rubberized self-consolidating concrete (RSCC) by replacing fine aggregate with treated crumb rubber in percentages of 15% and 25% by volume. The shrinkage of conventional SCC was greater than RSCC before 7 days due to RSCC reducing moisture loss in the mixture. The shrinkage of RSCC with 15% treated rubber was less than RSCC with untreated rubber and larger than control SCC by 2% after 28 days. The reason for this action was that NAOH-treated rubber reduced the porosity of RSCC [53]. However, Castro and Brito generated three mixes of glass concrete by replacing sand, gravel, and both sand and gravel with fine, coarse, and both fine and coarse glass in percentages of 5, 10, and 20%. In comparison to control concrete, mixes containing both fine and coarse glass exhibit proper shrinkage properties at replacement ratios greater than 5%. When replacement becomes 20%, the reduction in shrinkage becomes 5%. The reason is that mixes with both fine and coarse glass have good adhesion between the cement matrix and glass and have a low w/c ratio compared to the other mixes [58]. Pauzi et al. used cathode ray tube glass as a coarse aggregate (5 to 20 mm) to produce sustainable concrete. The drying shrinkage of the control specimen was 0.058% after 60 days of curing, which decreased to 0.05% when waste glass was involved in the mix [139]. Gorospe et al. generated glass mortar by replacing fine aggregate with glass with a particle size from 40 to 850 μm in percentages of 30%, 50%, 70%, and 100% by weight. The plastic shrinkage decreased when the glass content increased [130].
Bektas et al. produced recycled mortar by using crushed clay brick (CB) to replace sand in percentages of 10 and 20% by weight. The shrinkage of mortar containing 10% CB was the largest, while the shrinkage of mortar containing 20% CB was the lowest. The reason is that the brick particles absorb mixing water in their voids for a prolonged period of time, liberating them slowly as they age. Therefore, drying shrinkage was delayed since the hydration persisted due to the presence of interior moisture [68]. Dang et al. produced clay brick concrete by using CB to replace sand in percentages of 50 and 100% by volume. The drying shrinkage increased when the CB content increased due to the lower elastic modulus of CB. When additional water (AW) was introduced, drying shrinkage increased, but as AW grew, shrinkage decreased because CB can act as a store for internal curing water [66]. Vieira et al. generated crushed clay brick concrete by replacing fine aggregate with fine crushed red clay ceramic bricks (CRCB) in percentages of 20%, 50%, and 100% by volume. After 91 days, the shrinkage increased by 35%, 52%, and 101%, corresponding to 20%, 50%, and 100%, respectively [99].
Figure 9 shows most of the recent scientific research conducted in 2019 in order to compare the shrinkage of rubberized, glass, and crushed clay brick cement-based concrete. In the figure, it is clear that rubberized concrete has the highest shrinkage, followed by glass concrete, and finally, crushed clay brick concrete, which has the lowest shrinkage. Shrinkage of rubberized concrete increased as the rubber tire amount increased; in contrast, the shrinkage of glass concrete decreased as its amount increased. Shrinkage depended mainly on the characteristics of the wastes used. Due to poor adhesion between rubber and cement matrix, shrinkage increased; however, shrinkage decreased in glass content due to good adhesion between fine glass and cement matrix. According to crushed clay brick, more studies should be done to determine its effect on shrinkage.

8. Durability Properties of LWC Incorporating Lightweight Aggregate from Waste Materials
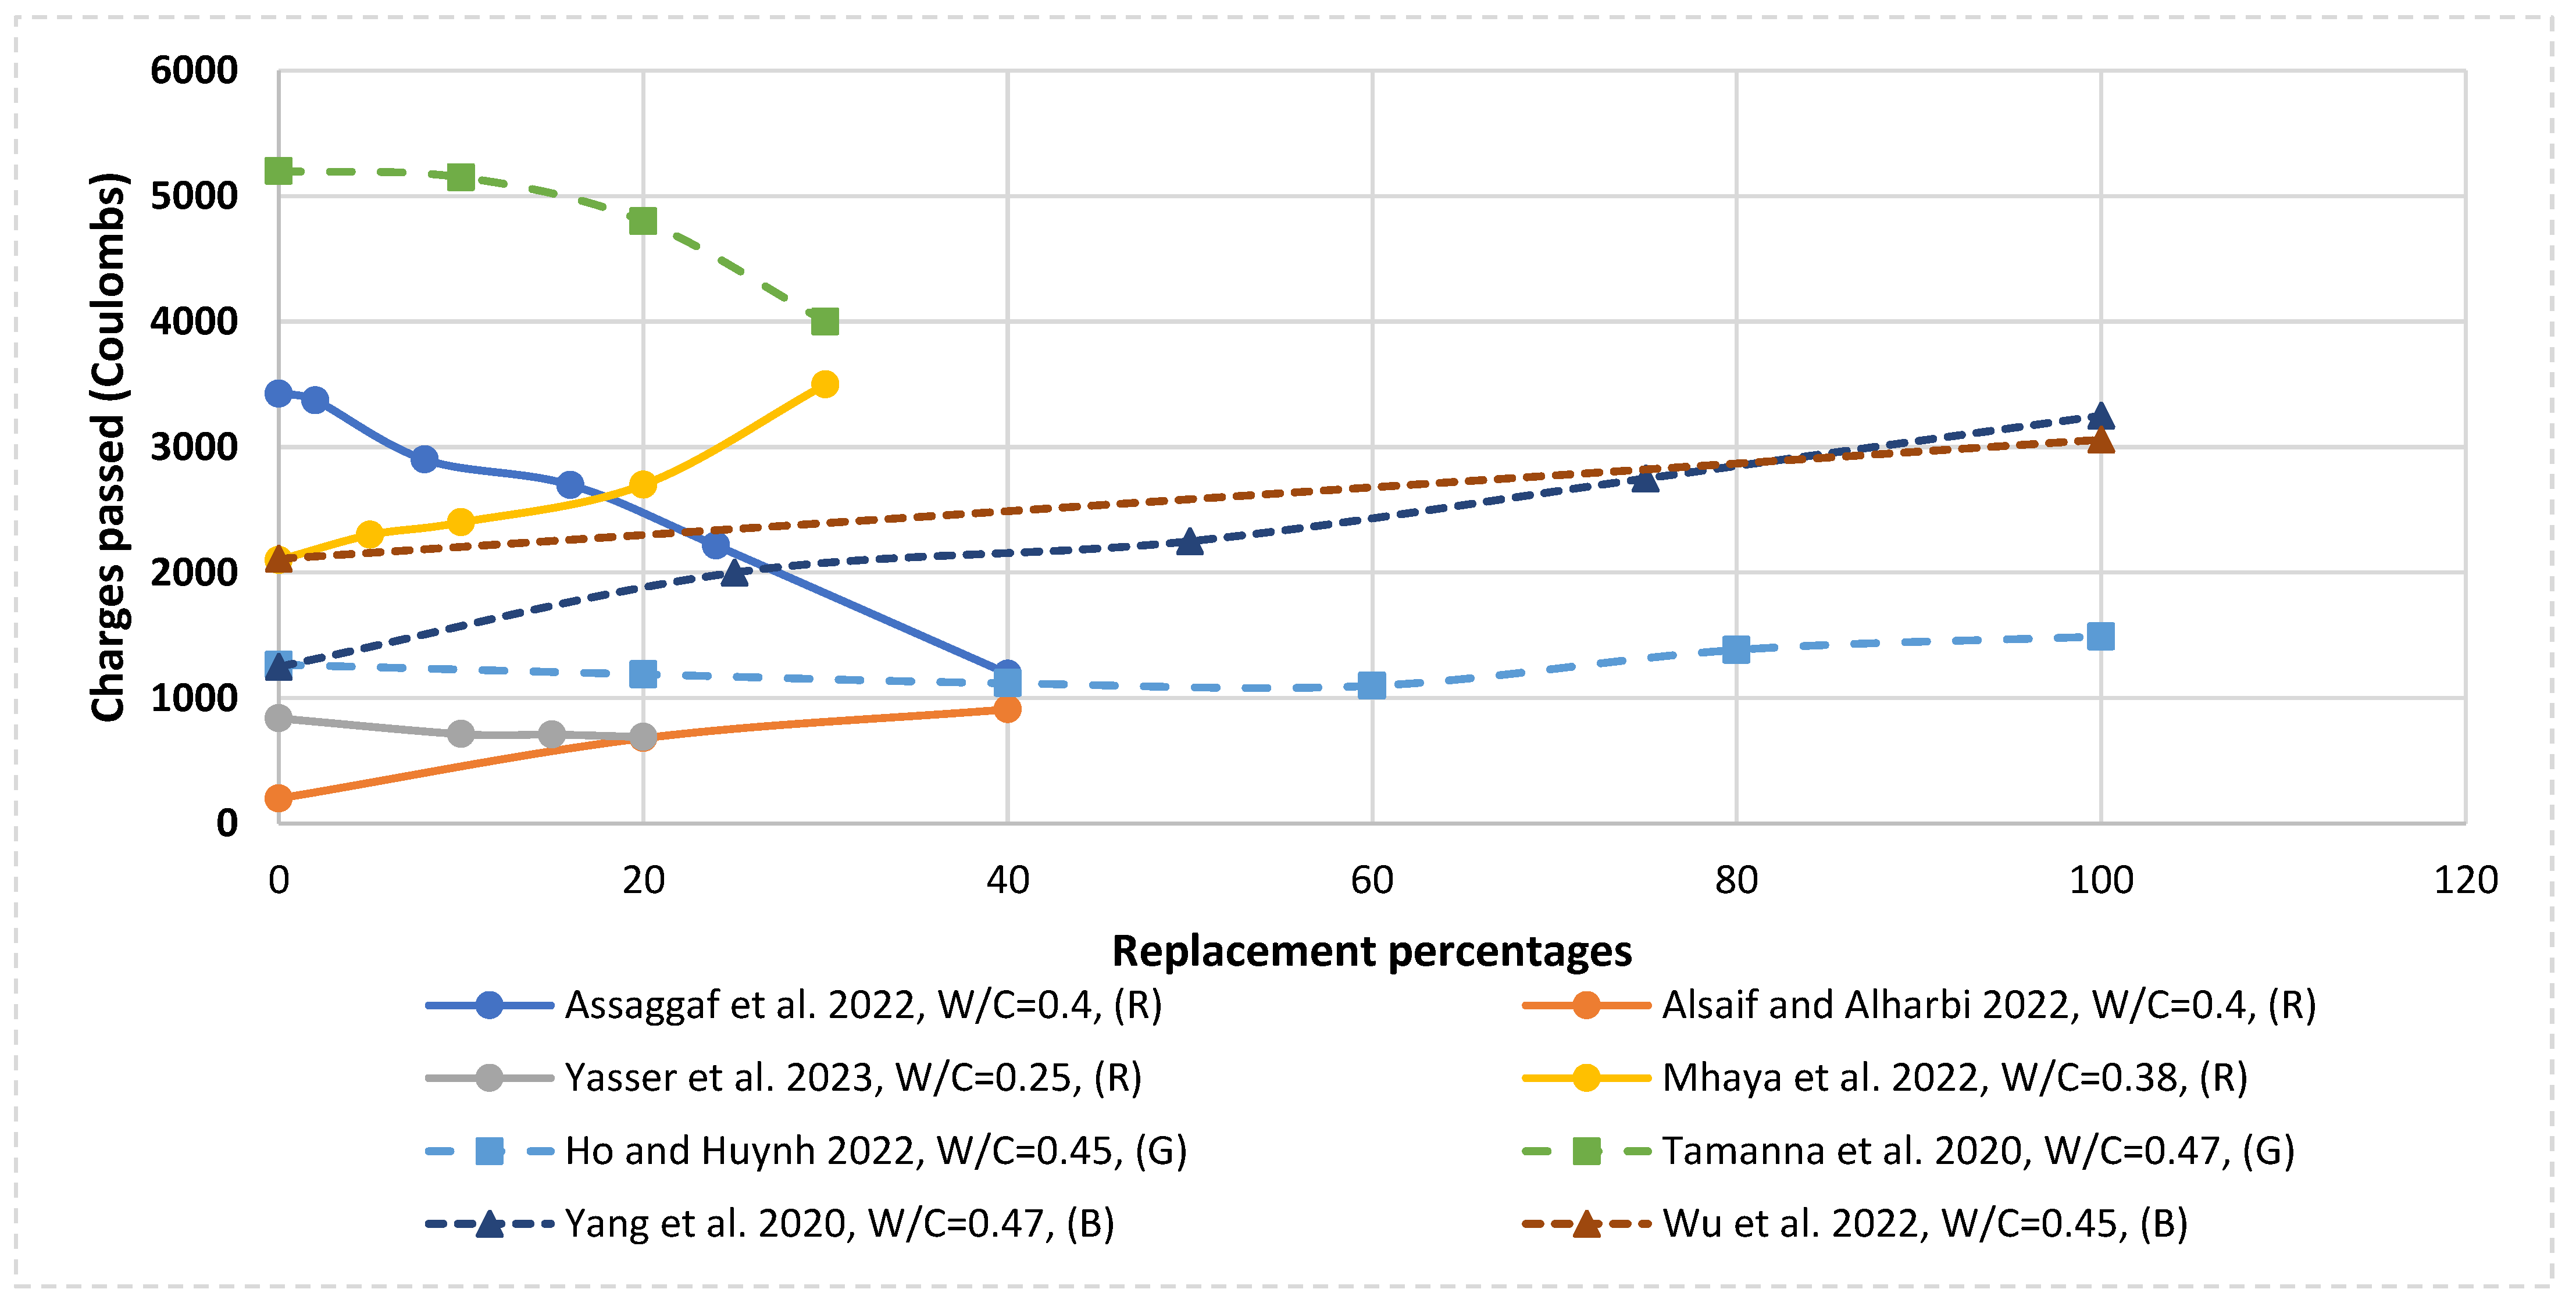
8.1. Permeability

The permeability of concrete is the main reason for harmful ions penetration into the concrete matrix. The permeability of any concrete matrix is reduced when the pore size is reduced. Hunag et al. generated rubberized concrete by substituting sand with rubber particles in percentages of 10, 20, 30, and 40%. The permeability ratio increased when rubber content increased up to 30% and decreased significantly when the rubber amount was over 30%. When rubber content was 40%, moisture began to seep away due to an overabundance of pores, so the permeability ratio could not be accurately determined [50]. Gesoǧlu et al. generated rubberized pervious concrete by replacing coarse aggregate with rubber in percentages of 5, 10, and 20% by volume. Three different sizes of rubber particles were used: 12.5, 4, and 1 mm. The permeability coefficient for the normal mix was 0.46 cm/s; however, it ranged between 0.15 and 0.35 cm/s for rubberized pervious concrete [21]. Luhar et al. generated rubberized geopolymer and rubberized traditional concrete by replacing fine aggregate with rubber fiber in percentages of 10, 20, and 30% by volume. The depth of water penetration increased as rubber content increased in both types of concrete [146]. From the above information, rubber tire increased permeability when its amount was increased in concrete.
However, Jiao et al. generated ultra-high-performance glass concretes by replacing fine aggregate with crushed glass in percentages of 25, 50, 75, and 100%. The fluidity increased when the replacement ratio of crushed glass increased [38]. Liu et al. produced glass concrete by replacing sand with glass < 1000 micrometers with replacement percentages of 25–100%. The authors measured flowability by conducting a special experiment with the mixes poured into a glass funnel and measuring the amount of mix coming out of this funnel. It was concluded that flow ability increased when the amount of glass increased due to the fact that the surface of glass is much smoother than that of river sand, thus reducing friction [147]. A. M. Aghabaglou et al. generated glass concrete by replacing fine aggregate (limestone) with crushed glass < 4 mm in replacement percentages of 15–60% by weight. The author found that the water penetration depth decreased as the amount of glass increased due to the lower water absorption of glass compared to limestone [148]. From the above research, it was concluded that water permeability increased as the glass content increased due to its smooth surface, which weakens the adhesion between glass and the cement matrix, except in the study done by A. M. Aghabaglou et al., in which glass replaced limestone, so its results were different due to the lower water absorption of glass compared to limestone.
Moreover, Zhang et al. generated clay brick concrete (WCBC) by replacing basalt with waste clay brick (CB) with a percentage equal to 30% by volume. The air permeability coefficient for normal concrete was 1.0 × 10⁻¹⁷ m2, which increased to 1.3 × 10⁻¹⁷ m2 for WCBC [42]. Ahmad et al. developed WCBC by replacing all-natural coarse stone with CB. The coefficient of permeability for WCBC was 350 to 400% higher than natural concrete [149]. M. M. Atyia et al. generated crushed clay brick concrete by replacing fine brick, coarse brick, or both with replacement percentages of 100%. The author found that when crushed clay brick replaced fully natural fine or coarse brick, the water penetration increased by a small value compared to the control. These water penetration values were 14.8 and 15 mm when the crushed clay bricks were fine and coarse, respectively, compared to the control, which was 9.8 mm. When both natural fine and coarse bricks are replaced by crushed clay bricks, the value becomes 33 mm. Due to the porous nature and high water absorption of crushed clay brick, water penetration increased when its content increased. Finally, the authors discussed the effect of crushed clay brick powder when it was used with partial replacement of cement in replacement percentages of 10–30%. The water penetration values were 34, 35, and 36 mm, corresponding to 10, 20, and 30%, respectively [95]. From the above information, crushed clay brick increased permeability when its amount was increased in concrete.
Figure 10 shows most of the recent scientific research conducted in 2019 in order to compare the chloride permeability of rubberized, glass, and crushed clay brick cement-based concrete. In the figure, it turns out that it is difficult at the present time to decide whether the wastes negatively or positively affect the chloride permeability due to the contradiction between the research, and their numbers are not sufficient as well.

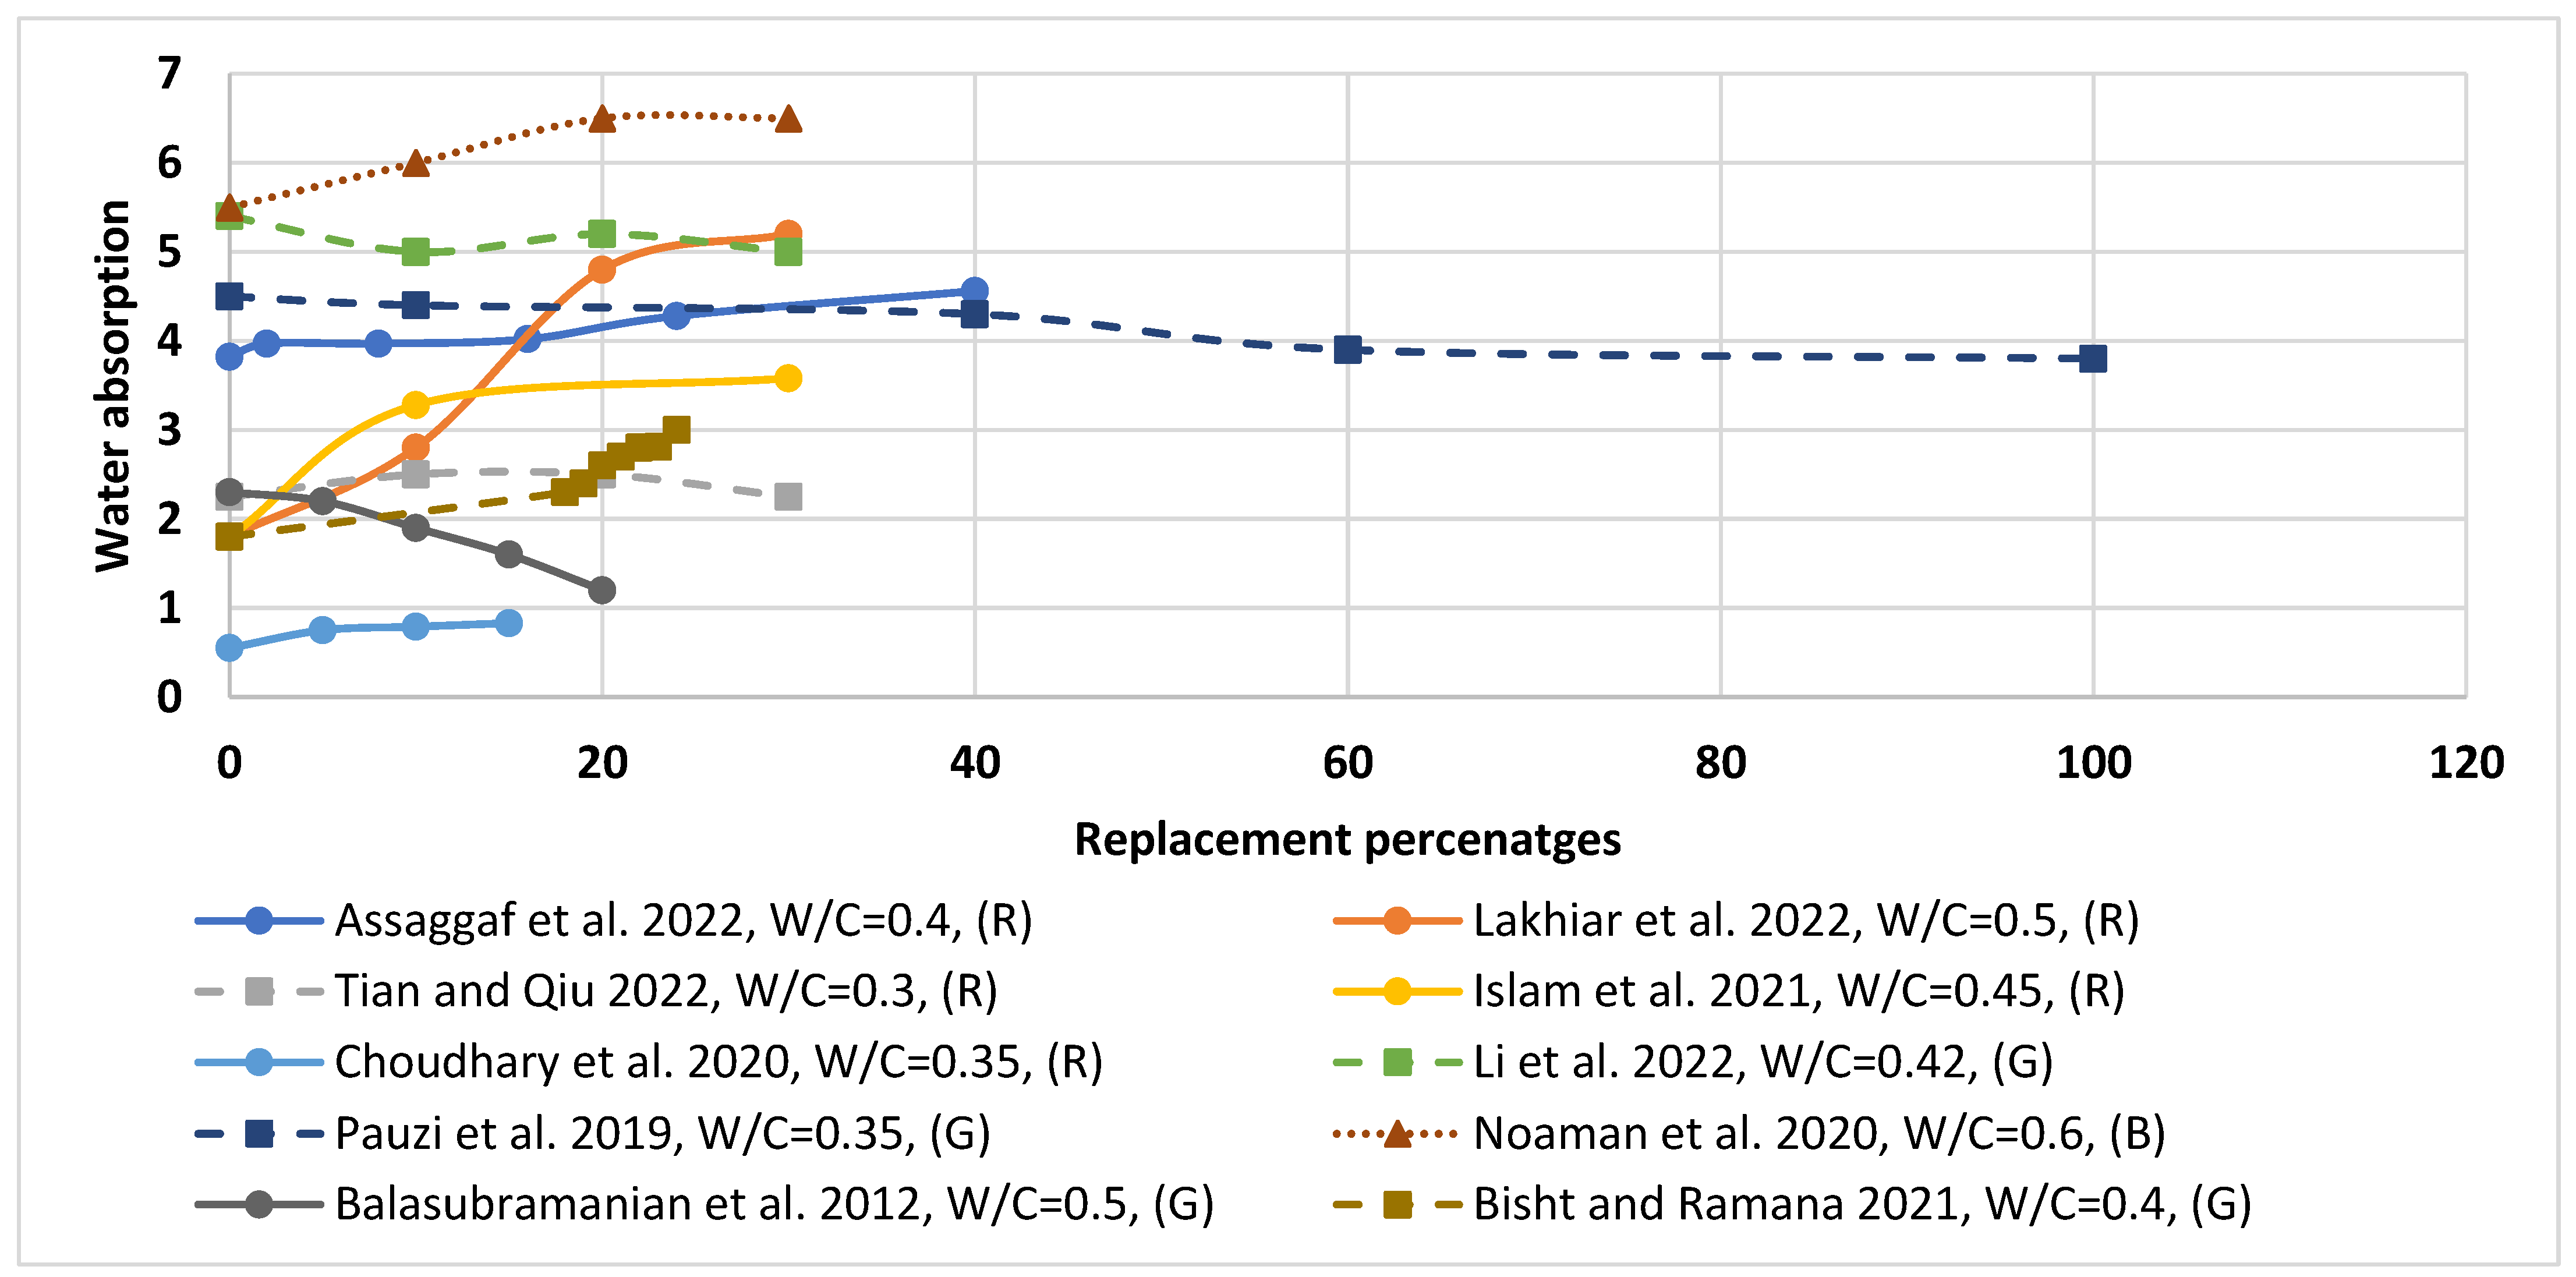
8.2. Water Absorption

Hunag et al. reported that the water absorption of rubberized concrete when sand was substituted with rubber particles in percentages of 10, 20, 30, and 40% by weight varied from 12.1% to 14.5%. The absorption rate increased when the rubber proportion increased [50]. Aliabdo et al. discovered that water absorption increased when replacement percentages of sand by rubber increased. The water absorption of rubberized concrete was 4.88, 5.2, 6.3, 6.89, and 7% for 20, 40, 60, 80, and 100% replacement percentages, respectively, while it was 3.62% for normal concrete [32]. Záleská et al. reported that the water absorption coefficient of rubberized concrete in which fine sand (<4 mm) was replaced with fine rubber in percentages of 10, 20, and 30% was 0.021, 0.019, and 0.021 kg·m−2 S−1/2, respectively. Meanwhile, it was 0.017, 0.019, and 0.018 kg·m−2 S−1/2 when coarse sand (4–8 mm) was replaced with coarse rubber. Rubberized concrete in which fine and coarse sand were substituted with fine and coarse rubber with 10 and 20% percentages was 0.021 and 0.018 kg·m−2 S−1/2. This is compared to conventional concrete, which has 0.02 kg·m−2 S−1/2. The moisture uptake of specimens with finer rubber particles (<4 mm) was faster than that of specimens with coarser rubber particles (4–6 mm) [26]. Zaldívar et al. found that an increase in rubber percentages in plaster mortar leads to an increase in the absorption coefficient via immersion or capillary action. The authors used three different sizes of rubber (0–0.6, 0.5–2.5, and 2.5–4.0 mm) to replace part of the plaster in the mortar at different percentages from 30% to 60%. The finest particle size had the highest values of water absorption coefficient via immersion or capillary action and the lowest observed in the medium particle size [51]. Thakur et al. generated rubberized lightweight bricks by replacing coarse sand with crumb rubber in percentages of 5, 10, 15, and 20% by volume. The water absorption for the control mix was 5.9% by mass, which increased to 6.2, 6.45, 6.66, and 6.8% when the rubber replacement percentages were 5, 10, 15, and 20%, respectively. Water absorption increased due to crumb rubber expansion, so micro-cracks developed in the concrete. Crumb rubber expands due to water absorption during the hydration process [54]. From the above information, it was found that water absorption increased when the amount of rubber increased due to weak adhesion between rubber and the cement matrix, whether fine or coarse rubber was used due to their same effect.
Castro and Brito generated three mixes of glass concrete by replacing sand, gravel, and both sand and gravel with fine, coarse, and both fine and coarse glass, respectively, with percentages of 5, 10, and 20% by volume. The reduction in water absorption by capillary action for glass concrete ranged from 9% to 18.4% for any size of glass aggregate (GA) up to 10% replacement ratios. There was a variation that ranged from −1.3% to 9% of water absorption by immersion for all mixes with GA compared to conventional concrete due to the GA’s limited water absorption. Mixes containing coarse GA had the lowest water absorption for all replacement ratios, whereas mixes containing fine GA had the highest values [58]. Balasubramanian et al. substituted sand with waste glass powder in percentages of 10, 20, and 30% by volume. The water absorption of concrete decreased when the replacement ratio increased. In comparison to the control specimen, the reduction in water absorption ranged from 4.3 to 48.0%. The reason for this reduction was that waste glass powder stops the continuity of micro-cracks in the concrete and prevents moisture and ion movement within the concrete [60]. Tahwia et al. generated glass concrete by replacing cement with glass powder in replacement percentages of 10–50%. The authors found that water absorption decreased as glass content increased due to its pozzolanic action that reduces pores [156].From the above information, it was found that water absorption decreased when the amount of glass increased due to the lower water absorption of glass, and the continuity of microcracks was stopped by glass. More research is required in the future to study the effect of size.
However, Zhang et al. generated clay brick concrete (WCBC) by replacing basalt with a max size of 20 mm with waste clay brick (CB) with a percentage of 30% by volume. The maximum water absorption per unit area for the control specimen was 1.2 kg/m2 and increased to 2.3 kg/m2 when basalt was replaced by CB. The reason for this was that CB absorbed more water than basalt [42]. Aliabdo et al. produced recycled masonry bricks using CB. The water absorption of concrete masonry bricks increased when the CB content increased due to the highly porous nature of CB [67]. Huang et al. generated clay brick mortar by substituting sand with CB in different percentages. CB was used in two states: dry and presoaked for 24 h. When sand was replaced with dry CB, water absorption declined in comparison to control mortar. However, water absorption increased when the replacement ratio of pre-soaked CB increased [69]. Vieira et al. generated WCBC by replacing fine aggregate with fine crushed red clay ceramic bricks (CRCB) in percentages of 20, 50, and 100% by volume. The water absorption increased when CRCB content increased, which reached 45% corresponding to 100% replacement [99]. Ge et al. generated WCBC using CB powder with three different size distributions (0.35–0.015, 0.3–0.004, and 0.2–0.001 mm). Every size of CB was used to substitute cement with percentages of 10, 20, and 30% by volume. As the immersion period, replacement level, and particle size increased, the absorbed water also increased due to the high porosity of CB [65]. From the above information, it was found that water absorption increased when the amount of crushed clay brick increased due to the higher water absorption of crushed clay brick. It was concluded that as the immersion period, replacement level, and particle size increased, the absorbed water also increased due to the high porosity of crushed clay brick.
Figure 11 shows most of the recent scientific research conducted in 2019 in order to compare the water absorption of rubberized, glass, and crushed clay brick cement-based concrete. In the figure, it is clear that clay brick concrete has the highest water absorption, followed by glass concrete, and finally, rubberized concrete, which has the lowest water absorption. Water absorption in glass concrete decreased as the glass content increased, in contrast to crushed clay brick and rubberized concrete. Glass concrete had the lowest absorption due to its pozzolanic reaction, which reduces pores, and the low water absorption of glass. Meanwhile, crushed clay brick concrete had the highest absorption due to the porous structure of crushed clay brick aggregate and its higher water absorption. Although rubber particles had a lower water absorption, rubberized concrete had a high water absorption due to weak adhesion between rubber tires and cement matrix, so more baths developed and facilitated the water bath.

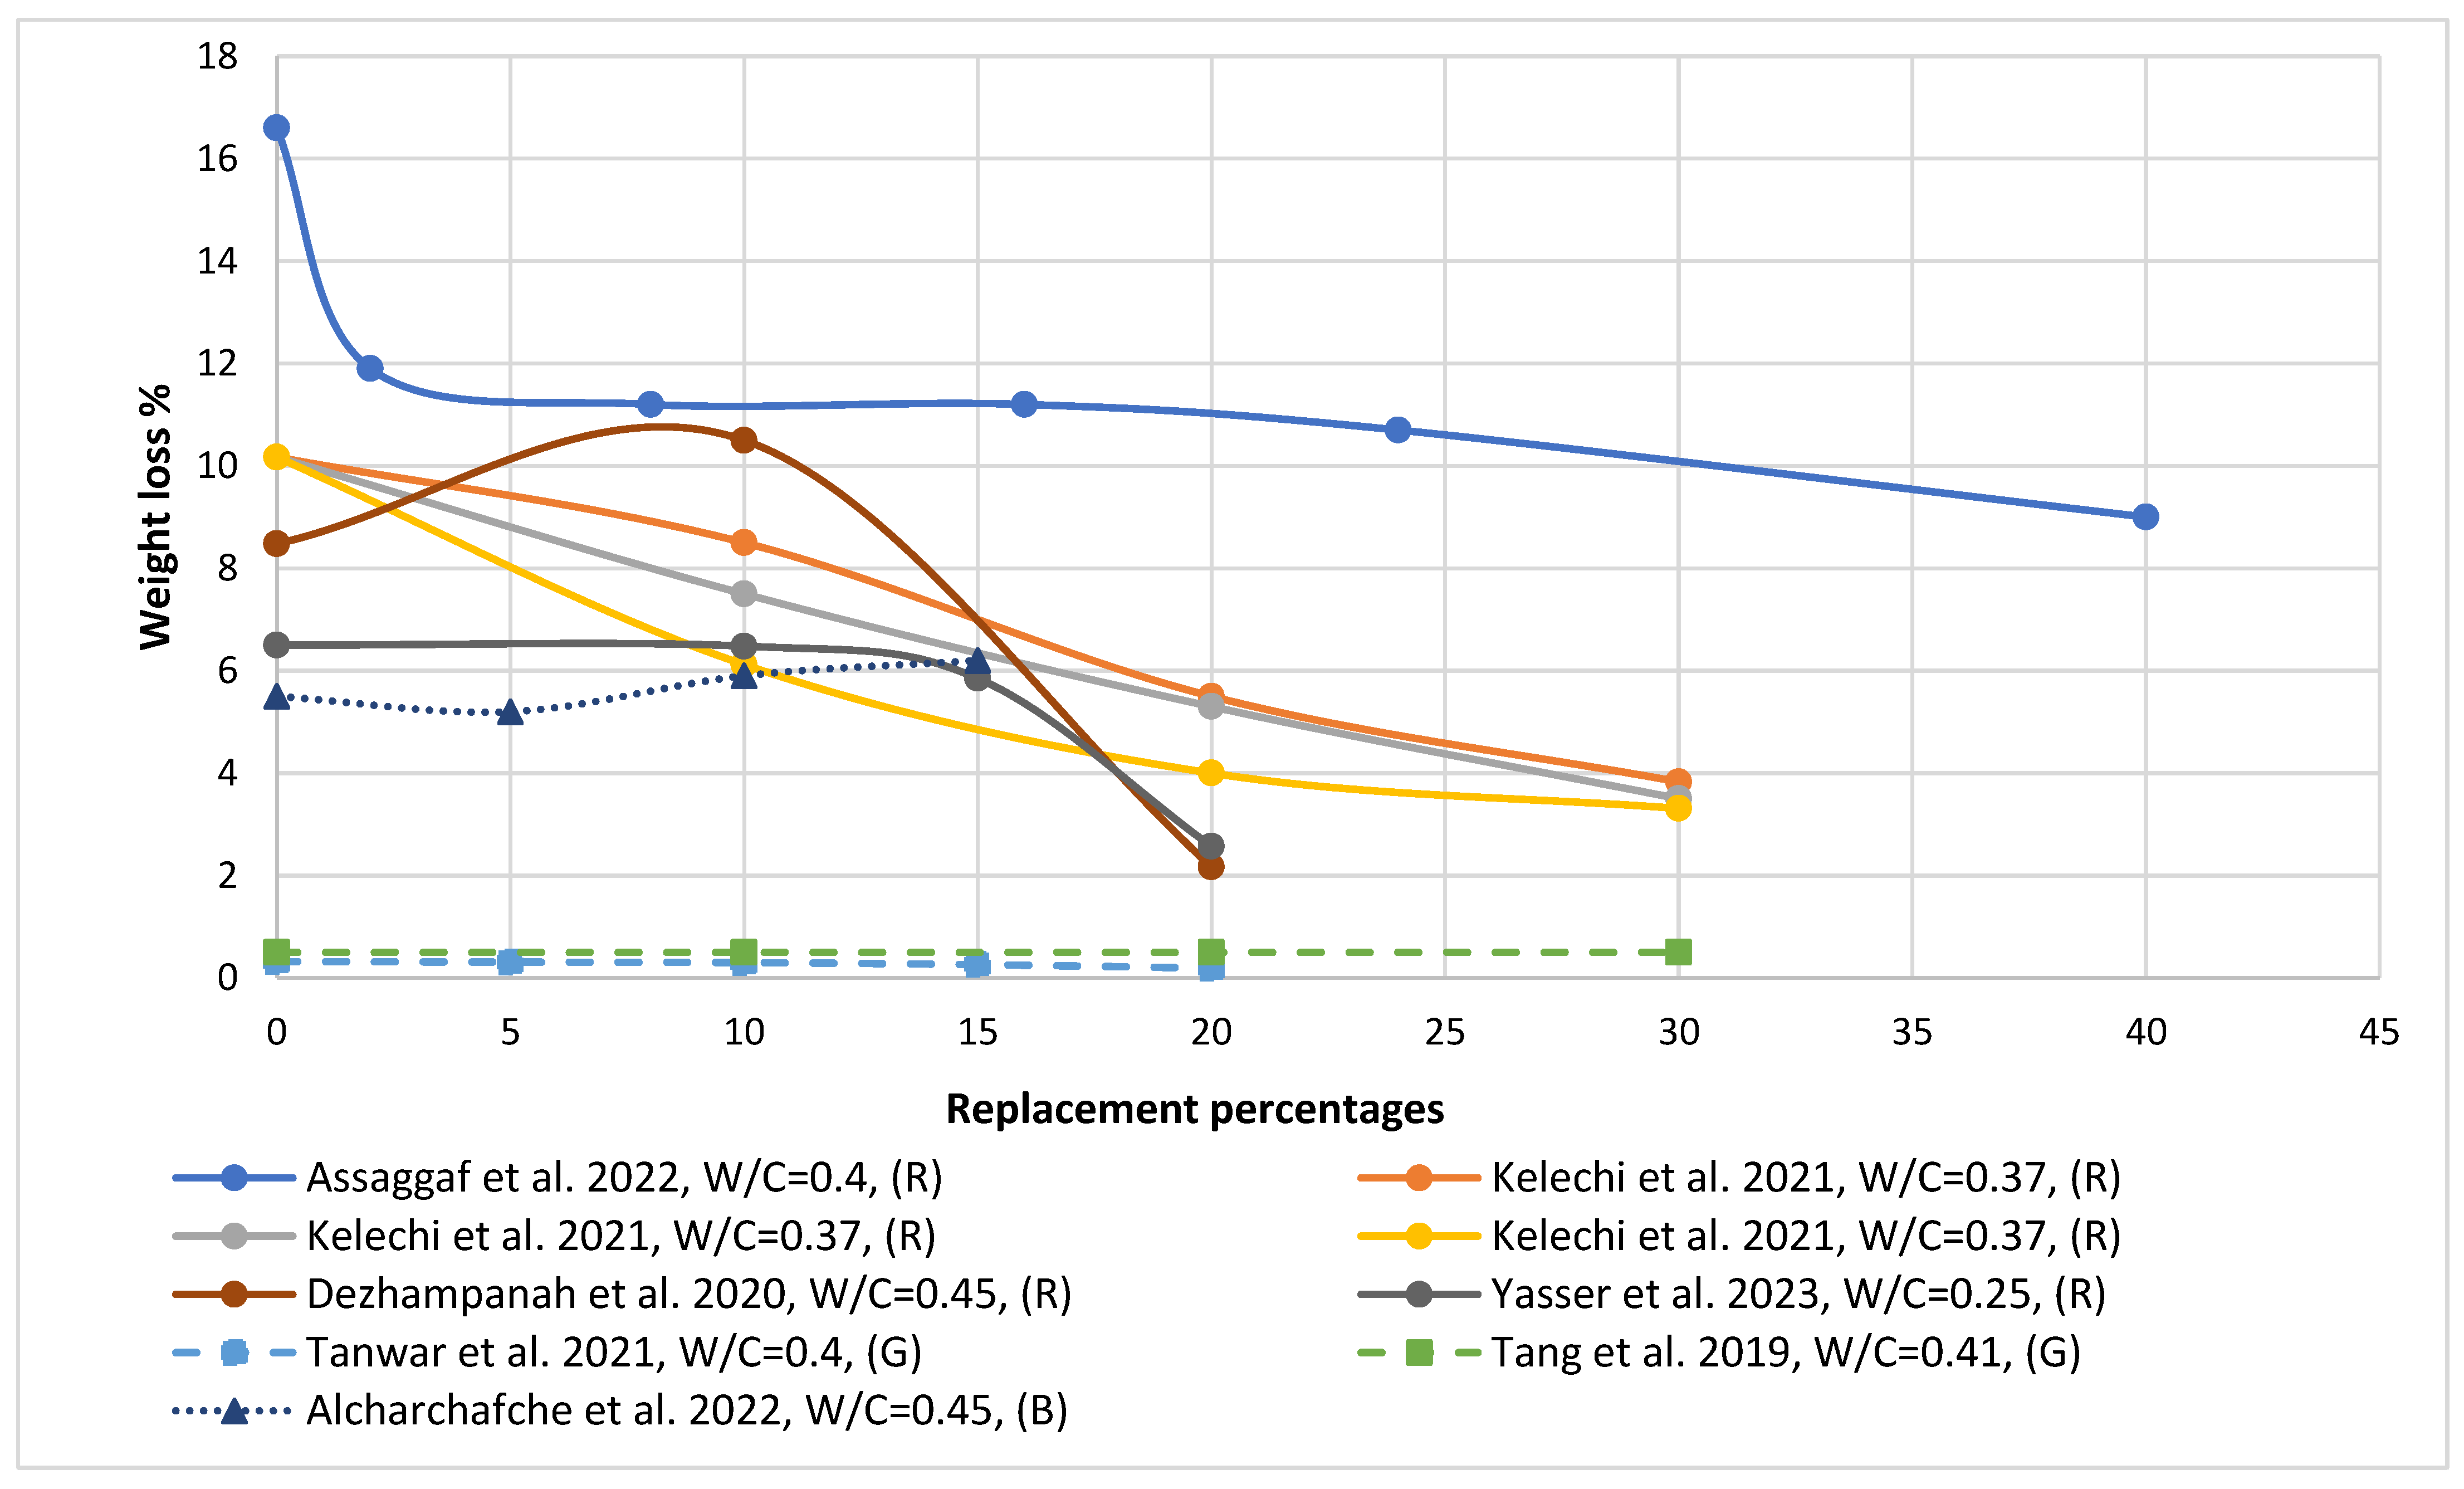
8.3. Sulfate Resistance

Hunag et al. generated rubberized concrete by substituting sand with rubber in percentages of 10, 20, 30, and 40%. The sulfate resistance increased as the rubber content increased. The weight loss percentage during the fifth cycle of the control specimen was 5.7%, while it was 4.3% when the replacement percentage was 40% [50]. Dezhampanah et al. utilized crumb rubber (CR) with a volumetric substitution of sand by 10 and 20%. This concrete was exposed to a sulfuric acid solution with a concentration of 5%. When the immersion period increased, the weight loss for all specimens increased. The weight loss of control specimens was 8.48 and 11.45% after 30 and 45 days of impression and increased to 10.5 and 13.58% when rubber was involved in mixes with a content of 10%. At the same time, the weight loss reached 2.17 and 9.6% for 30 and 45 days of impression when the rubber content was 20% [1]. While Matos and Coutinho generated glass mortar by partially substituting cementitious material with glass powder in percentages of 10% and 20% by weight. The results showed mixes containing 10% glass powder had proper resistance to sulfate compared to the control mix [161]. Aghabaglou et al. produced glass mortar by replacing fine aggregate limestone with fine glass in percentages of 25, 50, 75, and 100% by weight. The sulfate resistance of mortar increased as glass content increased [162].
Figure 12 shows most of the recent scientific research conducted in 2019 in order to compare the sulfate resistance of rubberized, glass, and crushed clay brick cement-based concrete. In the figure, it is clear that rubberized and glass concrete decrease weight loss when their contents increase. According to the author’s knowledge, there was a lack of information about crushed clay brick mixes; only through research did we find it, and it is unfair to depend on it in comparison.

9. Conclusions

This study offers advice for the user to choose the stated waste materials in the manufacture of concrete because they may be utilized as a source to partially replace natural aggregate or as cementitious materials, so it conserves natural resources in this process. The characteristics of sustainable lightweight concrete made from waste resources as a fractional replacement of aggregates, cement, etc., from previous research were summarized. The following are the significant annotations of the current review:
  • Utilizing waste as aggregate to substitute natural resources satisfies the need for decomposition.
  • Incorporating waste tire rubber in the mixture decreased its workability, while glass and fully or partially saturated crushed clay brick increased it.
  • The mechanical strength of sustainable lightweight concrete decreased as waste material amounts increased, except for finely ground clay brick and glass powder. This is due to the crushing index of the three waste materials being higher than natural aggregate and the weak bond between waste materials and cement paste. The compression strength of glass concrete increased when it was exposed to high temperatures. However, the compression strength of crushed clay brick concrete increased when crushed clay brick was used as a powder additive to cement.
  • The density of the sustainable concrete decreased as the rubber tire, crushed clay brick, and crushed glass content increased. The reduction in density reached 4, 21.7, and 31.7% when crushed glass, clay brick, and rubber tire were incorporated into the concrete, respectively. This reduction was related to the lower specific gravity of the waste materials used.
  • All the waste studied in this paper greatly reduces the thermal conductivity of the resulting concrete. The most effective in reducing thermal conductivity are rubber tires, followed by crushed glass, and finally, crushed clay bricks.
  • The highest shrinkage was found in rubberized concrete, and the lowest was found in crushed clay brick concrete due to its pozzolanic reaction. Additionally, water absorption in glass concrete decreased as the glass content increased, in contrast to crushed clay brick and rubberized concrete.

10. Recommendation

This report offers suggestions and ideas for further research even though previously published literature proved the likelihood of employing waste materials, such as rubber tires, crushed clay brick, and crushed glass, in concrete: (1) Future studies or reviews should analyze or summarize the hybrid synergy of using two or three waste materials in the same concrete. (2) It is necessary to research the economic and environmental effects of utilizing waste materials. (3) More engineering and durability characteristics need to be assessed, including tests for toughness and sulfate resistance as well as chloride permeability. (4) It is necessary to research the results of mixing waste materials with additional cementitious materials. (5) Researching and evaluating the impact of subjecting waste concrete to thermal and fire testing needs to be completed. (6) Researching and evaluating waste materials’ impact on SCC and mixtures of high and ultra-high strengths is also prudent. (7) More sophisticated characterization methods, such as thermogravimetric analysis (TGA) and Fourier transform infrared spectroscopy (FT-IR), are required to comprehend the reaction kinetics of waste materials. (9) Provide future researchers with the opportunity to enhance concrete made from waste resources in the building sector. (10) It is also important to examine the impact of incorporating these wastes into structural element components.

Funding

This research received no external funding.

Institutional Review Board Statement

Not applicable.

Informed Consent Statement

Not applicable.

Data Availability Statement

No new data were created.

Conflicts of Interest

The authors declare no conflict of interest.

References

  1. Dezhampanah, S.; Nikbin, I.M.; Charkhtab, S.; Fakhimi, F.; Bazkiaei, S.M.; Mohebbi, R. Environmental performance and durability of concrete incorporating waste tire rubber and steel fiber subjected to acid attack. J. Clean. Prod. 2020, 268, 122216. [Google Scholar] [CrossRef]
  2. Mousa, A.; Mahgoub, M.; Hussein, M. Lightweight concrete in America: Presence and challenges. Sustain. Prod. Consum. 2018, 15, 131–144. [Google Scholar] [CrossRef]
  3. ACI Committee 213. ACI 213R-87 Guide for Structural Lightweight Aggregate Concrete; American Concrete Institute: Farmington Hills, MI, USA, 2015. [Google Scholar]
  4. Fediuk, R.; Amran, M.; Vatin, N.; Vasilev, Y.; Lesovik, V.; Ozbakkaloglu, T. Acoustic Properties of Innovative Concretes: A Review. Materials 2021, 14, 398. [Google Scholar] [CrossRef] [PubMed]
  5. Agrawal, Y.; Gupta, T.; Sharma, R.; Panwar, N.L.; Siddique, S. A comprehensive review on the performance of structural lightweight aggregate concrete for sustainable construction. Constr. Mater. 2021, 1, 39–62. [Google Scholar] [CrossRef]
  6. Tajra, F.; Elrahman, M.A.; Stephan, D. The production and properties of cold-bonded aggregate and its applications in concrete: A review. Constr. Build. Mater. 2019, 225, 29–43. [Google Scholar] [CrossRef]
  7. EN 206-1; European Standard, Concrete—Part 1: Specification, Performance, Production and Conformity. 2001. Available online: https://standards.iteh.ai/catalog/standards/cen/af40b93d-23eb-43ae-8880-d6b6c9088325/en-206-1-2000 (accessed on 10 May 2023).
  8. Chandra, S.; Berntsson, L. Lightweight Aggregate Concrete; Elsevier: Amsterdam, The Netherlands, 2002. [Google Scholar]
  9. Lee, C.T. Preparation of spherical foamed body with function of media for waste water treatment by using waste LCD glass. J. Ind. Eng. Chem. 2014, 20, 3089–3095. [Google Scholar] [CrossRef]
  10. Bs EN 13055; E. C. for Standardization. European Committee for Standardization: Brussels, Belgium, 2003; pp. 1–20.
  11. Jiang, T.; Cui, K.; Chang, J. Development of low-carbon cement: Carbonation of compounded C2S by β-C2S and γ-C2S. Cem. Concr. Compos. 2023, 139, 105071. [Google Scholar] [CrossRef]
  12. Roychand, R.; Gravina, R.J.; Zhuge, Y.; Ma, X.; Mills, J.E.; Youssf, O. Practical Rubber Pre-Treatment Approch for Concrete Use—An Experimental Study. J. Compos. Sci. 2021, 5, 143. [Google Scholar] [CrossRef]
  13. Sienkiewicz, M.; Kucinska-Lipka, J.; Janik, H.; Balas, A. Progress in used tiresmanagement in the European Union: A review. Waste Manag. 2012, 32, 1742–1751. [Google Scholar] [CrossRef]
  14. Thomas, B.S.; Gupta, R.C.; Panicker, V.J. Recycling of waste tire rubber as aggregate in concrete: Durability-related performance. J. Clean. Prod. 2016, 112, 504–513. [Google Scholar] [CrossRef]
  15. Li, N.; Long, G.; Ma, C.; Fu, Q.; Zeng, X.; Ma, K.; Xie, Y.; Luo, B. Properties of self-compacting concrete (SCC) with recycled tire rubber aggregate: A comprehensive study. J. Clean. Prod. 2019, 236, 117707. [Google Scholar] [CrossRef]
  16. World Business Council for Sustainable Development, Managing End-Of-Life Tires. 2008. Available online: https://www.wbcsd.org/Sector-Projects/Tire-Industry-Project/Resources/Managing-End-of-Life-Tires (accessed on 2 August 2020).
  17. Medina, N.F.; Garcia, R.; Hajirasouliha, I.; Pilakoutas, K.; Guadagnini, M.; Raffoul, S. Composites with recycled rubber aggregates: Properties and opportunities in construction. Constr. Build. Mater. 2018, 188, 884–897. [Google Scholar] [CrossRef]
  18. Aslani, F.; Kelin, J. Assessment and development of high-performance fibre-reinforced lightweight self-compacting concrete including recycled crumb rubber aggregates exposed to elevated temperatures. J. Clean. Prod. 2018, 200, 1009–1025. [Google Scholar] [CrossRef]
  19. Copetti, C.M.; Borges, P.M.; Squiavon, J.Z.; da Silva, S.R.; de Oliveira Andrade, J.J. Evaluation of tire rubber surface pre-treatment and silica fume on physical-mechanical behavior and microstructural properties of concrete. J. Clean. Prod. 2020, 256, 120670. [Google Scholar] [CrossRef]
  20. Miller, N.M.; Tehrani, F.M. Mechanical properties of rubberized lightweight aggregate concrete. Constr. Build. Mater. 2017, 147, 264–271. [Google Scholar] [CrossRef]
  21. Gesoğlu, M.; Güneyisi, E.; Khoshnaw, G.; Ipek, S. Investigating properties of pervious concretes containing waste tire rubbers. Constr. Build. Mater. 2014, 63, 206–213. [Google Scholar] [CrossRef]
  22. Rajan, R.G.; Sakthieswaran, N.; Babu, O.G. Materials Today: Proceedings Experimental investigation of sustainable concrete by partial replacement of fine aggregate with treated waste tyre rubber by acidic nature. Mater. Today Proc. 2020, 37, 1019–1022. [Google Scholar] [CrossRef]
  23. Yasser, N.; Abdelrahman, A.; Kohail, M.; Moustafa, A. Experimental investigation of durability properties of rubberized concrete. Ain Shams Eng. J. 2023, 14, 102111. [Google Scholar] [CrossRef]
  24. Zhang, B.; Poon, C.S. Sound insulation properties of rubberized lightweight aggregate concrete. J. Clean. Prod. 2018, 172, 3176–3185. [Google Scholar] [CrossRef]
  25. Wu, Y.F.; Kazmi, S.M.S.; Munir, M.J.; Zhou, Y.; Xing, F. Effect of compression casting method on the compressive strength, elastic modulus and microstructure of rubber concrete. J. Clean. Prod. 2020, 264, 121746. [Google Scholar] [CrossRef]
  26. Záleská, M.; Pavlík, Z.; Čítek, D.; Jankovský, O.; Pavlíková, M. Eco-friendly concrete with scrap-tire-rubber-based aggregate–Properties and thermal stability. Constr. Build. Mater. 2019, 225, 709–722. [Google Scholar] [CrossRef]
  27. Huang, W.; Huang, X.; Xing, Q.; Zhou, Z. Strength reduction factor of crumb rubber as fine aggregate replacement in concrete. J. Build. Eng. 2020, 32, 101346. [Google Scholar] [CrossRef]
  28. Dhivya, K.; Priyadharshini, K. Experimental study on strength properties of concrete with partial replacement of coarse aggregate by rubber tyre waste. Mater. Today Proc. 2022, 52, 1930–1934. [Google Scholar] [CrossRef]
  29. Habib, A.; Yildirim, U.; Eren, O. Mechanical and dynamic properties of high strength concrete with well graded coarse and fine tire rubber. Constr. Build. Mater. 2020, 246, 118502. [Google Scholar] [CrossRef]
  30. Zhang, B.; Feng, Y.; Xie, J.; Lai, D.; Yu, T.; Huang, D. Rubberized geopolymer concrete: Dependence of mechanical properties and freeze-thaw resistance on replacement ratio of crumb rubber. Constr. Build. Mater. 2021, 310, 125248. [Google Scholar] [CrossRef]
  31. Siddique, R.; Naik, T.R. Properties of concrete containing scrap-tire rubber—An overview. Waste Manag. 2004, 24, 563–569. [Google Scholar] [CrossRef]
  32. Aliabdo, A.A.; Elmoaty, A.E.M.A.; AbdElbaset, M.M. Utilization of waste rubber in non-structural applications. Constr. Build. Mater. 2015, 91, 195–207. [Google Scholar] [CrossRef]
  33. Substantial Environmental Benefits from Mechanical Tire Recycling into Infill for Artificial Turf Pitches Are Demonstrated by New LCA Study. 2020. Available online: https://erec.info/substantial-environmental-benefits-from-mechanical-tyre-recycling-into-infill-for-artificial-turf-pitches-are-demonstrated-by-new-lca-study/ (accessed on 24 June 2020).
  34. Choudhary, S.; Chaudhary, S.; Jain, A.; Gupta, R. Assessment of effect of rubber tire fiber on functionally graded concrete. Mater. Today Proc. 2020, 28, 1496–1502. [Google Scholar] [CrossRef]
  35. Chylík, R.; Trtík, T.; Fládr, J.; Bílý, P. Mechanical properties and durability of crumb rubber concrete. IOP Conf. Ser. Mater. Sci. Eng. 2017, 236, 012093. [Google Scholar] [CrossRef]
  36. GHD. Packaging Stewardship Forum, Australian Food and Grocery Council the Use of Crushed Glass as Both an Aggregate Substitute in Road Base and in Asphalt in Australia. 2008. Available online: https://higherlogicdownload.s3.amazonaws.com/IPWEA/c7e19de0-08d5-47b7-ac3f-c198b11cd969/UploadedImages/Glass%20Reccling/081104%20ghd%20crushed%20glass%20final%20report%5B1%5D.pdf (accessed on 10 May 2023).
  37. Yang, S.; Cui, H.; Poon, C.S. Comparison of the mechanically compacted dry-mix and ordinary vibrated wet-mix glass concretes after exposure to elevated temperatures. Cem. Concr. Compos. 2020, 114, 103720. [Google Scholar] [CrossRef]
  38. Jiao, Y.; Zhang, Y.; Guo, M.; Zhang, L.; Ning, H.; Liu, S. Mechanical and fracture properties of ultra-high performance concrete (UHPC) containing waste glass sand as partial replacement material. J. Clean. Prod. 2002, 277, 123501. [Google Scholar] [CrossRef]
  39. The European Container Glass Federation, 2018. Glass Containers. Available online: https://feve.org/glass_recycling_stats_2018 (accessed on 1 December 2020).
  40. Arulrajah, A.; Piratheepan, J.; Disfani, M.M.; Bo, M.W. Geotechnical and geoenvironmental properties of recycled construction and demolition materials in pavement subbase applications. J. Mater. Civ. Eng. 2013, 25, 1077–1088. [Google Scholar] [CrossRef]
  41. Paktiawal, A.; Alam, M. A study of age effect through NDT and crushing strength of concrete with different industrial wastes under loading and unloading conditions. Mater. Today Proc. 2021, 46, 8686–8693. [Google Scholar] [CrossRef]
  42. Zhang, S.; He, P.; Niu, L. Mechanical properties and permeability of fiber-reinforced concrete with recycled aggregate made from waste clay brick. J. Clean. Prod. 2020, 268, 121690. [Google Scholar] [CrossRef]
  43. Zhao, Y.; Gao, J.; Chen, F.; Liu, C.; Chen, X. Utilization of waste clay bricks as coarse and fine aggregates for the preparation of lightweight aggregate concrete. J. Clean. Prod. 2018, 201, 706–715. [Google Scholar] [CrossRef]
  44. Yang, D.; Liu, M.; Ma, Z. Properties of the foam concrete containing waste brick powder derived from construction and demolition waste. J. Build. Eng. 2020, 32, 101509. [Google Scholar] [CrossRef]
  45. EPA. Construction and Demolition Debris Management in the United States, Environmental Protection Agency (EPA), USA. 2020; pp. 1–24. Available online: https://www.epa.gov/sites/default/files/2020-03/documents/final_cd-eol-management_2015_508.pdf (accessed on 10 May 2023).
  46. Li, L.G.; Lin, Z.H.; Chen, G.M.; Kwan, A.K.H. Reutilizing clay brick dust as paste substitution to produce environment-friendly durable mortar. J. Clean. Prod. 2020, 274, 122787. [Google Scholar] [CrossRef]
  47. Akinyele, J.O.; Igba, U.T.; Ayorinde, T.O.; Jimoh, P.O. Case Studies in Construction Materials Structural efficiency of burnt clay bricks containing waste crushed glass and polypropylene granules. Case Stud. Constr. Mater. 2002, 13, e00404. [Google Scholar] [CrossRef]
  48. Kallel, A.; Ellouze, M.; Trabelsi, I. Co-management of landfill leachate concentrate with brick waste by solidification/stabilization treatment. Arab. J. Geosci. 2017, 10, 81. [Google Scholar] [CrossRef]
  49. Zuo, J.; Zhao, Z.-Y. Green building research–current status and future agenda: A review. Renew. Sustain. Energy Rev. 2014, 30, 271–281. [Google Scholar] [CrossRef]
  50. Hunag, L.J.; Wang, H.Y.; Wu, Y.W. Properties of the mechanical in controlled low-strength rubber lightweight aggregate concrete (CLSRLC). Constr. Build. Mater. 2016, 112, 1054–1058. [Google Scholar] [CrossRef]
  51. López-Zaldívar, O.; Lozano-Díez, R.; Herrero del Cura, S.; Mayor-Lobo, P.; Hernández-Olivares, F. Effects of water absorption on the microstructure of plaster with end-of-life tire rubber mortars. Constr. Build. Mater. 2017, 150, 558–567. [Google Scholar] [CrossRef]
  52. Raffoul, S.; Garcia, R.; Escolano-margarit, D.; Guadagnini, M.; Hajirasouliha, I. Behaviour of unconfined and FRP-confined rubberised concrete in axial compression. Constr. Build. Mater. 2017, 147, 388–397. [Google Scholar] [CrossRef]
  53. Si, R.; Wang, J.; Guo, S.; Dai, Q.; Han, S. Evaluation of laboratory performance of self-consolidating concrete with recycled tire rubber. J. Clean. Prod. 2018, 180, 823–831. [Google Scholar] [CrossRef]
  54. Thakur, A.; Senthil, K.; Sharma, R.; Singh, A.P. Employment of crumb rubber tire in concrete masonry bricks. Mater. Today Proc. 2020, 32, 553–559. [Google Scholar] [CrossRef]
  55. Al Rawahi, Z.; Waris, M.B. Use of recycled tires in non-structural concrete. MATEC Web Conf. 2017, 120, 03002. [Google Scholar] [CrossRef]
  56. Najim, K.B.; Hall, M.R. Mechanical and dynamic properties of self-compacting crumb rubber modified concrete. Constr. Build. Mater. 2012, 27, 521–530. [Google Scholar] [CrossRef]
  57. Topçu, I.B.; Canbaz, M. Properties of concrete containing waste glass. Cem. Concr. Res. 2004, 34, 267–274. [Google Scholar] [CrossRef]
  58. De Castro, S.; De Brito, J. Evaluation of the durability of concrete made with crushed glass aggregates. J. Clean. Prod. 2013, 41, 7–14. [Google Scholar] [CrossRef]
  59. Lu, J.X.; Yan, X.; He, P.; Poon, C.S. Sustainable design of pervious concrete using waste glass and recycled concrete aggregate. J. Clean. Prod. 2019, 234, 1102–1112. [Google Scholar] [CrossRef]
  60. Balasubramanian, B.; Krishna, G.G.; Saraswathy, V.; Srinivasan, K. Experimental investigation on concrete partially replaced with waste glass powder and waste E-plastic. Constr. Build. Mater. 2012, 278, 122400. [Google Scholar] [CrossRef]
  61. Arivalagan, S.; Sethuraman, V. Experimental study on the mechanical properties of concrete by partial replacement of glass powder as fine aggregate: An environmental friendly approach. Mater. Today Proc. 2020, 45, 6035–6041. [Google Scholar] [CrossRef]
  62. Dang, J.; Zhao, J.; Hu, W.; Du, Z.; Gao, D. Properties of mortar with waste clay bricks as fine aggregate. Constr. Build. Mater. 2018, 166, 898–907. [Google Scholar] [CrossRef]
  63. Hoque, M.M.; Islam, M.N.; Islam, M.; Kader, M.A. Bond behavior of reinforcing bars embedded in concrete made with crushed clay bricks as coarse aggregates. Constr. Build. Mater. 2002, 244, 118364. [Google Scholar] [CrossRef]
  64. Dang, J.; Zhao, J. Influence of waste clay bricks as fine aggregate on the mechanical and microstructural properties of concrete. Constr. Build. Mater. 2019, 228, 116757. [Google Scholar] [CrossRef]
  65. Ge, Z.; Wang, Y.; Sun, R.; Wu, X.; Guan, Y. Influence of ground waste clay brick on properties of fresh and hardened concrete. Constr. Build. Mater. 2015, 98, 128–136. [Google Scholar] [CrossRef]
  66. Dang, J.; Zhao, J.; Pang, S.D.; Zhao, S. Durability and microstructural properties of concrete with recycled brick as fine aggregates. Constr. Build. Mater. 2020, 262, 120032. [Google Scholar] [CrossRef]
  67. Aliabdo, A.A.; Abd-Elmoaty, A.-E.M.; Hassan, H.H. Utilization of crushed clay brick in concrete industry. Alex. Eng. J. 2014, 53, 151–168. [Google Scholar] [CrossRef] [Green Version]
  68. Bektas, F.; Wang, K.; Ceylan, H. Effects of crushed clay brick aggregate on mortar durability. Constr. Build. Mater. 2009, 23, 1909–1914. [Google Scholar] [CrossRef]
  69. Huang, Q.; Zhu, X.; Xiong, G.; Wang, C.; Liu, D.; Zhao, L. Recycling of crushed waste clay brick as aggregates in cement mortars: An approach from macro- and micro-scale investigation. Constr. Build. Mater. 2021, 274, 122068. [Google Scholar] [CrossRef]
  70. Helmy, S.H.; Tahwia, A.M.; Mahdy, M.G.; Elrahman, M.A. Development and characterization of sustainable concrete incorporating a high volume of industrial waste materials. Constr. Build. Mater. 2023, 365, 130160. [Google Scholar] [CrossRef]
  71. Youssf, O.; Hassanli, R.; Mills, J.E.; Zhuge, Y. Axial Compression Behaviour of Hybrid Double-Skin Tubular Columns Filled with Rubcrete. J. Compos. Sci. 2019, 3, 62. [Google Scholar] [CrossRef] [Green Version]
  72. Eldin, N.N.; Senouci, A.B. Measurement and Prediction of the Strength of Rubberized Concrete. Cem. Concr. Compos. 1994, 16, 287–298. [Google Scholar] [CrossRef]
  73. Siringi, G.M. Properties of Concrete with Tire Derived Aggregate and Crumb Rubber as a Lightweight Substitute for Mineral Aggregates in the Concrete Mix. Ph.D. Thesis, The University of Texas at Arlington, Arlington, TX, USA, 2012. [Google Scholar]
  74. Sukontasukkul, P.; Tiamlom, K. Expansion under water and drying shrinkage of rubberized concrete mixed with crumb rubber with different size. Constr. Build. Mater. 2012, 29, 520–526. [Google Scholar] [CrossRef]
  75. Srivastava, S.; Rao, A.K.; Zain, M.; Kumar, R. Utilization of waste rubber fiber considering modification in strength reduction factor and its effect on the behavior of concrete. Mater. Today Proc. 2020, 21, 1489–1495. [Google Scholar] [CrossRef]
  76. Yang, S.; Ling, T.C.; Cui, H.; Poon, C.S. Influence of particle size of glass aggregates on the high temperature properties of dry-mix concrete blocks. Constr. Build. Mater. 2019, 209, 522–531. [Google Scholar] [CrossRef]
  77. Zhao, Y.; Gao, J.; Liu, C.; Chen, X.; Xu, Z. The particle-size effect of waste clay brick powder on its pozzolanic activity and properties of blended cement. J. Clean. Prod. 2020, 242, 118521. [Google Scholar] [CrossRef]
  78. ASTM D792; Standard Test Methods for Density and Specific Gravity (Relative Density) of Plastics by Displacement. ASTM International: Conshohocken, PA, USA, 2008.
  79. Terro, M.J. Properties of concrete made with recycled crushed glass at elevated temperatures. Build. Environ. 2006, 41, 633–639. [Google Scholar] [CrossRef]
  80. Swilam, A.; Tahwia, A.M.; Youssf, O. Effect of Rubber Heat Treatment on Rubberized-Concrete Mechanical Performance. J. Compos. Sci. 2022, 6, 290. [Google Scholar] [CrossRef]
  81. Youssf, O.; Mills, J.E.; Hassanli, R. Assessment of the mechanical performance of crumb rubber concrete. Constr. Build. Mater. 2016, 125, 175–183. [Google Scholar] [CrossRef]
  82. Hussein, Y.M.; Abd Elrahman, M.; Elsakhawy, Y.; Tayeh, B.A.; Tahwia, A.M. Development and performance of sustainable structural lightweight concrete containing waste clay bricks. J. Mater. Res. Technol. 2022, 21, 4344–4359. [Google Scholar] [CrossRef]
  83. Mohammed, T.J.; Breesem, K.M. Enhancement of the Shear-flexural Strength of the Rubberized Concrete Prism Beam by External Reinforcement. Int. J. Eng. Trans. B Appl. 2022, 35, 1017–1023. [Google Scholar] [CrossRef]
  84. Sidhu, A.S.; Siddique, R. Durability assessment of sustainable metakaolin based high strength concrete incorporating crumb tire rubber. J. Build. Eng. 2023, 72, 106660. [Google Scholar] [CrossRef]
  85. Chaturvedy, G.K.; Pandey, U.K.; Kumar, H. Effect of graphene oxide on the microscopic, physical and mechanical characteristics of rubberized concrete. Innov. Infrastruct. Solut. 2023, 8, 163. [Google Scholar] [CrossRef]
  86. Islam, M.M.U.; Roychand, J.; Li, R.; Saberian, M. Investigation of durability properties for structural lightweight concrete with discarded vehicle tire rubbers: A study for the complete replacement of conventional coarse aggregates. Constr. Build. Mater. 2023, 369, 130634. [Google Scholar] [CrossRef]
  87. Olofinnade, O.; Ogara, J. Workability, strength, and microstructure of high strength sustainable concrete incorporating recycled clay brick aggregate and calcined clay. Clean. Eng. Technol. 2021, 3, 100123. [Google Scholar] [CrossRef]
  88. Shahzad, K.; Zhao, Z. Experimental study of NaOH pretreated crumb rubber as substitute of fine aggregate in concrete. Constr. Build. Mater. 2020, 358, 129448. [Google Scholar] [CrossRef]
  89. Lakhiar, M.T.; Kong, S.Y.; Bai, Y.; Susilawati, S.; Zahidi, I.; Paul, S.C.; Raghunandan, M.E. Thermal and Mechanical Properties of Concrete Incorporating Silica Fume and Waste Rubber Powder. Polymers 2022, 14, 4858. [Google Scholar] [CrossRef] [PubMed]
  90. Eisa, A.S.; Elshazli, M.T.; Nawar, M.T. Experimental investigation on the effect of using crumb rubber and steel fibers on the structural behavior of reinforced concrete beams. Constr. Build. Mater. 2020, 252, 119078. [Google Scholar] [CrossRef]
  91. Paul, D.; Bindhu, K.R.; Matos, A.M.; Delgado, J. Eco-friendly concrete with waste glass powder: A sustainable and circular solution. Constr. Build. Mater. 2022, 355, 129217. [Google Scholar] [CrossRef]
  92. Steyn, Z.; Babafemi, A.; Fataar, H.; Combrinck, R. Concrete containing waste recycled glass, plastic and rubber as sand replacement. Constr. Build. Mater. 2020, 269, 121242. [Google Scholar] [CrossRef]
  93. Gerges, N.N.; Issa, C.A.; Sleiman, E.; Aintrazi, S.; Saadeddine, J.; Abboud, R.; Antoun, M. Eco-Friendly Optimum Structural Concrete Mix Design. Sustainability 2020, 14, 8660. [Google Scholar] [CrossRef]
  94. Wang, J.; Guo, S.; Dai, Q.; Si, R.; Ma, Y. Evaluation of cathode ray tube (CRT) glass concrete with/without surface treatment. J. Clean. Prod. 2019, 226, 85–95. [Google Scholar] [CrossRef]
  95. Atyia, M.M.; Mahdy, M.G.; Elrahman, M.A. Production and properties of lightweight concrete incorporating recycled waste crushed clay bricks. Constr. Build. Mater. 2021, 304, 124655. [Google Scholar] [CrossRef]
  96. Sharma, N.; Sharma, P.; Parashar, A.K. Use of waste glass and demolished brick as coarse aggregate in production of sustainable concrete. Mater. Today Proc. 2022, 62, 4030–4035. [Google Scholar] [CrossRef]
  97. Cui, K.; Chang, J. Hydration, reinforcing mechanism, and macro performance of multi-layer graphene-modified cement composites. J. Build. Eng. 2022, 57, 104880. [Google Scholar] [CrossRef]
  98. Alharishawi, S.S.C.; Rajaa, N.; Jabur, A.R. Experimental investigation of using recycled glass waste as fine aggregate replacement in concrete. Arch. Civ. Eng. 2021, 67, 27–38. [Google Scholar] [CrossRef]
  99. Vieira, T.; Alves, A.; de Brito, J.; Correia, J.R.; Silva, R.V. Durability-related performance of concrete containing fine recycled aggregates from crushed bricks and sanitary ware. Mater. Des. 2016, 90, 767–776. [Google Scholar] [CrossRef]
  100. Aziz, P.L.; Abdulkadir, M.R. Mechanical Properties and Flexural Strength of Reinforced Concrete Beams Containing Waste Material as Partial Replacement for Coarse Aggregates. Int. J. Concr. Struct. Mater. 2022, 16, 56. [Google Scholar] [CrossRef]
  101. Etefa, G.; Mosisa, A. Waste Rubber Tires: A Partial Replacement for Coarse Aggregate in Concrete Floor Tile Production. Am. J. Civ. Eng. 2020, 8, 57–63. [Google Scholar] [CrossRef]
  102. Záleská, M.; Pavlíková, M.; Čítek, D.; Pavlík, Z. Mechanical and thermal properties of light-weight concrete with incorporated waste tire rubber as coarse aggregate. AIP Conf. Proc. 2019, 2170, 020026. [Google Scholar] [CrossRef]
  103. Stallings, K.A.; Durham, S.A.; Chorzepa, M.G. Effect of cement content and recycled rubber particle size on the performance ofrubber-modified concrete. Int. J. Sustain. Eng. 2019, 12, 189–200. [Google Scholar] [CrossRef]
  104. Alsaif, A.; Albidah, A.; Abadel, A.; Abbas, H.; Almusallam, T.; Al-Salloum, Y. Behavior of ternary blended cementitious rubberized mixes reinforced with recycled tires steel fibers under different types of impact loads. Structures 2022, 45, 2292–2305. [Google Scholar] [CrossRef]
  105. Alsaif, A.; Bernal, S.A.; Guadagnini, M.; Pilakoutas, K. Durability of steel fibre reinforced rubberised concrete exposed to chlorides. Constr. Build. Mater. 2018, 188, 130–142. [Google Scholar] [CrossRef]
  106. Abd-Elaal, E.; Araby, S.; Mills, J.; Youssf, O.; Roychand, R.; Ma, X.; Zhuge, Y.; Gravina, R.J. Novel approach to improve crumb rubber concrete strength using thermal treatment. Constr. Build. Mater. 2019, 229, 116901. [Google Scholar] [CrossRef]
  107. Singh, H.; Siddique, R. Utilization of crushed recycled glass and metakaolin for development of self-compacting concrete. Constr. Build. Mater. 2022, 348, 128659. [Google Scholar] [CrossRef]
  108. Cardona, C.C.; Vallejo, S.B.; Bustos, S.R.; Piraján, J.C.M.; Acevedo, Y.S.M.; Romero, R.O.S. Evaluation of the physi-cal and mechanical properties of modified concrete with recycled crushed glass, using a proportion adjustment with the method ACI 211.1. Constr. Build. Mater. 2021, 313, 125378. [Google Scholar] [CrossRef]
  109. Omoding, N.; Cunningham, L.S.; Serff, G.F.L. Effect of using recycled waste glass coarse aggregates on the hydrodynamic abrasion resistance of concrete. Constr. Build. Mater. 2021, 268, 121177. [Google Scholar] [CrossRef]
  110. Ho, L.S.; Huynh, T.P. Recycled waste medical glass as a fine aggregate replacement in low environmental impact concrete: Effects on long-term strength and durability performance. J. Clean. Prod. 2022, 368, 133144. [Google Scholar] [CrossRef]
  111. Srikanth, K.S.; Lalitha, G. Durability properties of self compacting concrete partial replacement of fine aggregate with waste crushed glass. Mater. Today Proc. 2022, 51 Pt 8, 2411–2416. [Google Scholar] [CrossRef]
  112. Chang, J.; Luo, S.; Ailifeila, A.; Chong, L.; Jiang, J.Q. Effects of Coarse and Fine Crushed Clay Brick Content on the Compressive Strength of Recycled Aggregate Concrete and the Microscopic Mechanism, Hindawi. Geofluids 2022, 2022, 1341185. [Google Scholar] [CrossRef]
  113. Kim, H.-K.; Lim, Y.; Tafesse, M.; Kim, G.; Yang, B. Micromechanics-integrated machine learning approaches to predict the mechanical behaviors of concrete containing crushed clay brick aggregates. Constr. Build. Mater. 2022, 317, 125840. [Google Scholar] [CrossRef]
  114. Xiong, B.; Demartino, C.; Xu, J.; Simi, A.; Marano, G.C.; Xiao, Y. High-strain rate compressive behavior of concrete made with substituted coarse aggregates: Recycled crushed concrete and clay bricks. Constr. Build. Mater. 2021, 301, 123875. [Google Scholar] [CrossRef]
  115. Abdulhussain, S.T. Evaluation of Compressive and Tensile Strength of Self-Curing Concrete by Adding Crushed Bricks as Additive Material. J. Eng. 2022, 2022, 5410964. [Google Scholar] [CrossRef]
  116. Zhao, Z.; Xiao, J.; Duan, Z.; Hubert, J.; Grigoletto, S.; Courard, L. Performance and durability of self-compacting mortar with recycled sand from crushed brick. J. Build. Eng. 2022, 57, 104867. [Google Scholar] [CrossRef]
  117. Rosca, B. Comparative aspects regarding concrete of structural grade made with recycled brick aggregate with / without fine particles from crushing. Mater. Today Proc. 2022, 60 Pt 2, 982–987. [Google Scholar] [CrossRef]
  118. Dang, J.; Xiao, J.; Duan, Z. Effect of pore structure and morphological characteristics of recycled fine aggregates from clay bricks on mechanical properties of concrete. Constr. Build. Mater. 2022, 358, 129455. [Google Scholar] [CrossRef]
  119. Xu, L.; Su, W.; Su, T. Influence of recycled clay brick aggregate on the mechanical properties of concrete. Rev. Adv. Mater. Sci. 2022, 61, 372–380. [Google Scholar] [CrossRef]
  120. Yan, L.; Liang, J.-F. Use of waste glass as coarse aggregate in concrete: Mechanical properties. Adv. Concr. Constr. 2019, 8, 1–7. [Google Scholar] [CrossRef]
  121. Mohammed, T.K.; Hama, S.M. Mechanical properties, impact resistance and bond strength of green concrete incorporating waste glass powder and waste fine plastic aggregate. Innov. Infrastruct. Solut. 2022, 7, 49. [Google Scholar] [CrossRef]
  122. Asa, E.; Anna, A.S.; Baffoe-Twum, E. An investigation of mechanical behavior of concrete containing crushed waste glass. J. Eng. Des. Technol. 2019, 17, 1285–1303. [Google Scholar] [CrossRef]
  123. Mohammadinia, A.; Wong, Y.C.; Arulrajah, A.; Horpibulsuk, S. Strength evaluation of utilizing recycled plastic waste and recycled crushed glass in concrete footpaths. Constr. Build. Mater. 2019, 197, 489–496. [Google Scholar] [CrossRef]
  124. Ge, Z.; Feng, Y.; Yuan, H.; Zhang, H.; Sun, R.; Wang, Z. Durability and shrinkage performance of self-compacting concrete containing recycled fine clay brick aggregate. Constr. Build. Mater. 2021, 308, 125041. [Google Scholar] [CrossRef]
  125. ACI 544.2R-89; Measurement of Properties of Fiber Reinforced Concrete. American Concrete Institute: Farmington Hills, MI, USA, 1988.
  126. Gerges, N.N.; Issa, C.A.; Fawaz, S.A. Rubber concrete: Mechanical and dynamical properties. Case Stud. Constr. Mater. 2018, 9, e00184. [Google Scholar] [CrossRef]
  127. Nave, R. HyperPhysics. “Thermal Conductivity”. Georgia State University. Available online: http://hyperphysics.phy-astr.gsu.edu/hbase/thermo/thercond.html (accessed on 10 May 2023).
  128. Ahmed, M.F.; Khalil, W.I.; Frayyeh, Q.J. Thermal Insulation Enhancement of Metakaolin-Based Geopolymer Concrete Using Waste Clay Brick. IOP Conf. Ser. Mater. Sci. Eng. 2020, 842, 012009. [Google Scholar] [CrossRef]
  129. Marie, I. Thermal conductivity of hybrid recycled aggregate–Rubberized concrete. Constr. Build. Mater. 2017, 133, 516–524. [Google Scholar] [CrossRef]
  130. Gorospe, K.; Booya, E.; Ghaednia, H.; Das, S. Strength, Durability, and Thermal Properties of Glass Aggregate Mortars. J. Mater. Civ. Eng. 2019, 31, 04019231. [Google Scholar] [CrossRef]
  131. Saleh, F.A.H.; Kaid, N.; Kada, A.; Kerdal, D.E.; Chioukh, N.; Leklou, N. Effects of rubber aggregates on the physical-mechanical, thermal and durability properties of self-compacting sand concrete. Frat. Ed Integrità Strutt. 2022, 61, 89–107. [Google Scholar] [CrossRef]
  132. Bani-Hani, E.H.; Assad, M.E.; Al Mallahi, M.; Almuqahwi, Z.; Meraj, M.; Azhar, M. Overview of the effect of aggregates from recycled materials on thermal and physical properties of concrete. Clean. Mater. 2022, 4, 100087. [Google Scholar] [CrossRef]
  133. Ince, C.; Shehata, B.M.H.; Derogar, S.; Ball, R.J. Towards the development of sustainable concrete incorporating waste tyre rubbers: A long-term study of physical, mechanical & durability properties and environmental impact. J. Clean. Prod. 2022, 334, 130223. [Google Scholar] [CrossRef]
  134. Beiram, A.A.H.; Al-Mutairee, H.M.K. The effect of chip rubber on the properties of concrete. Mater. Today Proc. 2022, 60 Pt 3, 1981–1988. [Google Scholar] [CrossRef]
  135. Flores-Alés, V.; Alducin-Ochoa, J.M.; Martín-Del-Río, J.J.; Torres-González, M.; Jiménez-Bayarri, V. Physical-mechanical behaviour and transformations at high temperature in a cement mortar with waste glass as aggregate. J. Build. Eng. 2020, 29, 101158. [Google Scholar] [CrossRef]
  136. Nasry, O.; Samaouali, A.; El Idrissi, H.S.; Bouhaddour, N.; Alaoui, A.H. Experimental Study of the Thermophysical Properties of the Red Earth Composite Stabilized with Cement Containing Waste Glass Powder. Crystals 2022, 12, 396. [Google Scholar] [CrossRef]
  137. Du, Y.; Yang, W.; Ge, Y.; Wang, S.; Liu, P. Thermal conductivity of cement paste containing waste glass powder, metakaolin and limestone filler as supplementary cementitious material. J. Clean. Prod. 2020, 287, 125018. [Google Scholar] [CrossRef]
  138. Liu, H.; Li, Q.; Wang, P. Assessment of the engineering properties and economic advantage of recycled aggregate concrete developed from waste clay bricks and coconut shells. J. Build. Eng. 2023, 68, 106071. [Google Scholar] [CrossRef]
  139. Pauzi, N.N.M.; Hamid, R.; Jamil, M.; Zain, M.F.M. The effect of melted-spherical and crushed CRT funnel glass waste as coarse aggregates on concrete performance. J. Build. Eng. 2021, 35, 102035. [Google Scholar] [CrossRef]
  140. Aslani, F.; Dale, R.; Hamidi, F.; Valizadeh, A. Mechanical and shrinkage performance of 3D-printed rubberised engineered cementitious composites. Constr. Build. Mater. 2022, 339, 127665. [Google Scholar] [CrossRef]
  141. Gupta, T.; Siddique, S.; Sharma, R.K.; Chaudhary, S. Investigating mechanical properties and durability of concrete containing recycled rubber ash and fibers. J. Mater. Cycles Waste Manag. 2021, 23, 1048–1057. [Google Scholar] [CrossRef]
  142. Choudhary, S.; Gupta, R.; Jain, A.; Chaudhary, S. Experimental Investigation of Rubberized Functionally Graded Concrete. Rev. Compos. Matériaux Av.-J. Compos. Adv. Mater. 2021, 31, 1–11. Available online: http://iieta.org/journals/rcma (accessed on 29 July 2019). [CrossRef]
  143. Pauzi, N.N.M.; Jamil, M.; Hamid, R.; Abdin, A.Z.; Zain, M.F.M. Influence of spherical and crushed waste Cathode-Ray Tube (CRT) glass on lead (Pb) leaching and mechanical properties of concrete. J. Build. Eng. 2019, 21, 421–428. [Google Scholar] [CrossRef]
  144. Bisht, K.; Ramana, P. Experimental investigation of strength, drying shrinkage, freeze and thaw and fire attack properties of concrete mixes with beverage glass waste as fine aggregate. Structures 2021, 36, 358–371. [Google Scholar] [CrossRef]
  145. Xu, Z.; Zhu, Z.; Zhao, Y.; Guo, Z.; Chen, G.; Liu, C.; Gao, J.; Chen, X. Production of sustainable plastering mortar containing waste clay brick aggregates. Case Stud. Constr. Mater. 2022, 16, e01120. [Google Scholar] [CrossRef]
  146. Luhar, S.; Luhar, I.; Nicolaides, D.; Gupta, R. Durability Performance Evaluation of Rubberized Geopolymer Concrete. Sustainability 2021, 13, 5969. [Google Scholar] [CrossRef]
  147. Liu, T.; Wei, H.; Zou, D.; Zhou, A.; Jian, H. Utilization of waste cathode ray tube funnel glass for ultra-high performance concrete. J. Clean. Prod. 2019, 249, 119333. [Google Scholar] [CrossRef]
  148. Aghabaglou, A.M.; Tuyan, M.; Ramyar, K. Mechanical and durability performance of concrete incorporating fine recycled concrete and glass aggregates. Mater. Struct. 2015, 48, 2629–2640. [Google Scholar] [CrossRef]
  149. Ahmad, S.I.; Rahman, S.; Alam, S. Water Permeability Properties of Concrete made from Recycled Brick Concrete as Coarse Aggregate. IOP Conf. Ser. Mater. Sci. Eng. 2020, 809, 012015. [Google Scholar] [CrossRef]
  150. Assaggaf, R.A.; Al-Dulaijan, S.U.; Maslehuddin, M.; Al-Amoudi, O.S.B.; Ahmad, S.; Ibrahim, M. Effect of different treatments of crumb rubber on the durability characteristics of rubberized concrete. Constr. Build. Mater. 2022, 318, 126030. [Google Scholar] [CrossRef]
  151. Alsaif, A.; Alharbi, Y.R. Strength, durability and shrinkage behaviours of steel fiber reinforced rubberized concrete. Constr. Build. Mater. 2022, 345, 128295. [Google Scholar] [CrossRef]
  152. Mhaya, A.M.; Shahidan, S.; Zuki, S.S.M.; Huseien, G.F.; Azmi, M.A.M.; Ismail, M.; Mirza, J. Durability and Acoustic Performance of Rubberized Concrete Containing POFA as Cement Replacement. Sustainability 2022, 14, 15510. [Google Scholar] [CrossRef]
  153. Tamanna, N. Use of Waste Glass as Aggregate and Cement Replacement in Concrete. Ph.D. Thesis, James Cook University, Townsville, Australia, 2020. [Google Scholar] [CrossRef]
  154. Yang, W.; Cai, X.; Jiangjiu, D. Behaviors of Concrete with Recycled Clay Brick as Fine Aggregate. In Proceedings of the XV International Conference on Durability of Building Materials and Components DBMC, Barcelona, Spain, 3 January 2020. [Google Scholar]
  155. Wu, Y.; Qi, Z.; Niu, M.; Yao, Y.; Luo, Z.; Zhang, K. Effect of Moisture Condition of Brick–Concrete Recycled Coarse Aggregate on the Properties of Concrete. Materials 2022, 15, 7204. [Google Scholar] [CrossRef]
  156. Tahwia, A.M.; Essam, A.; Tayeh, B.A.; Elrahman, M.A. Enhancing sustainability of ultra-high performance concrete utilizing high-volume waste glass powder. Case Stud. Constr. Mater. 2022, 17, e01648. [Google Scholar] [CrossRef]
  157. Tian, L.; Qiu, L. Preparation and properties of integrally hydrophobic self-compacting rubberized concrete. Constr. Build. Mater. 2022, 338, 127641. [Google Scholar] [CrossRef]
  158. Islam, T.; Islam, M.; Siddika, A.; Al Mamun, A. Performance of rubberized concrete exposed to chloride solution and continuous wet–dry cycle. Innov. Infrastruct. Solut. 2021, 6, 67. [Google Scholar] [CrossRef]
  159. Li, S.; Zhang, J.; Du, G.; Mao, Z.; Ma, Q.; Luo, Z.; Miao, Y.; Duan, Y. Properties of concrete with waste glass after exposure to elevated temperatures. J. Build. Eng. 2022, 57, 104822. [Google Scholar] [CrossRef]
  160. Noaman, A.T.; Jameel, G.S.; Ahmed, S.K. Producing of workable structural lightweight concrete by partial replacement of aggregate with yellow and/or red crushed clay brick (CCB) aggregate. J. King Saud Univ.-Eng. Sci. 2020, 33, 240–247. [Google Scholar] [CrossRef]
  161. Matos, A.M.; Sousa-Coutinho, J. Durability of mortar using waste glass powder as cement replacement. Constr. Build. Mater. 2012, 36, 205–215. [Google Scholar] [CrossRef]
  162. Aghabaglou, A.M.; Beglarigale, A.; Yazıcı, H.; Ramyar, K. Microstructural Analyses of Recycled Aggregate-Bearing Mortar Mixture. Mater. J. 2016, 113, 769–780. [Google Scholar] [CrossRef]
  163. Kelechi, S.E.; Adamu, M.; Mohammed, A.; Obianyo, I.I.; Ibrahim, Y.E.; Alanazi, H. Equivalent CO2 Emission and Cost Analysis of Green Self-Compacting Rubberized Concrete. Sustainability 2021, 14, 137. [Google Scholar] [CrossRef]
  164. Tanwar, V.; Bisht, K.; Kabeer, K.S.A.; Ramana, P. Experimental investigation of mechanical properties and resistance to acid and sulphate attack of GGBS based concrete mixes with beverage glass waste as fine aggregate. J. Build. Eng. 2021, 41, 102372. [Google Scholar] [CrossRef]
  165. Tang, Z.; Li, W.; Ke, G.; Zhou, J.L.; Tam, V.W. Sulfate attack resistance of sustainable concrete incorporating various industrial solid wastes. J. Clean. Prod. 2019, 218, 810–822. [Google Scholar] [CrossRef]
  166. Alcharchafche, M.A.S.; Al-Mashhadani, M.M.; Aygörmez, Y. Investigation of mechanical and durability properties of brick powder-added White Cement composites with three different fibers. Constr. Build. Mater. 2022, 347, 128548. [Google Scholar] [CrossRef]
Figure 1. Types of LWA [10].
Sustainability 15 10060 g001
Figure 2. No. of publications on tire rubber, glass, and clay brick concrete published in the last six years and obtained from Scopus.
Sustainability 15 10060 g002
Figure 3. Comparison of the workability of rubberized concrete (R), glass concrete (G), and clay brick concrete (B) [29,70,87,88,89,90,91,92,93,94,95,96].
Sustainability 15 10060 g003
Figure 4. Comparison of the compression strengths of rubberized concrete (R), glass concrete (G), and clay brick concrete (B) [29,70,87,88,89,90,91,92,93,94,95,96,100,101,102,103,104,105,106,107,108,109,110,111,112,113,114,115,116,117,118,119].
Sustainability 15 10060 g004
Figure 5. Comparison between the elastic modulus strengths of rubberized concrete (R), glass concrete (G), and clay brick concrete (B) [29,70,89,90,92,93,100,102,105,107,109,113,118].
Sustainability 15 10060 g005
Figure 6. Comparison of the split tensile strengths of rubberized concrete (R), glass concrete (G), and clay brick concrete (B) [29,87,88,89,90,92,93,96,100,105,106,107,109,115,117,118,119,124].
Sustainability 15 10060 g006
Figure 7. Comparison of the density of rubberized concrete (R), glass concrete (G), and clay brick concrete (B) [29,70,89,90,95,100,102,103,105,108,111,114,116,117].
Sustainability 15 10060 g007
Figure 8. Comparison of the thermal conductivity of rubberized concrete (R), glass concrete (G), and clay brick concrete (B) [89,95,102,130,131,132,133,134,135,136,137,138].
Sustainability 15 10060 g008
Figure 9. Comparison of the shrinkage of rubberized concrete (R), glass concrete (G), and clay brick concrete (B) [89,91,94,124,140,141,142,143,144,145].
Sustainability 15 10060 g009
Figure 10. Comparison of the chloride permeability of rubberized concrete (R), glass concrete (G), and clay brick concrete (B) [23,110,150,151,152,153,154,155].
Sustainability 15 10060 g010
Figure 11. Comparison of the water absorption of rubberized concrete (R), glass concrete (G), and clay brick concrete (B) [34,60,89,143,144,150,157,158,159,160].
Sustainability 15 10060 g011
Figure 12. Comparison of the sulfate resistance of rubberized concrete (R), glass concrete (G), and clay brick concrete (B) [1,23,150,163,164,165,166].
Sustainability 15 10060 g012
Table 1. Physical properties of waste material.
ReferenceSizeType of WasteSpecific GravityWater Absorption (%)
[1]0–5 mmCrumb rubber0.9-
[18]2–5 mmCrumb rubber1.15-
[21]<10 mmTire chips1.02-
4 mmCrumb rubber0.83-
1 mmFine crumb rubber0.48-
[24]1.18–5 mmCrumb rubber-negligible
[25]20 mmChipped rubber1.121.7
[26]0–4 mm Rubber1.154-
4–8 mm Rubber1.1745.5
[32]0.42–1–2–4 mmCrumb rubber1.09-
[34]2–5 mmRubber fiber1.080.2
[50]<4.75 mmRubber1-
[51]0–0.6 mmRubber1.1–1.27-
0.5–2.5 mmRubber1.1–1.27-
2.5–4 mmRubber1.1–1.27-
[52]5–10 mmCoarse crumb rubber1.15.3–8.9
10–20 mmCoarse crumb rubber1.10.8–1.3
[53]1.44–2.83 mmCrumb rubber--
[54]Sieved according to
Indian Standards
Crumb rubber0.701-
[55]0.8–4 mmFine crumb rubber1.053.48
<20 mmCoarse crumb rubber1.055.57
[56]2–6 mmFine+ Coarse crumb rubber1.120.65
[38]600 μmCrushed glass-zero
[57]4–16 mmCoarse crushed glass2.4-
[58]<4 mmFine crushed glass2.5110.03
<11.2 mmCoarse crushed glass2.5240.03
[59]2.36–5 mmFine crushed glass2.450.36
[60]50 μmFine crushed glass2.44-
[61]<2.36 mmGlass powder2.43-
[42]5–20 mmCrushed clay brick block1.753.6
[62]0–5 mmCrushed clay brick2.4598.8
[63]<19 mmCoarse crushed clay brick1.04612.5
[64]0–5 mmCrushed clay brick and mortar2.5488.6
[65]A0.001–0.2 mmPowder crushed clay brick-22.07
B0.004–0.3 mmPowder crushed clay brick-16.45
C0.15–0.35 mmPowder crushed clay brick-12.03
[66]0–5 mmCrushed clay brick and mortar-8.6
[67]0.15–4.75 mm fine concreteCrushed clay brick2.0818.3
4.75–19 mm coarse concreteCrushed clay brick2.0415.5
0.15–4.75 mm fine masonaryCrushed clay brick2.0818.3
2.36–9.75 mm coarse masonaryCrushed clay brick2.0616.2
[68]0–5 mmCrushed clay brick-7
[69]<5 mmFine crushed clay brick1.88711.3
Disclaimer/Publisher’s Note: The statements, opinions and data contained in all publications are solely those of the individual author(s) and contributor(s) and not of MDPI and/or the editor(s). MDPI and/or the editor(s) disclaim responsibility for any injury to people or property resulting from any ideas, methods, instructions or products referred to in the content.

