Abstract
As the transition towards connected and autonomous vehicles gradually happens, different phases with CAVs and human-driven vehicles sharing the same network will occur. This paper’s purpose is to increase the knowledge of these mixed situations, studying the impacts of an increasing number of CAVs within the vehicle fleet on road capacity, travel time savings and energy consumption, providing new insights into the debate that is still open. The methodology focused on a microsimulation-based approach on an urban motorway in the city of Rome. Some of the outcomes from simulations, run with the software PTV VissimTM 21, were used to analyse variations in general performances of the transportation system, whereas the remaining results were fed into the emission model COPERT for assessing the impacts of CAV penetration on the energy consumption of the fleet. Results show how, in congested cases, appreciable improvements can be recorded in terms of road capacity, mean speeds, and environmental impacts, while in lower-congested situations, any enhancement in traffic fluidification counteracts the environmental performances of the whole system.
1. Introduction
1.1. Motivation of the Study
Continuous technological advancement which has affected every sector of human life in recent years, has reached the automotive sector as well. Hence, it does not seem unrealistic to have a long-term wide diffusion of autonomous and connected vehicles, commonly known as CAVs. For this reason, different efforts were aimed at assessing the impacts of CAVs’ spread in terms of road performances, road safety, social acceptance, and environmental sustainability. Previous studies investigated fully the effects of a 100% CAV-composed vehicle fleet and, as reported in [1], the issue is still debatable. However, the transition towards a fully automated and connected fleet is supposed to be gradual, so that the coexistence of CAVs and human-driven vehicles is supposed to occur. Several research studies focused on the effects of mixed traffic on road performances and fuel consumption, but, as [2] reports, more studies on operational vehicle conditions in mixed traffic situations are needed, as the lack of data does not make it easy to state what the implications of the co-presence of the two different vehicle types are. This paper’s purpose is to contribute to the debate by studying the impacts of mixed traffic situations on a real wide network, analysing changes in general performances and using a consolidated standard methodology for the energy consumption assessment. The remaining part of the introduction is organized as follows: the next sub-section (Section 1.2) provides the literature review, after which, this paper’s contribution to the debate on CAVs’ impact will be clearly set out. The last part (Section 1.3) reports the organization of the paper.
1.2. Literature Review
In recent decades, new technological and telematic innovations have been invested in the automotive industry. Manufactures, in fact, have tried to equip their vehicles with even more advanced devices, in order to improve urban and extra-urban mobility with the private car. The new emerging trends in the automotive world, which will probably be the pillars of future transportation revolutions are: multimodality and shared mobility, electrification, automation, and connectivity [3]. Multimodality and shared mobility come together within the concept of Mobility-as-a-Service (MaaS), which is a novel term whose definition still does not find agreement among researchers [4]. This concept describes a new way for travelling that replaces the idea of car ownership with the concept of mobility intended as a service to be used according to the user’s needs. Technological innovation is fundamental to the deployment of MaaS, to create a digital platform on which travellers can plan their journey, choosing the modes of transport that suit them best. As regards fleet electrification, the spread of Electric (EVs), Battery Electric (BEVs), Hybrid Electric (HEVs) and Plug-in Hybrid Electric Vehicles (PHEVs) instead of diesel and gasoline engines can help to reduce the dependence of the transport sector on carbon fuels, with benefits in terms of reduction of pollutant emissions and energy consumption. Lastly, automation and connectivity are strictly correlated, and the transition towards connected and autonomous vehicles is supposed to be the most disruptive in terms of the social, economic, land use and environmental impacts [5,6,7].
Vehicle automation involves a whole range of technologies capable of managing safety-critical control functions (e.g., steering, throttle, and braking) without direct input from the driver [8]. The Society of Automotive Engineers (SAE International) [9], in January 2014, released a classification of the driving capabilities of autonomous cars under the name of J3016. This taxonomy is periodically updated and the last revision, which occurred in 2021, is known as J3026_202104 [10]. According to this classification, also reported in [11], the automation degree of vehicles is classified into six different classes, ranging from fully traditional driving to fully autonomous vehicles, which are briefly described in Table 1.

Table 1.
Description of the automation degrees classes.
Vehicle connectivity is achieved by equipping vehicles with advanced communication technology, which enables them to share information between two components of the transportation system [12,13]. This property is known as “Vehicle-to-Everything” connectivity and is referred as to V2X. All types of connections encompassed in V2X connectivity are described in [12] and are listed in Table 2.

Table 2.
Description of all existing connectivity types.
Vehicles that are both autonomous and connected are known as CAVs (Connected Autonomous Vehicles). CAVs can be powered with traditional (diesel or gasoline) or alternative sources of energy (such as the aforementioned ones).
As reported in [14], CAVs are disruptive in the transport sector, and could potentially produce relevant changes in travel behaviours and in the environment. The same study divides the possible impacts of CAVs into two types: “direct” impacts, which directly affect CAVs and their users, and “indirect impacts”, which occur following the wide spread of CAVs within the vehicular fleet.
The indirect impacts were explored in depth in several previous studies, and they can be summarized as follows:
- Impacts on traffic congestion: CAVs are supposed to reduce congestion in different ways. Firstly, the advanced technological system allows vehicles to stop instantly when required, so that they can travel with reduced headways. As reported in [8], this can lead to increases in road capacity, with the consequent reduction in congestion. Moreover, real-time information shared by the system could perform an instantaneous recalculation of the vehicle’s route based on the received data, so that it could take alternative roads, avoiding congested situations [15,16]. The optimization of signal settings, mainly due to V2I technology, can contribute to reducing congestion [17].
- Impacts on land use: As cars with a high level of automation can move independently from human guidance, they are able to provide an on-demand service, moving people when they request and then, independently, going away from the destination point. This could lead to a drastic reduction in parking demand, with the possibility of using parking spaces for different purposes within cities’ development [18]. Furthermore, the whole infrastructure system should be rethought, as several elements would become superfluous (e.g., traffic lights, road lighting and lane division) [15].
- Impacts on urban design: not driving could increase users’ willingness to travel longer distances for their systematic movements (e.g., from and to work), leading to a new distribution of population in urban, sub-urban, and rural areas, causing de-urbanisation and sprawl [6,15,19].
- Impacts on consumer choices: One of the capabilities of CAVs is the possibility of being used in sharing [5]. Different studies stated that this could lead to a reduction in car ownership, as the vehicle can be used by all the family at the same time, while, on a broader level, driverless taxis services or autonomous car sharing programs could potentially be cheaper travel options if compared with the costs of buying, owning, and maintaining a car [5,15]. Unfortunately, there is no agreement among scholars on this assumption. In fact, as reported in [8], the results of interviews with a sample of 302 people [20] have clearly shown that people prefer to own a vehicle (either human-driven or autonomous) than to use sharing services (whether traditionally or autonomously driven). Hence, the role of CAVs in promoting sharing mobility is still an open discussion.
- Impacts on travel demand: potential increases in travel demand should be considered, as CAVs would become more accessible to people who could not or did not want to drive (e.g., disabled, elderly, and younger sections of the population and people with no license) [8,15,19].
Direct impacts are the most relevant for protecting human health and the environment, as they refer to road safety and air and noise pollution [21]. In the presence of CAVs, traffic is supposed to be safer. In fact, most crashes are due to human error, but new vehicular equipment helps to prevent accidents, also removing the social costs associated with them [18]. However, for higher levels of automation, the possibility of the emergence of new types of accidents due to possible failures in the automation or communication system should be considered [22,23,24,25].
As regards the environmental impacts, as reported in [26], energy consumption and gaseous emissions are mainly affected by vehicle speed. In fact, these emissions are high at low speeds, flatten out at average speeds, and increase again when speeds are higher. In [8,15], three different solutions for reducing both energy consumption and gas emissions are proposed, all of them easily reachable with a good level of CAV deployment: (1) a reduction in traffic congestion, so that all vehicles can move at the same average speed; (2) vehicle platooning, which reduces aerodynamic drag forces, with the consequent reduction in fuel consumption and gases release; and (3) traffic smoothing, with the elimination of the stop-and-go phenomena. Nevertheless, not all studies on energy consumption related to CAV diffusion show encouraging results. For example, as [8,15] clearly show, if secondary and suburban roads, where speed limits are usually below the optimal values, can benefit from increases in speed, this is not true for highways and freeways, where traffic fluidification can lead to speed values significantly greater than the optimal ones. In [15], the authors mention the possibility of a rebound effect occurring for CAVs. For example, any energy saving obtained by the reduction in congestion might be compensated by the increment in the distance travelled, due to an alternative, longer route. Moreover, reductions in energy consumptions, owing to platooning, would be balanced by potential growths in travel demand that could increase the number of vehicles in the network.
Noise pollution is another big concern for public administrations seeking to control the environmental effects of human activities. As noise production increases linearly with speed, noise pollution is supposed to increase with CAV deployment [15]. Unfortunately, the literature is lacking in environmental assessments generated by CAVs, so that it is difficult to make assertions on this topic.
It is clear that the environmental effects of CAVs, although known and easily conceivable, still need to be investigated.
As the transition to a 100% CAV fleet is non-instantaneous, different intermediate phases with mixed traffic are seen as occurring in the near future. The connectivity of vehicles with the infrastructure will be even more important in these mixed scenarios; in fact, CAVs, being connected to each other, know their location within the network but totally ignore that of the unconnected vehicles, except in the immediate surroundings. In these scenarios it will, therefore, be crucial to know the location of unconnected vehicles through optimal sensor distribution within the infrastructure [27]. The effect of interference between human-driven and autonomous vehicles is still a subject of discussion.
One of the most interesting studies concerning the impacts of mixed-traffic situations with ever-increasing percentages of CAVs in the vehicle fleet is reported in [2]. In this paper, the authors propose an interesting theoretical framework, modelling human-driven and autonomous vehicles separately. The study is aimed at analysing the effects, in terms of travel time savings and fuel consumption reduction, of the interaction between the two vehicle types when the CAV share gradually increases. Simulations are run with three different traffic conditions: low volume, medium traffic volume and dense traffic. The analysis is limited to a merging zone, while the methodology followed for fuel consumption assessment is not clear. Results show energy savings for a 100% CAV scenario and for a mixed-traffic scenario when flows are low. Benefits in terms of travel times are recorded when all vehicles are CAVs and for medium-high volumes when the share of CAVs is equal to or greater than 50%. Hwang and Song [28] proved that the presence of AVs in the fleet affects two parameters: road capacity and speed limits. Using a speed-dependent emission function, they obtained environmental benefits with increasing road capacity, until the “optimal” speed threshold was exceeded. Benefits were also recorded in congested situations, but not in collapsing scenarios (where the demand equals three times the road capacity). In [29] the authors studied the interaction between CAVs and human-driven vehicles by proposing a methodology to improve information and the communication systems of traditional vehicles, in order to improve their interaction with CAVs, without carrying out environmental evaluations. Another study [30] analysed the interaction between two different vehicle types: partially and fully automated vehicles. Lastly, in [1] the authors carried out several environmental assessments, comparing different scenarios with a fleet composed of 100% traditional vehicles, 100% connected vehicles and 100% automated vehicles, using both the European simulator CO2MPASS and COPERT methodology for the assessment of carbon dioxide emissions. The study proved that it is connectivity rather than the automation which provides the environmental benefits in terms of CO2 emissions.
This paper aims to investigate the benefits or disadvantages of CAV penetration in the vehicular fleet of the city of Rome by studying different mixes of CAVs and human-driven vehicles. The work proposes the use of consolidated models for both simulation and energy consumption estimations. The use of consolidated models differentiates the methodology from the studies conducted by [2] and by [28], and the application on a wider scale allows a wider evaluation, compared to the study by [2].
A major aim of this research is to study the interaction between human-guided vehicles and CAVs, an objective that also differentiates it from the research carried out by [1], which studies different non-mixed scenarios.
Five degrees of CAV penetration were considered, and the performances in terms of energy consumption, road capacity and delays were analysed. The energy consumption was assessed by following the standard methodology CORINAIR, consistent with European Commissions guidelines, and used in all the member states to carry out environmental evaluations concerning the transportation system.
1.3. Paper Organization
The remaining part of the paper is divided into sections. In the following one (Section 2), a description of the methodology used is reported, followed by the analysis of the case study described in Section 3. In the next Section (Section 4), the results of the study are shown, while Section 5 is devoted to the discussion of results. The last section (Section 6) will report conclusions and outlooks of the study.
2. Methodology
This study is aimed at analysing the general and environmental performances of a mixed-traffic flow, composed of human-driven vehicles and different numbers of CAVs. The methodology followed in the analysis is shown in the flow chart in Figure 1.

Figure 1.
Methodology representation.
As shown in the flowchart, starting with knowledge of the road network, transportation demand and vehicles characteristics, a simulation model allows us to obtain the flows, speeds, travel times and road capacity of the study area in return. Using this information, general performances or energy consumption (EC) can be calculated, the latter using the COPERT model that will be presented below. Both the assessments will be used to evaluate the mixed-traffic scenarios that were simulated. The general performances considered in this paper are the speed, capacity and delay of different traffic conditions, and their assessment was carried out using a microsimulation approach. Simulations were run with PTV VissimTM, a software which provides tools for microsimulations based on Wiedemann’s car-following model. This model was proposed by Rainer Wiedemann in 1974 [31], and is based on the division of human driving behaviour into four components: free-driving, approaching, following and braking. The transition from one driving mode to another occurs by crossing the six thresholds of perception, reported in [32]. This model was subsequently updated in 1999, to better fit with traffic conditions on freeways.
As car-following models are limited to the description of the longitudinal movement of vehicles, an integration with lane-changing models is necessary. These models, originally theorised by Gipps in 1986 [33], describe the user’s decision process when he decides to change the lane in which he is travelling. In VissimTM, two different types of lane-changings are implemented: mandatory lane-changing, which models, for example, the case in which the user has to perform a turning manoeuvre or the case in which a narrowing of the carriageway occurs; and voluntary lane-changing, when the driver wants to reach higher speeds or greater spacing in relation to other vehicles. In both cases, the change is performed based on the gap acceptance theory, in which it is assumed that the driver makes the manoeuvre if the gap (the time spacing between two different vehicles) is considered “acceptable” by the user [34]. In order to prepare the transition phase, in which human-driven vehicles and connected and autonomous vehicles will coexist in the same road environment, in 2017 the project CoEXist started [35]. As reported in the CoEXist guidelines [36], three different sets of parameters for simulating the behaviour and the characteristics of CAVs are already included in the VissimTM package. These sets are listed below:
- “Cautious”, where vehicles observe the road code, always adopting safe behaviour in all their manoeuvres. Usually, this option is set for level 1 or level 2 of automation;
- “Normal”, where vehicles behave like human drivers, with the additional capacity of using their sensors for monitoring spacings and speed of the surrounding vehicles. These parameters are typically set for simulating level 3 of automation;
- “All-knowing”, in which vehicles have total awareness and predictive capabilities, characterized by smaller gaps for all manoeuvres and situations. This set of parameters is usually used for the simulation of the higher automation levels.
The main difference between human-driven vehicles and CAVs is that the first behave stochastically, while the latter are supposed to operate deterministically. This leads to changes in the basic functions in VissimTM:
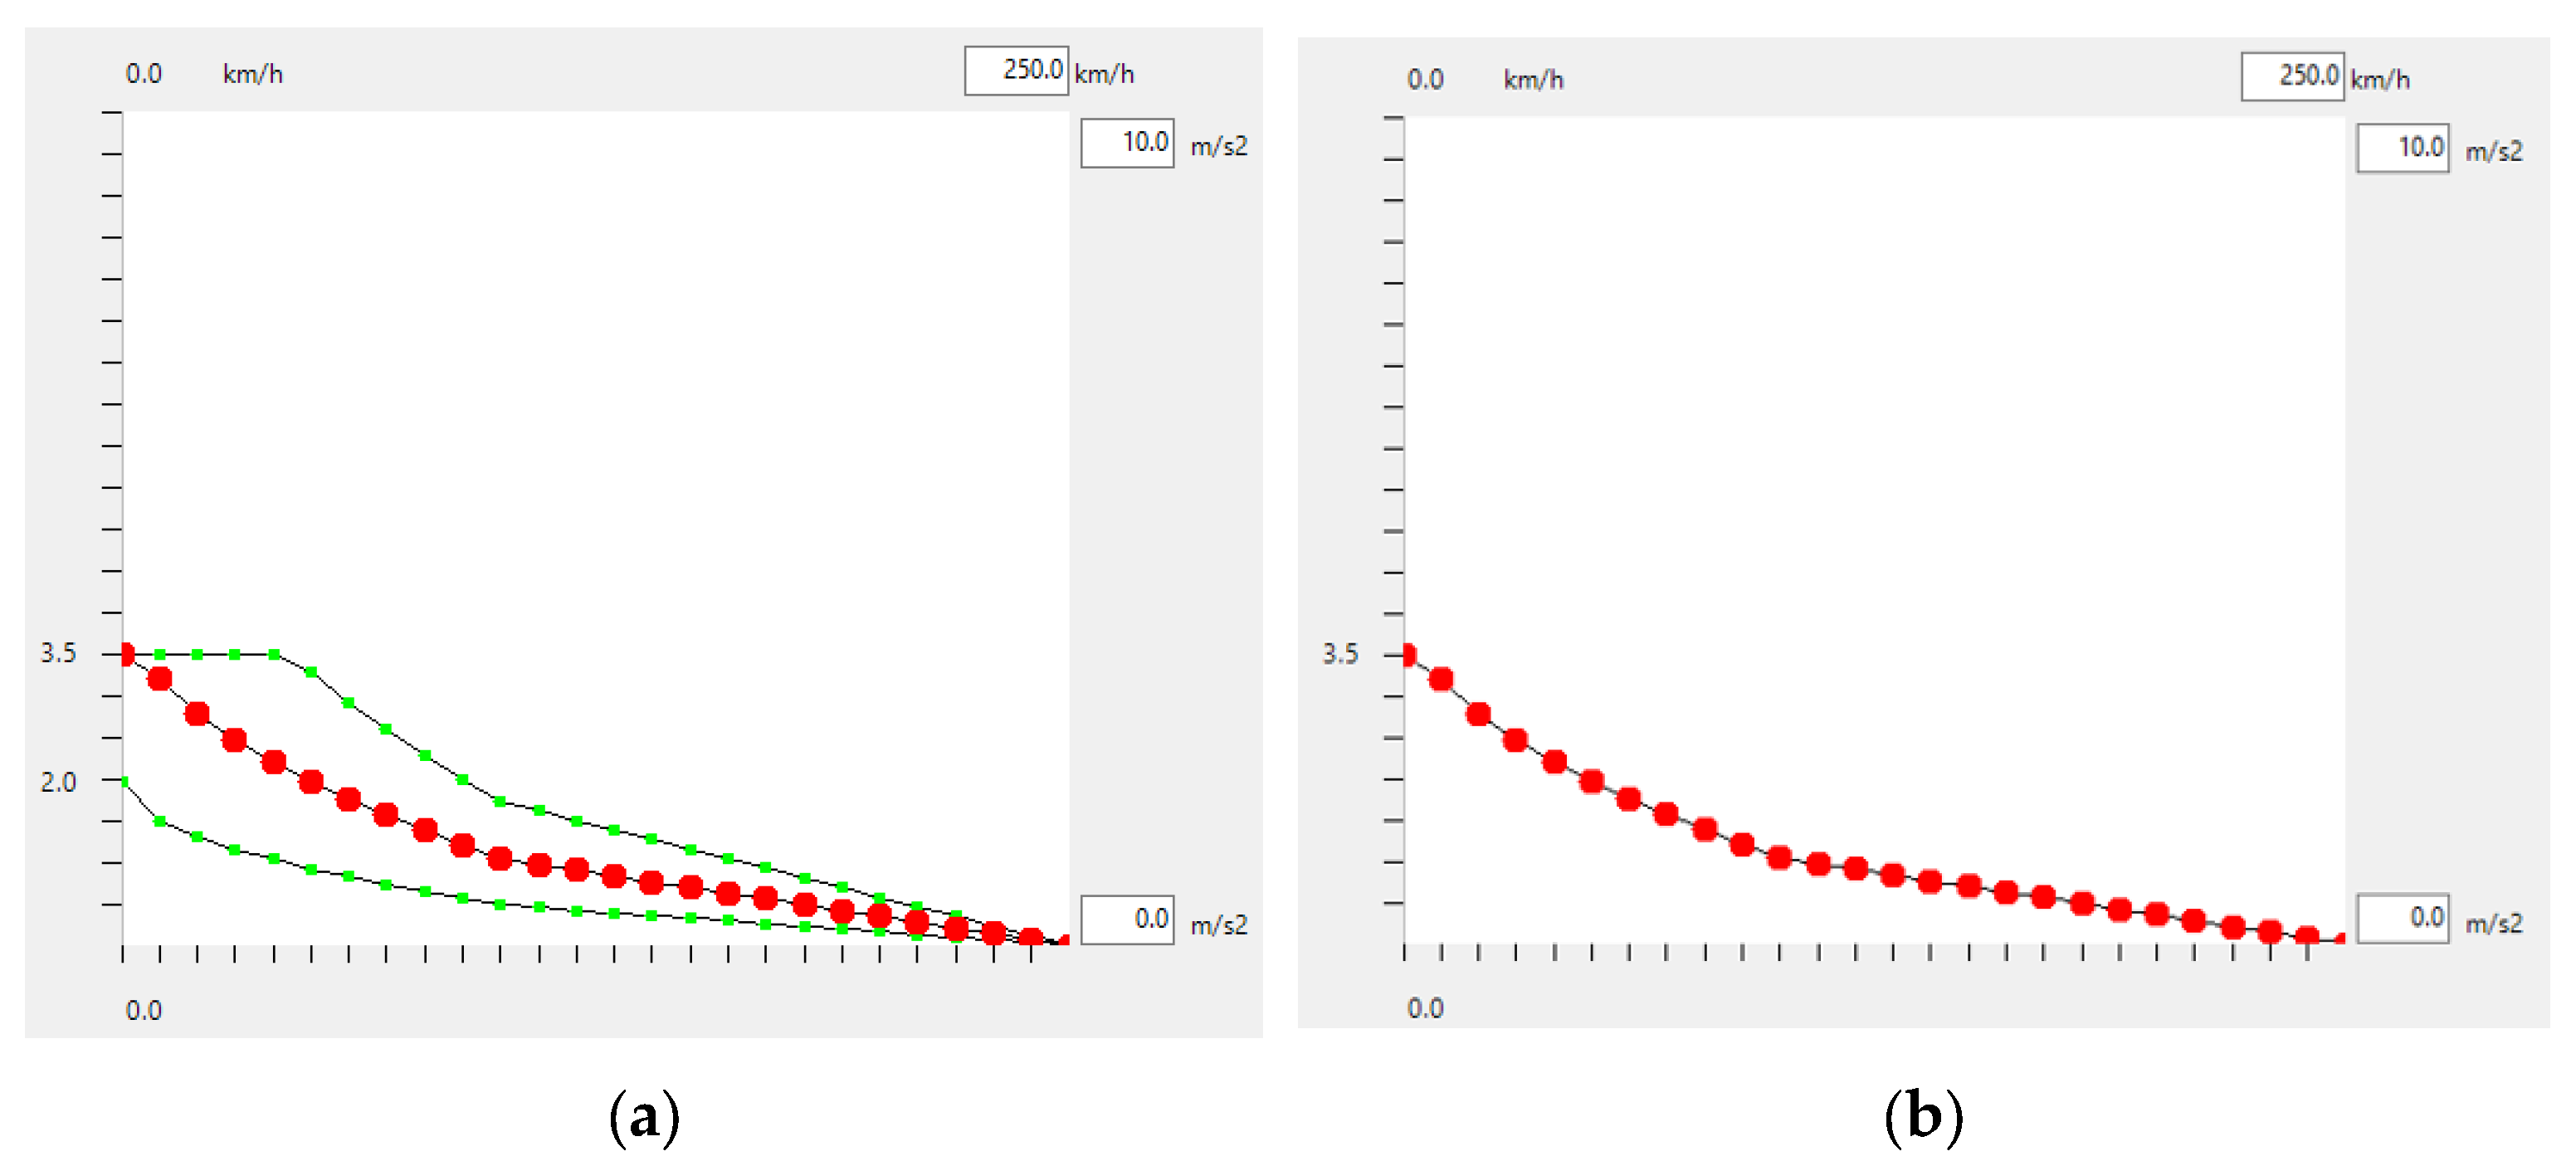
- Acceleration Distributions: in human driving behaviour, the acceleration distributions are composed of three different curves. The first two represent the lower and the upper limit of the distribution, while the last curve represents the mean value. These three curves constitute a large range, in which the accelerations of the human driver take place. As regards connected and autonomous vehicles, the acceleration distributions degenerate in the mean curve, as all vehicles are assumed to have the same value for acceleration. In Figure 2, the two different curves are reported.
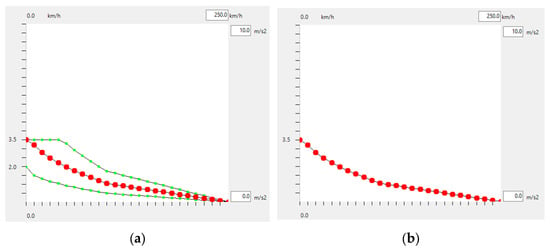 Figure 2. Typical Acceleration Distributions (Maximum Acceleration) to set in VissimTM: (a) Typical Acceleration Distribution for human-driven vehicles; (b) Typical Acceleration Distribution for CAVs. In the figures, on the x-axis is the speed and on the y-axis is the acceleration. Green circles represent the minimum and the maximum value of the acceleration corresponding to each value of speed, while red circles are the mean value of the acceleration corresponding to each speed. At a certain value of speed, the user can take an acceleration in the range of values between the maximum and the minimum (upper and lower green circle).
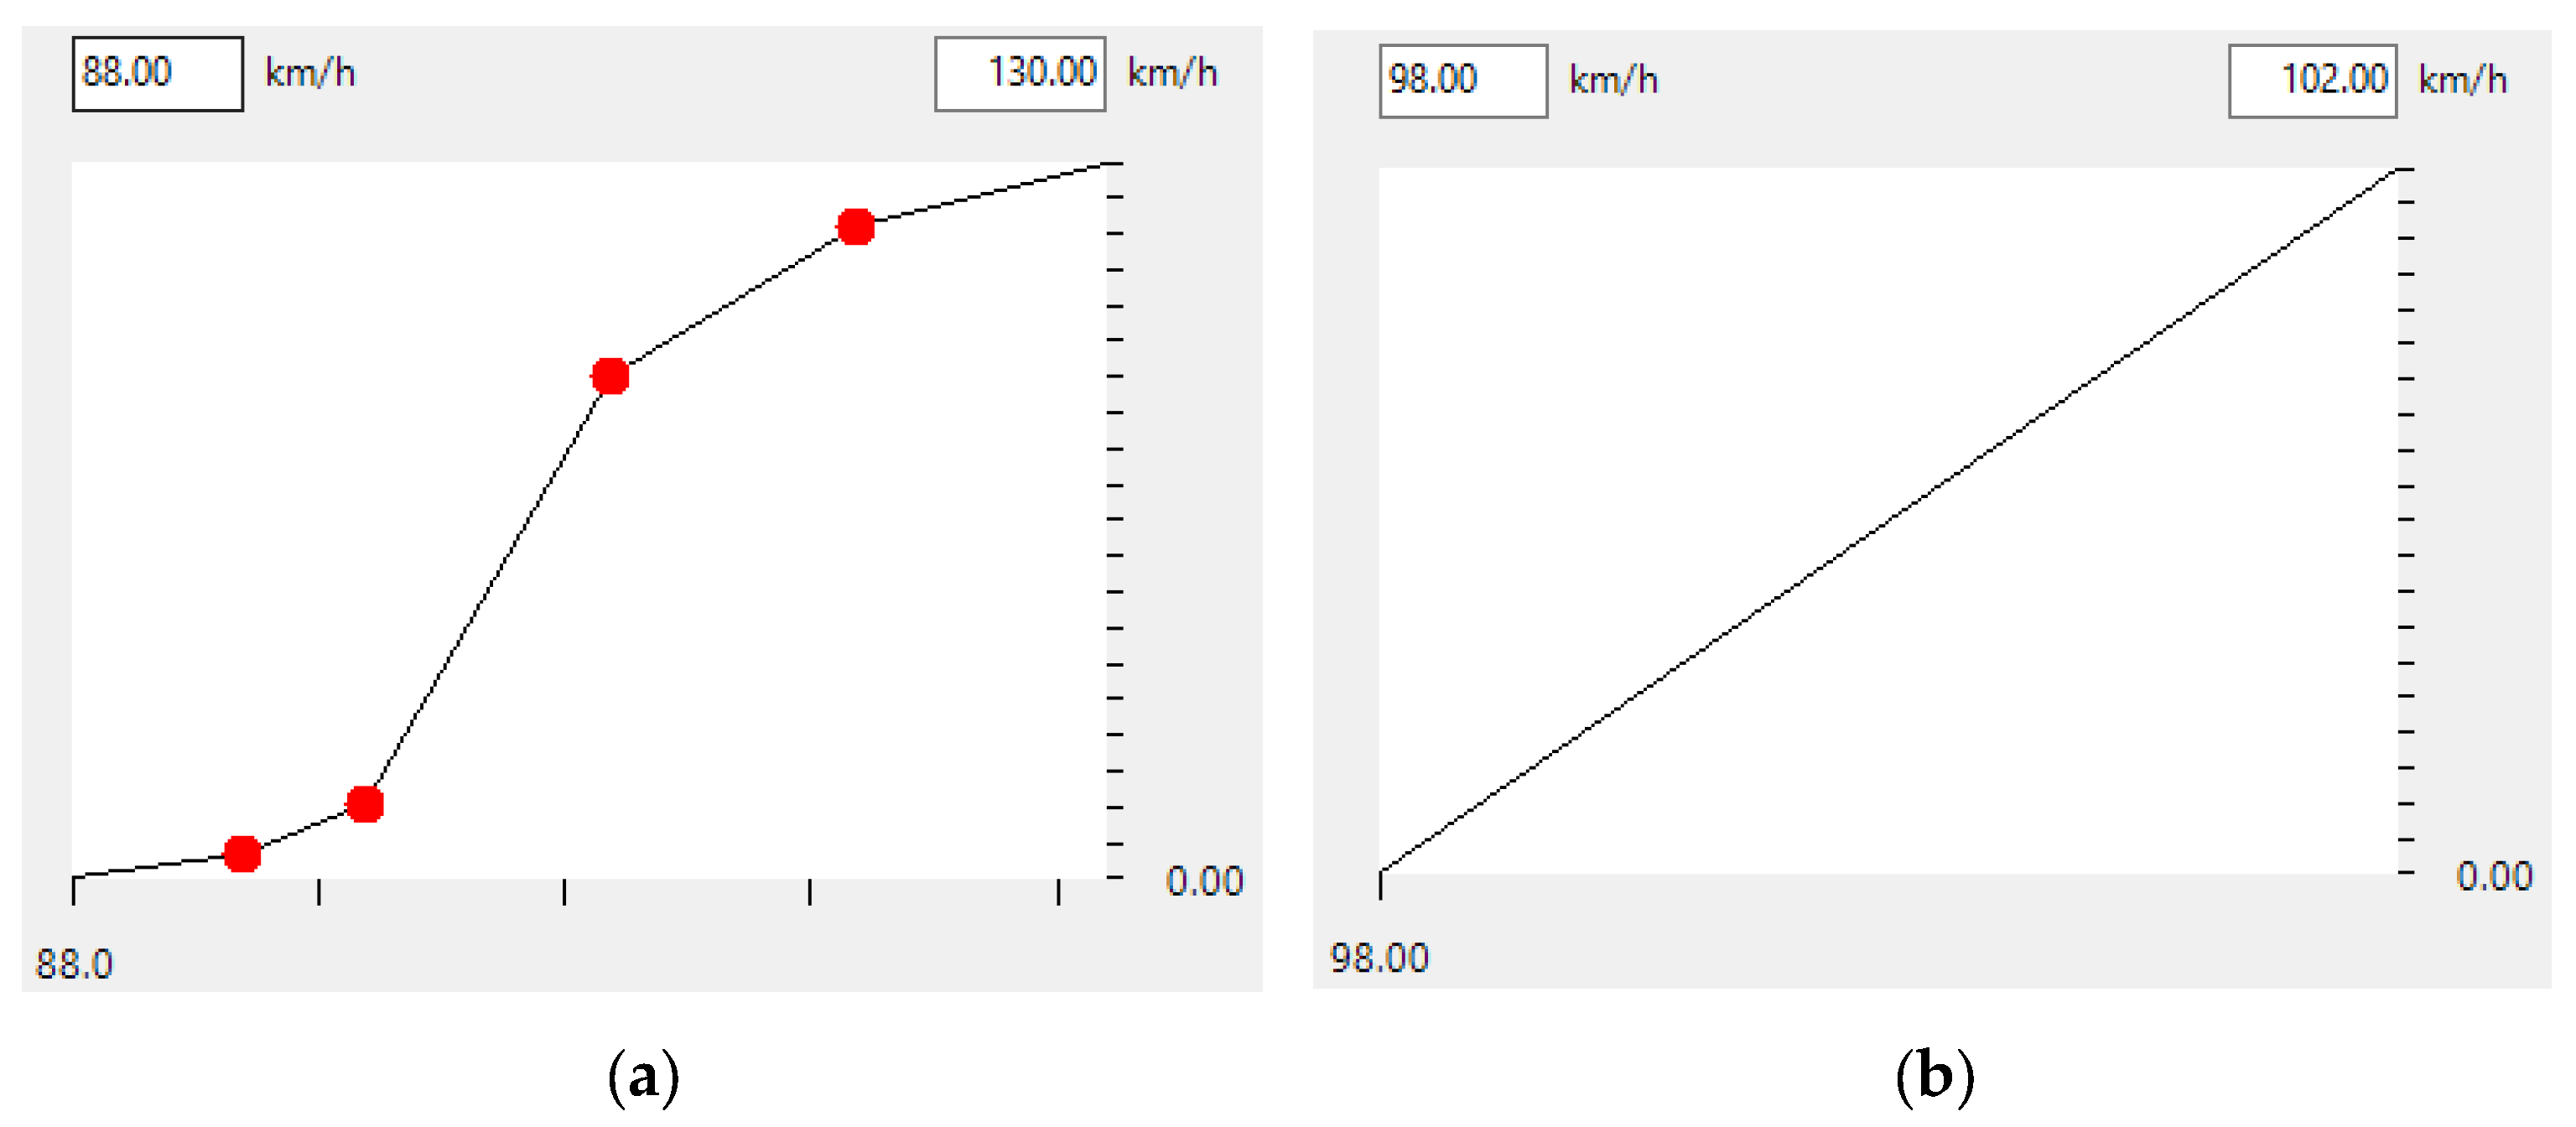
 - Speed Distribution: human drivers tend to reach their desired speed, which is different for each user, so that the speed distributions in the software have a significantly irregular trend, with high spreads. On the contrary, CAVs tend to strictly obey limits, so that their speed distribution shows, in VissimTM, a linear trend, with much lower spreads. These trends are reported in Figure 3.
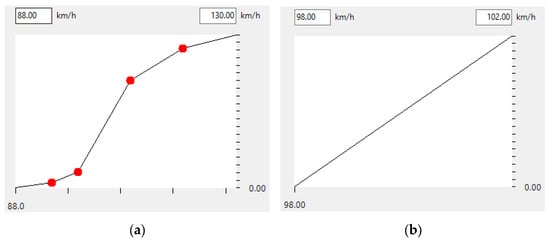 Figure 3. Typical Speed Distributions to set in VissimTM: (a) Typical Speed Distribution for human-driven vehicles; (b) Typical Speed Distribution for CAVs. Red circles in the left figure represent the share of users that would travel with a specific speed within the range represented.
These changes in the main distributions help to represent platooning, in which some vehicles move in a line, at the same speed, with the same acceleration, and with the same spacing and headway, as if they were part of a train convoy. This situation is possible only if vehicles are well connected, and has benefits in terms of increase in capacity [37,38].
The simulation allowed us to obtain the values for the road capacity and travel times in return, to use for estimating the general performances of the system. Another output was the vehicles’ mean speed, which was later used as an input for the assessment of the energy consumption (EC) of the fleet.
The second part of this study focused on the contribution to air pollution of different numbers of CAVs in the moving fleet. As it is assumed that the 100% CAV-composed fleet will be possible in the fairly distant future, it is obvious that significant changes in laws and technology could take place. Since the scenarios simulated in this study are related to different periods, even in distant time, in order to evaluate the impact of a change in driving behaviour only, independently of any potential development in regulations and technology, the same vehicular composition (the current vehicle fleet) was used to calculate energy consumption as a proxy for environmental impact in this study. The mathematical formulation used for the estimation is the COPERT methodology [38], which is part of the EMEP/EEA guidebook for the estimation of pollutant emissions, and is used in a great number of the member states of the European Union [39]. The methodology requires a large number of data, such as vehicular fleet, driving conditions, type of fuel, type of road segment, etc. Energy consumption was expressed as a function of speed, and for its estimation, the first step was the definition of the vehicular fleet related to the territory in which the analysis was conducted. Then, the emission curves for each technology in the fleet were calculated. The assessment of the EC emission curves was carried out with the following formulation (Equation (1)) [37]:
where:
- : specific technology, consisting of fuel, vehicle size, EURO standard;
- : speed ;
- : energy consumption for specific technology at speed ;
- : CORINAIR emission factor of technology ;
- : CORINAIR reduction factor of technology ;
- : lower and upper bound of speed in function definition
Then, for the estimation of the total EC of the entire fleet, an average of the EC for every technology weighted for the number of vehicles with the specific technology was made, according to Equation (2):
where values of Vmin and Vmax were estimated according to Equation (3), reported below:
where:
- : lower and upper bound of speed in function definition ;
- : set of vehicle technologies defined by CORINAIR methodology;
- : number of vehicles in the fleet with technology e ;
- : total number of vehicles in the fleet ;
- : energy consumption of vehicle fleet .
The methodology shown was applied in the main urban freeway of the city of Rome in Italy, as described in the following section.
3. Case Study
3.1. Delimitation of the Study Area
The object of the study was a part of the south-east quadrant of the GRA in the city of Rome. The GRA is an urban ring-shaped freeway surrounding the Italian capital, characterized by three lanes for each direction of travel [40].
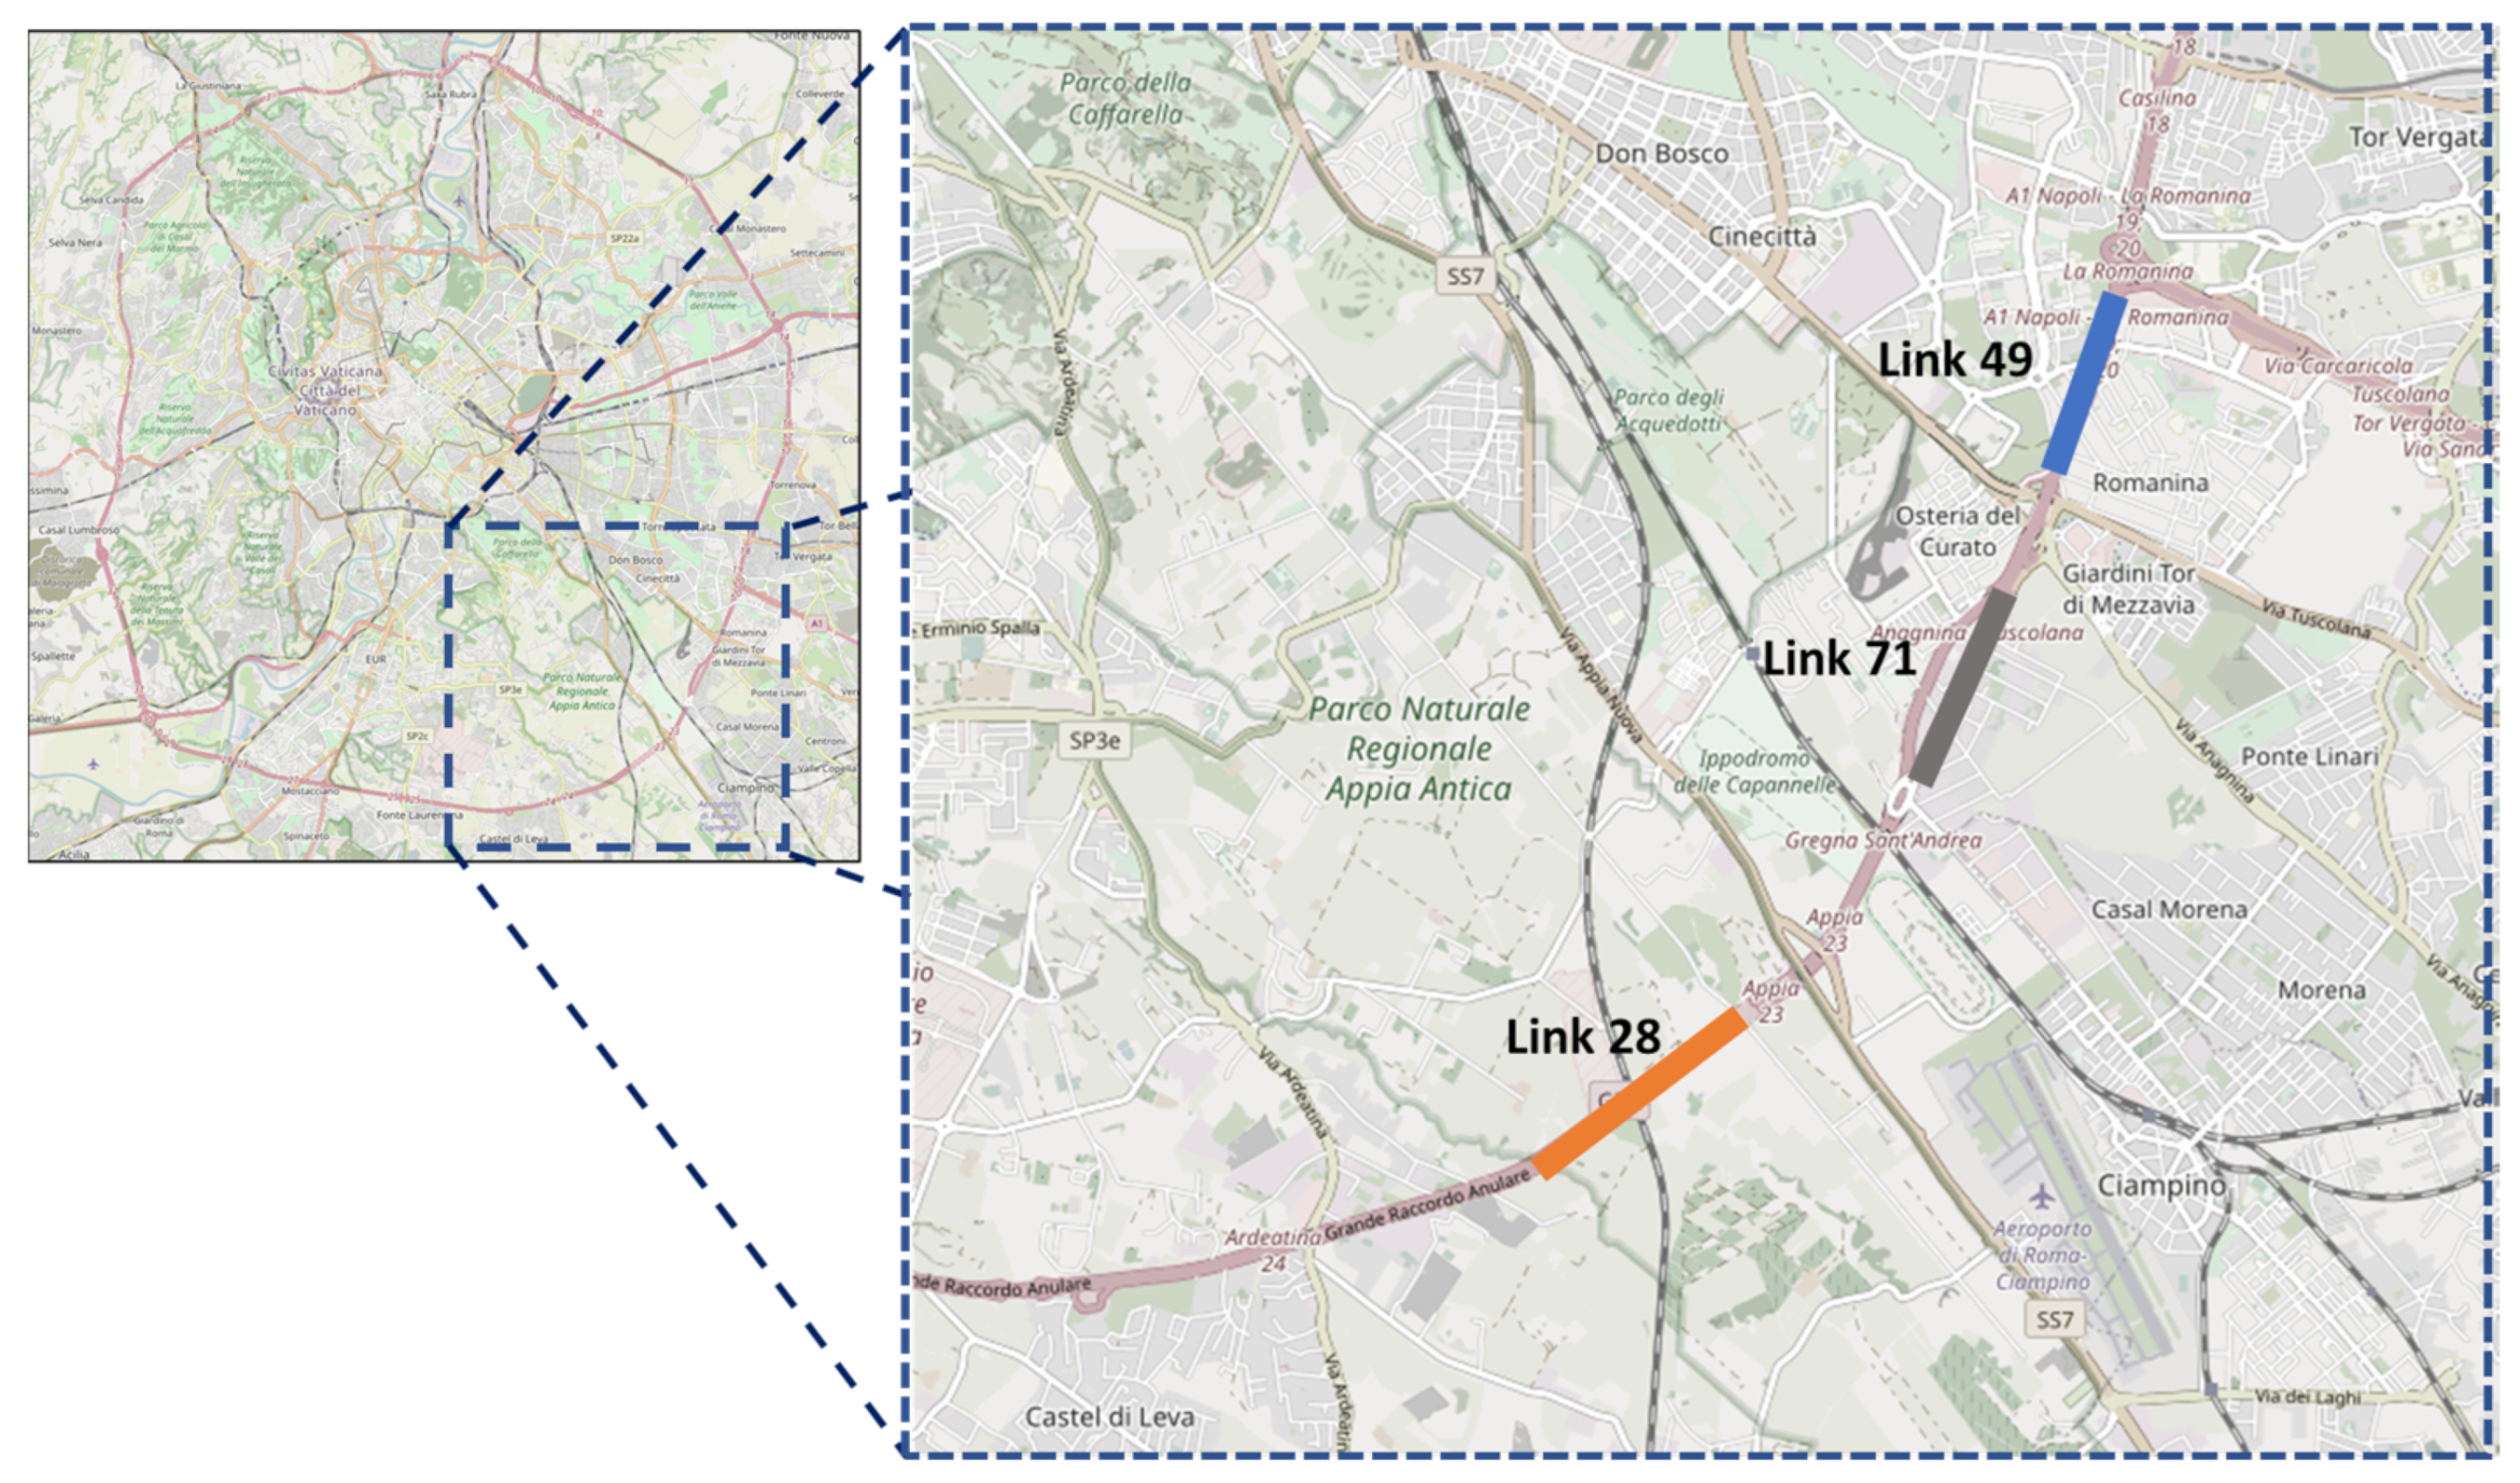
The area of the south-east quadrant under study (Figure 4) runs for 10 km, from junction 24 of Via Ardeatina, to branch A1 of Roma Sud and vice versa, crossing three municipalities.
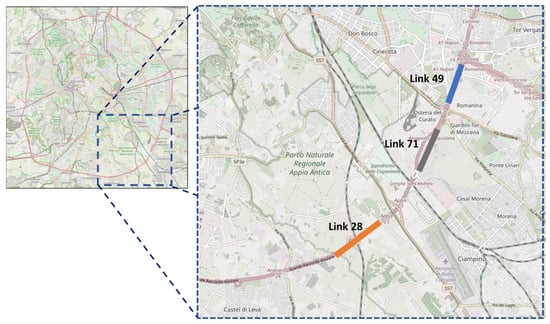
Figure 4.
Location of the case study.
Due to its proximity to the main generation and attractions poles of the city of Rome, the South-East quadrant is travelled by high traffic volumes and is often affected by congestion, especially during peak hours.
3.2. Scenario Definition and Assumptions
Five scenarios with different degrees of penetration of CAVs were analysed. Therefore, the vehicle fleet in different scenarios was assumed to be composed as follows:
- Scenario 1: 100% traditionally driven vehicles;
- Scenario 2: 75% traditionally driven vehicles and 25% CAVs;
- Scenario 3: 50% traditionally driven vehicles and 50% CAVs;
- Scenario 4: 25% traditionally driven vehicles and 75% CAVs;
- Scenario 5: 100% CAVs.
The scenarios were simulated, considering the following assumptions:
Assumption 1.
In order to avoid introducing complexities into the model that lie outside the scope of this study, all CAVs were considered fully automated (having the level 5 of automation).
Assumption 2.
For the estimation of pollutant emissions, both human-driven and self-driving vehicles in the network were assumed to be powered in the same way as the current Roman vehicle fleet (mainly conventional). Coupling CAV technology with alternative types of powering would produce more environmental benefits. However, the basic idea of the study was to have a fleet which was as similar as possible, so that the effects due to the exclusive change in driving style introduced by CAVs could be compared.
Assumption 3.
The traffic stream was assumed to be composed of only cars and light vehicles, whose presence within the fleet constituted a small percentage, and which were converted into the equivalent vehicles.
The assessment of the mean speeds and the EC of vehicles involved three different links of the GRA:
- The first link, identified as link 28, connecting the exit junctions of Via Ardeatina and Via Appia, is characterized by values of density that hover around 65 veh/km in different scenarios;
- The second link, identified as link 71, runs from the exit junction of Morena to the exit junction of Anagnina. Densities are lower than those of link 28;
- The last link connects Via Tuscolana with the highway A1. It is identified as link 49, and shows a situation of congestion, with much higher densities than the other two links.
In the following sections, the outcomes of the study will be shown and discussed.
3.3. Model Calibration
For the assessment of the general performance of the system (capacity and delays) and of the traffic stream’s mean speed, a simulation approach was used.
Scenario 1, with a total traditional-composed fleet (0% CAVs) was considered the baseline scenario, and it was calibrated with data from detectors located in different sections of the road segment. For verifying the results of the calibration, different statistical indicators were used, according to the Traffic Modelling Guidelines [41]. The document suggests a procedure for building, calibrating and validating a microsimulation model, and one of its sections is entirely dedicated to Vissim models.
The GEH (assessed as in Equation (4)), indicator was used for calibrating volumes:
where:
- m are the simulated traffic volumes [veh/h];
- c are traffic volumes from detectors [veh/h].
Calibration can stop if GEH ≤ 5 for 85% of the sample values. When this condition was not satisfied, the OD matrix was subjected to corrections.
For calibrating speeds, two different statistical indicators were used. The “root-mean-square percentage error” (RMSPE) and the “mean absolute normalized error” (MANE) are commonly used for measuring the discrepancy between simulated and observed values. The first one is estimated as shown in Equation (5):
On the other hand, MANE can be evaluated with Equation (6):
In both the formulas, terms are defined as follows:
- is the n-th simulated speed [km/h];
- is the n-th observed speed [km/h];
- is the number of values considered in the sample.
When the values of RMSPE and MANE are equal to zero, simulated and observed values overlap. This means that the closer to zero they are, the more the model reproduces reality. If these indicators were too high, the driving parameters inside Vissim were adjusted.
The calibration process was carried out considering four different sections (two for the internal and two for the external carriageway) of the road segment, where data were available, due to the presence of detectors. The simulated time interval lasted three hours and corresponded to the morning peak hour of an average weekday. The calibration results are shown in Table 3 and Table 4.

Table 3.
Calibration of traffic volumes.

Table 4.
Calibration of speeds.
As shown in Table 3, GEH shows values of less than 5 in all the rows. The condition for ending the calibration process for traffic volumes can be considered satisfied.
The average error between the simulated and observed flows was 12.7%. and only in one case should be considered high, with a value of 18.6%. Therefore, the model for the baseline scenario (Scenario 1) is considered to be calibrated.
3.4. Changes in Parameters for Human-Driven and CAVs
In Scenarios 2, 3, 4 and 5, different numbers of CAVs in the moving fleet need to be considered. Vissim allows modelers to change driving behaviour parameters, in order to choose the combination that best fits the needs of the analysis. In Table 5, three different values of parameters are listed. The second column reports the default Vissim values, while in the third column the values obtained after the calibration process can be found. The last part of the table shows how the default parameters were changed for the “all-knowing” condition, in accordance with the CoExist guidelines [36]. All parameters are described in detail in [42].

Table 5.
Driving behaviour parameters for human-driven vehicles and CAVs.
3.5. Evaluation of the Energy Consumption Curve
With reference to the fleet circulating in the city of Rome and road and traffic conditions on the GRA, the total EC was assessed for each speed, in steps of 10 km/h. Then, a fifth-degree polynomial regression was applied, until a high level of R2 (R2 = 0.9996) was reached.
The curve EC vs. speed takes the following formulation (Equation (7)):
EC(v) = α∙v5 + β∙v4 + γ∙v3 + δ∙v2 + ε∙v + ζ
The values of the coefficients a, b, c, d, f and g are listed in Table 6.

Table 6.
Values of the coefficients used in Equation (7).
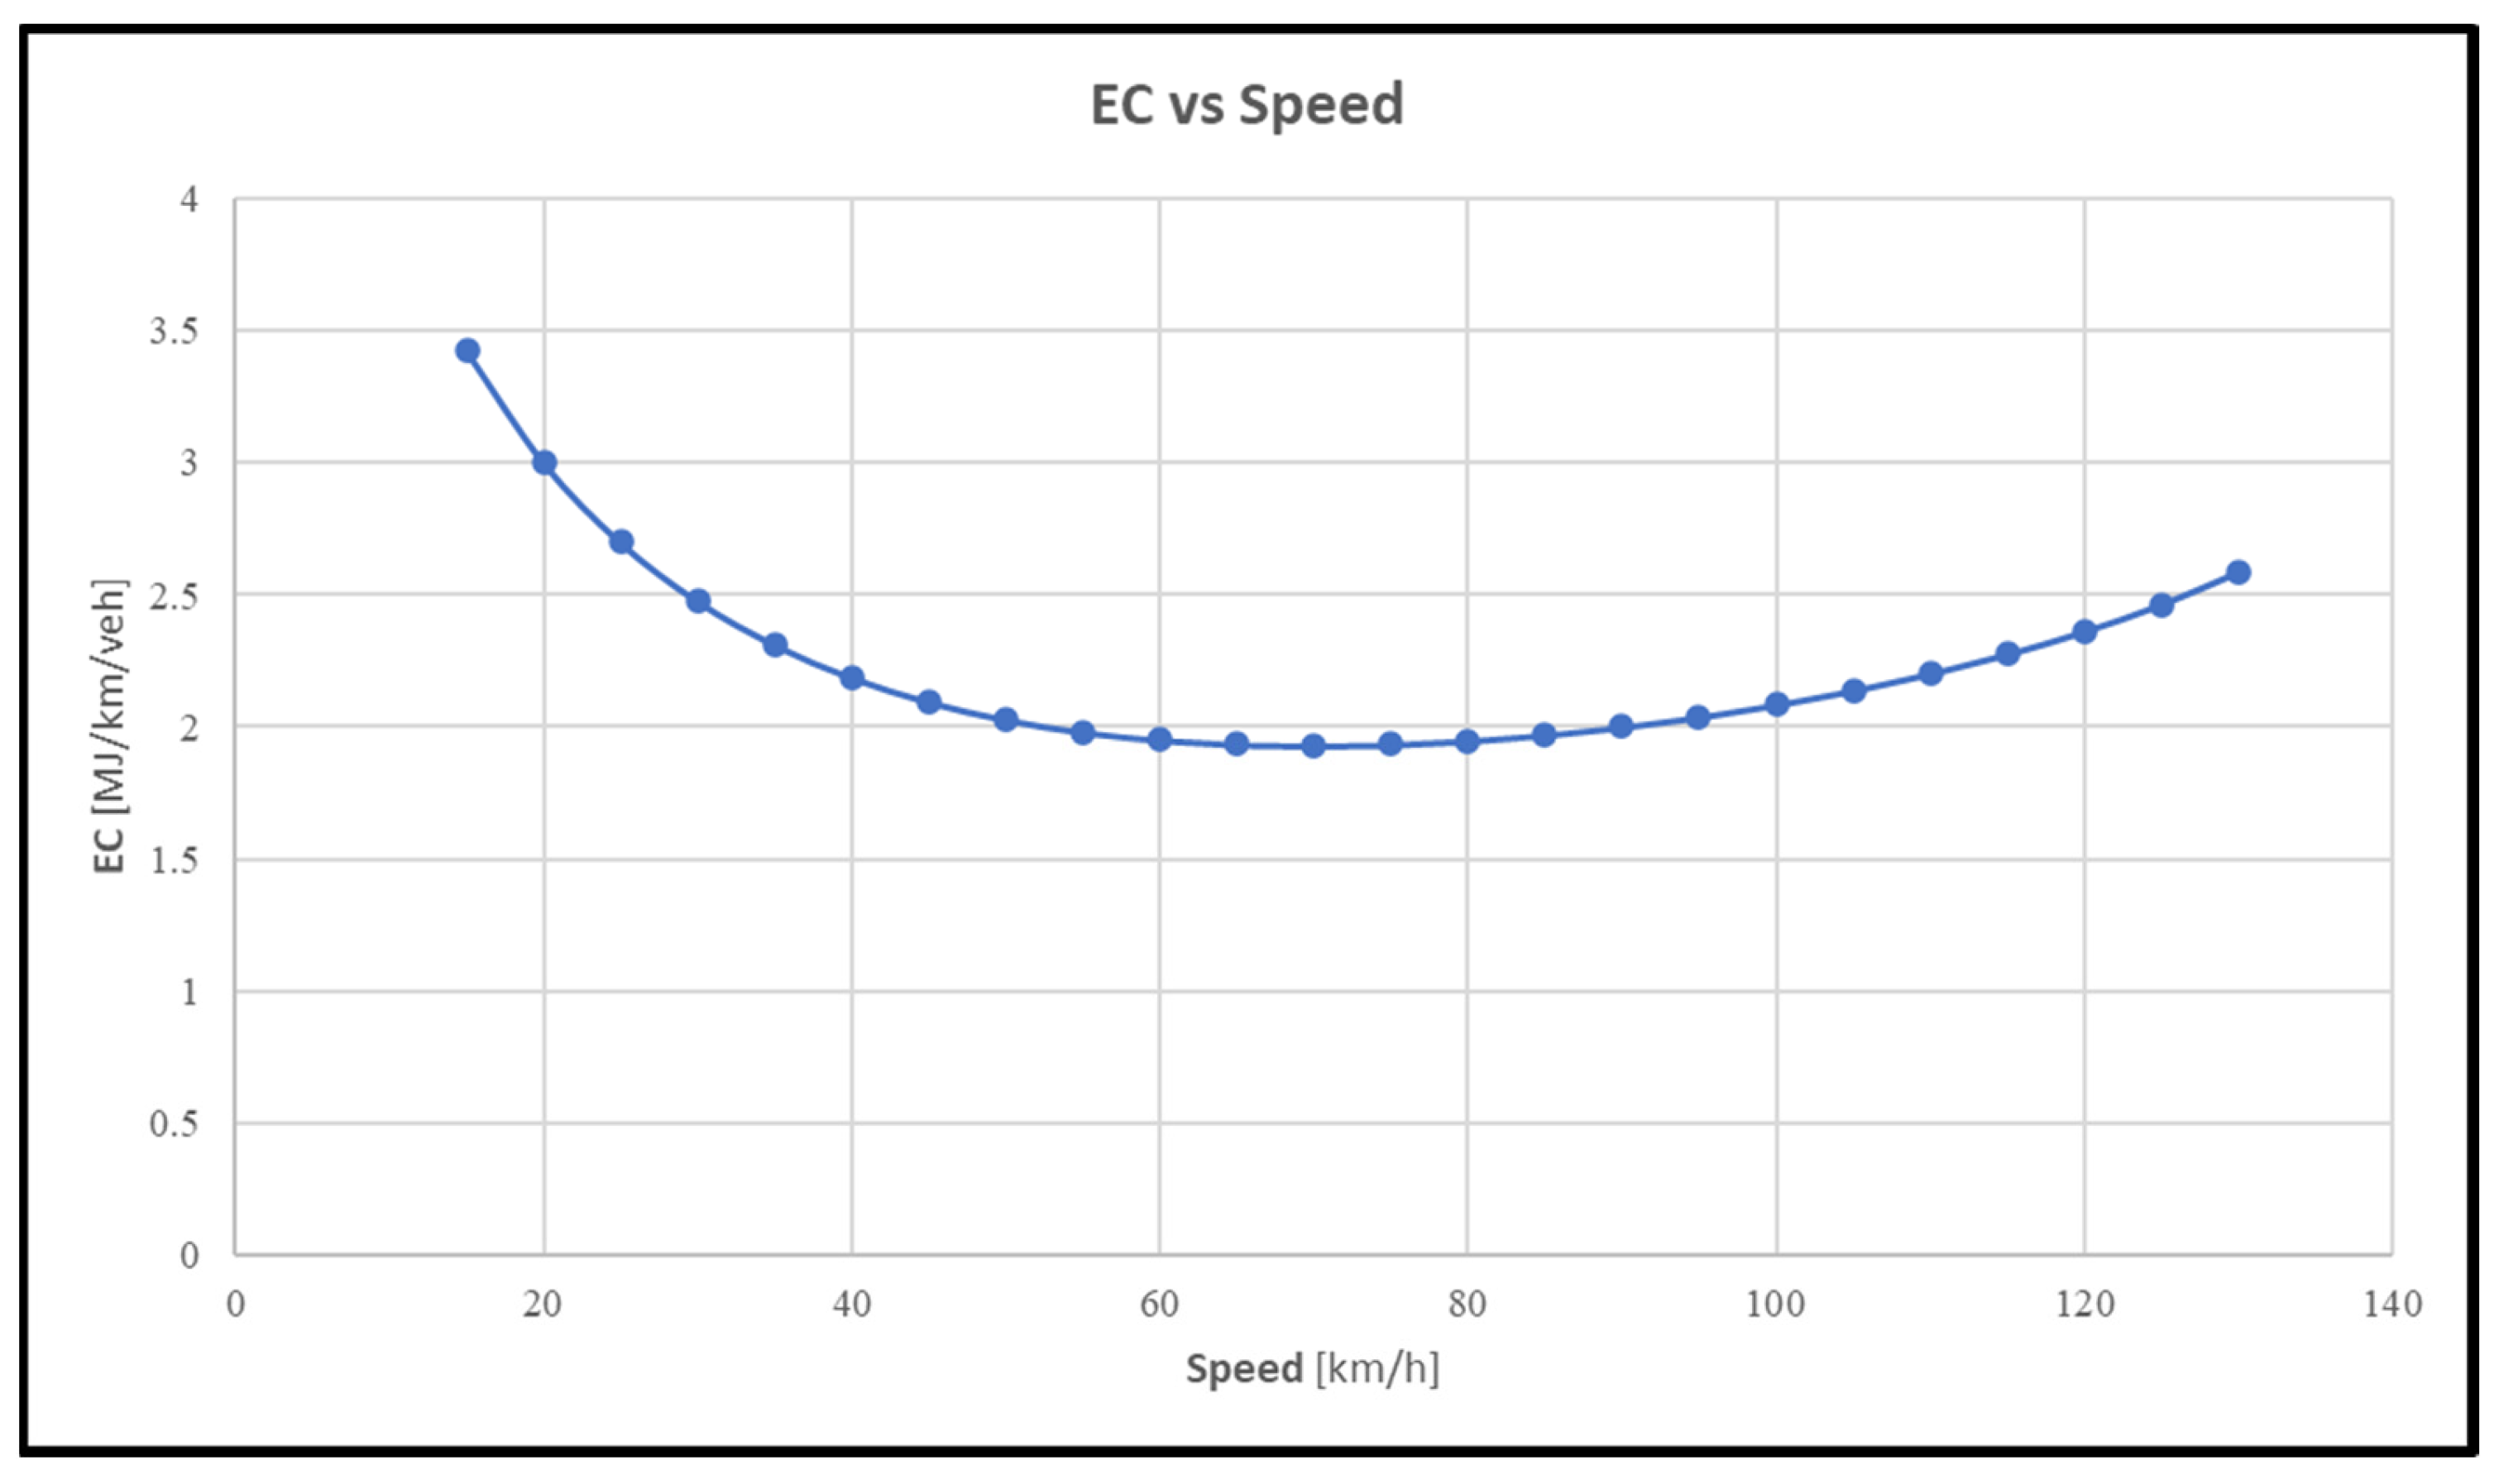
Where EC is the energy consumption in MJ/km/veh, and v is the mean speed of the traffic stream, in km/h. In fact, speed is the variable that mainly affects the consumption of fuel, and the energy consumption is assumed to be dependent only on speed. The trend of the curve EC–speed is reported in Figure 5.
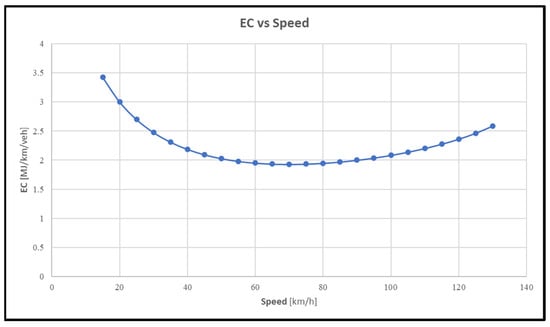
Figure 5.
Variation of Energy Consumption as the speed increases.
According to Figure 5, the curve is at a minimum around the value of 75 km/h. Therefore, the energy consumption decreases until the speed reaches the value of 75 km/h and then rises again as the speed increases.
4. Results
The first part of this section concerns the outputs of the microsimulation, while the second part is devoted to understanding how energy consumption occurs in accordance with the variations in the vehicular fleet.
4.1. Assessments of Road Performances
The simulation was run with PTV VissimTM for the morning peak hour (6:00–9:00 a.m.) of an average weekday. Performances of the GRA were analysed in terms of mean speed, road capacity, and travel time savings.
4.1.1. Mean Speed of Traffic Stream
Speeds for each one of the three links resulting from the simulation are listed in the following Table 7.

Table 7.
Speeds for the analysed links, for different numbers of CAVs in the fleet.
As Table 7 exhibits, for each condition of congestion on the link, the values of speed tend to grow when the presence of CAVs within the vehicular fleet increases. This is probably due to the fact that the advanced system of technologies, with which autonomous vehicles are equipped, makes these cars independent of human driving, allowing them to reach higher and more homogeneous speeds. Therefore, the traffic stream becomes more “fluid”. Only link 28, in the second column of Table 7, shows a different trend, as the speed decreases even if the number of CAVs increases, up to 25%. This anomaly can probably be caused by the values of the densities and of the speeds, which cause an increased disturbance in the case of the introduction of a different component into the vehicular fleet.
4.1.2. Variations in Road Capacity
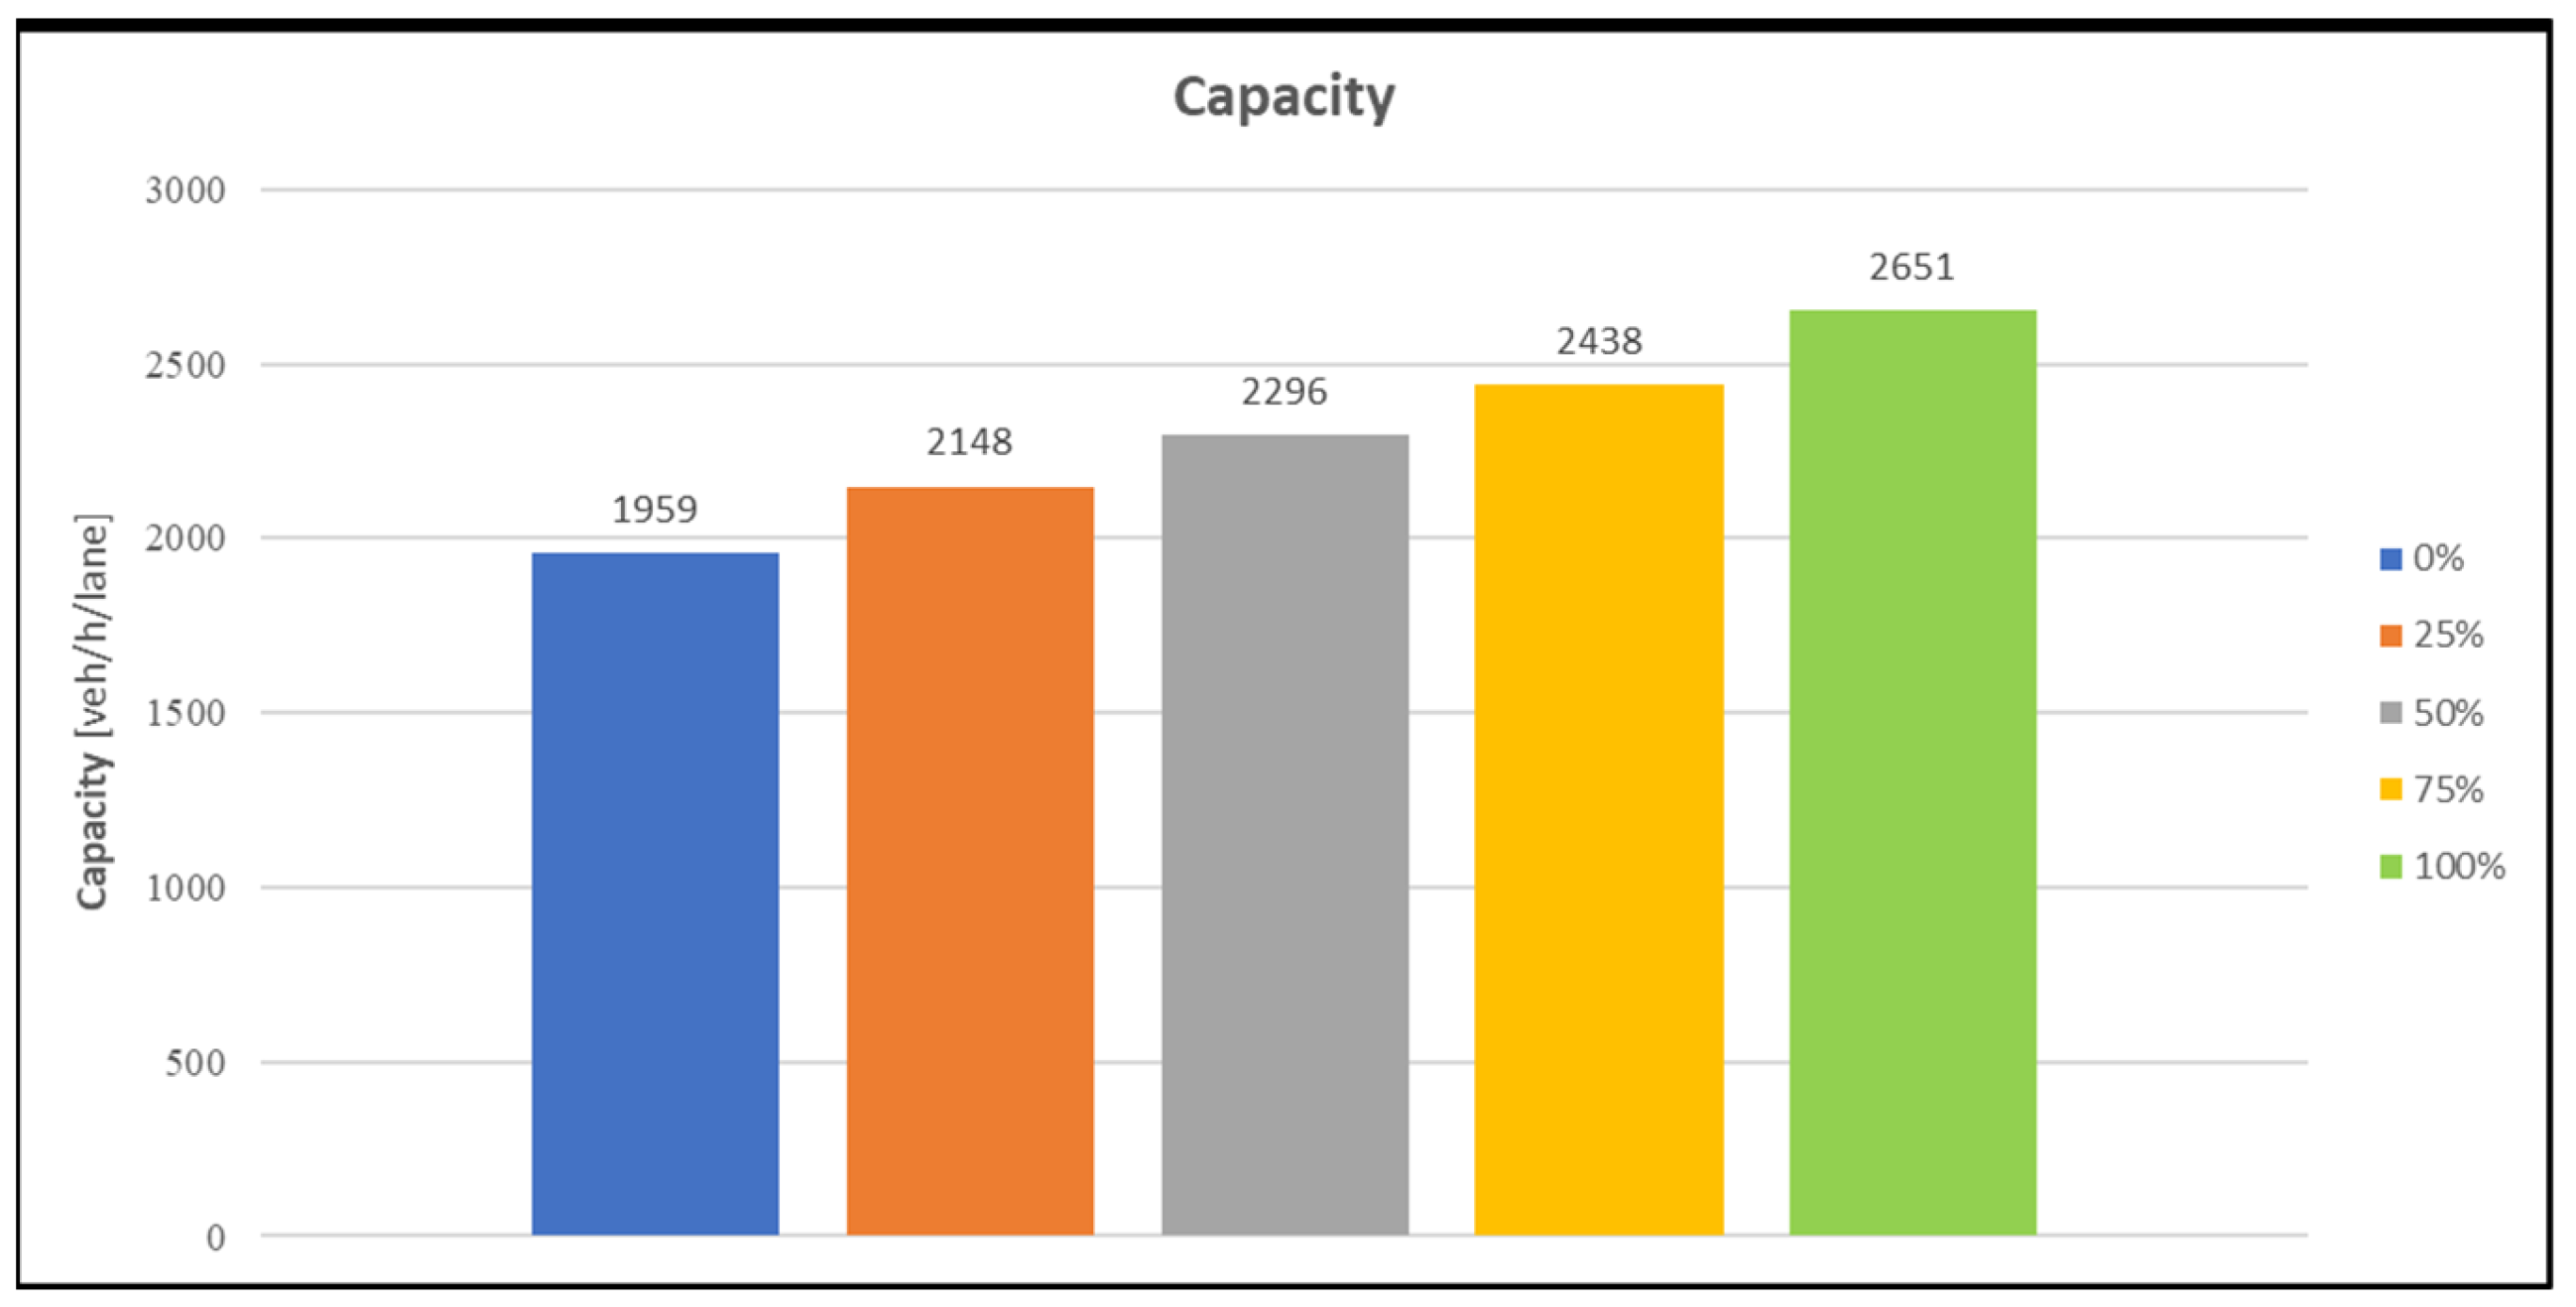
The simulations provided different values of road capacity, in accordance with the variations in the number of CAVs in the fleet. In Figure 6, the values for road capacity are shown. As the figure exhibits, road capacity progressively grows with the increase in the number of CAVs within the fleet. As already mentioned in the previous paragraph, CAVs have a tendency to travel at the same speed (typically equal to the limits imposed by the road code) and the fluidification of traffic enables the road to reach higher values of capacity. The phenomenon of platooning has to be considered, as the reduction in spacing and headway between two consecutive vehicles allows for an increment in the number of vehicles that cross a road segment in a specific time interval.
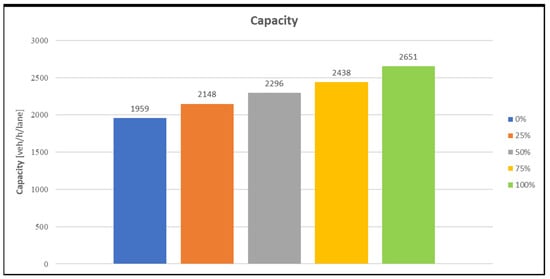
Figure 6.
Values of road capacity per lane when the degree of penetration of CAVs increases [40].
4.1.3. Variations in Travel Times
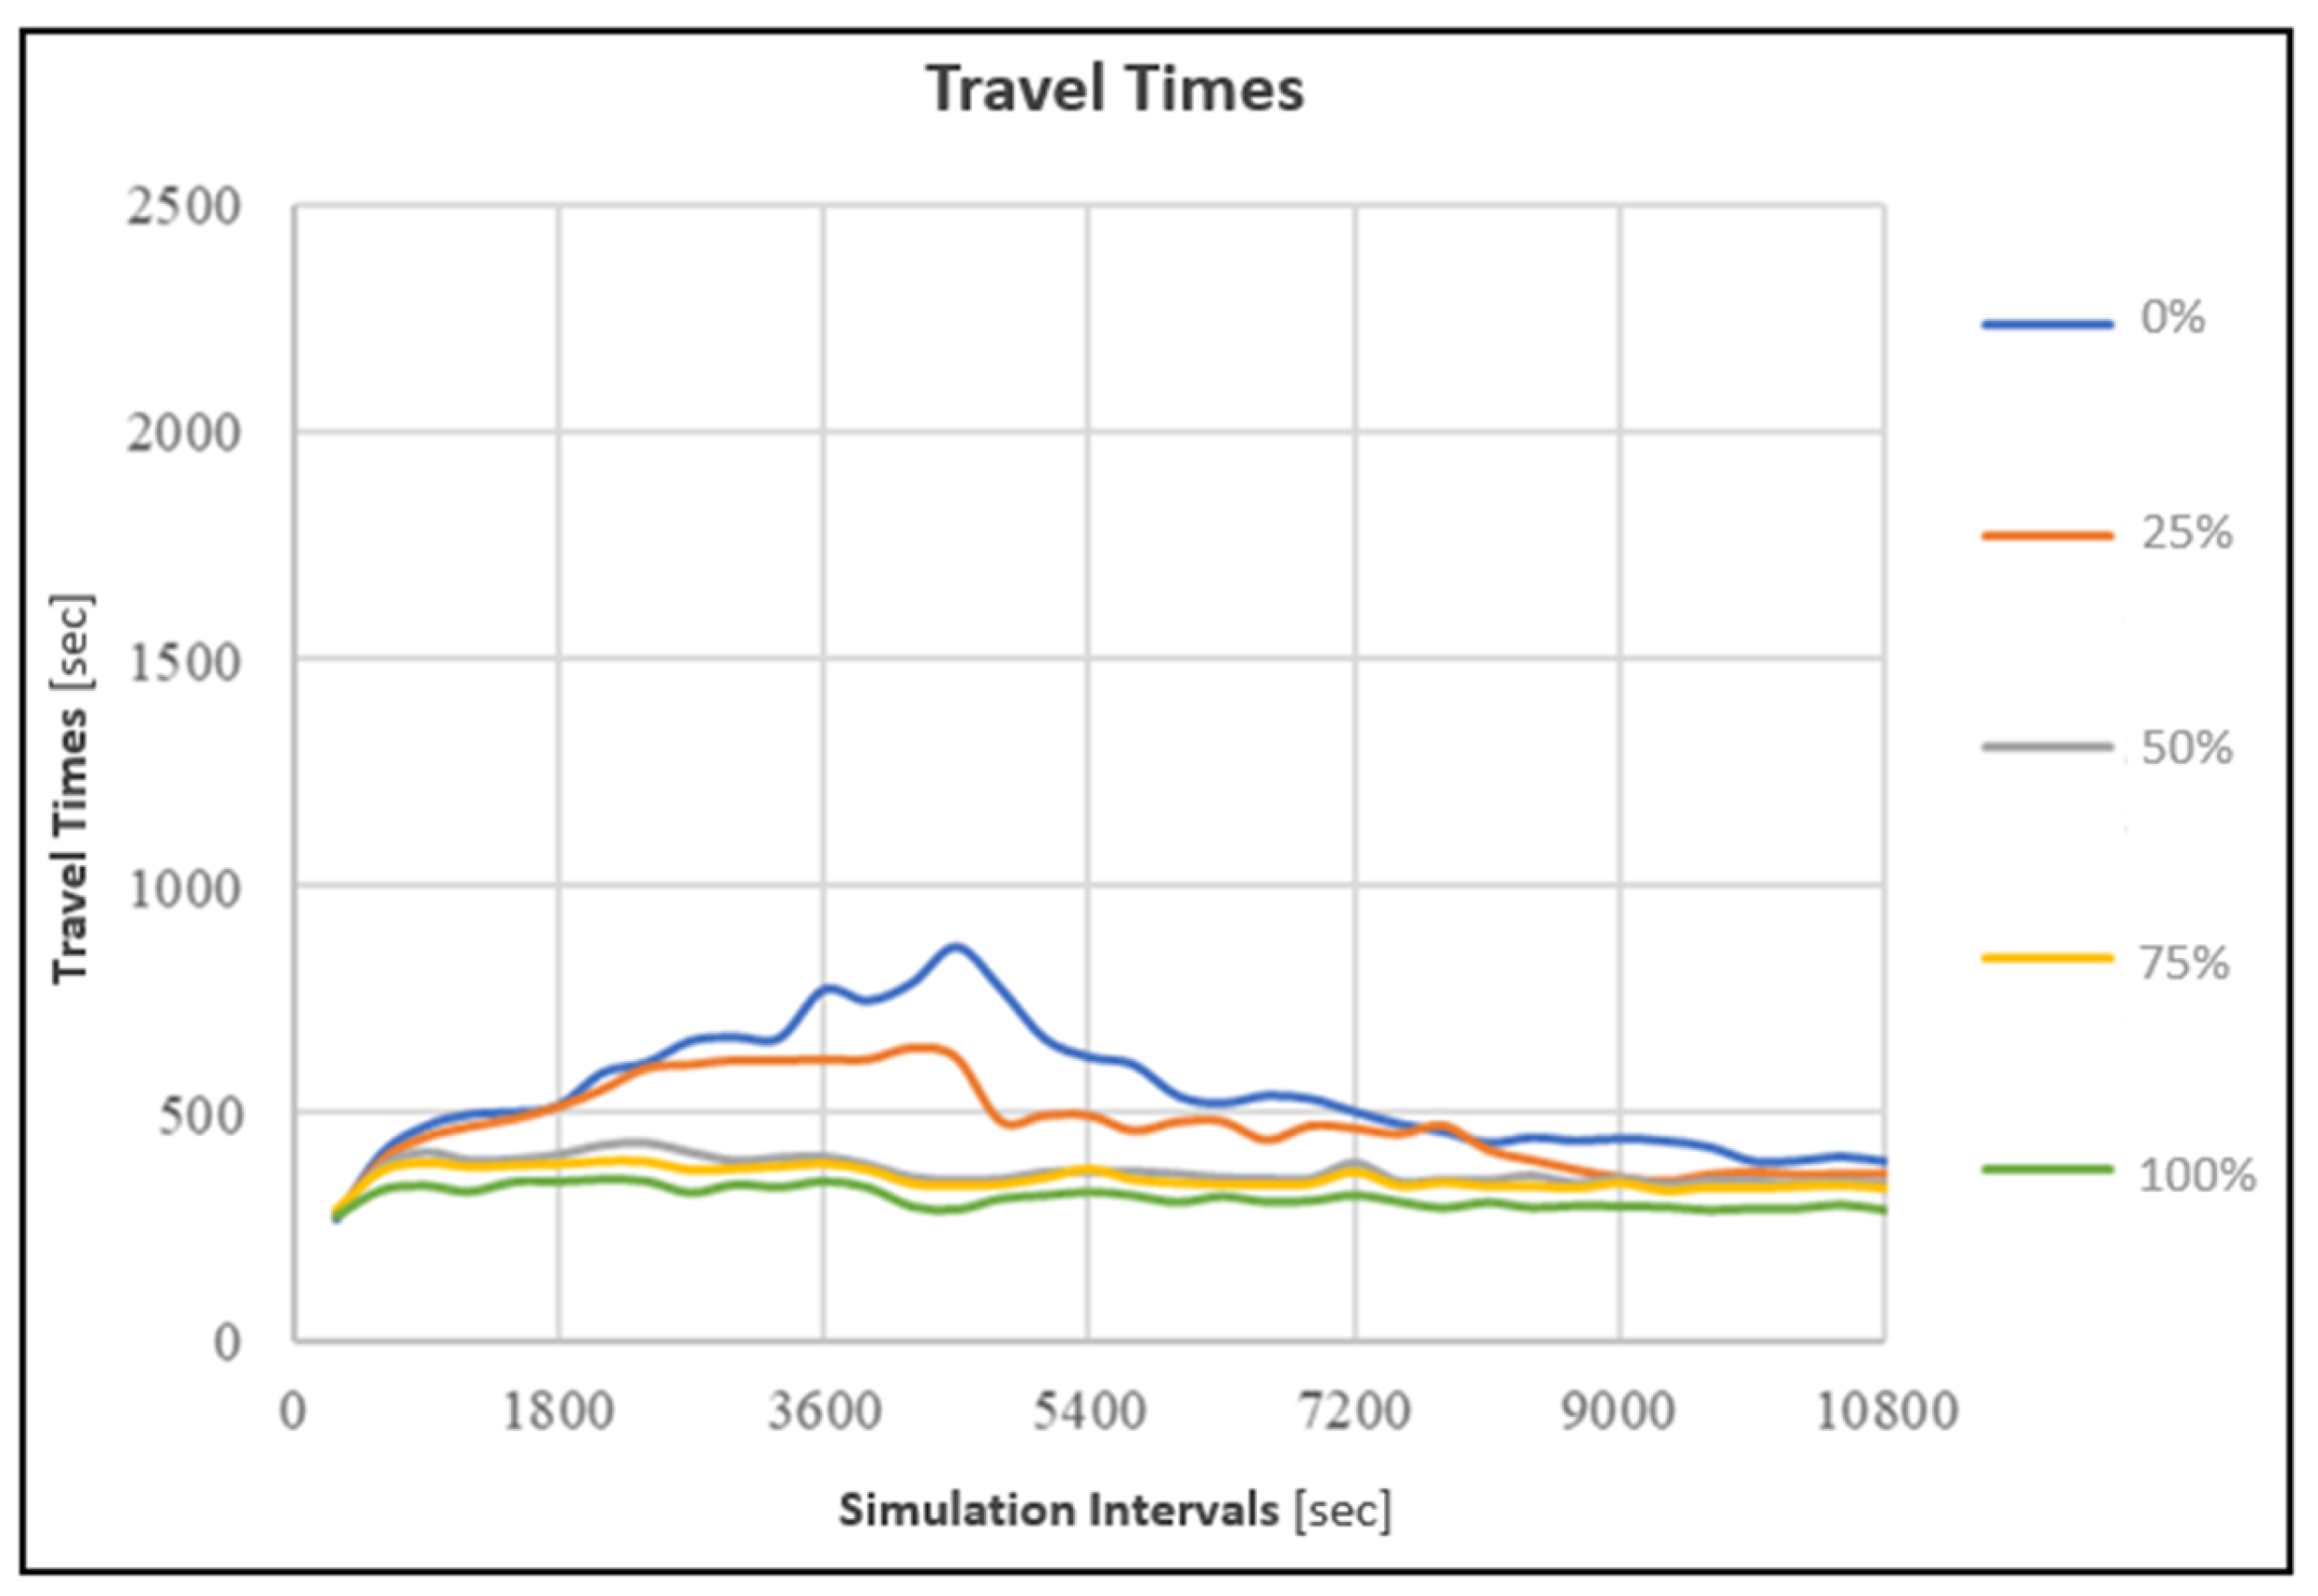
The other output derived from the microsimulation of the GRA quadrant is composed of travel times for the road which is the subject of study. The south-bound direction values are reported in Figure 7.
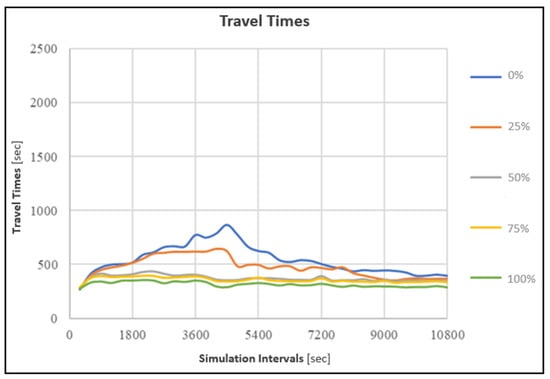
Figure 7.
Travel time variation with the increase in penetration of CAVs [40].
Travel times exhibit a clear decrease when the number of CAVs grows within the fleet. The reason for this trend can be found in the fluidification of traffic induced by the diffusion of connected and autonomous vehicles.
4.2. Assessment of Energy Consumption
The assessment of energy consumption was carried out individually for each link listed before. The idea was to study the trend of the EC, not only with the change of the vehicular fleet, but also in different conditions of mixed traffic (with congested and non-congested links).
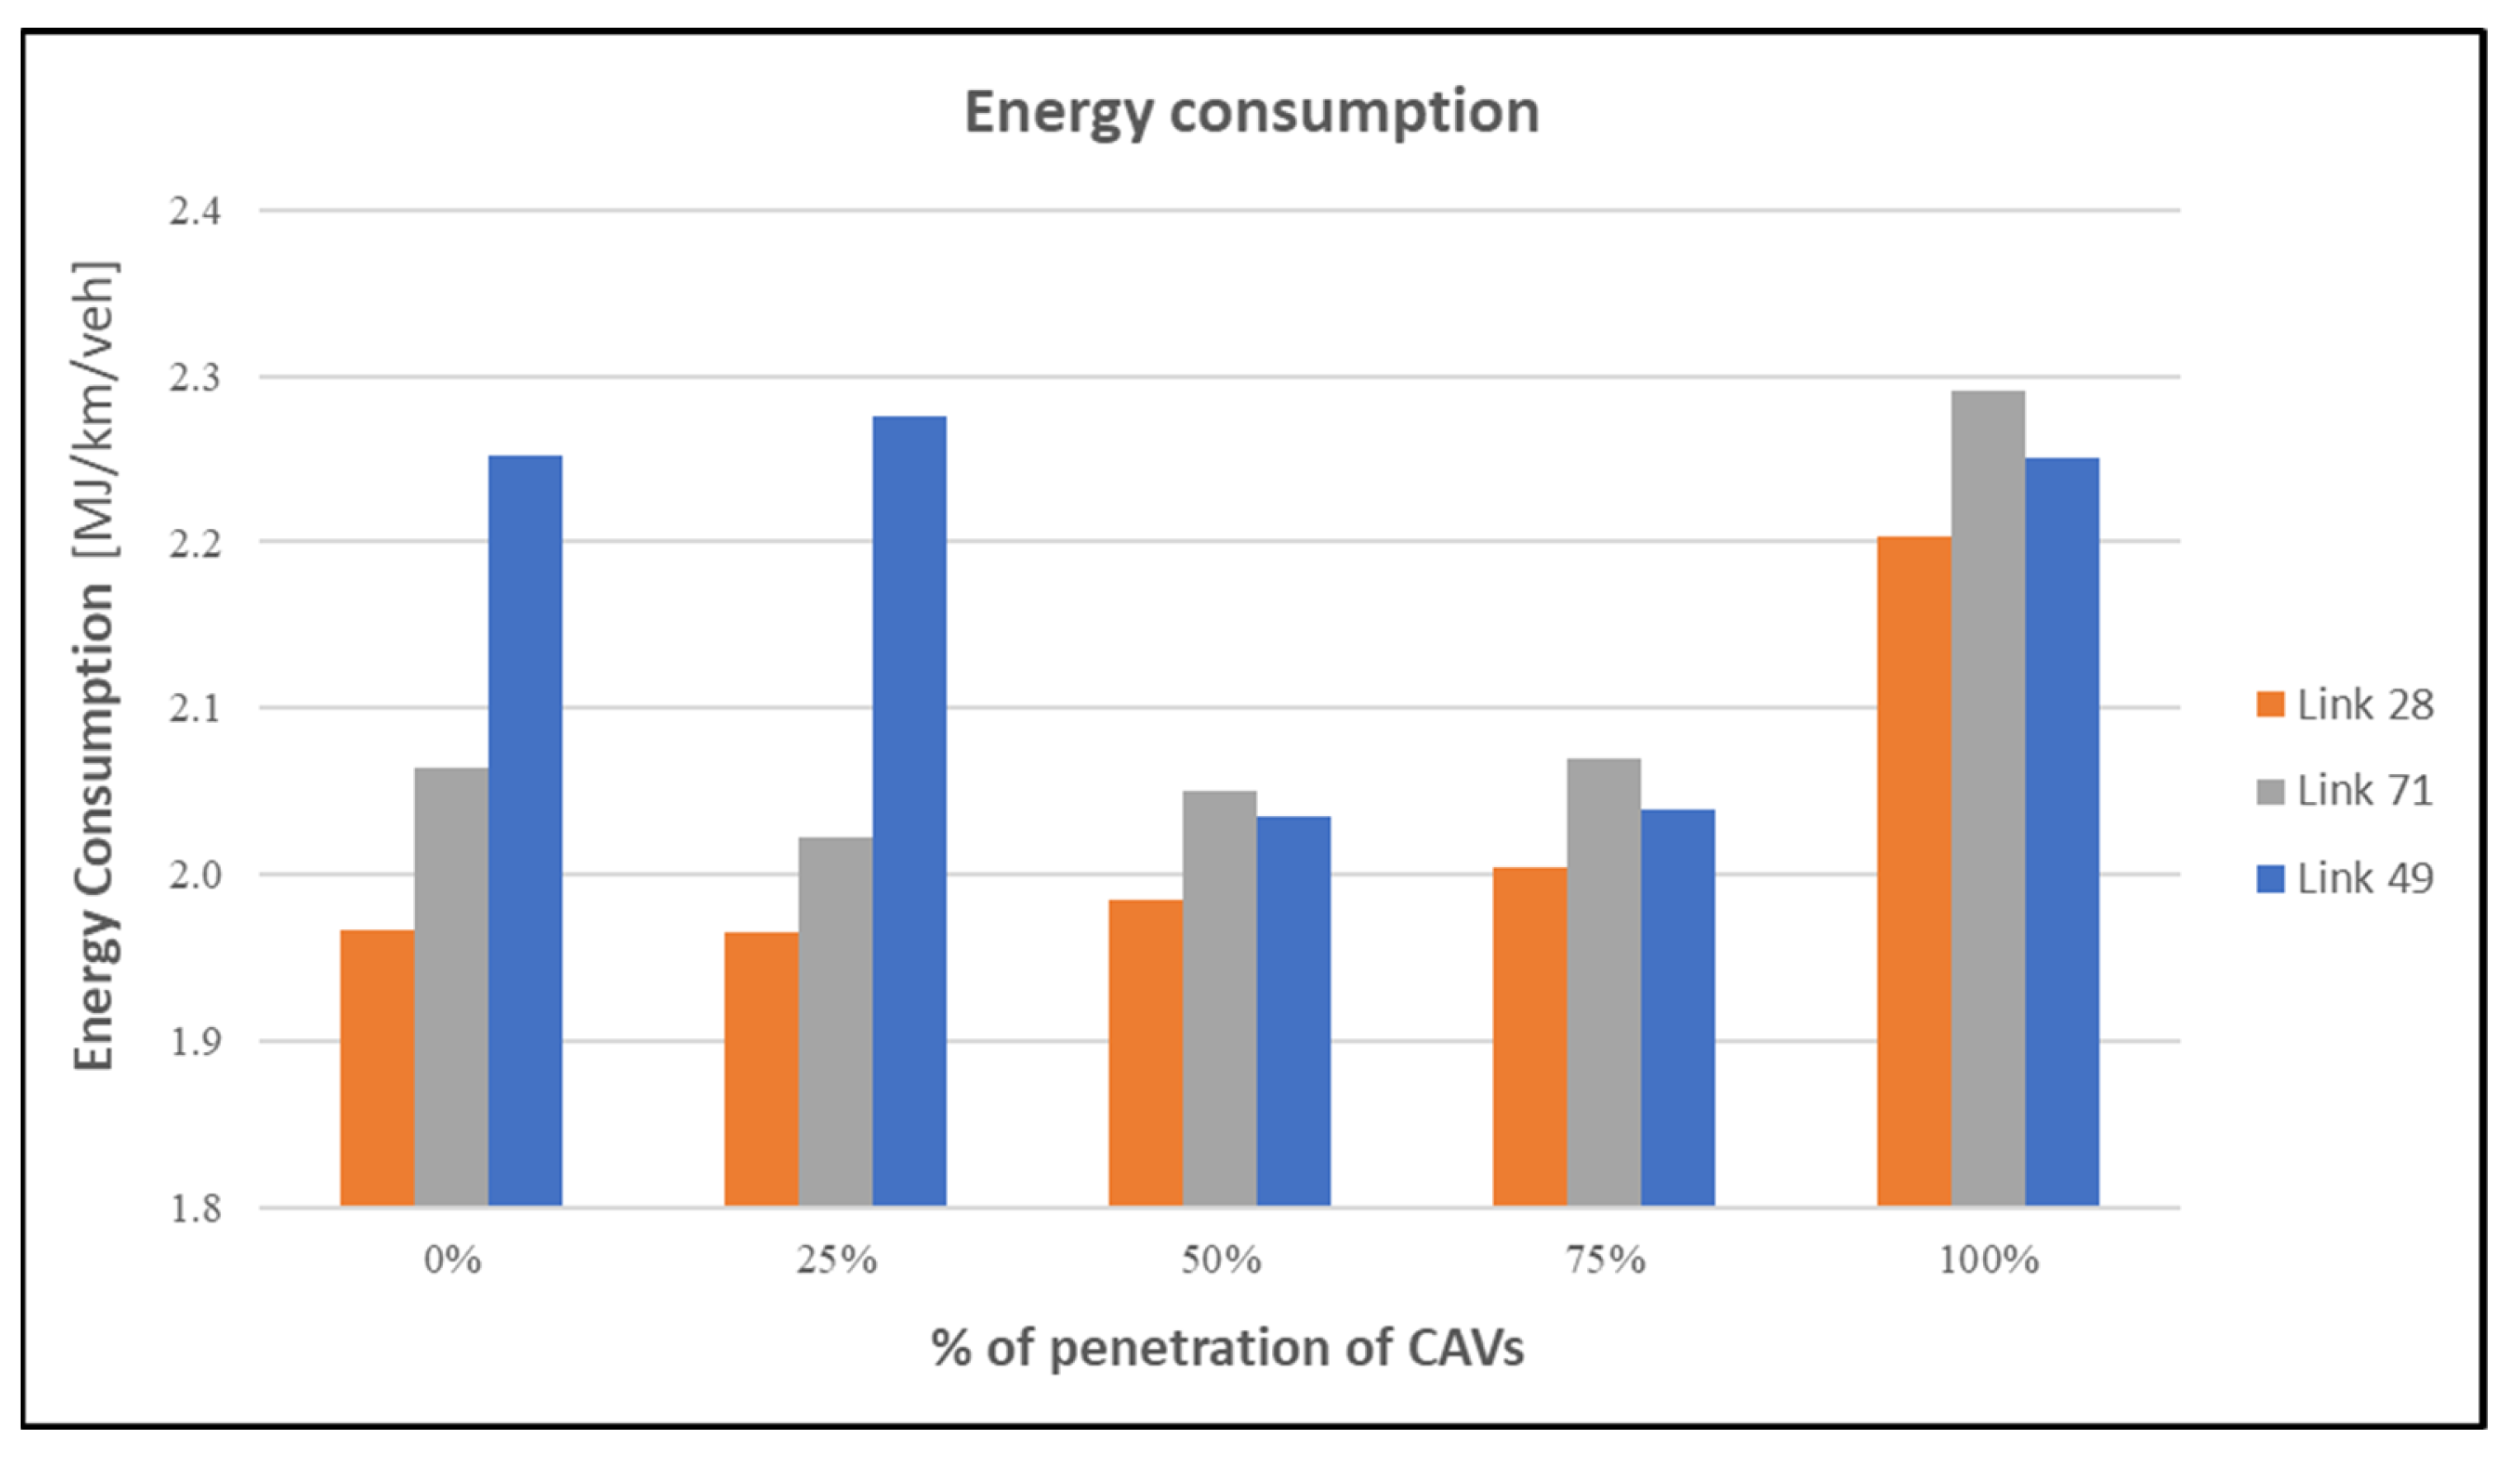
The estimation of EC for a single vehicle, calculated with Equation (7), was multiplied by the number of vehicles in every single link. This last information is given by the software, in terms of traffic volumes. In this way, the total energy consumption for each link is obtained. In Figure 8, results are shown.
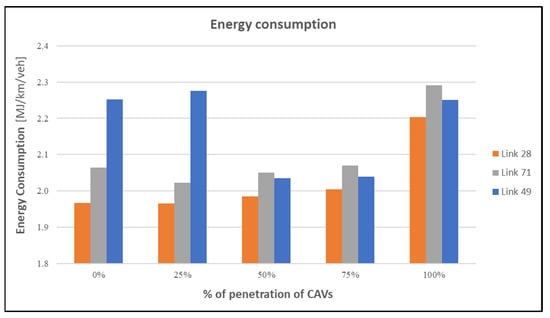
Figure 8.
Total Energy Consumption of vehicle moving in Link 28, Link 71 and Link 49.
According to the speeds listed in Table 7 and to the curve reported in Figure 5, link 28 (Ardeatina–Appia) and link 71 (Morena–Anagnina), which are part of the non-congested sections of the GRA, exhibit slightly lower values of fuel consumption when speeds fluctuate around the value of 80 km/h, near the EC curve’s minimum. Both the links show a drastic rise in the values corresponding to a fleet composed of 100% automated vehicles, when speeds reach the highest values. A slight difference can be observed on the last link, identified by the number 49 (Tuscolana—A1), which, at the start of the simulation time, was already congested. The decrease in the EC indicator is registered until the penetration of CAVs reaches 75% of the total fleet, and when the consumption increases again its value for the highest speed is slightly lower than in the first two scenarios (0% and 25% CAV).
5. Discussion
The results of this study confirm the positive effects of fully-automated CAVs on traffic fluidification, which can be seen in each scenario. With a low penetration degree of CAVs (equal to 25% of the total fleet), an initial benefit can be appreciated, which continues to increase when the number of CAVs reaches half of the total fleet; this is where the interferences between the two driving styles are reduced, and the CAVs begin to be affected by the platooning phenomena. In scenarios with higher levels of CAV penetration, improvements in performances become more evident, especially for the 100% CAV scenario, where speeds increase by 25% and 43% (for links 28 and 71, respectively), in normal motorway flow conditions, and by 154% in congested situations (link 49).
As regards performance in terms of road capacity, the latter shows a linear trend with an increasing number of connected and autonomous vehicles in the fleet. This is probably due to the reduced CAV reaction time, which allows for a reduced headway between vehicles, increasing road density and the capacity of the whole system.
Concerning environmental performances, results are not so encouraging. In fact, for non-congested links, increments in speeds greater than 25% produce higher consumptions in terms of energy. According to the COPERT model, optimal speeds for reducing energy consumption should be in the range of 70 to 90 km/h, while lower or higher speeds lead to higher values of EC. On the contrary, when the link shows an initial situation of congestion, a CAV penetration greater than 50% leads to a drastic reduction in terms of energy consumption, but this effect disappears in an all-CAV scenario, and mean speeds exceed 110 km/h.
An indirect effect that was impossible to assess in the study, but that emerged from the findings, is the possibility of an increasing willingness to use cars instead of public transport because of the benefits of CAVs on traffic fluidification. Moreover, the potential urban sprawl due to the users’ willingness to travel longer distances, caused by the comfort of travel that CAVs offer, could add further consumption.
6. Conclusions
This study highlights how the diffusion of fully-automated CAVs can produce both positive and negative effects, depending on the degree of congestion. This confirms that the analyses that can be found in literature are still debatable. The fact that CAVs help to improve the environmental sustainability of private transport in cases of dense traffic is straightforward, but the results show that the effects can vary for less-congested situations, overturning the initial expectations.
The outcomes of the analysis highlight how the deployment of CAVs can improve the general and environmental performances of private transport, due to their connection and cooperation capabilities, reducing congestion and, consequently, GHG emissions. This effect can be appreciated in mixed-traffic situations for a number of CAVs equal to or greater than 50%. However, for low-congested situations, such environmental benefits are not to be taken for granted. In fact, as the results show, increases in speed are registered and energy consumption tends to grow. Other consumptions due to the possible increment in travel demand or in distance travelled should be added. However, even in congested situations, when the congestion is relieved, the negative effect due to higher speed occurs again.
In the future, it is hoped that the potential of CAVs will be exploited in order to implement new policies based on achieving an optimal system. Establishing a regulatory framework that can take into account both the positive and negative effects of CAVs is essential for policy makers, with the aim of achieving a balance between the performance indicators (e.g., traffic flow or travel times) and environmental indicators (e.g., EC, GHG and other pollutant emissions). This optimal system should be aimed at maximizing the whole sustainability of the transportation system, involving environmental, social, and economic factors. A possible strategy suggested by the results could be to reduce the speed limit by finding the right trade-off between network performance and power consumption, a study that would warrant careful evaluation.
The limitations of this study can be summarized in the following points:
- COPERT methodology, although used everywhere in Europe, as validated by the European Union, does not take into account the reduction of speed variability when CAVs are present. In fact, the COPERT model was calibrated with typical human driving styles, with a highly variable speed between each driving cycle. This variability is assumed to be significantly reduced with the spread of CAVs, so the need for calibrating a new model with these new driving cycles becomes evident;
- Future Scenarios will be characterized by new vehicular fleets with new technological equipment and, probably, new vehicle design, but these aspects cannot be considered beforehand. For these reasons, the analysis was conducted with only one vehicle composition.
These limitations and conclusions suggest perspectives on future developments in this work:
- Assess the environmental impact more accurately by considering the variation in speed within the flow;
- Adapt the methodology so that it is independent of the engine technology used;
- Simulate and evaluate different policies to balance performance with sustainability.
In conclusion, it is possible to state that CAVs should be seen as an opportunity to improve the environmental sustainability of the system, but a prudent management of the network based on an optimal system is needed, in order to create new policies capable of maximizing the whole sustainability of a transport system where CAVs are intended to be widely diffused.
Author Contributions
Conceptualization, A.G., T.O. and S.C.; data curation, A.G., T.O. and S.C.; formal analysis, A.G., T.O. and S.C.; investigation, A.G., T.O. and S.C.; methodology, A.G., T.O. and S.C.; software, A.G., T.O. and S.C.; validation, A.G., T.O. and S.C.; visualization, A.G., T.O. and S.C.; writing—original draft, A.G., T.O. and S.C.; writing—review and editing, A.G., T.O. and S.C. All authors have read and agreed to the published version of the manuscript.
Funding
This research received no external funding.
Institutional Review Board Statement
Not applicable.
Informed Consent Statement
Not applicable.
Data Availability Statement
Third Party Data.
Conflicts of Interest
The authors declare no conflict of interest.
References
- Makridis, M.; Mattas, K.; Mogno, C.; Ciuffo, B.; Fontaras, G. The impact of automation and connectivity on traffic flow and CO2 emissions. A detailed microsimulation study. Atmos. Environ. 2020, 226, 117399. [Google Scholar] [CrossRef]
- Rios-Torres, J.; Malikopoulos, A.A. Impact of Partial Penetrations of Connected and Automated Vehicles on Fuel Consumption and Traffic Flow. IEEE Trans. Intell. Veh. 2018, 3, 453–462. [Google Scholar] [CrossRef]
- Yazdizadeh, A.; Farooq, B. Smart Mobility Ontology: Current Trends and Future Directions. In Handbook of Smart Cities; Springer: Berlin/Heidelberg, Germany, 2021. [Google Scholar]
- Holmberg, P.; Collado, M.; Sarasini, S.; Williander, M. Mobility as a Service—Maas, Describing the Framework; Vinnova Project; Swedish Viktoria: 2016; Vinnova Project; Swedish Viktoria: Stockholm, Sweden, 2016. [Google Scholar]
- Faisal, A.; Yigitcanlar, T.; Kamruzzaman, M.; Currie, G. Understanding autonomous vehicles: A systematic literature review on capability, impact, planning and policy. J. Transp. Land Use 2019, 12, 47–72. [Google Scholar] [CrossRef]
- Patella, S.M.; Scrucca, F.; Asdrubali, F.; Carrese, S. Carbon Footprint of autonomous vehicles at the urban mobility system level: A traffic simulation-based approach. Transp. Res. Part D Transp. Environ. 2019, 74, 189–200. [Google Scholar] [CrossRef]
- Carrese, S.; Nigro, M.; Patella, S.M.; Toniolo, E. A preliminary study of the potential impact of autonomous vehicles on residential location in Rome. Res. Transp. Econ. 2019, 75, 55–61. [Google Scholar] [CrossRef]
- Kopelias, P.; Demiridi, E.; Vogiatzis, K.; Skabardonis, A.; Zafiropoulou, V. Connected & autonomous vehicles—Environmental impacts—A review. Sci. Total Environ. 2020, 712, 135237. [Google Scholar] [CrossRef] [PubMed]
- SAE International. Available online: https://www.sae.org/ (accessed on 3 February 2023).
- SAE International. Available online: https://www.sae.org/standards/content/j3016_202104/ (accessed on 3 February 2023).
- McCall, R.; McGee, F.; Mirnig, A.; Meschtscherjakov, A.; Louveton, N.; Engel, T.; Tscheligi, M. A taxonomy of autonomous vehicle handover situations. Transp. Res. Part A 2019, 124, 507–522. [Google Scholar] [CrossRef]
- Lu, N.; Cheng, N.; Zhang, N.; Shen, X.; Mark, J.W. Connected Vehicles: Solutions and Challenges. IEEE Internet Things J. 2014, 1, 289–299. [Google Scholar] [CrossRef]
- Lempert, R.J.; Preston, B.; Charan, S.M.; Fraade-Blanar, L.; Blumenthal, M.S. The societal benefits of vehicle connectivity. Transp. Res. Part D 2021, 93, 102750. [Google Scholar] [CrossRef]
- Rojas-Rueda, D.; Nieuwenhuijsen, M.J.; Khreis, H.; Frumkin, H. Autonomous Vehicles and Public Healt. Annu. Rev. Public Health 2020, 41, 329–345. [Google Scholar] [CrossRef] [PubMed]
- Taiebat, M.; Brown, A.L.; Safford, H.R.; Qu, S.; Xu, M. A Review on Energy, Environmental, and Sustainability Implications of Connected and Automated Vehicles. Environ. Sci. Technol. 2018, 52, 11449–11465. [Google Scholar] [CrossRef] [PubMed]
- Wang, N.; Wang, X.; Palacharla, P.; Ikeuchi, T. Cooperative Autonomous Driving for Traffic Congestion Avoidance through Vehicle-to-Vehicle Communications. In Proceedings of the IEEE Vehicular Networking Conference (VNC), Turin, Italy, 27–29 November 2017. [Google Scholar] [CrossRef]
- Adacher, L.; Cipriani, E. A surrogate approach for the global optimization of signal settings and traffic assignment problem. In Proceedings of the 13th International IEEE Conference on Intelligent Transportation Systems, Funchal, Portugal, 19–22 September 2010; pp. 60–65. [Google Scholar] [CrossRef]
- Anderson, J.M.; Kalra, N.; Stanley, K.D.; Sorensen, P.; Samaras, C.; Oluwatola, O.A. Autonomous Vehicle Technology—A Guide for Policymakers; RAND Corporation: Santa Monica, CA, USA, 2016. [Google Scholar]
- Milakis, D.; van Arem, B.; van Wee, B. Policy and society related implications of automated driving: A review of literature and directions for future research. J. Intell. Transp. Syst. Technol. Plan. Oper. 2017, 21, 324–348. [Google Scholar] [CrossRef]
- Pakusch, C.; Stevens, G.; Bossauer, P. Shared Autonomous Vehicles: Potentials for a Sustainable Mobility and Risks of Unintended Effects. EPiC Ser. Comput. 2018, 52, 258–269. [Google Scholar]
- Zong, S. How Connected Autonomous Vehicles Would Affect Our World?—A Literature Review on the Impacts of CAV and Road Capacity, Environment and Public Attitude. In Proceedings of the MATEC Web of Conferences, ICTLE 2019, Paris, France, 21–23 August 2019; Volume 296. [Google Scholar]
- Litman, T.B. Autonoums Vehicle Implementation Predictions; Victoria Transport Policy Institute: Victoria, BC, Canada, 2017. [Google Scholar]
- Lee, C.W.; Madnick, S. Cybersafety Approach to Cybersecurity Analysis and Mitigation for Mobility-as-a-Service and Internet of Vehicles. Electronics 2021, 10, 1220. [Google Scholar] [CrossRef]
- Pandey, M.; Seetharaman, R. A review of factors imoacting Cybersecurity in Connected and Autonomous Vehicles (CAVs). In Proceedings of the 8th International Conference on Control, decision and Information Technologies (CoDIT’2022), Instanbul, Turkey, 17–20 May 2022. [Google Scholar] [CrossRef]
- Collingwood, L. Privacy implications and liability issues of autonomous vehicles. Inf. Commun. Technol. Law 2017, 26, 32–45. [Google Scholar] [CrossRef]
- Barth, M.; Boriboonsomsin, K.; Wu, G. Vehicle Automation and Its Potential Impacts on Energy and Emissions. In Road Vehicle Automation; Meyer, G., Beiker, S., Eds.; Springer: Cham, Switzerland, 2014; pp. 103–112. [Google Scholar] [CrossRef]
- Cipriani, E.; Fusco, G.; Gori, S.; Petrelli, M. Heuristic methods for the optimal location of road traffic monitoring. In Proceedings of the 2006 IEEE Intelligent Transportation Systems Conference, Toronto, ON, Canada, 17–20 September 2006; pp. 1072–1077. [Google Scholar] [CrossRef]
- Hwang, H.; Song, C. Changes in air pollutant emissions from road vehicles due to autonomous driving technology: A conceptual modeling approach. Environ. Eng. Res. 2019, 25, 366–373. [Google Scholar] [CrossRef]
- Ding, H.; Pan, H.; Bai, H.; Zheng, X.; Chen, J. Driving strategy of connected and autonomous vehicles based on multiple preceding vehicles state estimation in mixed vehicular traffic. Phys. A 2022, 596, 127154. [Google Scholar] [CrossRef]
- Fang, X.; Li, H.; Tettamanti, T.; Eichberger, A.; Fellendorf, M. Effects of Automated Vehicle Models at the Mixed Traffic Situation on a Motorway Scenario. Energies 2022, 15, 2008. [Google Scholar] [CrossRef]
- Wiedemann, R. Simulation des Strassenverehrsflusses; Technical report; Institute for Traffic Engineering, University of Karlsruhe: Karlsruhe, Germany, 1974. [Google Scholar]
- Arvin, R.; Khattak, A.J. Safety evaluation of connected and automated vehicles in mixed traffic with conventional vehicles at intersections. J. Intell. Transp. Syst. Technol. Plan. Oper. 2020, 25, 170–187. [Google Scholar] [CrossRef]
- Gipps, P.G. A model for the structure of lane-changing decisions. Transp. Res. Part B Methodol. 1986, 20, 403–414. [Google Scholar] [CrossRef]
- Akcelik, R. A Review of Gap-Acceptance Capacity Models. In Proceedings of the 29th Conference of Australian Institutes of Transport Research (CAITR 2007), University of South Australia, Adelaide, Australia, 5–7 December 2007. [Google Scholar]
- CoEXist. Available online: https://www.h2020-coexist.eu/ (accessed on 8 February 2023).
- Sukennik, P. Micro-Simulation Guide for Automated Vehicles. 2018. Available online: https://www.h2020-coexist.eu/wp-content/uploads/2018/11/D2.5-Micro-simulation-guide-for-automated-vehicles.pdf (accessed on 20 April 2023).
- Gemma, A.; Cipriani, E.; Crisalli, U.; Mannini, L. Automated Vehicles’ Effects on Urban Traffic Flow Parameters. In Smart Energy for Smart Transport; Nathanail, E.G., Gavanas, N., Adamos, G., Eds.; CSUM 2022, Lecture Notes in Intelligent Transportation and Infrastructure; Springer: Cham, Switzerland, 2023. [Google Scholar] [CrossRef]
- EMEP/EEA. Air Pollutant Emission Inventory Guidebook; European Environment Agency: Copenhagen, Denmark, 2019. [Google Scholar]
- Emisia. Conscious of Transport’s Impact. Available online: https://www.emisia.com/utilities/copert/ (accessed on 20 April 2023).
- Marin, F. Analisi Delle Prestazioni del Deflusso Extraurbano in Presenza di Veicoli Autonomi E Connessi. Master’s Thesis, Roma Tre University, Rome, Italy, 2020. [Google Scholar]
- Transport for London. Traffic Modelling Guidelines, Version 4.0; Beeston, L., Blewitt, R., Bulmer, S., Wilson, J., Eds.; Transport for London: London, UK, 2021.
- PTV AG. PTV Vissim 2020 User Manual; PTV AG: Karlsruhe, Germany, 2020. [Google Scholar]
Disclaimer/Publisher’s Note: The statements, opinions and data contained in all publications are solely those of the individual author(s) and contributor(s) and not of MDPI and/or the editor(s). MDPI and/or the editor(s) disclaim responsibility for any injury to people or property resulting from any ideas, methods, instructions or products referred to in the content. |
© 2023 by the authors. Licensee MDPI, Basel, Switzerland. This article is an open access article distributed under the terms and conditions of the Creative Commons Attribution (CC BY) license (https://creativecommons.org/licenses/by/4.0/).


