Abstract
To determine why drop and pull transport is developing so slowly in China and whether there is a chance for its further development, this paper formulates a model to compute two threshold values of freight demand, namely the value that makes drop and pull transport profitable and the value at which it is more profitable than traditional truck transport. The results indicates that the most favorable freight market for drop and pull transport has a demand distribution in which most demand is concentrated on a few highway corridors and approximately equal in both directions along each corridor. Based on a comparison between the computed results and the actual demand distribution, it is found that the current Chinese highway freight market is not ideal for fostering drop and pull transport. The results further indicate that specific model markets should be selected for trial drop and pull transport. Since drop and pull transport will only be successful in a market with favorable freight demand distribution, successful attempts in model markets are the key to expanding the use of drop and pull transport.
1. Introduction
Currently, in China, there are five kinds of drop and pull transport: end-to-end (two nodes and one link), hub-and-spoke (one node and multi links), loop, network, and combinations of the above. Therefore, network-based drop and pull transport is usually organized with one or more depots and several nodes. The depots are used for parking and maintaining tractors/trailers, while the other nodes store full/empty trailers waiting to be transported. Network drop and pull transport is best applied in a mature highway transport system that covers a wide range of areas, supports a large volume of freight demand, and offers balanced freight flows. Compared to traditional truck transport, drop and pull transport has many advantages, including lower logistics cost, higher transport efficiency, more favorable energy conservation and emission reduction, and the advancement of multimodal transport [1,2,3].
Today, there are only a few large-scale enterprises in China running highway freight businesses. Most of the personnel in this industry are small individual operators who have only one or a few trucks. Overall, the highway freight industry has remained small, decentralized, and weak in China. Transport capacity, freight demand, and information are not well-integrated, which restricts the advantages of drop and pull transport [4]. To boost the development of drop and pull transport, China launched three campaigns to promote semitrailer transport during 2010 to 2013. In 2016, the initial work of promoting drop and pull transport came to an end, and China stepped into Era 2.0 of drop and pull transport [5]. Compared to the highly developed drop and pull transport system in Europe or North America, China is significantly behind. In China, the utilization of vehicles and the coordination between tractors and trailers are both relatively low [6,7]. The intensive operational advantage of drop and pull transport has not been realized in China; thus, most freight carriers still prefer traditional transport modes [8].
Freight origins/destinations, direction, and volumes are also critical limitations on the growth of drop and pull transport in China, despite trial attempts and favorable policies from the Chinese government. In the past 30 years, since China’s government initiated the reform and opening-up policy, export-oriented economies and urbanization have become two pillars of economic development in China. Therefore, freight (especially that suitable for drop and pull transport) usually flows from the hinterland to gate ports and from numerous villages/towns/small cites to megacities. The freight flow is extremely unbalanced. The unbalanced flow can also be seen in the container transport between China and the USA/Europe, the dry bulk transport between China and Australia/Brazil, and the crude oil transport between China and the Middle East/Africa [9].
In summary, the limitations on drop and pull transport in China arise not only from the supply side but also from the demand side of highway freight transport [10]. Therefore, the authors hold the opinion that the slow development of drop and pull transport in China is mainly caused by the immature market mechanisms. In an economically immature market, it is difficult for favorable policies to work as expected because supported carriers are unable to change the supply and demand in the market in the short term. That is, the experimental carriers cannot cultivate demand that is timely and spatially suitable for drop and pull transport. As a result, the experimental carriers cannot maintain drop and pull transport once the favorable policies disappear, and they must restore traditional transport. Against such a background, it is important to analyze the sufficient conditions to implement drop and pull transport from the aspect of highway freight demand and then determine a demand structure suitable for drop and pull transport [11,12]. This paper presents a mathematical model to describe the mechanism of the drop and pull transport market. Based on a numerical analysis by the model, the research explores the market demand conditions under which drop and pull transport will achieve healthy growth. The aim of this paper is to lay a theoretical foundation for policymakers to help them initiate more accurate and effective policies in Era 2.0 of drop and pull transport in China.
The remaining sections of this paper are organized as follows. In Section 2, the paper reviews previous work on this topic and explains the contribution made by this paper. In Section 3, a more specific description of the problem of drop and pull transport is provided. In Section 4, a freight demand matrix is established to analyze the demand floor at which drop and pull transport makes a profit. In Section 5, the paper formulates a model to find the minimum freight volume above which drop and pull transport will make a greater profit than other highway transport modes. In Section 6, this paper takes a medium-scale transport operator A in Liaoning Province (China) as an example of an operator of drop and pull transport for the numerical analysis, and obtains the threshold values of freight demand of drop and pull transport profit. In Section 7, this paper uses the single-bound gravity model to estimate the origin–destination (OD) volumes of highway freight in five cities and analyzes the reasons for the slow development of drop and pull transport in Liaoning Province. Finally, the conclusion and future research directions are provided in Section 8.
2. Literature Review
The theoretical and practical study of drop and pull transport has caught the interest of many researchers and practitioners. The existing studies are roughly divided into three categories, namely, the research on transportation profits, the scheduling problems of drop and pull transport, and routing optimization.
The first type is mainly focused on economic benefits. The development of drop and pull transport has been pushed by growing freight demand. Drop and pull transport, however, is not always the best mode to satisfy all kinds of transport demand—only under certain conditions will drop and pull transport achieve economic benefits and be profitable. These conditions include stable and sufficient freight sources, long loading/unloading times, optimal transport distances, and standard vehicles and stations [13]. According to Gao [14], the availability of an adequate supply of goods is crucial for the success of drop and pull transport and essential for reaping its economic benefits. It ensures the smooth and efficient execution of drop and pull transport and enhances the cooperation efficiency between tractors and trailers. Zheng [15] asserted that drop and pull transport significantly enhances vehicle utilization and reduces operational costs for transportation companies. It offers distinct advantages over traditional truck transport. Duan [16] pointed out that if there is a large demand for freight transport and drop and pull transport is fully realized, enterprises can reduce more than 50% of the purchase cost or leasing fees of tractors, the average vehicle capacity can be increased by 30–50%, the transport cost can be reduced by 30–40%, and the fuel consumption can be reduced by 20–30%, achieving higher income than traditional vehicle transport. To improve the transport efficiency of 10 categories of goods, Beuthe et al. [17] proposed a multimodal network optimization model to minimize the generalized transport cost. Pei et al. [18] established a cost structure for drop and pull transport and proposed methods to compute its various costs. Based on the cost structure of drop and pull transport, Li and Wang [19] formulated the transport fixed and variable costs to construct an economic accounting model and found in the empirical study that drop and pull transport could reduce costs by approximately 1/3 compared to traditional transport modes. Similarly, Xue et al. [20] also analyzed the economic benefit of drop and pull transport considering fixed and variable costs and then further analyzed its social benefit in terms of energy consumption and CO2 emissions, confirming the advantages of drop and pull transport in energy conservation, emission reduction, and economic and social benefits. Wu et al. [21] established a profit model and a cost model to compute the dominant distance for drop and pull transport when competing with railway transport. According to their calculation, the dominant distance for drop and pull transport is 49–468 km, indicating that drop and pull transport is more competitive in short or medium distance ranges, but will have lower economic benefits than railways when the transport distance exceeds its optimal distance range. To control vehicle purchase costs and improve the drop and pull transport efficiency, Geng and Zhang [22] proposed a method to calculate the optimal number of trailers for the drop and pull modes of client end transport, container transport, full truckload transport, and three-point circulation transport. Soares et al. [23] established a novel mixed-integer programming model that can significantly decrease the logistics costs of full truckload pickup and delivery problems, with multiple vehicle synchronization, and designed an algorithm to solve the model based on fix-and-optimize principles under a variable neighborhood decomposition search. Most of the existing studies on truck transport efficiency assume that trucks have fixed unloading times, while Tadumadze et al. [24] think differently because workforce managers in the real world have the flexibility to adapt more workers to process critical trucks and reduce the unloading time. Therefore, they have proposed a mixed-integer programming model that combines workforce management and truck scheduling, and the numerical results show that the integrated model can significantly reduce the total flow time and the punctuality of trucks.
The second type of research focuses attention on the vehicle scheduling problems in drop and pull transport. Guo [25] thought that the development of drop and pull transport is slow in China, and that the main reason is the lack of a reasonable, efficient, and scientific management scheme. Unlike regular cargo transportation, drop and pull transport requires a certain organization and management ability to ensure the connectivity of each link in the transportation process. Liang et al. [26] pointed out that majority of road cargo transportation enterprises in China are individual entities and require improvements in their transportation management practices. Drop and pull transport often involves cooperative arrangements among different transport enterprises, which calls for well-trained and skilled staff members. Additionally, clear rules regarding profit distribution are crucial in such collaborative operations.
The integrated scheduling problem of trucks and trailers is usually called the truck and trailer routing problem (TRP) [27]. For TRP solutions, Chao [28] developed a tabu search method in a numerical study that has proven to be an effective and efficient algorithm for solving the TRP. Lin et al. [29] employed a simulated annealing heuristic, while Batsyn and Ponomarnko [30] developed a multi-start greedy heuristic to solve the TRP. Luo [31] studied the scheduling problem of container drop and pull transport for both the one-point and multiline modes in a hub-and-spoke network. He constructed gravity models for scheduling optimization in the case of one-center and multicenter networks and adopted a simulated annealing algorithm based on heuristic rules to solve the models. Metaheuristic approaches were proposed by Mirmohammadsadeghi and Ahmed [32] to solve the TRP with stochastic demands and validated with a case from the dairy industry. Yu et al. [33] established a model based on the mathematical characteristics of the TRP and showed its potential for energy-saving and emission reductions in truck and trailer transport. Yang et al. [34] built an optimization model for the TRP with nondeterministic empty-trailer tasks in a road network and designed a two-stage heuristic approach to find the optimal solution. Their results indicated that a strategy of minimizing the total surplus of heavy trailers between the origin and destination has an obvious advantage in solving the TRP with nondeterministic empty-trailer tasks.
The integrated scheduling problem for tractors and semitrailers is called the tractor and semitrailer routing problem (TSRP). Previous studies on the TSRP have mainly focused on short- and mid- to long-distance (trunk line) transport. Short-distance transport is more common in in-plant or local transport. Due to the scale of economies, the TSRP is, however, more promising for trunk line transport [35]. Freight demand can be generated between any pair of nodes in an intercity trunk line network, which presents a many-to-many relationship [36], in contrast to the one-to-many relationship among nodes in the vehicle routing problem (VRP) [37]. Another kind of scheduling problem for tractors and semitrailers is the roll-on roll-off vehicle routing problem [38], which is derived from studies on municipal garbage transport. Empty garbage trucks go to garbage collection spots and return fully loaded to the garbage disposal center. The operation of garbage trucks is remarkably similar to that of tractors and semitrailers [39]. Ning [40] pointed out that in order to avoid the waste of vehicles caused by one-way coal transportation in Yulin, Shaanxi Province, a modern transportation system integrating passageway, outward transportation, and microcirculation is needed. Liu [41] pointed out that Shouguang, Shandong Province, sells its agricultural products to other parts of the country, but needs to prioritize the waste of transportation resources because of uneven demand for freight. Chen et al. [42] believed that vehicle scheduling should give priority to reducing the empty load rate and the empty driving distance of vehicles.
The third type of research is focused on routing optimization. Xue et al. [43] introduced temporal constraints into the classical VRP in the local container drayage problem to design a new operation mode in which tractors can transport empty containers between customers during the available idle time. Li et al. [44] developed a two-stage heuristic method to find the optimal route from the set of routes for tractors and semitrailers, and it was created with the constraint of the driver’s on-duty time. To solve the scheduling problem for container drop and pull transport, Feng et al. [45] developed a model and a simulated annealing heuristic to optimize vehicle routing in a container transport network with the constraint of a hard time window. Villegas et al. [46] proposed two heuristic algorithms based on greedy randomized adaptive search procedures, variable neighborhood descent, and evolutionary local search to solve the single truck and trailer routing problem with satellite depots. Hu and Tao [47] employed the local optimization approach 2-opt to design an optimal hybrid route for trucks with a single/double trailer.
From the above, it can be seen that the existing literature has devoted much work to economic benefit analysis, scheduling, and routing optimization for drop and pull transport, with the assumption that freight demand spontaneously satisfies the basic condition for operating drop and pull transport. However, previous studies have not discussed the prerequisites for drop and pull transport in terms of freight demand and thus cannot explain why drop and pull transport has been so slowly adopted in China. This paper attempts to integrate the scheduling and economic benefit models of drop and pull transport to investigate the prerequisites for highway tractor and trailer transport. The contribution lies in three areas: (1) For origin–destination (OD) freight flows in a region, the model aims to estimate the breakeven point (BEP) at which drop and pull transport becomes profitable and the BEP at which drop and pull transport becomes equally profitable to traditional truck transport. (2) Based on numerical analysis, it rationally explains why drop and pull transport has grown slowly in China and why governmental campaigns to promote it have failed. (3) It provides a theoretical basis that governments or industries can use to determine a suitable time to promote drop and pull transport.
3. Problem Description
In this paper, freight demand among N nodes in a closed region within a time period T are set as Q (,), and the road transport impedances between nodes are assumed to be known constants. To complete the transport task by drop and pull mode within period T, the operator is required to prepare identical tractors and trailers at every node before the task starts (i.e., at time 0). Once the task starts, no more tractors or trailers will be added to the task. Additionally, according to Duan [16] and Cao and Meng [48], the profits of drop and pull transport are related to the freight demand. Thus, the question is, what is the matrix Q that will make drop and pull transport profitable? To find the answer, first, a breakeven point (BEP) analysis model is built in Section 4, and then, in the numerical study in Section 6, the authors use the model to compute the BEP (Q*) at which the profit of drop and pull transport is 0. The second question is, what is the demand matrix Q that will make operators willing to switch to drop and pull transport from traditional truck transport? Theoretically, if the demand (Q) is such that drop and pull transport is more profitable than the traditional mode, operators will be willing to run it. Therefore, to answer the second question, a transport organization optimization model is proposed in Section 5, and in Section 6, the authors compute the turning point Q# at which drop and pull transport generates a profit equal to that of traditional truck transport. The authors define Q# as the threshold demand that determines whether drop and pull transport or traditional truck transport will be adopted by operators.
4. BEP Analysis Model for Drop and Pull Transport
The following parameters and variables are used to describe the freight demand model of the critical state of drop and pull transport profit. The freight demand in the market can create drop and pull transport profit, which is the basis of its development in logistics enterprises. Assuming standardized periodic transportation operations by trailers within the transportation network, the critical freight demand can be obtained by calculating the cargo volume that enables drop and pull transport to become profitable.
4.1. Parameters and Variables
4.1.1. Parameters
- t—Time slot within time T, t = 0, …, T (hour)
- —Idle cost of a tractor per time slot t (CNY)
- —Idle cost of a trailer per time slot t (CNY)
- β—Penalty cost of a trailer per time slot t (CNY)
- i, j—Origin node and destination node in a highway network, i, j = 1…, N
- —Transport impedance from node i to node j (kilometer)
- r—Transport fee for a trailer per kilometer (CNY)
- —The number of tractors at node i when t = 0
- —The number of trailers at node i when t = 0
- u—Dispatching cost of a tractor per time slot t (CNY)
- k—Dispatching cost of a trailer per time slot t (CNY)
- v—Variable cost of a trailer per kilometer (CNY)
4.1.2. Decision Variable
- —Freight demand from node i to node j at time slot t. It is measured with the number of trailers (per trailer unit, PTU).
4.1.3. Intermediate Variables
- —The number of tractors at node i at time slot t
- —The number of trailers at node i at time slot t
- —Actual freight flow (PTU) from node i to node j at time slot t
- —The number of tractors from node i to node j at time slot t
- —The number of trailers from node i to node j at time slot t
4.2. Model Establishment
The model is as follows:
S.T.:
The objective function of the proposed model is to minimize the total freight demand. Equation (2) is the positive profit constraint for operating drop and pull transport, where the profit is computed based on revenue, the penalty cost of the unfinished transport tasks, the idle cost, and the dispatching cost of tractors and trailers. Equation (3) calculates the tractor inventory at node i at time t, which is equal to the tractor inventory at node i at time t minus the number of tractors traveling from node i to node j at time t, plus the number of tractors traveling from node j to node i at time t − 1. Equation (4) calculates the trailer inventory at node i at time slot t, which is equal to the trailer inventory at node i at time slot t − 1 minus the number of tractors traveling from node i to node j at time slot t, plus the number of tractors traveling from node j to node i at time t − 1. Equation (5) presents the initial number of tractors and trailers at time t = 0. Equation (6) guarantees that the number of trailers will not exceed the number of tractors. Equations (7) and (8) denote that tractors and trailers will stay at node i at time t = 0, respectively. Equation (9) means that goods are not yet transported at time t = 0. Equation (10) ensures that the inventory of tractors and trailers at node i will not be negative. Equation (11) ensures that the freight flow (PTU) will not exceed the inventory of trailers from node i to node j. Equation (12) denotes that the actual freight flow is non-negative and will not exceed the freight demand from node i to node j.
5. Threshold Demand Model for Transport Organization
The following parameters and variables are used to establish a transport organization optimization model for freight transportation. Its purpose is to determine the critical value of market demand for freight transportation, at which drop and pull transport generates the same profit as traditional truck transport. This critical value serves as the threshold that distinguishes between traditional truck transport and drop and pull transport.
5.1. Parameters and Variables
5.1.1. Parameters
- —Idle cost of a truck per time slot t (CNY)
- —Penalty cost of a truck per time slot t (CNY)
- —Transport fee for a truck per kilometer (CNY)
- —The number of trucks at node I at time slot t = 0
- —Dispatching cost of a truck per time slot t (CNY)
- —Variable cost of a truck per kilometer (CNY)
5.1.2. Decision Variable
- —Freight demand (PTU) from node i to node j at time slot t.
5.1.3. Intermediate Variables
- —The number of trucks at node i at time slot t
- —Actual freight flow (PTU) from node i to node j at time slot t
- —The number of trucks from node i to node j at time slot t
5.2. Model Establishment
Equation (1) and Equations (3)–(12) of the above threshold analysis model of the profitable demand for drop and pull transport are also applicable to this section. The remaining model is as follows:
S.T.:
Equation (13) guarantees that the profit from drop and pull transport will not be less than that from traditional truck transport. Equation (14) presents the initial number of trucks at time t = 0. Equation (15) means trucks will stay at node i at time t = 0. Equation (16) means goods are not yet transported at time t = 0. Equation (17) calculates the truck inventory at node i at time t, which is equal to: (the truck inventory at node i at time t) − (the number of trucks traveling from node i to node j at time t) + (the number of trucks traveling from node j to node i at time t − 1). Equation (18) denotes that the actual freight flow is non-negative and will not exceed the freight demand from node i to node j. Equation (19) ensures that the inventory of trucks at node i will not be negative. Equation (20) guarantees that the freight flow will not exceed the truck capacity.
6. Numerical Study
Here, we take a medium-scale transport operator A in Liaoning Province (China) as an example of an operator of drop and pull transport for the numerical analysis. It is assumed that operator A uses two-axle standard van trailers, matched tractors, and 28-tonnage box-type trucks to provide freight service between the cities of Shenyang (a), Anshan (b), Benxi (c), Liaoyang Dengta (d), and Liaozhong (e) in Liaoning Province in nine time slots. Figure 1 shows the transport distances (km) among the five nodes as well as the initial number (in the brackets) of tractors and trailers at time t = 0. In Figure 1, (10, 20) on the vertexes denotes that there are 10 tractors and 20 trailers at the node in the initial stage.
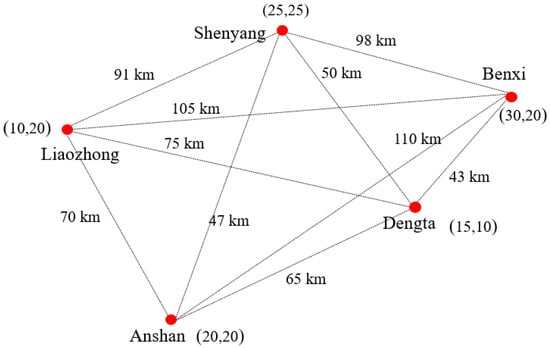
Figure 1.
Network of drop and pull transport.
6.1. Transport Revenue–Cost Analysis
Economic benefit equals the transport revenue, Re, net of cost, Trc. depends on freight volume, yijt, transport distance, lij, and freight rate, r. The transport cost consists of the penalty cost, Pc, idle cost, Idc, and the repositioning cost, Mbc, of vehicles. The penalty cost is paid by a carrier to a consigner for not completing the transport task, which depends on the amount of freight not transported, defined as: .
The idle cost is capital waste because vehicles are not being used and are left idle. The idle cost is composed of fixed costs, including vehicle depreciation, maintenance, labor costs, insurance, and other expenses, defined as: . The reposition cost is generated when a carrier has to dispatch empty vehicles from other nodes to a node to satisfy transport demand, defined as: . The repositioning cost of tractors and trailers consists of two parts: fixed cost and variable cost. The latter is composed of fuel costs and highway tolls and changes with the transport distance and time. The fixed cost includes depreciation, maintenance, labor costs, insurance, and other expenses of tractors and trailers. According to a survey conducted by the authors, the transport fee of a 28-tonnage box-type truck is 1200–1500 CNY per 100 km in Liaoning, and other costs are listed in Table 1.

Table 1.
Fees and costs of drop and pull transport and truck transport.
6.2. BEP Analysis of Drop and Pull Transport
The BEP analysis model for drop and pull transport was solved with LINGO. The demand matrices, Q*, that allowed drop and pull transport to reach the BEPs in the nine time slots are displayed in Table 2, in which the numbers represent the OD freight demand. For example, “c-b 20” means the OD freight demand from the city of Benxi (c) to the city of Anshan (b) is 20 PTUs. Based on the revenue–cost analysis, the profits of drop and pull transport as well as traditional truck transport are listed in Table 3. As shown in Table 3, drop and pull transport is scarcely profitable, only making a profit of 21 CNY after completing the 9 transport tasks, while the profit of traditional truck transport is as large as 113,396 CNY in the same situation. This result indicates that it is much more difficult to achieve profitability with drop and pull transport than with traditional truck transport. Only when freight demand is large enough will drop and pull transport deliver a significant profit.
Table 2.
Freight demand matrices for drop and pull transport at the BEPs in nine time periods.
Table 3.
Costs, revenues, and profits of drop and pull and truck transport.
6.3. Optimal Demand Analysis of Transport Organization
The threshold demand optimization model for transport organization was solved with LINGO to determine the OD freight matrices that make drop and pull transport more profitable than traditional truck transport over the nine time slots, and these are listed in Table 4. The corresponding revenues, costs, and profits of the two transport modes are presented in Table 5.
Table 4.
Threshold OD demand matrices for the two modes making identical profits.
Table 5.
Transportation benefits and costs of vehicles.
As displayed in Table 3 and Table 5, drop and pull transport and traditional truck transport both make a profit of approximately 276,570 CNY when the total OD freight is 320 PTUs in the 9 time slots.
According to Table 2 in Section 6.2, it can be obtained that the critical freight demand for drop and pull transport profit is 174 PTUs; that is, drop and pull transport is not profitable when OD freight is less than 174 PTUs. According to Table 2 and Table 4, it can be obtained that when the freight demand is 320 PTUs, the profit of drop and pull transport and traditional truck transport is the same. When OD freight varies from 174 PTUs to 320 PTUs, drop and pull transport will show a profit of between 0 and 276,570 CNY, but it is still less profitable than traditional truck transport. When OD freight exceeds the threshold of 320 PTUs, drop and pull transport becomes more profitable than traditional truck transport, and the profit gap tends to significantly expand as demand further increases.
6.4. Sensitivity Analysis
The national and local governments aim to promote the development of drop and pull transport in the market, encouraging more logistics enterprises to adopt this mode of transportation. This is expected to result in higher profits from transport operations compared to traditional truck transport, leading to a shift from trucks to trailers. To analyze the characteristics of drop and pull transport suitable for freight demand, the benefit data from truck transport of goods were utilized to examine its impact on the objective function. While keeping other parameters unchanged, the benefit of drop and pull transport was varied within the range of 0 to 500,000 CNY. The phased transportation benefit was selected, and the numerical results were recorded. These data were then presented in the form of a demand flow chart for cargo transportation, as illustrated in Table 6.
Table 6.
Freight requirements for different third cycles.
As can be seen from Table 6, the increase in benefits has brought characteristic changes to the freight forms of circular drop and pull transport. Firstly, the demand forms for drop and pull transport became more concentrated, with a gradual increase in freight demand during each time period. This means that the demand in related areas needs to shift from low or irregular demand to sufficient or even excessive demand. It can be clearly seen in Table 6 that when the demand is less than 20 PTUs, the transportation operation basically cannot earn profit. However, when the demand reaches 20 PTUs, optimizing vehicle scheduling can yield a maximum profit of 1000 CNY. With an additional increase of 3 PTUs, the profit increased 5-fold, amounting to 50,000 CNY. This indicates that the profit threshold for drop and pull transport is significantly high. It requires a certain accumulation of freight before it can begin to generate profits. Once a certain scale of freight is achieved, the demand for freight gradually increases, leading to exponential growth in transportation operation profits. In contrast, ordinary trucks have a lower profit threshold, as even the transportation of one or half of a trailer can yield a certain profit. However, overall, it is not cost-effective for tractors and trailers to transport small quantities of goods. Profits are more likely to be realized once a certain amount of freight is reached, enabling large-scale transportation operations. As the quantity of goods gradually increases, it leads to substantial profit growth.
Another important characteristic of drop and pull transport is the need to establish a balanced two-way logistics transport corridor, where the trailer engages in bidirectional transportation. It is crucial to achieve balanced round-trip transport demand in each cycle. In Table 6, it can be observed that the profit for drop and pull transport ranges from 0 to 100,000 CNY, with an average freight demand of approximately 20 PTUs per cycle. The greater the balance in the transport demand between the two directions within a cycle, the higher the profit. For instance, when the profit is 0 CNY, the quantity of goods for the A-B and B-A directions is 17 PTUs and 2 PTUs, respectively. When the profit is 1000 CNY, the freight volume for the outbound and return journeys is 16 PTUs and 3 PTUs. When the profit reaches 50,000 CNY, the freight volume for the outbound and return journeys is 17 PTUs and 5 PTUs. Finally, when the profit reaches 100,000 CNY, the freight volume for the outbound and return journeys is 17 PTUs and 8 PTUs.
To determine the suitability of drop and pull transport, general transport, or mixed transport in a specific region’s logistics industry, this paper conducted a comparative analysis of the characteristics of general cargo transport. The analysis involved defining and processing the mode and benefits of general cargo transportation scheduling, as well as establishing a traditional freight transportation demand model. The operation mode of cargo transportation remained unchanged following the circular drop and pull transport mode described in Section 4 and Section 5. Ordinary vehicles are also employed in a circular mode. In each cycle, these vehicles complete a drop and pull transport task, moving goods from one operation point to a designated operation point. Trucks then carry out another operation task in the subsequent cycle. By establishing an operational organization optimization model for cargo transportation, the critical value of transportation market demand was calculated. This critical value represents the point at which conventional transportation becomes profitable. In the mathematical model, the benefit of common freight operation was set as the critical value, and the freight demand between J operation points within the time period T was determined.
Equation (1) and Equations (14)–(20) of the above are also applicable to this section. The remaining model is as follows:
S.T.:
The objective function of the proposed model is to minimize the total freight demand. Equation (21) is the positive profit constraint for operating drop and pull transport, where the profit is computed based on revenue, the penalty cost of the unfinished transport tasks, and the idle cost of tractors and trailers. The parameter symbols in the model are the same as the mathematical model symbols in Section 5, and after being brought into empirical analysis, the data of each indicator were the same as the data in the case calculation in Section 6, and the derivative of the freight demand was calculated.
After calculation, Figure 2 shows the benefits of the new and old transportation methods for five phases of circular transportation operations in five locations in Liaoning Province. Sensitivity analysis was conducted on freight demand, the sum of freight benefits over the entire cycle was selected as the sensitivity coefficient, and the two transportation methods were compared. The two trend lines are the changes in transportation profits of the drop and pull transport and the traditional truck transport with the number of transportation demands.
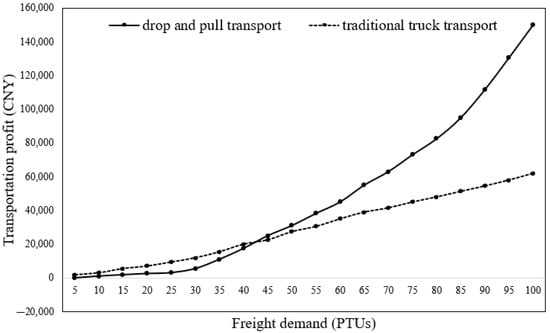
Figure 2.
Sensitivity analysis of the benefits of the two modes of transport to freight demand.
As shown in Figure 2, as the demand for cargo transportation gradually increased, transportation costs also increased. Overall, the transportation efficiency of drop and pull transport showed a gradual upward trend, while the traditional truck transport efficiency showed a gradual slow growth trend. The transportation demand was within 43 PTUs, and there was no competitive advantage in drop and pull transport. A small number of freight demands even resulted in negative benefits for drop and pull transport. However, traditional truck transport generated profits when there were transportation demands, indicating that the transportation cost of drop and pull transport is significantly higher than that of traditional truck transport under the same transportation remuneration. After 43 PTUs, under the same number of transportation demands, the transportation efficiency of the drop and pull transport was always greater than that of the traditional truck transport, and the difference in transportation efficiency between the two gradually expanded as the number of freight demands increased. The number of transportation demands increased from 40 PTUs to 70 PTUs, and the difference in transportation efficiency between the two increased from 0 to 20,419 CNY. The number of transportation demands increased from 70 PTUs to 100 PTUs, and the difference in transportation efficiency between the two increased from 0 to 88,308 CNY. The transportation efficiency under the two transportation tasks increased by 4.3 times. At the same time, Figure 2 also indicates that the more transportation tasks within a certain range, the more economical it is to use the drop and pull transport.
The research of drop and pull transport is also of great significance to sustainability. According to Lin [49], the energy-saving and emission reduction effects of drop and pull transport is very significant, and when the freight volume reaches a certain scale, the use of drop and pull transport will become an important starting point to promote the development of China’s road transport industry in an efficient, green, and low-carbon direction. Sensitivity testing can further verify the accuracy of the model, and in practical applications, the calculation mode and analysis of the cargo demand characteristics that match the drop and pull transport can provide reference for relevant government departments to choose suitable tractor and trailer pilot sites and for transportation enterprises to choose transportation vehicles and scheduling methods of energy-saving and emission reductions.
7. Suitability of Drop and Pull Transport in Liaoning Province
According to the highway transport data in the Statistics Yearbook 2018 of Liaoning Province, the monthly highway freight volumes into and out of the five cities and regions included in the numerical study above are listed in the row “Actual Dj” and the column “Actual Oi” in Table 5. The single-bound gravity model (Equation (22)) was employed to forecast the OD freight of each city pair:
Here, Oi is the freight demand out of node i, and Dj is the freight demand into node j. is the generalized transport cost from node i to node j and r is a parameter that is calibrated with the testing method [50,51]. In the testing method, r was initialized as 0.1 and incremented by a step length of 0.1 until reaching 2. Each r value was tested in the gravity model to find the value with the smallest errors. According to the T-test, |t| = 0.2361 < t0.01/2 = 3.3554 was satisfied when r = 0.3 at the significance level of α = 0.01, and the forecasts of Oi and Dj had no significant differences from the actual values (Table 5). Therefore, r = 0.3 was adopted here.
Table 7 shows the OD freight at the BEPs, the threshold for OD freight that makes drop and pull transport more profitable than traditional truck transport, and the forecasted OD freight computed with the gravity model based on actual data in time slots 1, 4, and 7. In Table 8, the dotted line denotes the desired path between an OD pair, and the numbers on the arrow lines are the freight demand between ODs.
Table 7.
OD matrix of freight demand between the five cities.
Table 8.
Three types of OD freight in time periods 1, 4, and 7.
The OD freight in the two situations (the BEP of drop and pull transport and the threshold at which drop and pull transport is more profitable) indicated that drop and pull transport is feasible only when freight demand is highly concentrated on a few sites in a region and bidirectional OD freight is balanced. The intensification of these two conditions will further consolidate the advantages of drop and pull transport over traditional modes. According to the comparison of OD freight in the three situations, the OD freight based on actual data showed an extremely unbalanced bidirectional demand and a dispersed distribution, which was very different from the OD patterns in the other two situations. Therefore, drop and pull transport is not applicable to the current OD freight in Liaoning Province. It is difficult to develop drop and pull transport in such an immature market despite various favorable policies from the government.
8. Conclusions
To find a favorable freight demand pattern for drop and pull transport, this paper established two models to calculate the threshold OD freight for the point where drop and pull transport reached the breakeven point, and that where it was more profitable than traditional truck transport. The results of the numerical study showed that drop and pull transport will be profitable only when freight demand is concentrated on a few sites in a region during a period of time and there is a balanced directional freight demand. When more freight demand collects on a few highway corridors and is balanced in both directions, drop and pull transport holds the potential to achieve greater profit than traditional truck transport.
Unlike developed countries, the economic and industrial structure of China is spatially uneven. For instance, an economic region in China is usually comprised of resource-based cities, manufacturing cities, and consumption-oriented cities. As a result, freight demand between cities in such regions is unbalanced. Two typical examples reflecting the problem in China are coal transport from the north to the south and grain transport from Shandong Province to the city of Beijing. Coal transport originates in the coal mining cities in northern China. Freight (coal) between those cities and coal port terminal cities is a purely one-way flow, so drop and pull transport would waste vehicle resources. Similar problems can be seen in fruit and vegetable transport between Shandong Province and Beijing.
The initialization of variables in the numerical study indicated that the prerequisites for operating drop and pull transport include the preparation of a certain number of tractors and trailers that should be systematically deployed in the process of transport organization. Obviously, only efficient and large-sized freight operators (e.g., big freight enterprises) satisfy those conditions. However, big freight enterprises are currently quite rare in China, and most participants in this sector are small individual carriers. It is plausible to organize individual carriers by building an alliance or a franchise chain system in which tractors and trailers are purchased by organizers or administrators; however, vehicle deployment and profit allocation are still a challenge.
Due to the problems discussed above, this paper argued that drop and pull transport is not feasible or applicable to the current highway freight market in China. Therefore, it would be more appropriate to select trial markets and operators to encourage and develop drop and pull transport. Regions with favorable OD freight demand will be suitable for testing the preliminary stage of implementing drop and pull transport. Blind expansion should be avoided; otherwise, profit problems will occur, and the attractiveness of drop and pull transport will be diminished. As the freight demand pattern evolves, the development of drop and pull transport will require more scale freight enterprises, network operations, ownership dispersion, tractor and trailer standardization, and the standardization of handling processes.
Author Contributions
Conceptualization, D.C.; validation, X.L. (Xuefei Liu); investigation, X.L.(Xiaolong Lu); writing—original draft, M.S.; supervision, Z.Y. All authors have read and agreed to the published version of the manuscript.
Funding
This work was supported by the Social Science Planning Fund Project of Liaoning Province, Grant Number L21CGL003, the National Natural Science Foundation of China (Grant Numbers 72072097, 72001120, and 72071025), and the Natural Science Foundation of Zhejiang Province, China (Grant Number LQ21E080004).
Institutional Review Board Statement
Research approval was obtained from the Survey and Behavioural Research Ethics Committee of the first author’s institution.
Data Availability Statement
Not applicable.
Conflicts of Interest
The authors declare no conflict of interest.
References
- Nozick, L.K.; Morlok, E.K. A model for medium-term operations planning in an intermodal rail-truck service. Transp. Res. Part A 1997, 31, 91–107. [Google Scholar] [CrossRef]
- Li, H.Q.; Li, Y.N.; Chang, X.Y. Effects of the Drop-and-Pull Transportation Mode on Mitigation of Carbon Dioxide Emissions based on the System Dynamics Model. Syst. Eng. Theory Methodol. Appl. 2016, 25, 514–519. [Google Scholar]
- Nordenflycht, A.V. What is a professional service firm? Toward a theory and taxonomy of knowledge-intensive firms. Acad. Manag. Rev. 2010, 35, 155–174. [Google Scholar]
- Wang, B.; Li, H.Q.; Liu, Y.Y. Benchmarking analysis of the tractors and trailers transport in China. Chin. Mark. 2017, 21, 281–284. [Google Scholar]
- Gu, S.G. Scheduling of Tractors and Trailers Transport between Container Terminal Yards and Hinterlands. Master’s Thesis, Beijing Jiaotong University, Beijing, China, 2017. [Google Scholar]
- Li, T.; Tan, X.P. The conditions and main works for developing tractors and trailers transport in China. Transp. Constr. Manag. 2011, 10, 82–84. [Google Scholar]
- Cai, C.; Li, Y.R. Strategies for encouraging tractors and trailers transport. Compr. Transp. 2010, 7, 58–62. [Google Scholar]
- Sheng, Y.K.; Xiong, B.H. Supply of Facilities and Equipment of Drop-and-Pull Transport in Sharing Economy Era. J. Chongqing Jiaotong Univ. (Soc. Sci. Ed.) 2018, 18, 49–54. [Google Scholar]
- Detti, A.; Tropea, G.; Blefari Melazzi, N.; Kjenstad, D.; Bach, L.; Christiansen, I.; Lisi, F. Federation and Orchestration: A Scalable Solution for EU Multimodal Travel Information Services. Sustainability 2019, 11, 1888. [Google Scholar] [CrossRef]
- Yu, X.; Lang, M.; Zhang, W.; Li, S.; Zhang, M.; Yu, X. An Empirical Study on the Comprehensive Optimization Method of a Train Diagram of the China High Speed Railway Express. Sustainability 2019, 11, 2141. [Google Scholar] [CrossRef]
- Jia, J.; Shao, M.; Cao, R.; Chen, X.; Zhang, H.; Shi, B.; Wang, X. Exploring the Individual Travel Patterns Utilizing Large-Scale Highway Transaction Dataset. Sustainability 2022, 14, 14196. [Google Scholar] [CrossRef]
- Basso, F.; Pezoa, R.; Tapia, N.; Varas, M. Estimation of the Origin-Destination Matrix for Trucks That Use Highways: A Case Study in Chile. Sustainability 2022, 14, 2645. [Google Scholar] [CrossRef]
- Li, C.L. Quantitative Calculation of the Economic Effectiveness of Drop and Pull Transport. Storage Transp. Preserv. Commod. 2011, 33, 19–22. [Google Scholar]
- Gao, F. Research on the Benefits and Development of Highway Drop-and-pull Transport: In the Case of Fujian Wanji Logistics. Logist. Eng. Manag. 2017, 39, 37–38. [Google Scholar]
- Zheng, Y.C. Scheduling theory and model optimization of port container drop and pull transport vehicles. Sweeping Over Manag. 2020, 565, 149–150. [Google Scholar]
- Duan, Y.L. Promote drop and pull transport, service modern logistics. Logist. Technol. 2014, 18, 13–15. [Google Scholar]
- Beuthe, M.; Jourquin, B.; Geerts, J.F.; Ha, K.N. Freight transportation demand elasticities: A geographic multimodal transportation network analysis. Transp. Res. Part E 2001, 37, 253–266. [Google Scholar] [CrossRef]
- Pei, A.H.; Wang, L.; Tian, S.H. Cost Calculation of Highway Drop-and-pull Transport. Compr. Transp. 2018, 40, 55–59. [Google Scholar]
- Li, Y.; Wang, Q.F. Analysis of Economic Benefit of Drop-and-pull Transport. Logist. Technol. 2015, 34, 152–153. [Google Scholar]
- Xue, L.; Ma, J.X.; Yu, W. Application Analysis of Drop and Pull Transport. Transp. Syst. Eng. Inf. 2011, 11, 200–205. [Google Scholar]
- Wu, J.Q.; Deng, R.L.; Su, X.X. Dominant Transport Distance for the Tractor and Trailer Transport Based on Highway Port. J. Kunming Univ. Sci. Technol. (Nat. Sci.) 2019, 44, 134–142. [Google Scholar]
- Geng, R.; Zhang, S.H. A Method for Computing Optimal Trailer Number for Trailer Pick-up Transport. J. Highw. Transp. Res. Dev. 2013, 30, 127–130. [Google Scholar]
- Soares, R.; Marques, A.; Amorim, P.; Rasinmaki, J. Multiple vehicle synchronization in a full truck-load pickup and delivery problem: A case-study in the biomass supply chain. Eur. J. Oper. Res. 2019, 277, 174–194. [Google Scholar] [CrossRef]
- Tadumadze, G.; Boysen, N.; Emde, S.; Weidinger, F. Integrated truck and workforce scheduling to accelerate the unloading of trucks. Eur. J. Oper. Res. 2019, 278, 343–362. [Google Scholar] [CrossRef]
- Guo, Y. Tractor Scheduling Problem of Network-Type Drop and Pull Transportation. Master’s Thesis, Beijing Jiaotong University, Beijing, China, 2019. [Google Scholar]
- Liang, D.; Huang, G.Z.; Wang, G.Q. Research on current situation and development strategy of drop and pull transport in China. Mod. Bus. Trade Ind. 2020, 41, 24–25. [Google Scholar]
- Villegas, J.G.; Prins, C.; Prodhon, C.; Medaglia, A.L.; Velasco, N. A matheuristic for the truck and trailer routing problem. Eur. J. Oper. Res. 2013, 230, 231–244. [Google Scholar] [CrossRef]
- Chao, M. A tabu search method for the truck and trailer routing problem. Comput. Oper. Res. 2002, 29, 33–51. [Google Scholar] [CrossRef]
- Lin, S.W.; Yu, V.F.; Chou, S.Y. Solving the truck and trailer routing problem based on a simulated annealing heuristic. Comput. Oper. Res. 2009, 36, 1683–1692. [Google Scholar] [CrossRef]
- Batsyn, M.; Ponomarenko, A. Heuristic for a Real-life Truck and Trailer Routing Problem. Procedia Comput. Sci. 2014, 31, 778–792. [Google Scholar] [CrossRef]
- Luo, Z.Y. Scheduling and Optimization for Container Drop and Pull Transport under One Point and Multi-Lines Mode. Master’s Thesis, Dalian Maritime University, Dalian, China, 2014. [Google Scholar]
- Mirmohammadsadeghi, S.; Ahmed, S. Metaheuristic Approaches for Solving Truck and Trailer Routing Problems with Stochastic Demands: A Case Study in Dairy Industry. Math. Probl. Eng. 2015, 2015 Pt 22, 494019.1–494019.14. [Google Scholar] [CrossRef]
- Yu, L.; Lin, H.; Chen, B.R. Research of Vehicle Scheduling Problem of the Network Drop and Pull Transport. J. Transp. Eng. Inf. 2014, 12, 58–64. [Google Scholar]
- Yang, Z.H.; Yang, G.M.; Xu, Q.; Guo, S.J.; Jin, Z.H. Optimization on tractor-and-trailer transport scheduling with uncertain empty-trailer tasks. J. Traffic Transp. Eng. 2016, 16, 103–111. [Google Scholar]
- Li, H.Q.; Chang, X.Y.; Zhu, X.N.; Lu, Y. Intercity Line-haul Tractor Dispatching Problem in Trailer Pick-up Transport and its Solving Method. J. Highw. Transp. Res. Dev. 2016, 33, 151–158. [Google Scholar]
- Li, H.; Li, Y.; Zhao, Q.; Song, Q. The Tractor and Semitrailer Routing Considering Carbon Dioxide Emissions. Math. Probl. Eng. 2013, 2013, 509160. [Google Scholar] [CrossRef]
- Barcos, L.; Rodrguez, V.; Larez, M.J.; Robuste, F. Routing design for less-than-truckload motor carriers using ant colony optimization. Transp. Res. Part E 2010, 46, 367–383. [Google Scholar] [CrossRef]
- Bodin, L.; Mingozzi, A.; Baldacci, R.; Ball, M. The roll on-roll off vehicle routing problem. Transp. Sci. 2000, 34, 271–288. [Google Scholar] [CrossRef]
- Baldacci, R.; Bodin, L.; Mingozzi, A. The multiple disposal facilities and multiple inventory locations rollon-rolloff vehicle routing problem. Comput. Oper. Res. 2006, 33, 2667–2702. [Google Scholar] [CrossRef]
- Ning, H.P. Regional Railway Network Capacity Optimization for Continuous Increment of Coal Transportation by Northern Shaanxi Railways. Railw. Transp. Econ. 2023, 45, 36–43. [Google Scholar]
- Liu, Y. Research on the Development of Green Logistics of Agricultural Products in Shouguang City. Master’s Thesis, Shandong Agricultural University, Taian, China, 2022. [Google Scholar]
- Chen, Y.; Shan, M.Y.; Wang, Q. Research on heterogeneous fixed fleet vehicle routing problem with pick-up and delivering. J. Cent. South Univ. (Sci. Technol.) 2015, 46, 1938–1945. [Google Scholar]
- Xue, Z.; Zhang, C.; Lin, W.H.; Miao, L.; Yang, P. A tabu search heuristic for the local container drayage problem under a new operation mode. Transp. Res. Part E 2014, 62, 136–150. [Google Scholar] [CrossRef]
- Li, H.; Lu, Y.; Zhang, J.; Wang, T. Solving the tractor and semi-trailer routing problem based on a heuristic approach. Math. Probl. Eng. 2012, 2012 Pt 7, 182584.1–182584.12. [Google Scholar] [CrossRef]
- Feng, X.J.; Yang, Y.L.; Jiang, L.P.; Ji, J. Vehicle routing problem for the network of container transport with dumping trailers under hard time window constraint. J. Chang. Univ. Sci. Technol. Nat. Sci. 2016, 13, 31–35. [Google Scholar]
- Villegas, J.G.; Prins, C.; Prodhon, C.; Medaglia, A.L.; Velasco, N. GRASP/VND and multi-start evolutionary local search for the single truck and trailer routing problem with satellite depots. Eng. Appl. Artif. Intell. 2010, 23, 780–794. [Google Scholar] [CrossRef]
- Hu, Z.H.; Tao, S. Distribution by Trailer Pick-up Transport Based on Hybrid Evolutionary Algorithm. J. Highw. Transp. Res. Dev. 2013, 30, 147–152. [Google Scholar]
- Cao, R.W.; Meng, L.Q. Feasibility Study of Drop and Pull Transportation in SF Company Based on SWOT Analysis. Logist. Sci-Tech 2022, 45, 84–87. [Google Scholar]
- Lin, T. Mechanism and Empirical Analysis of Energy Conservation and Carbon Emission Reduction Effect of Trailer Pick-Up Transport. Transp. Res. 2015, 1, 42–47. [Google Scholar]
- Xie, X.J. Calibration Method and Comparison of Gravity Model. Commun. Stand. 2008, 8, 17–20. [Google Scholar]
- Chu, Q.; Chen, S.K. On Calibration of the Gravity Model during Traffic Forecast. J. Transp. Syst. Eng. Inf. Technol. 2003, 3, 51–56. [Google Scholar]


Disclaimer/Publisher’s Note: The statements, opinions and data contained in all publications are solely those of the individual author(s) and contributor(s) and not of MDPI and/or the editor(s). MDPI and/or the editor(s) disclaim responsibility for any injury to people or property resulting from any ideas, methods, instructions or products referred to in the content. |
© 2023 by the authors. Licensee MDPI, Basel, Switzerland. This article is an open access article distributed under the terms and conditions of the Creative Commons Attribution (CC BY) license (https://creativecommons.org/licenses/by/4.0/).