Abstract
Urban built-up areas confront significant environmental challenges and growing demand for enhanced residents’ well-being. Prioritizing urban green infrastructure (UGI) interventions is crucial for sustainable urban renewal. We propose a six-step framework that integrates urgency, synergy, feasibility, and typology to identify UGI intervention priorities. The framework targets detailed planning units (DPUs) and was applied to Xi’an, China. First, we assess the risks of supply–demand mismatches related to four key urban ecosystem services (UESs), namely air purification, temperature regulation, runoff regulation, and recreation. K-means clustering analysis is utilized to classify the risk typology. Next, we use the dynamic weighting method to diagnose the urgency of comprehensive risk, then evaluate the potential for synergy optimization between DPUs using local univariate and bivariate spatial autocorrelation analysis. The proportion of urban renewal land area in DPUs is employed as an indicator to evaluate the feasibility of the method. Lastly, we adopt the TOPSIS method to identify the priority ranking. Our research reveals that 51.7% of DPUs in Xi’an are at high risk of multiple supply–demand mismatches for UESs and that seven risk types need targeted optimization strategies. The DPUs ranked in the top 30 can be selected as priority UGI intervention units based on urgency, synergy, and feasibility. This study provides a scientific basis for decision making on UGI interventions in sustainable urban renewal.
1. Introduction
Currently, the urban ecosystem is facing dual challenges of high population and intensified environmental risks caused by climate change. As of 2020, approximately 55% of the global population lived in urban areas. This number is expected to reach 70% by 2050 [1]. Urban expansion and densification have resulted in a significant loss and fragmentation of ecological space [2], leading to a decline in the functionality of urban ecosystem services (UESs) [3]. This has resulted in significant spatial heterogeneity of urban issues [4], such as heat islands, urban flooding, and air pollution, further exacerbating social equity issues [5,6]. The severity of environmental problems underscores the importance of maintaining and enhancing the ecosystem services that support human well-being and urban sustainability [7,8,9]. Given that urban populations mainly gather in built-up areas, improving UESs in these areas is crucial in order to enhance human well-being [10]. Urban green infrastructure (UGI) plays a critical role in providing essential local services [2,10,11,12] that cannot be replaced by peripheral ecological space, including runoff regulation [13], air quality regulation [6], climate regulation [14], cultural and aesthetic values [15], etc. UGI is a cornerstone that contributes to a sense of security, happiness, and accomplishment felt by urban residents [16]. Given the scarcity of land resources in built-up areas, identifying priorities for UGI interventions is crucial in order to promote rational investment timing and support relevant policies and funding [8,17,18], enhancing the effectiveness of urban renewal.
Previous studies have proposed various prioritization methods for UGI interventions, from overlay mapping [19]; to utilizing multicriteria decision analysis (MCDA) [20] tools such as the equal-weighted method [21,22,23], the analytic hierarchy process method (AHP) [24] weighted from planning policy [17], expert opinion [25] or different stakeholders [26]; and the technique for order of preference by similarity to ideal solution (TOPSIS) [27]. The risk assessment method [28] has been utilized to specifically evaluate the demand for a single ecosystem service, such as heat mitigation [29,30] or waterlogging regulation [31]. Recently, many researchers have focused on assessing UESs to identify spatial mismatch in supply and demand to allocate UGI [4,17,32], as this method it can link multiple ecosystem services to social welfare benefits [12,33]. For example, Kremer [17] et al. applied spatial multicriteria evaluation (MCE) to evaluate five ecosystem services in New York City to identify priority areas for UGI in four different scenarios. de Manuel et al. [34] proposed an index to assess the mismatch between ecosystem service supply and demand to develop functional UGI. Tran et al. [21] used the GIST model to evaluate multiple ecosystem services to maximize UGI multifunctionality. Wu et al. [32] evaluated the excess demand for ecosystem services in Wuhan, China, to provide suggestions for UGI planning.
In evaluating the supply and demand of UESs, the common approach is to separately quantify the supply and demand of UESs [4,23,35,36]. These analyses often rely on highly precise land use/land cover data. Estimating UESs can be inaccurate if rough data are used in areas with insufficient fine data [37]. Furthermore, due to the difference in the measurement for each UES, the normalized overlay may lead to issues such as ambiguity and inaccuracy of the results [38]. In urban areas where UESs are in high demand but low supply [39], effectively characterizing the supply–demand mismatch and identifying additional demand space is crucial to optimize urban spatial structures [40,41]. Baró et al. [42] used environmental quality standards and other proxy indicators to assess the satisfaction level of ecosystem service demands, which provided a better link with planning management and environmental monitoring standards [32]. By viewing the supply–demand process of UESs as a whole and using the output results of the system, that is, whether it can meet the needs or expectations of society [43], the degree of risk of supply–demand mismatch of ecosystem services can be succinctly and efficiently revealed, providing a solution for areas lacking fine data. Moreover, there is a gap between the scale and accuracy of research units and their practical systems [4,8,37], such as mismatch between evaluation units and planning units, as well as inconsistency between analysis units and data resources. These defects make it challenging to effectively translate research results into planning practices. In recent years, following the reform of the territorial spatial planning system [44], a detailed planning based on detailed planning units (DPUs) has become an urgent priority for practical implementation in China. However, despite the great practical value it holds, there is currently a lack of research focusing on DPUs.
While current research has mostly focused on assessing UESs, it is important to consider not only the urgency of risks but also the constraints of land renewal feasibility [45,46] and the potential of spatial synergies [45,47,48] when assessing the spatial priority of UGI interventions in built-up areas. Although the synergies and tradeoffs between multiple UESs have been commonly analyzed [19,48,49], limited studies have examined the local spatial relation of synergy between DPUs [45]. Implementing UGI requires significant human, material, and financial resources, and synergy can help to build stronger partnerships, improve communication, and foster trust among stakeholders. Cooperation among multiple units facing similar problems simultaneously can help to implement spatially continuous UGI strategies between units, such as greenways and other linear UGI elements that may need to traverse multiple units. Spatial autocorrelation analysis is a useful tool for identifying potential synergies and informing the development of comprehensive and collaborative UGI strategies.
To address the limitations mentioned above, in this study, we propose a stepwise framework that integrates the urgency, synergy, and feasibility of UGI interventions in sustainable urban renewal. The framework comprises six steps: (1) constructing a risk assessment model for the supply–demand mismatch of four major UESs, namely air purification, temperature regulation, runoff regulation, and recreation; (2) distinguishing risk clusters through K-means clustering analysis to categorize the type of UGI interventions based on risk typology; (3) identifying a comprehensive risk assessment of UES supply–demand mismatch using the dynamic weighting method to determine the urgency of UGI interventions; (4) utilizing univariate and bivariate local spatial autocorrelation analysis to identify the synergy potential between DPUs; (5) using the proportion of urban renewable land area in DPUs as an indicator to evaluate the feasibility of UGI implementation; and (6) determining the priority of DPUs for UGI interventions based on the TOPSIS method.
In summary, this study presents a decision-making framework (Figure 1) that integrates urgency, synergy, and feasibility to identify priority DPUs for UGI interventions in urban planning. The proposed framework has demonstrated its practicality and effectiveness in 145 detailed planning units (DPUs) within the built-up area of Xi’an, China. The six-step approach is flexible and adaptable to diverse urban contexts, taking into account the specific challenges and opportunities faced by each city. Overall, this study contributes to ongoing global discussions on sustainable urban renewal, providing a comprehensive and practical solution for decision makers and planners to achieve a more livable and resilient urban environment.
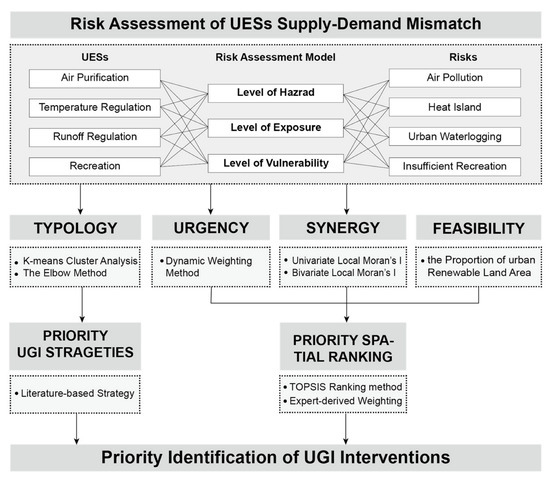
Figure 1.
Framework for identifying UGI priority.
2. Materials and Methods
2.1. Study Area
As the core city of the Guanzhong Plain urban agglomeration in western China, Xi’an is not only the capital of Shaanxi Province but also an important national central city. In this study, we focused on the built-up area (563 km2) in the central urban region of Xi’an (Figure 2), which consists of 6 administrative districts and 4 development districts. We selected the DPUs as the research object to link with detailed planning; thus, a total of 145 units were selected. The study area has a warm, temperate, semihumid, and continental monsoon climate, with distinct seasons. During the summer months (June to August) in Xi’an, the average maximum temperature remains consistently between 35 and 40 °C, with the highest recorded temperature reaching 42.9 °C. The average total precipitation from April to October is 488.6 mm.
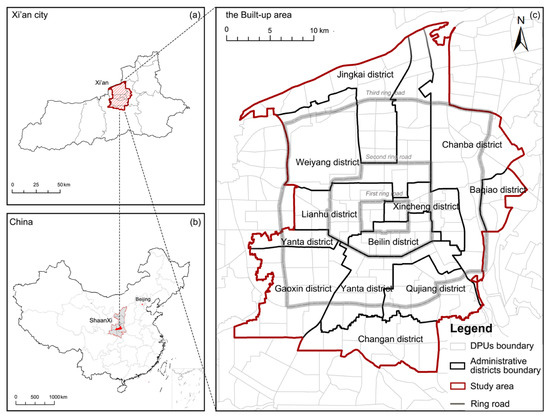
Figure 2.
(a–c) Study area.
Over the past three decades, the built-up area in Xi’an has more than tripled in size due to rapid urban expansion, with the speed of urban land expansion surpassing population growth [50]. Previous natural features, such as vegetation and water bodies, have been replaced or fragmented by the growing density of the impervious surface, including buildings and roads. As a result, the urban ecological space is decreasing at an alarming pace, lowering the functionality of urban systems. This has led to urban diseases, such as urban waterlogging, heat islands, and air pollution, which are now becoming stark realities for the citizens.
2.2. Risk Assessment of UES Supply–Demand Mismatch
Based on the system theory of disasters, a risk assessment model (risk, R) [12,51] was introduced to evaluate the risks of UES supply–demand mismatch on each of three dimensions: hazard (H), exposure (E), and vulnerability (V) (Table 1). The formula is shown below:
where H represents the level of hazard, which refers to the severity of the disaster’s impact. Environmental and management standards were selected as key threshold values to measure the degree of UES supply–demand mismatch risk [32,42]. E indicates the degree of exposure, which describes the primary vulnerable groups exposed to risks in terms of population and building density and infrastructure. V denotes the stage of vulnerability, which measures the differences in ability to withstand disasters, which can be characterized by the proportion of vulnerable populations, such as children and the elderly.
R = H × E × V,

Table 1.
Risk assessment indicators, thresholds, and data resources.
2.2.1. Stress Assessment
- Air Pollution
The AQI (Air Quality Index) is a dimensionless index that quantitatively describes the condition of air quality by integrating primary pollutants, including SO2, NO2, PM10, PM2.5, O3, and CO, along with the key indicators of exceeding pollutant standards [53]. In this study, AQI was chosen as the comprehensive indicator to evaluate the stress level of air pollution. Daily AQI data from all monitoring stations in Xi’an City in 2020 (http://www.cnemc.cn/en/, accessed on 14 July 2021) were statistically analyzed to derive the annual average concentration. The Kriging interpolation method was used to map the spatial distribution of the annual average AQI concentration, while the zonal statistic method was employed to characterize the stress level of air pollution for each DPU. Since AQI, O3, and CO do not have lower annual concentration limits, the lower limits of pollutants such as SO2, NO2, PM10, and PM2.5 were used as key threshold values to measure service mismatch levels. DPUs with annual average concentrations of those four pollutants below the threshold value were assigned a stress level of 0, while those with values above the threshold value were reclassified into five levels based on the annual average concentration using the natural breaks method.
- Urban Heat Island
We elected the Urban Heat Island Proportion Index (UHPI) [54] as the index for heat island risk. The UHPI determines the level of heat islands by calculating the proportion of pixel area of each heat island intensity level within the statistical unit. The level of surface urban heat island (SUHI) was calculated as the difference between the surface temperature of a given pixel and the average temperature of suburban farmland [55] and classified into seven levels (Table 2). The formula is expressed as follows:
where represents the intensity of the surface heat island (°C) of the -th pixel, represents the surface temperature of the -th pixel, represents the number of effective pixels in suburban farmland, and represents the surface temperature (°C) of the -th suburban farmland pixel. The Landsat 8 satellite remote sensing image from 12 August 2019, was obtained (http://www.gscloud.cn, accessed on 3 August 2021), and the surface temperature was derived using the atmospheric correction method with ENVI 5.3 [56]. Subsequently, the average surface temperature of suburban farmland in Xi’an was calculated to be 33.7 °C. Using Formula (2), the heat island intensity for each pixel was computed and classified into seven levels based on relevant literature [44,45] (Table 2). The UHPI of each DPU was calculated as follows (Formula (3)):
where represents the Urban Heat Island Proportion Index; is the number of heat island levels; refers to the ordinal number of the level for which the temperature is higher than that of suburban areas; represents the weight of the -th level, which is equal to the level value; and represents the percentage of the area of the -th level. According to Table 2, equaled 7, and equaled 5, 6, or 7. The UHPI value ranged from 0 to 1, with higher values indicating a more severe heat island. Based on the evaluation criteria in the guidelines mentioned above, a key threshold value of 0.1 was set. DPUs with UHPI values below 0.1 were assigned a stress level of 0, while those above this threshold were classified and assigned specific values according to Table 3.
Table 2.
The level of surface urban heat island (SUHI) [44,45].
Table 3.
Stress levels of heat islands [54].
- Urban Waterlogging
The density of waterlogging points was selected as the indicator of the risk caused by urban waterlogging according to the “Urban Physical Examination Indicator System” developed by the Ministry of Housing and Urban-Rural Development [57]. A total of 148 waterlogging points were collected from Baidu Map (https://map.baidu.com/, accessed on 28 August 2022) and cross-checked against data from the Xi’an Urban Administration Bureau and media reports on urban waterlogging over the past five years. The point density of waterlogging was calculated, while the zonal statistic method was employed to characterize the stress level of urban waterlogging. DPUs with a point density of 0 were assigned a stress level of 0, while those above the threshold value were reclassified based on the point density of waterlogging.
- Insufficient Recreation
The accessibility of urban recreation services was mainly related to the size of public green spaces and population density [23]. In this study, accessibility was evaluated using the service radius, which was divided into three categories based on the size of public green spaces [58] within and adjacent to the study area: community park with an area of less than 1 hectare, community park with an area of 1–5 hectares, or comprehensive park with an area of more than 5 hectares. The 5 min, 10 min, and 15 min service radii had corresponding threshold values of 300 m, 500 m, and 1000 m. The entrance and exit points of each park were visually identified using Baidu Map (https://map.baidu.com/, accessed on 12 September 2021), and network analysis was conducted in ArcGIS to determine the actual service areas of the public green spaces. The proportion of residential areas not covered by the service radius of public green spaces within each DPU was selected as the indicator of risks and indicated insufficient recreation. The natural breaks method was employed to classify the DPUs into five levels.
2.2.2. Exposure Assessment
We characterized the level of exposure by selecting population density and obtaining population data from the current statistics of DPUs. It is worth mentioning that the calculation of exposure caused by waterlogging differs from other calculations due to its impact, which not only affects residents’ lives but also causes damage to social resources and infrastructure [31]. Therefore, the density maps of population, building, and road data were normalized, equally weighted, overlaid, and reclassified into five levels to reflect the comprehensive exposure to waterlogging risk.
2.2.3. Vulnerability Assessment
Vulnerability was used to measure differences in the ability to withstand disasters. On the one hand, high-temperature heat waves, air pollution, and flood risks more severely affected the elderly and children, making them more vulnerable [5]. On the other hand, recreation accessibility had a more significant impact on the frequency of use by vulnerable groups. Thus, the normalized proportions of the elderly population and child population were selected and equally weighted, and the social vulnerability index was obtained through reclassification.
2.3. Priority Identification of UGI Intervention
2.3.1. Risk Typology
SPSS Statistics 25.0 was employed to perform the K-means clustering analysis, which classified the risk types of each DPU. The optimal clustering number was determined using the “elbow method” [23], and the 145 DPUs were categorized into distinct risk types. Additionally, eCognition 10.2 software was utilized to analyze the UGI distribution data extracted from Gaofen-1 (GF-1) imagery (http://www.gscloud.cn, accessed on 5 October 2021) with a spatial resolution of 2 m in the study area. In addition, the correlation between the proportion of the UGI area and the risk level of each DPU was calculated.
2.3.2. Urgency Assessment
To identify the urgency of UGI interventions, comprehensive risk assessment requires the weighting of the four risks. At present, static weight assignment methods, including equal weighting, AHP, and entropy methods, are primarily used [46]. In this study, the dynamic weighting method proposed by Chen et al. [45] was employed. This method calculates the ratio of each risk value within the unit relative to the total risk value and adjusts it by computing the ratio of each risk value within the study area relative to the total risk value within the study area. This could help in developing unique weights for each DPU and highlighting the primary issues of each DPU. The comprehensive mismatch risk was calculated by summing four risks based on dynamic weight values using the following formulas:
where is the weight of the -th risk of the -th DPU, represents the sum of the four risk values for the -th DPU, refers to the standardized value for the -th risk of the -th DPU, denotes the number of DPUs, and is the number of risk types. Based on Formula (1), the risks of supply–demand mismatch of the four UESs were calculated, and the results were normalized. Then, based on Formulas (4) and (5), the dynamic weights of each DPU were calculated, and the comprehensive risk was obtained and subsequently categorized into five levels using the natural breaks method. DPUs with high and medium–high risks were identified as high-urgency units.
2.3.3. Synergetic Potential Identification
Local Moran’s I can reveal the spatial clustering characteristics of single and bivariate indicators [59]. Using GeoDa V1.2 software, we performed local univariate spatial autocorrelation analysis to explore four risks and local bivariate spatial autocorrelation analysis to study the combinations of two risks. LISA maps were generated to visualize the identified clusters and outliers, highlighting high–high (HH), low–low (LL), high–low (HL), and low–high (LH) clustering. The sum of HH types from the univariate and bivariate results of each DPU’s autocorrelation was used to estimate the potential synergistic effects of urban green infrastructure (UGI) interventions. The total sum of univariate Moran’s I spatial autocorrelation indicated the ability of an individual DPU to cluster high-value risks with its surrounding units, while the total sum of bivariate Moran’s I spatial autocorrelation revealed the capability of a DPU and its surroundings to aggregate different high-value risks. Such DPUs and their surroundings faced multiple risks of mismatching urban ecosystem services (UESs), which called for more comprehensive planning and optimization of UGI distribution to achieve stronger synergistic effects.
2.3.4. Prioritizing UGI Interventions
When identifying the priority of UGI interventions of DPUs, two essential components were analyzed. On the one hand, the spatial ranking of DPUs is crucial for decision making; on the other hand, the use of adaptive strategies that match the risk typology is essential for UGI planning. To address the matching of UGI strategies with risk types, we developed adaptive UGI strategies that can match risk typology based on previous studies [11,19,49,60,61].
To determine spatial ranking, details should be taken into account. On one hand, the high risk of UES supply–demand mismatch should be addressed urgently. On the other hand, the synergetic potential of DPUs should also be noticed, such as the common need for UGI updating, as well as the positive spillover effects resulting from implemented UGI measures. Additionally, given the scarcity of spatial resources, the feasibility of implementing UGI interventions should be assessed based on the potential for renewal. Our research identified “the proportion of urban renewal land area in DPUs” that were surveyed by the Xi’an Urban Planning and Design Institute, which is a suitable indicator of feasibility.
The TOPSIS method [62] was utilized with SPSS Statistics 25.0 to identify the optimal sequence of DPUs that integrates urgency, synergy, and feasibility, as mentioned above. To be specific, all DPUs need to be represented in a decision matrix () with dimensions (m = 145, n = 3), where represents the score of the -th DPU under the -th criteria. The weight of each criterion can be derived from expert opinion [25,27,62], which is a vector () with length (See Appendix B for a list of experts consulted for opinions and the result of the questionnaire to determine the weights). Then, the TOPSIS score of each DPU can be calculated through the following steps:
- 1.
- Normalize each column of matrix so that the sum of each column is 1, and transform each non-negative value () into its relative size within the current column;
- 2.
- Calculate the weighted value of each element in matrix and transfer them into a new matrix. This weighted matrix () can be calculated according to the following formula:
- 3.
- The positive ideal solution () and negative ideal solution () can be respectively calculated using the following formulas:
- 4.
- Calculate the Euclidean distance of each DPU to the positive ideal solution () in Formula (9) and the negative ideal solution () in Formula (10):
- 5.
- Calculate the relative position of each DPU compared to all other DPUs in Formula (11):
3. Results and Analysis
3.1. Assessment of Stress, Exposure, and Vulnerability
The evaluation results of stress, exposure, vulnerability, and risk for each DPU are displayed in Figure 3. The absence of low-stress areas for air pollution in the study area indicates that overall levels exceeded standards, with high-risk areas concentrated in the northwest of the city. The risk of urban waterlogging exhibited an inside–out trend decreasing trend, and there were three aggregation areas located within the inner-city wall, to the south of the second ring road, and to the east of the third ring road. Low-stress areas were mainly distributed in the Chang’an district in the south and the Chanba ecological district in the northeast. The risk of heat island exhibited features of gathering in the central city, with high-risk areas mainly distributed within and along the second ring road and to the southwest and northeast of the third ring road, while low-risk areas were located in the Qindu district in the southeast. The risk of insufficient recreation was scattered along the second ring road.
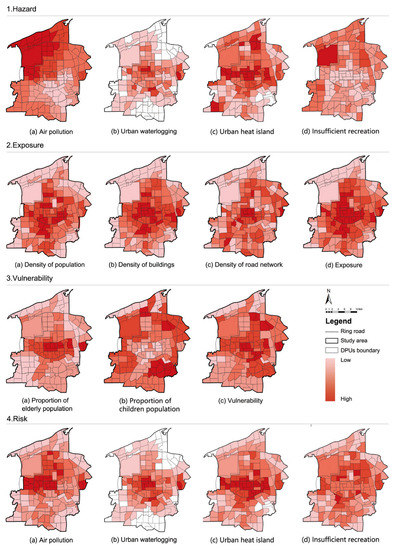
Figure 3.
The evaluation results of stress, exposure, vulnerability, and comprehensive risk.
3.2. Risk Typology
Based on the K-means clustering analysis of four service supply–demand mismatch risks, the “elbow method” was used to determine the optimal number of clusters as seven (Figure 4a,b). As shown in Figure 4a, the determined comprehensive risk level was employed to evaluate the severity of risk for different risk clusters. Cluster I consisted of two DPUs with extremely high cumulative risk, accounting for 1.4%, primarily located in the Hongmiaopo subdistrict of Lianhu district and the Fangzhicheng subdistrict of Baqiao district. Cluster II included 14 DPUs that were at extremely high risk of waterlogging, as well as heat islands, making up 9.7% of the total, mainly distributed within the first ring wall and its western and eastern sides. Cluster III comprised four DPUs with air-pollution-oriented high risk, representing 2.8% of the total, and situated between the second and third rings on the west side of the city. Cluster IV consisted of eight DPUs with insufficient recreation-oriented high risks, accounting for 5.5%, scattered along the north, southwest, and southeast sides of the second ring. Cluster V contained 20 DPUs with heat-island-oriented high risk, accounting for 13.8% of the total, and distributed along the east and south sides of the second ring. Cluster VI included 35 DPUs with medium risk, making up 24.1% of the total, located between the second and third rings and on the south side of the third ring. Cluster VII consisted of 62 DPUs that were at low risk, making up 42.8% of the total, mainly distributed along the third ring of the city and in the outer areas. The data presented in Figure 4b show that high-risk DPUs mostly had a low proportion of UGI area, indicating the problem of insufficient supply of UESs.
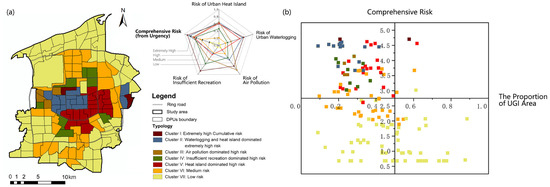
Figure 4.
(a) The risk typology of DPUS; (b) Relationship between the proportion of UGI area and comprehensive risk level of different types of DPUs.
3.3. Urgency of Risk
We employed the dynamic weighting method to calculate the weights of each DPU (Figure 5a) and applied them to comprehensively evaluate the risks (Figure 5b). A total of 75 DPUs had medium risk, medium–high-risk, or high risk, accounting for 51.7% of the total, and were mainly distributed within the second ring road, extending towards the third ring road, indicating the outward spillover feature of risks. Among them, 20 DPUs had high risk, making up 13.8% of the total, primarily located within the city wall and to the north, west, and northeast of the second ring road, as well as to the east of the third ring road. Additionally, there were 24 medium–high-risk DPUs, representing 16.6% of the total, mainly distributed along the second ring road and the east of the third ring road. Low–medium-risk and low-risk areas were mostly situated at the edge of the outer three ring roads.
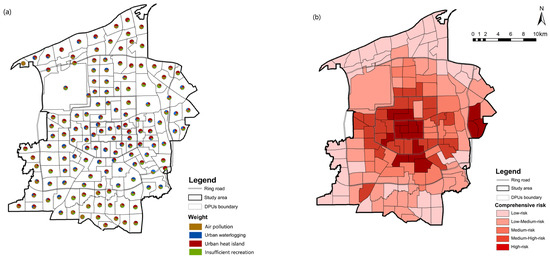
Figure 5.
(a) The dynamic weight for each DPU. (b) The comprehensive risk of UES supply–demand mismatch.
3.4. Synergetic Potential
The results of the local Moran’s I for both univariate and bivariate calculations are presented in Figure 6 and Table 4. All spatial autocorrelation results for univariate and bivariate variables show a significant positive correlation (p < 0.001), indicating high-value aggregation of single or multiple risks between DPSs and their neighboring units. As illustrated in Figure 6, the high-value aggregation areas (HH) of three regulating services’ mismatch risks were observed in the central city, while those related to the risk of insufficient recreation were scattered along the second ring. To further investigate the degree of correlation between risks, the HH types of univariate and bivariate spatial autocorrelation analysis results were superimposed independently (Figure 7a,b). The high-value DPUs of both were located on the north side within the first ring wall and on the west and northwest sides of the second ring road. Although they overlapped mostly, there were still differences between them. By equally superimposing two maps and dividing the result into five levels, a comprehensive synergy potential was obtained, as displayed in Figure 7c. A total of 19 units with high and medium–high synergy potential were identified, indicating that approximately 13.1% of the total area should be specially considered.
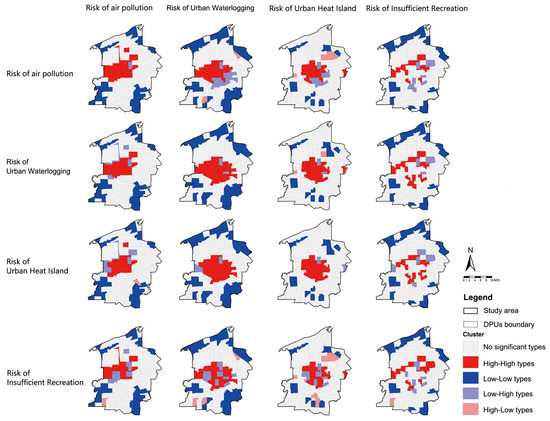
Figure 6.
Clustering maps of four risks.
Table 4.
The Moran’s I and p values for univariate and bivariate spatial autocorrelation.
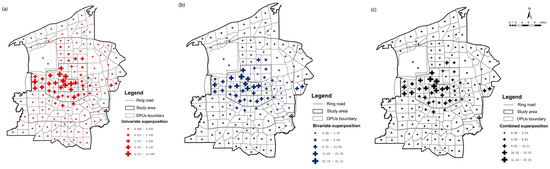
Figure 7.
The results of spatial autocorrelation in high–high regions ((a) univariate, (b) bivariate, (c) comprehensive).
3.5. Priority of UGI Interventions
3.5.1. Spatial Ranking of DPUs for UGI Interventions
After considering the TOPSIS method, we conducted a ranking of every DPU (See Appendix C for detailed result of the TOPSIS method for all DPUs) and selected the top 20% DPUs (a total of 30) as priority DPUs, which have more needs and potential for UGI interventions (Figure 8). The priority DPUs are primarily located within the first ring road and scattered along the second ring road, with a higher concentration on the west and east sides. Additionally, three DPUs are distributed on the north and east sides of the Third Ring Road. For details of the ranking, please refer to Figure 8 and Table 5. Three different kinds of DPUs were selected. As shown in Figure 8, the first kind of DPUs occupied high urgency, feasibility, and synergy simultaneously and were clustered within the first ring road, as well as the western section of the second ring road, such as LH-07, LH-02, and DMG-07. The second kind of DPUs only highlighted two factors. The DPUs situated in the east section of the second ring road, such as XC-07, YT-08, and XC-08, have a high level of urgency and feasibility. Meanwhile, the DPUs within the first ring road, such as LH-12 and LH-13, exhibited high levels of urgency and synergy.
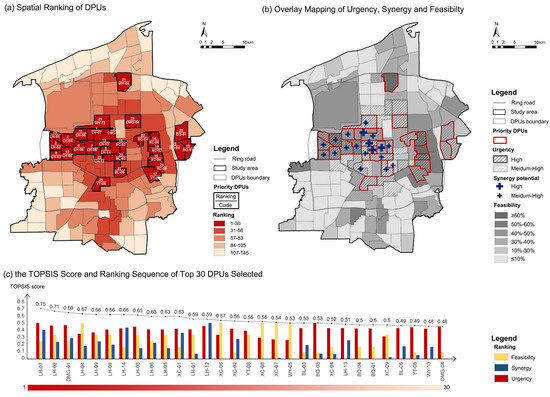
Figure 8.
Spatial ranking of DPUs for UGI interventions.
Table 5.
The priority ranking of TOP30 DPUs based on TOPSIS method.
These 30 DPUs faced multiple risks of UES supply–demand mismatch and high spatial aggregation of risk, indicating higher transforming effectiveness and high feasibility of implementation. Policy makers should make decisions according to the clear ranking result of the TOPSIS score, as well as additional factors to be considered.
3.5.2. The Categorization Strategy of UGI Interventions Based on Risk Typology
In response to different risk typologies, we developed a categorization UGI intervention strategy tailored to their implementation feasibility and matching priority UGI types. As shown in Figure 9, the strategies can be divided into three categories: (1) embed and integrate, (2) create and restore, and (3) preserve and protect. We can match the strategies according to the feasibility of the seven risk types. UGI types should also be targeted and matched to specific risk types to improve responsiveness to certain risks.
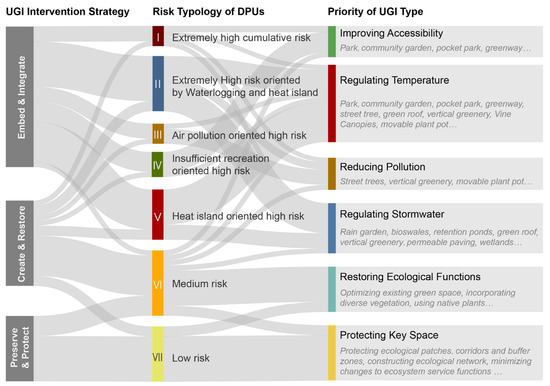
Figure 9.
Categorization Strategy of UGI interventions based on risk typology.
4. Discussion
The key objective of sustainable urban renewal in built-up areas is to achieve synergistic optimization of spatial performance and resident well-being by addressing urban environmental issues and enhancing the functionality of UESs. In addition, to effectively allocate UGI as a public asset to areas in need during urban renewal, determining priority locations and timing is essential [23,32,45]. Therefore, we proposed a framework that identifies the priority of UGI interventions in DPUs based on the assessment of risks of UES supply–demand mismatch. This framework evaluates the urgency, typology, synergy, and feasibility of UGI interventions in a step-by-step manner, which helps to optimize the spatial layout of UGI at the city level, target UGI intervention types, and integrate DPUs to achieve synergy effects.
4.1. Spatial Priority Identification Integrating Urgency, Synergy, and Feasibility
UGI interventions in built-up areas, with the objective of sustainable renewal, have garnered significant research attention. In this study we proposed a stepwise framework integrating urgency, synergy, and feasibility to identify the priority of DPUs for UGI interventions, which is crucial for UGI planning.
The first step is to assess the risk of UES supply–demand mismatches, which requires the scientific integration of multiple risks [46]. We adopted the dynamic weighting method [45,47,64], which can dynamically adjust weights based on the four UES risk characteristics of each DPU. This method addresses the problem of weakening single high-risk value areas during the overlay process, which might be caused by the equal weight method, entropy methods, or other methods that use globally uniform weights [45,46,47]. Currently, areas in need of urgent intervention due to high risks of UES supply–demand mismatch are mainly concentrated in the old city center, which is consistent with the research conclusions reported in [32]. This reflects the trap of compact urban development, namely the compact city paradox [4]. These DPUs not only represent comprehensive high-risk areas but also areas with the highest level of social vulnerability (Figure 3), particularly those with high proportions of elderly residents. UGI intervention strategies should be formulated based on the characteristics and needs of vulnerable groups in order to improve spatial justice [65].
The second step involves evaluating the synergy among DPUs to enhance the multifunctional optimization effect [19,25,47,66] of UGI and promote collaboration between them. Numerous studies have confirmed the multifunctionality of UGI, which provides synergistic effects among multiple UESs [9,23,66]. However, from a planning and coordination perspective, it is important to assess the local relationship of synergy among DPUs [45]. DPUs facing similar high risks are more likely to collaborate and implement city-level UGI interventions, which can significantly enhance UGI connectivity. There were 19 DPUs (13%) with high synergy potentials, reflecting the reality of the high risk of UES supply–demand mismatch in both DPUs and the surrounding areas. On the one hand, this indicates that residents in these DPUs had persistently faced multiple environmental risk pressures, which may worsen or spread non-linearly if not addressed in time [45]. On the other hand, there was significant demand and potential for synergy optimization among these DPUs and their surrounding areas. The advantages of integrating UGI interventions among DPUs should be fully utilized to enhance spatial overflow effects after the implementation of UGI measures.
Thirdly, amidst a backdrop of stock renewal, feasibility is crucial for UGI implementation. The built-up areas were facing escalating developmental pressure [47], so it was challenging to implement an incremental logic-based optimization strategy for the construction an ideal UGI blueprint. Thus, proportions of vacant land, low-efficiency land, and land awaiting renewal within DPUs could serve as key indicators of the feasibility of implementation [25,38].
Finally, we utilized the TOPSIS method, which can comprehensively rank alternatives by considering multiple criteria simultaneously, making it well-suited to integrate the urgency, synergy, and feasibility factors we mentioned earlier. Furthermore, the TOPSIS method allows for the inclusion of subjective preferences and weights [62,63], which means that we can gather opinions from experts [25] and different stakeholders [26]. This gives decision makers more control over the decision-making process and could potentially enhance the effectiveness and efficiency of planning practice [62].
4.2. Categorization of UGI Interventions Based on Risk Typology
The current 145 DPUs can be classified into seven categories based on clustering results, with each category corresponding to different levels of risk and dominant issues. Figure 4b shows that the risk level of DPUs was closely related to their internal proportion of the UGI area. High-risk DPUs usually had a low proportion of UGI areas and a high population demand, while peripheral DPUs had a higher proportion of UGI areas with less demand. This indicates a mismatch between green space supply and residents’ demand in the city [32].
As shown in Figure 9, DPUs with high and extremely high risk levels should maximize the use of available space, improve both the quantity and quality of UGI, and choose effective UGI intervention strategies and types based on risk typology. Targeted and precise UGI intervention strategies should be formulated accordingly. For DPUs with a high proportion of renewal land, the “create and restore” approach [19] can be employed, and innovative approaches should be carried out using policy opportunities such as urban renewal, ecological restoration, sponge city [13], brownfield restoration [67], transformation of gray infrastructure into green infrastructure [68], rooftop and vertical greening [2,4], etc. While for DPUs with limited available land, a gradual “embed and integrate” approach can be implemented. In addition to top–down updates, bottom–up spontaneous public action should not be overlooked. Cities such as Berlin and London [69] encouraged public participation through their “tree planting plan” policy, which helped residents rebuild their connection with nature by providing ecological engagement opportunities while reshaping urban residents’ perceptions, memories, and attitudes towards nature. This promoted ecological awareness and encouraged green actions [9].
DPUs with a medium risk level may face increasing risk of supply–demand mismatch. Therefore, to avoid further exacerbation, a “create and restore” approach can be chosen for the early creation and protection of high-quality green space, as well as the optimization and upgrading of existing UGI quality. For DPUs currently at the low risk level, the relative balance of supply and demand is due to undeveloped land and abundant green space supply, in addition to low population density and less demand pressure. However, with further urban development, they still face the risk of supply–demand mismatch in the future. Therefore, the “preserve and protect” strategy should be adopted to identify key UGI in advance, and green space should be maximally protected to prevent green spaces from being encroached upon during the process of urban development. Methods should be taken into account to minimize the degradation of ecosystem service functions before and after planning, such as an assessment tool for setting ecosystem performance baselines for urban transformation [23].
4.3. Limitations and Furutre Directions
The present study is subject to several limitations. First, the assessment of risks of UES supply–demand mismatch only explored four major environmental issues in the built-up areas of medium and large Chinese cities. However, the research framework is highly flexible and can be expanded to include evaluations of other services, such as carbon storage and biodiversity, based on changes in research objects, scope, and the availability of data. Secondly, while factor weights for spatial priority recognition in this study were established based on expert opinions, future research could benefit from a comparison of scenarios [17] that involve different stakeholder perspectives to enhance the comprehensiveness and defensibility of spatial priority recognition outcomes. Thirdly, the study mainly focused on diagnosing the priority of UGI inventions, which is a crucial step in identifying typical units and developing targeted approaches. Due to length limitations, we did not thoroughly explore detailed strategies for responding to different levels and types of risks. Finally, our evaluation relied on city-scale data from different sources, the precision and quality of which are subject to certain limitations. Therefore, enhancing the accuracy and reliability of available data is crucial for future studies.
5. Conclusions
In the context of sustainable urban renewal, UGI interventions have attracted increasing attention due to their ability to provide targeted, multifunctional improvements that are essential for achieving high-quality development and enhancing residents’ well-being. We propose a six-step framework integrating urgency, synergy, feasibility, and typology to identify priority UPDs that require UGI interventions. In Xi’an’s built-up area, we evaluated 145 DPUs and assessed the risks of UES supply–demand mismatch. DPUs were classified into different risk typologies using clustering analysis, and the synergy potential between DPUs was determined through univariate and bivariable local spatial autocorrelation analysis. Finally, we determined the spatial ranking of DPUs and matched adaptive strategies to prioritize UGI interventions.
Our study is characterized by two main strengths. First, we proposed a stepwise framework to address the limitations associated with the current UGI spatial prioritization evaluation framework. The proposed framework utilizes the dynamic weighting method in the first step, identifying the urgency of risks that highlight serious risks. Then, the TOPSIS method is used to integrate “urgency, synergy, and feasibility” and identify the spatial ranking of DPUs, enriching the dimensions prioritizing UGI interventions in built-up areas and increasing clarity in decision making. Secondly, we focused on DPUs to better characterize the spatial heterogeneity and enhance effective linkages with the current spatial planning system. This framework is designed to be flexible in utilizing obtainable data and national standards, making it applicable to most cities. Our study can provide scientific evidence for the comprehensive implementation of spatial planning, urban renewal, and high-quality sustainable development.
Author Contributions
Conceptualization, D.W. and R.D.; methodology, D.W.; software, D.W. and R.D.; validation, D.W., R.D. and Z.L.; formal analysis, D.W.; investigation, R.D. and Y.W.; resources, Z.L.; data curation, R.D. and Y.W.; writing—original draft preparation, D.W. and R.D.; writing—review and editing, D.W. and R.D.; visualization, R.D. and Y.W.; supervision, Z.L.; project administration, D.W.; funding acquisition, D.W. All authors have read and agreed to the published version of the manuscript.
Funding
This research was funded by the National Key R&D Program of China “Urban Blue-Green Space Planning and Optimization Techniques for Ecosystem Service” (2022YFC3802603) and the Youth Foundation for Humanities and Social Sciences, Ministry of Education (22XJCZH006).
Institutional Review Board Statement
Not applicable.
Informed Consent Statement
Informed consent was obtained from all participants involved in the survey to determine factor weights for the TOPSIS analysis.
Data Availability Statement
The data presented in this study are available from the corresponding author upon reasonable request.
Acknowledgments
We would like to sincerely thank the anonymous reviewers for their valuable comments and suggestions. We are especially grateful to Qinghua Zhou and Bangrui Yue for their guidance on the content of the paper. Additionally, we would like to express our appreciation to Zimu Niu, Fulin Zhu, and Yimei Zhang for their contribution to data processing.
Conflicts of Interest
The authors declare no conflict of interest.
Appendix A. Detailed Data Source
We compiled Table A1 in order to provide a detailed overview of the data used in our study. Additionally, the table provides information on the acquisition time, accuracy, and source of the data.
Table A1.
Detailed Data Source.
Table A1.
Detailed Data Source.
| No. | Final Data | Original Data (Year) | Figure of Data | Format | Data Source | Remark |
|---|---|---|---|---|---|---|
| 1 | Average Annual Concentration of AQI, SO2, NO2, PM10, PM2.5 | Xi’an Environmental Quality Monitoring Stations daily data (2020) |  | .SHP | http://www.cnemc.cn/en/ | We obtained daily data from each air pollution monitoring station in 2020, and calculated the annual average air pollution data by taking the average of daily data.(AQI, SO2, PM10, PM2.5). |
| 2 | Surface Temperature Data | Landsat8 Remote Sensing Image (2019) |  | .TIF/30 m | http://www.gscloud.cn | We used the atmospheric correction method to retrieve land surface temperature from the imagery. |
| 3 | The Density of Waterlogging Points | Waterlogging Point s (2021) |  | .SHP | https://map.baidu.com/ | We supplemented our collection of waterlogging points by gathering information on recent reports of waterlogging, as well as collecting puddle points from Baidu Maps. |
| 4 | Building Density | Building Data (2021) |  | .SHP | https://map.baidu.com/ | We calculated the building density for each unit by computing the ratio between the building area and the area of the DPUs. |
| 5 | Road Density | Road Data (2021) |  | .SHP | https://map.baidu.com/ | We computed the total length of road network within each DPU, and divided it by the spatial unit’s area to obtain the road network density |
| 6 | Park Accessibility | Park Entrance and Exit Data (2022) |  | .SHP | https://map.baidu.com/ | We obtained data on “Green space” and “Plaza” by using AOI on Baidu Maps, supplemented any missing park data through visual interpretation and conducted network analysis to calculate the accessibility of the parks. |
| 7 | Population Density | Population Data of DPUs (2022) |  | .SHP | Non-public data from Xi’an Urban Planning and Design Institute | We calculated population density using population data and the area of DPUs, which were used for exposure assessment. |
| 8 | Proportion of Elderly | The Seventh Census Data(2020) |  | .SHP | http://www.stats.gov.cn/english/PressRelease/202105/t20210510_1817185.html | / |
| 9 | Proportion of Children | The seventh Census Data(2020) |  | .SHP | / | |
| 10 | Residential land area not covered by parks and green spaces within the service radius | Residential Land |  | .SHP | Non-public data from Xi’an Urban Planning and Design Institute | We overlaid the network analysis results with the residential areas in the central urban area of Xi’an and calculated the residential area not covered in each DPU. |
| 11 | Urban Green Infrastructure (UGI) | GF-1 (2017) |  | .TIF/2m | http://www.gscloud.cn | The distribution data of green space in Xi’an city is based on the 2-m resolution high-resolution satellite imagery of GF-1 on April 12, 2017, covering the central urban area. |
In addition, the interpretation process of UGI is supplemented. The interpretation process is mainly carried out using the E-Cognition 10.2 software and consists of two parts: image segmentation and land use classification. The vegetation-enhanced image is segmented by a multi-scale segmentation method with a basic segmentation unit of 9, a shape preservation rate of 0.2 and a smoothness rate of 0.8 to obtain more accurate boundaries of green infrastructure.
After segmentation, the NDVI threshold classification method is used to extract green space. After parameter testing, an NDVI threshold value greater than 0.2 is adopted to obtain ideal extraction results for vegetation boundaries as shown in Figure A1. Finally, the image is smoothed and merged and exported as a .shp format (Figure A1b).

Figure A1.
Interpretation process of UGI.
Figure A1.
Interpretation process of UGI.

Appendix B. List of Experts Consulted for Opinions
We conducted an experiment to determine the weight urgency, synergy and feasibility in order to use the TOPSIS method. We adopted anonymous questionnaire to survey, a total of 25 experts were invited from various fields, including government administrator, urban planner and academic researcher in professional fields, as shown in Table A2, to evaluate the importance relationship between urgency, synergy and feasibility in identifying priority DPUs for urban green infrastructure (UGI) interventions. Of the 21 responses received, 4 were excluded for failing the consistency test. The questionnaire results are shown in Table A2, and the result can be found in Table A3. The remaining 17 questionnaires were analyzed using the AHP method in Yaahp3.0, which revealed that the weights for urgency, feasibility, and synergy were 0.4764, 0.2930, and 0.2306, respectively. These weights have been used in the TOPSIS method to calculate the comprehensive score and spatial ranking for DPUs.
Table A2.
List of experts consulted for opinions.
Table A2.
List of experts consulted for opinions.
| Occupation Type | Numbers of Experts | Professional Fields | Numbers of Experts |
|---|---|---|---|
| Government Administrator | 7 | Urban Planning | 3 |
| Ecological Planning | 2 | ||
| Environmental Management | 1 | ||
| Urban Greening | 1 | ||
| Urban Planner | 7 | Urban Planning | 2 |
| Urban Design | 2 | ||
| Landscape Planning | 2 | ||
| Ecological Planning | 1 | ||
| Academic Researcher | 11 | Urban Planning | 5 |
| Landscape Architecture | 4 | ||
| Ecological Planning | 2 |
Table A3.
Questionnaire Results.
Table A3.
Questionnaire Results.
| ID | Urgency, Compared to Synergy | Urgency, Compared to Feasibility | Synergy, Compared to Feasibility |
|---|---|---|---|
| 1 | 9.00 | 5.00 | 0.25 |
| 2 | 1.00 | 5.00 | 5.00 |
| 3 | 7.00 | 3.00 | 0.33 |
| 4 | 3.00 | 1.00 | 0.33 |
| 5 | 5.00 | 2.00 | 0.20 |
| 6 | 0.20 | 0.50 | 5.00 |
| 7 | 0.20 | 0.20 | 1.00 |
| 8 | 4.00 | 3.00 | 0.33 |
| 9 | 2.00 | 0.33 | 0.33 |
| 10 | 5.00 | 1.00 | 0.20 |
| 11 | 4.00 | 9.00 | 5.00 |
| 12 | 5.00 | 3.00 | 0.33 |
| 13 | 5.00 | 5.00 | 5.00 |
| 14 | 5.00 | 3.00 | 0.33 |
| 15 | 2.00 | 5.00 | 5.00 |
| 16 | 1.00 | 0.33 | 0.20 |
| 17 | 0.25 | 0.25 | 3.00 |
| Geometric Mean | 2.13 | 1.59 | 0.81 |
Appendix C. Detailed Result of the TOPSIS Method for All DPUs
We used the SPSS 25.0 software and TOPSIS method to calculate the comprehensive priority scores of 145 spatial units in the central urban area of Xi’an based on importance, synergy, and feasibility (Table A4). We identified the top 20% of these units (TOP 30, highlighted in gray in Table A4) as priority areas for further analysis, which are discussed in detail in the main text of the paper. Please refer to the complete ranking below for reference.
Table A4.
Detailed result of the TOPSIS method for all DPUs.
Table A4.
Detailed result of the TOPSIS method for all DPUs.
| DPUs Code | Positive Ideal Distance | Negative Ideal Distance | Urgency | Feasibility | Synergy | Score | Ranking |
|---|---|---|---|---|---|---|---|
| LH-07 | 0.29 | 0.84 | 1.00 | 0.50 | 0.81 | 0.75 | 1 |
| LH-02 | 0.31 | 0.77 | 0.93 | 0.67 | 0.48 | 0.71 | 2 |
| DMG-01 | 0.34 | 0.76 | 0.94 | 0.50 | 0.58 | 0.69 | 3 |
| LH-04 | 0.37 | 0.75 | 0.70 | 1.00 | 0.37 | 0.67 | 4 |
| LH-14 | 0.38 | 0.74 | 0.85 | 0.33 | 0.87 | 0.66 | 5 |
| LH-08 | 0.36 | 0.70 | 0.82 | 0.67 | 0.40 | 0.66 | 6 |
| LH-09 | 0.35 | 0.67 | 0.74 | 0.67 | 0.49 | 0.66 | 7 |
| LH-03 | 0.39 | 0.73 | 0.90 | 0.67 | 0.30 | 0.65 | 8 |
| XC-01 | 0.40 | 0.70 | 0.84 | 0.33 | 0.72 | 0.63 | 9 |
| LH-05 | 0.40 | 0.69 | 0.82 | 0.67 | 0.30 | 0.63 | 10 |
| LH-06 | 0.40 | 0.66 | 0.82 | 0.50 | 0.45 | 0.63 | 11 |
| LH-12 | 0.54 | 0.79 | 0.91 | 0.00 | 1.00 | 0.59 | 12 |
| LH-01 | 0.47 | 0.68 | 0.82 | 0.67 | 0.14 | 0.59 | 13 |
| XC-06 | 0.53 | 0.71 | 0.67 | 1.00 | 0.00 | 0.57 | 14 |
| XC-02 | 0.51 | 0.64 | 0.84 | 0.17 | 0.55 | 0.56 | 15 |
| XC-08 | 0.56 | 0.68 | 0.59 | 1.00 | 0.00 | 0.55 | 16 |
| YT-08 | 0.54 | 0.65 | 0.78 | 0.67 | 0.00 | 0.55 | 17 |
| XC-07 | 0.56 | 0.66 | 0.54 | 1.00 | 0.02 | 0.54 | 18 |
| BQ-03 | 0.61 | 0.70 | 1.00 | 0.17 | 0.14 | 0.53 | 19 |
| BL-03 | 0.55 | 0.62 | 0.85 | 0.17 | 0.38 | 0.53 | 20 |
| WY-05 | 0.58 | 0.65 | 0.52 | 1.00 | 0.00 | 0.53 | 21 |
| XC-04 | 0.56 | 0.61 | 0.85 | 0.33 | 0.13 | 0.52 | 22 |
| LH-13 | 0.60 | 0.64 | 0.85 | 0.00 | 0.51 | 0.51 | 23 |
| XC-09 | 0.56 | 0.56 | 0.62 | 0.67 | 0.04 | 0.50 | 24 |
| BQ-01 | 0.61 | 0.61 | 0.84 | 0.33 | 0.00 | 0.50 | 25 |
| BQ-04 | 0.61 | 0.61 | 0.84 | 0.33 | 0.00 | 0.50 | 25 |
| YT-05 | 0.63 | 0.61 | 0.87 | 0.17 | 0.10 | 0.49 | 26 |
| BL-05 | 0.64 | 0.61 | 0.85 | 0.00 | 0.34 | 0.49 | 27 |
| DMG-04 | 0.66 | 0.62 | 0.89 | 0.17 | 0.00 | 0.48 | 28 |
| WY-13 | 0.64 | 0.59 | 0.83 | 0.00 | 0.32 | 0.48 | 29 |
| YT-04 | 0.62 | 0.56 | 0.77 | 0.33 | 0.00 | 0.47 | 30 |
| WY-08 | 0.69 | 0.62 | 0.89 | 0.00 | 0.13 | 0.47 | 31 |
| YT-06 | 0.67 | 0.59 | 0.85 | 0.00 | 0.20 | 0.47 | 32 |
| LH-11 | 0.69 | 0.58 | 0.84 | 0.00 | 0.15 | 0.46 | 33 |
| YT-10 | 0.63 | 0.54 | 0.73 | 0.33 | 0.00 | 0.46 | 34 |
| BL-09 | 0.69 | 0.58 | 0.84 | 0.00 | 0.14 | 0.46 | 35 |
| DMG-05 | 0.58 | 0.49 | 0.65 | 0.33 | 0.20 | 0.46 | 36 |
| DMG-03 | 0.69 | 0.57 | 0.82 | 0.00 | 0.14 | 0.45 | 37 |
| BL-06 | 0.65 | 0.53 | 0.72 | 0.00 | 0.37 | 0.45 | 38 |
| BL-01 | 0.67 | 0.54 | 0.77 | 0.00 | 0.24 | 0.45 | 39 |
| CB-10 | 0.61 | 0.49 | 0.59 | 0.50 | 0.02 | 0.44 | 40 |
| HT-01 | 0.62 | 0.49 | 0.58 | 0.50 | 0.00 | 0.44 | 41 |
| JK-10 | 0.64 | 0.50 | 0.67 | 0.33 | 0.00 | 0.44 | 42 |
| CB-13 | 0.64 | 0.48 | 0.46 | 0.67 | 0.00 | 0.43 | 43 |
| XC-05 | 0.63 | 0.47 | 0.62 | 0.33 | 0.07 | 0.43 | 44 |
| XC-03 | 0.61 | 0.45 | 0.59 | 0.33 | 0.16 | 0.42 | 45 |
| BL-04 | 0.63 | 0.45 | 0.59 | 0.33 | 0.11 | 0.42 | 46 |
| CB-15 | 0.66 | 0.45 | 0.39 | 0.67 | 0.00 | 0.41 | 47 |
| BL-02 | 0.72 | 0.49 | 0.70 | 0.00 | 0.10 | 0.40 | 48 |
| DMG-02 | 0.73 | 0.48 | 0.70 | 0.00 | 0.08 | 0.40 | 49 |
| YT-13 | 0.67 | 0.44 | 0.58 | 0.33 | 0.00 | 0.40 | 50 |
| JK-16 | 0.75 | 0.49 | 0.72 | 0.00 | 0.00 | 0.40 | 51 |
| BL-10 | 0.74 | 0.48 | 0.70 | 0.00 | 0.05 | 0.40 | 52 |
| LH-10 | 0.72 | 0.47 | 0.67 | 0.00 | 0.12 | 0.39 | 53 |
| CA-04 | 0.67 | 0.43 | 0.57 | 0.33 | 0.00 | 0.39 | 54 |
| CA-06 | 0.67 | 0.43 | 0.57 | 0.33 | 0.00 | 0.39 | 54 |
| QJ-02 | 0.66 | 0.43 | 0.48 | 0.50 | 0.00 | 0.39 | 55 |
| YT-07 | 0.66 | 0.42 | 0.46 | 0.50 | 0.02 | 0.39 | 56 |
| JK-15 | 0.76 | 0.47 | 0.67 | 0.00 | 0.00 | 0.38 | 57 |
| QJ-01 | 0.76 | 0.46 | 0.67 | 0.00 | 0.00 | 0.38 | 58 |
| BL-07 | 0.74 | 0.43 | 0.62 | 0.00 | 0.10 | 0.37 | 59 |
| YT-03 | 0.76 | 0.44 | 0.64 | 0.00 | 0.01 | 0.37 | 60 |
| WY-07 | 0.69 | 0.39 | 0.50 | 0.33 | 0.00 | 0.36 | 61 |
| YT-15 | 0.73 | 0.40 | 0.24 | 0.67 | 0.00 | 0.35 | 62 |
| CB-05 | 0.73 | 0.38 | 0.54 | 0.17 | 0.00 | 0.34 | 63 |
| YT-02 | 0.71 | 0.36 | 0.45 | 0.33 | 0.00 | 0.33 | 64 |
| QJ-06 | 0.78 | 0.39 | 0.57 | 0.00 | 0.00 | 0.33 | 65 |
| JK-14 | 0.79 | 0.38 | 0.55 | 0.00 | 0.00 | 0.33 | 66 |
| JK-11 | 0.79 | 0.38 | 0.55 | 0.00 | 0.00 | 0.33 | 66 |
| CB-06 | 0.74 | 0.36 | 0.50 | 0.17 | 0.00 | 0.33 | 67 |
| BL-08 | 0.74 | 0.35 | 0.49 | 0.17 | 0.03 | 0.32 | 68 |
| GX-16 | 0.79 | 0.37 | 0.53 | 0.00 | 0.00 | 0.32 | 69 |
| YT-01 | 0.80 | 0.37 | 0.10 | 0.67 | 0.00 | 0.31 | 70 |
| QJ-03 | 0.79 | 0.36 | 0.53 | 0.00 | 0.00 | 0.31 | 71 |
| GX-04 | 0.80 | 0.36 | 0.52 | 0.00 | 0.00 | 0.31 | 72 |
| WY-12 | 0.73 | 0.32 | 0.39 | 0.33 | 0.00 | 0.31 | 73 |
| YT-14 | 0.74 | 0.32 | 0.39 | 0.33 | 0.00 | 0.30 | 74 |
| WY-DYZ-01 | 0.75 | 0.32 | 0.26 | 0.50 | 0.00 | 0.30 | 75 |
| YT-09 | 0.85 | 0.36 | 0.01 | 0.67 | 0.00 | 0.30 | 76 |
| CA-03 | 0.81 | 0.33 | 0.48 | 0.00 | 0.00 | 0.29 | 77 |
| JK-13 | 0.81 | 0.33 | 0.48 | 0.00 | 0.00 | 0.29 | 78 |
| JK-09 | 0.81 | 0.33 | 0.48 | 0.00 | 0.00 | 0.29 | 78 |
| QJ-08 | 0.78 | 0.30 | 0.19 | 0.50 | 0.00 | 0.28 | 79 |
| CA-07 | 0.77 | 0.28 | 0.31 | 0.33 | 0.00 | 0.27 | 80 |
| YT-11 | 0.78 | 0.28 | 0.39 | 0.17 | 0.00 | 0.27 | 81 |
| CB-12 | 0.82 | 0.28 | 0.13 | 0.50 | 0.00 | 0.26 | 82 |
| JK-12 | 0.83 | 0.28 | 0.40 | 0.00 | 0.00 | 0.25 | 83 |
| QJ-04 | 0.83 | 0.28 | 0.40 | 0.00 | 0.00 | 0.25 | 84 |
| CB-11 | 0.79 | 0.25 | 0.26 | 0.33 | 0.00 | 0.24 | 85 |
| GX-15 | 0.84 | 0.27 | 0.39 | 0.00 | 0.00 | 0.24 | 86 |
| WY-06 | 0.81 | 0.24 | 0.33 | 0.17 | 0.00 | 0.23 | 87 |
| CA-05 | 0.84 | 0.25 | 0.37 | 0.00 | 0.00 | 0.23 | 88 |
| GX-08 | 0.85 | 0.25 | 0.36 | 0.00 | 0.00 | 0.22 | 89 |
| CB-14 | 0.86 | 0.23 | 0.34 | 0.00 | 0.00 | 0.21 | 90 |
| GX-03 | 0.86 | 0.23 | 0.33 | 0.00 | 0.00 | 0.21 | 91 |
| GX-07 | 0.86 | 0.23 | 0.33 | 0.00 | 0.00 | 0.21 | 91 |
| CA-02 | 0.86 | 0.23 | 0.33 | 0.00 | 0.00 | 0.21 | 92 |
| QJ-05 | 0.86 | 0.23 | 0.33 | 0.00 | 0.00 | 0.21 | 93 |
| QJ-DYZ-01 | 0.83 | 0.21 | 0.16 | 0.33 | 0.00 | 0.20 | 94 |
| WY-09 | 0.84 | 0.21 | 0.16 | 0.33 | 0.00 | 0.20 | 95 |
| BQ-02 | 0.83 | 0.20 | 0.26 | 0.17 | 0.00 | 0.19 | 96 |
| GX-02 | 0.87 | 0.20 | 0.30 | 0.00 | 0.00 | 0.19 | 97 |
| CB-16 | 0.86 | 0.19 | 0.10 | 0.33 | 0.00 | 0.18 | 98 |
| WY-04 | 0.86 | 0.19 | 0.10 | 0.33 | 0.00 | 0.18 | 98 |
| CB-02 | 0.84 | 0.19 | 0.24 | 0.17 | 0.00 | 0.18 | 99 |
| WY-03 | 0.87 | 0.19 | 0.09 | 0.33 | 0.00 | 0.18 | 100 |
| GX-10 | 0.89 | 0.18 | 0.26 | 0.00 | 0.00 | 0.17 | 101 |
| YT-12 | 0.89 | 0.18 | 0.26 | 0.00 | 0.00 | 0.17 | 101 |
| CB-17 | 0.91 | 0.18 | 0.00 | 0.33 | 0.00 | 0.16 | 102 |
| JK-06 | 0.91 | 0.18 | 0.00 | 0.33 | 0.00 | 0.16 | 102 |
| WY-10 | 0.91 | 0.18 | 0.00 | 0.33 | 0.00 | 0.16 | 102 |
| WY-01 | 0.91 | 0.18 | 0.00 | 0.33 | 0.00 | 0.16 | 102 |
| WY-02 | 0.91 | 0.18 | 0.00 | 0.33 | 0.00 | 0.16 | 102 |
| HT-02 | 0.89 | 0.16 | 0.24 | 0.00 | 0.00 | 0.16 | 103 |
| QJ-07 | 0.90 | 0.16 | 0.23 | 0.00 | 0.00 | 0.15 | 104 |
| DMG-DYZ-01 | 0.90 | 0.15 | 0.22 | 0.00 | 0.00 | 0.14 | 105 |
| JK-07 | 0.90 | 0.15 | 0.22 | 0.00 | 0.00 | 0.14 | 105 |
| JK-08 | 0.88 | 0.14 | 0.16 | 0.17 | 0.00 | 0.14 | 106 |
| YT-16 | 0.90 | 0.12 | 0.12 | 0.17 | 0.00 | 0.12 | 107 |
| WY-11 | 0.93 | 0.11 | 0.16 | 0.00 | 0.00 | 0.10 | 108 |
| CA-01 | 0.95 | 0.09 | 0.01 | 0.17 | 0.00 | 0.09 | 109 |
| GX-13 | 0.95 | 0.09 | 0.00 | 0.17 | 0.00 | 0.09 | 110 |
| HT-06 | 0.95 | 0.09 | 0.00 | 0.17 | 0.00 | 0.09 | 110 |
| JK-03 | 0.95 | 0.09 | 0.00 | 0.17 | 0.00 | 0.09 | 110 |
| GX-11 | 0.94 | 0.09 | 0.13 | 0.00 | 0.00 | 0.08 | 111 |
| GX-09 | 0.95 | 0.07 | 0.10 | 0.00 | 0.00 | 0.07 | 112 |
| CB-09 | 0.95 | 0.07 | 0.10 | 0.00 | 0.00 | 0.07 | 113 |
| JK-TX-01 | 1.00 | 0.01 | 0.01 | 0.00 | 0.00 | 0.01 | 114 |
| GX-14 | 1.00 | 0.01 | 0.01 | 0.00 | 0.00 | 0.01 | 115 |
| GX-12 | 1.00 | 0.01 | 0.01 | 0.00 | 0.00 | 0.01 | 115 |
| JK-04 | 1.00 | 0.01 | 0.01 | 0.00 | 0.00 | 0.01 | 115 |
| JK-05 | 1.00 | 0.01 | 0.01 | 0.00 | 0.00 | 0.01 | 115 |
| JK-02 | 1.00 | 0.01 | 0.01 | 0.00 | 0.00 | 0.01 | 115 |
| JK-01 | 1.00 | 0.01 | 0.01 | 0.00 | 0.00 | 0.01 | 115 |
| CB-07 | 1.00 | 0.00 | 0.00 | 0.00 | 0.00 | 0.00 | 116 |
| CB-08 | 1.00 | 0.00 | 0.00 | 0.00 | 0.00 | 0.00 | 116 |
| CB-04 | 1.00 | 0.00 | 0.00 | 0.00 | 0.00 | 0.00 | 116 |
| CB-03 | 1.00 | 0.00 | 0.00 | 0.00 | 0.00 | 0.00 | 116 |
| CB-01 | 1.00 | 0.00 | 0.00 | 0.00 | 0.00 | 0.00 | 116 |
| GX-01 | 1.00 | 0.00 | 0.00 | 0.00 | 0.00 | 0.00 | 116 |
| GX-06 | 1.00 | 0.00 | 0.00 | 0.00 | 0.00 | 0.00 | 116 |
| GX-05 | 1.00 | 0.00 | 0.00 | 0.00 | 0.00 | 0.00 | 116 |
| HT-05 | 1.00 | 0.00 | 0.00 | 0.00 | 0.00 | 0.00 | 116 |
| HT-04 | 1.00 | 0.00 | 0.00 | 0.00 | 0.00 | 0.00 | 116 |
| HT-03 | 1.00 | 0.00 | 0.00 | 0.00 | 0.00 | 0.00 | 116 |
References
- UN Department of Economic and Social Affairs. 2018 Revision of World Urbanization Prospects. Available online: https://www.un.org/en/desa/2018-revision-world-urbanization-prospects (accessed on 4 April 2023).
- Langemeyer, J.; Wedgwood, D.; McPhearson, T.; Baró, F.; Madsen, A.L.; Barton, D.N. Creating urban green infrastructure where it is needed—A spatial ecosystem service-based decision analysis of green roofs in Barcelona. Sci. Total. Environ. 2020, 707, 135487. [Google Scholar] [CrossRef]
- Wang, Y.-C.; Shen, J.-K.; Xiang, W.-N. Ecosystem service of green infrastructure for adaptation to urban growth: Function and configuration. Ecosyst. Health Sustain. 2018, 4, 132–143. [Google Scholar] [CrossRef]
- Larondelle, N.; Lauf, S. Balancing demand and supply of multiple urban ecosystem services on different spatial scales. Ecosyst. Serv. 2016, 22, 18–31. [Google Scholar] [CrossRef]
- Langemeyer, J.; Connolly, J.J. Weaving notions of justice into urban ecosystem services research and practice. Environ. Sci. Policy 2020, 109, 1–14. [Google Scholar] [CrossRef]
- Selmi, W.; Selmi, S.; Teller, J.; Weber, C.; Rivière, E.; Nowak, D.J. Prioritizing the provision of urban ecosystem services in deprived areas, a question of environmental justice. AMBIO 2021, 50, 1035–1046. [Google Scholar] [CrossRef]
- Tan, P.Y.; Zhang, J.; Masoudi, M.; Alemu, J.B.; Edwards, P.J.; Grêt-Regamey, A.; Richards, D.R.; Saunders, J.; Song, X.P.; Wong, L.W. A conceptual framework to untangle the concept of urban ecosystem services. Landsc. Urban Plan. 2020, 200, 103837. [Google Scholar] [CrossRef]
- Baker, F.; Smith, G.R.; Marsden, S.J.; Cavan, G. Mapping regulating ecosystem service deprivation in urban areas: A transferable high-spatial resolution uncertainty aware approach. Ecol. Indic. 2021, 121, 107058. [Google Scholar] [CrossRef]
- Andersson, E.; Barthel, S.; Borgström, S.; Colding, J.; Elmqvist, T.; Folke, C.; Gren, Å. Reconnecting Cities to the Biosphere: Stewardship of Green Infrastructure and Urban Ecosystem Services. AMBIO 2014, 43, 445–453. [Google Scholar] [CrossRef]
- Haase, D.; Larondelle, N.; Andersson, E.; Artmann, M.; Borgström, S.; Breuste, J.; Gomez-Baggethun, E.; Gren, Å.; Hamstead, Z.; Hansen, R.; et al. A Quantitative Review of Urban Ecosystem Service Assessments: Concepts, Models, and Implementation. Ambio 2014, 43, 413–433. [Google Scholar] [CrossRef]
- Elliott, R.M.; Motzny, A.E.; Majd, S.; Chavez, F.J.V.; Laimer, D.; Orlove, B.S.; Culligan, P.J. Identifying linkages between urban green infrastructure and ecosystem services using an expert opinion methodology. AMBIO 2020, 49, 569–583. [Google Scholar] [CrossRef]
- Cortinovis, C.; Geneletti, D. A framework to explore the effects of urban planning decisions on regulating ecosystem services in cities. Ecosyst. Serv. 2019, 38, 100946. [Google Scholar] [CrossRef]
- Zhai, J.; Ren, J.; Xi, M.; Tang, X.; Zhang, Y. Multiscale watershed landscape infrastructure: Integrated system design for sponge city development. Urban For. Urban Green. 2021, 60, 127060. [Google Scholar] [CrossRef]
- Chang, C.-R.; Li, M.-H. Effects of urban parks on the local urban thermal environment. Urban For. Urban Green. 2014, 13, 672–681. [Google Scholar] [CrossRef]
- Wu, J.; Jin, X.; Wang, H.; Feng, Z. Evaluating the supply-demand balance of cultural ecosystem services with budget expectation in Shenzhen, China. Ecol. Indic. 2022, 142, 109165. [Google Scholar] [CrossRef]
- Gómez-Baggethun, E.; Barton, D.N. Classifying and valuing ecosystem services for urban planning. Ecol. Econ. 2013, 86, 235–245. [Google Scholar] [CrossRef]
- Kremer, P.; Hamstead, Z.A.; McPhearson, T. The value of urban ecosystem services in New York City: A spatially explicit multicriteria analysis of landscape scale valuation scenarios. Environ. Sci. Policy 2016, 62, 57–68. [Google Scholar] [CrossRef]
- Jalkanen, J.; Vierikko, K.; Moilanen, A. Spatial prioritization for urban Biodiversity Quality using biotope maps and expert opinion. Urban For. Urban Green. 2020, 49, 126586. [Google Scholar] [CrossRef]
- Wang, Y.; Chang, Q.; Fan, P. A framework to integrate multifunctionality analyses into green infrastructure planning. Landsc. Ecol. 2021, 36, 1951–1969. [Google Scholar] [CrossRef]
- Geneletti, D. Combining stakeholder analysis and spatial multicriteria evaluation to select and rank inert landfill sites. Waste Manag. 2010, 30, 328–337. [Google Scholar] [CrossRef]
- Tran, T.J.; Helmus, M.R.; Behm, J.E. Green infrastructure space and traits (GIST) model: Integrating green infrastructure spatial placement and plant traits to maximize multifunctionality. Urban For. Urban Green. 2020, 49, 126635. [Google Scholar] [CrossRef]
- Goodspeed, R.; Liu, R.; Gounaridis, D.; Lizundia, C.; Newell, J. A regional spatial planning model for multifunctional green infrastructure. Environ. Plan. B Urban Anal. City Sci. 2022, 49, 815–833. [Google Scholar] [CrossRef]
- Cortinovis, C.; Geneletti, D. A performance-based planning approach integrating supply and demand of urban ecosystem services. Landsc. Urban Plan. 2020, 201, 103842. [Google Scholar] [CrossRef]
- Karayalcin, I.I. The Analytic Hierarchy Process: Planning, Priority Setting, Resource Allocation; Saaty, T.L., Ed.; McGraw-Hill: New York, NY, USA, 1980; ISBN 0377-2217. [Google Scholar]
- Meerow, S.; Newell, J.P. Spatial planning for multifunctional green infrastructure: Growing resilience in Detroit. Landsc. Urban Plan. 2017, 159, 62–75. [Google Scholar] [CrossRef]
- Venter, Z.S.; Barton, D.N.; Martinez-Izquierdo, L.; Langemeyer, J.; Baró, F.; McPhearson, T. Interactive spatial planning of urban green infrastructure—Retrofitting green roofs where ecosystem services are most needed in Oslo. Ecosyst. Serv. 2021, 50, 101314. [Google Scholar] [CrossRef]
- Sanon, S.; Hein, T.; Douven, W.; Winkler, P. Quantifying ecosystem service trade-offs: The case of an urban floodplain in Vienna, Austria. J. Environ. Manag. 2012, 111, 159–172. [Google Scholar] [CrossRef]
- Wisner, B. At Risk: Natural Hazards, People’s Vulnerability and Disasters; Psychology Press: London, UK, 2004; ISBN 0-415-25215-6. [Google Scholar]
- Tieskens, K.F.; Smith, I.A.; Jimenez, R.B.; Hutyra, L.R.; Fabian, M.P. Mapping the gaps between cooling benefits of urban greenspace and population heat vulnerability. Sci. Total. Environ. 2022, 845, 157283. [Google Scholar] [CrossRef]
- Norton, B.A.; Coutts, A.M.; Livesley, S.J.; Harris, R.J.; Hunter, A.M.; Williams, N.S.G. Planning for cooler cities: A framework to prioritise green infrastructure to mitigate high temperatures in urban landscapes. Landsc. Urban Plan. 2015, 134, 127–138. [Google Scholar] [CrossRef]
- Xin, R.; Zeng, J.; Li, K.; Wang, Q.; Ding, S. Identify Key Areas and Priority Levels of Urban Waterlogging Regulation Service Supply and Demand. Acta Ecol. Sin. 2022, 42, 500–512. [Google Scholar]
- Wu, X.; Tan, C. Evaluation of Ecosystem Services Excess Demand in the Central Area of Wuhan: A Discussion Based on Mismatches between Supply and Demand of Green Infrastructure. Chin. Landsc. Archit. 2020, 36, 127–132. [Google Scholar] [CrossRef]
- Haines-Young, R.; Potschin, M. The Links between Biodiversity, Ecosystem Services and Human Well-Being. In Ecosystem Ecology: A New Synthesis; Cambridge University Press: Cambridge, UK, 2012; pp. 110–139. [Google Scholar] [CrossRef]
- De Manuel, B.F.; Méndez-Fernández, L.; Peña, L.; Ametzaga-Arregi, I. A new indicator of the effectiveness of urban green infrastructure based on ecosystem services assessment. Basic Appl. Ecol. 2021, 53, 12–25. [Google Scholar] [CrossRef]
- Parsa, V.A.; Salehi, E.; Yavari, A.R.; van Bodegom, P.M. An improved method for assessing mismatches between supply and demand in urban regulating ecosystem services: A case study in Tabriz, Iran. PLoS ONE 2019, 14, e0220750. [Google Scholar] [CrossRef]
- Burkhard, B.; Kroll, F.; Nedkov, S.; Müller, F. Mapping ecosystem service supply, demand and budgets. Ecol. Indic. 2012, 21, 17–29. [Google Scholar] [CrossRef]
- Shen, J.; Chen, C.; Wang, Y. What are the appropriate mapping units for ecosystem service assessments? A systematic review. Ecosyst. Health Sustain. 2021, 7, 1888655. [Google Scholar] [CrossRef]
- Zhou, C.; Wu, Y. A Planning Support Tool for Layout Integral Optimization of Urban Blue–Green Infrastructure. Sustainability 2020, 12, 1613. [Google Scholar] [CrossRef]
- Mao, Q.; Huang, G.; Wu, J. Urban Ecosystem Services: A Review. Chin. J. Appl. Ecol. 2015, 26, 1023–1033. [Google Scholar] [CrossRef]
- Lin, Y.; Chen, X.; Huang, L.; Zhu, C.; Shahtahmassebi, A.; Zhang, J.; Shen, S.; Peng, R.; Deng, J.; Wang, K.; et al. Fine-scale mapping of urban ecosystem service demand in a metropolitan context: A population-income-environmental perspective. Sci. Total. Environ. 2021, 781, 146784. [Google Scholar] [CrossRef]
- Li, F.; Guo, S.; Li, D.; Li, X.; Li, J.; Xie, S. A multi-criteria spatial approach for mapping urban ecosystem services demand. Ecol. Indic. 2020, 112, 106119. [Google Scholar] [CrossRef]
- Baró, F.; Haase, D.; Gómez-Baggethun, E.; Frantzeskaki, N. Mismatches between ecosystem services supply and demand in urban areas: A quantitative assessment in five European cities. Ecol. Indic. 2015, 55, 146–158. [Google Scholar] [CrossRef]
- Villamagna, A.M.; Angermeier, P.L.; Bennett, E.M. Capacity, pressure, demand, and flow: A conceptual framework for analyzing ecosystem service provision and delivery. Ecol. Complex. 2013, 15, 114–121. [Google Scholar] [CrossRef]
- Liu, Y.; Zhou, Y. Territory spatial planning and national governance system in China. Land Use Policy 2021, 102, 105288. [Google Scholar] [CrossRef]
- Chen, H.; Wang, N.; Liu, Y.; Zhang, Y.; Lu, Y.; Li, X.; Chen, C.; Liu, Y. A green infrastructure planning framework–guidance for priority, hubs and types. Urban For. Urban Green. 2022, 70, 127545. [Google Scholar] [CrossRef]
- Shen, J.; Guo, X.; Wang, Y. Identifying and setting the natural spaces priority based on the multi-ecosystem services capacity index. Ecol. Indic. 2021, 125, 107473. [Google Scholar] [CrossRef]
- Dong, X.; Ye, Y.; Yang, R.; Li, X. Planning for green infrastructure based on integration of multi-driving factors: A case study in pilot site of sponge city. Sustain. Cities Soc. 2023, 93, 104549. [Google Scholar] [CrossRef]
- Chang, H.-S.; Lin, Z.-H.; Hsu, Y.-Y. Planning for green infrastructure and mapping synergies and trade-offs: A case study in the Yanshuei River Basin, Taiwan. Urban For. Urban Green. 2021, 65, 127325. [Google Scholar] [CrossRef]
- Chao, X.; Nan, M.; Fei, L.; Xiaoming, L.; Zhiyun, O. Research on Urban Green Infrastructure Management in Macao from the Perspective of Ecosystem Service Demand. Chin. Landsc. Archit. 2020, 36, 127–132. [Google Scholar]
- Ge, Y.; Han, L.; Zhao, Y.; Ao, Y.; Ding, J.; Zhu, Y.; Liu, B. Spatiotemporal Analysis of Urban Expansion in Xi’an from 1984 to 2016. Chin. J. Ecol. 2019, 38, 1491–1499. [Google Scholar] [CrossRef]
- Crichton, D. What can cities do to increase resilience? Philos. Trans. A Math. Phys. Eng. Sci. 2007, 365, 2731–2739. [Google Scholar] [CrossRef]
- Data of the Seventh National Population Census. Available online: http://www.stats.gov.cn/english/PressRelease/202105/t20210510_1817185.html (accessed on 12 September 2022).
- Ministry of Ecology and Environment of the People’s Republic of China. Technical Regulation for Ambient Air Quality Assessment (on Trial); Ministry of Ecology and Environment of the People’s Republic of China: Beijing, China, 2013; HJ 663-2013.
- Wang, G.; Jiao, J.; Bao, Y. Technical Guidelines for Urban Ecological Construction Environmental Performance Evaluation; China Architecture & Building Press: Beijing, China, 2015; pp. 52–53. ISBN 978-7-112-19354-7. [Google Scholar]
- Liu, Y.; Zhang, S.; Cheng, P.; Chen, P.; Wei, L.; Fang, X. Research and Application of Heat and Venti-lation Environment Assessment for City Planning—A Case Study of Jinan Central Urban Area. Ecol. Environ. Sci. 2017, 26, 1892–1903. [Google Scholar] [CrossRef]
- Jiménez-Muñoz, J.C.; Sobrino, J.A.; Skoković, D.; Mattar, C.; Cristóbal, J. Land Surface Temperature Retrieval Methods From Landsat-8 Thermal Infrared Sensor Data. IEEE Geosci. Remote Sens. Lett. 2014, 11, 1840–1843. [Google Scholar] [CrossRef]
- Notice on Carrying out the 2022 Urban Physical Examination by the Ministry of Housing and Urban-Rural Development. Available online: http://www.gov.cn/zhengce/zhengceku/2022-07/09/content_5700178.htm (accessed on 25 August 2022). (In Chinese)
- GB/T 51346-2019; Standard for Planning of Urban Green Space. National Standards of the People’s Republic of China: Beijing, China, 2019.
- Talen, E. The social equity of urban service distribution: An exploration of park access in pueblo, colorado, and macon, georgia. Urban Geogr. 1997, 18, 521–541. [Google Scholar] [CrossRef]
- Hansen, R.; Pauleit, S. From Multifunctionality to Multiple Ecosystem Services? A Conceptual Framework for Multifunctionality in Green Infrastructure Planning for Urban Areas. AMBIO 2014, 43, 516–529. [Google Scholar] [CrossRef]
- Davies, C.; MacFarlane, R.; McGloin, C.; Roe, M. Green Infrastructure Planning Guide. Project: Final Report; NECF, Annfield Plain: Durham, UK, 2006; pp. 145–151. [Google Scholar]
- Foroozesh, F.; Monavari, S.M.; Salmanmahiny, A.; Robati, M.; Rahimi, R. Assessment of sustainable urban development based on a hybrid decision-making approach: Group fuzzy BWM, AHP, and TOPSIS–GIS. Sustain. Cities Soc. 2021, 76, 103402. [Google Scholar] [CrossRef]
- Ramya, S.; Devadas, V. Integration of GIS, AHP and TOPSIS in evaluating suitable locations for industrial development: A case of Tehri Garhwal district, Uttarakhand, India. J. Clean. Prod. 2019, 238, 117872. [Google Scholar] [CrossRef]
- Sargaonkar, A.P.; Gupta, A.; Devotta, S. Dynamic weighting system for water quality index. Water Sci. Technol. 2008, 58, 1261–1271. [Google Scholar] [CrossRef]
- Ring, Z.; Damyanovic, D.; Reinwald, F. Green and Open Space Factor Vienna: A Steering and Evaluation Tool for Urban Green Infrastructure. Urban For. Urban Green. 2021, 62, 127131. [Google Scholar] [CrossRef]
- Charoenkit, S.; Piyathamrongchai, K. A review of urban green spaces multifunctionality assessment: A way forward for a standardized assessment and comparability. Ecol. Indic. 2019, 107, 105592. [Google Scholar] [CrossRef]
- De Valck, J.; Beames, A.; Liekens, I.; Bettens, M.; Seuntjens, P.; Broekx, S. Valuing urban ecosystem services in sustainable brownfield redevelopment. Ecosyst. Serv. 2019, 35, 139–149. [Google Scholar] [CrossRef]
- Mulligan, J.; Bukachi, V.; Clause, J.C.; Jewell, R.; Kirimi, F.; Odbert, C. Hybrid infrastructures, hybrid governance: New evidence from Nairobi (Kenya) on green-blue-grey infrastructure in informal settlements. Anthropocene 2020, 29, 100227. [Google Scholar] [CrossRef]
- Yang, X.; Huang, Z.; Ma, J.; Li, S.; Fu, F. Approaches to Public Participation in Urban Green Space Construction under the Refined Scale-A Case Study of “Tree Planting Plan” in Berlin and London. Chin. Landsc. Archit. 2022, 38, 109–114. [Google Scholar] [CrossRef]


Disclaimer/Publisher’s Note: The statements, opinions and data contained in all publications are solely those of the individual author(s) and contributor(s) and not of MDPI and/or the editor(s). MDPI and/or the editor(s) disclaim responsibility for any injury to people or property resulting from any ideas, methods, instructions or products referred to in the content. |
© 2023 by the authors. Licensee MDPI, Basel, Switzerland. This article is an open access article distributed under the terms and conditions of the Creative Commons Attribution (CC BY) license (https://creativecommons.org/licenses/by/4.0/).