Abstract
As the need for a just and equitable energy transition accelerates, disruptive clean energy technologies are becoming more visible to the public. Clean energy technologies, such as solar photovoltaics and wind power, can substantially contribute to a more sustainable world and have been around for decades. However, the fast pace at which they are projected to be deployed in the United States (US) and the world poses numerous technical and nontechnical challenges, such as in terms of their integration into the electricity grid, public opposition and competition for land use. For instance, as more land-based wind turbines are built across the US, contention risks may become more acute. This article presents a methodology based on reinforcement learning (RL) that minimizes contention risks and maximizes renewable energy production during siting decisions. As a proof-of-concept, the methodology is tested on a case study of wind turbine siting in Illinois during the 2022–2035 period. Results show that using RL halves potential delays due to contention compared to a random decision process. This approach could be further developed to study the acceptance of offshore wind projects or other clean energy technologies.
1. Introduction
The United States (US) has set ambitious decarbonization goals for the next decade, largely relying on a clean electricity grid [1]. However, transforming the electric system to integrate more renewable energy resources in such a short period is challenging, with many social and technical elements of the system that need to be altered substantially. For instance, electric-sector technologies, such as thermal power plants and transmission lines, may be shut down or developed [2]. Moreover, various actors, such as power suppliers, network operators, regulatory authorities and industrial and residential consumers, may need to adapt to the new system [3].
Such disruption—defined here as a radical interference in one or more system elements causing more than incremental changes—can contribute to climate change mitigation and bring forth a more sustainable world overall [4]. Examples of disruptive energy technologies are electrification of mobility, digitization, automation and optimization via the smart grid, decentralized renewable energy technologies and combinations thereof [4]. However, while disruptive technologies present opportunities to improve our quality of life and the environment, they can also have unexpected consequences and pose new risks [5]. Radu [6], for instance, reviews the application of disruptive technologies in cities and finds that big data and the Internet of Things can improve cities’ sustainability by visualizing their impacts (e.g., waste flows or emissions of pollutants). However, as those disruptive technologies rely in part on collecting personal data, rules need to be put in place to protect citizens’ privacy and agency [6].
As a disruption to the electric system, large-scale deployment of renewables such as solar photovoltaics and wind power face numerous technical challenges regarding their integration into the grid. For instance, the variability and uncertainty in their power outputs lead to mismatches between electricity supply and demand, leading to safety hazards, equipment damage and power outages [7]. Nontechnical challenges, such as the lack of standards and regulations, the lack of technically skilled labor and high capital costs, further hinder the development of renewable energy technologies [8]. Some prominent social challenges are a lack of awareness of the technologies, public opposition to renewable energy projects and the competition for land use [9]. Public opposition—or social acceptance—of renewable energy technologies (often summarized in the NIMBY (not in my backyard) expression) has been an object of study for the social sciences for a few decades [10].
For instance, while wind power development is constrained by built infrastructure, regulatory context, social land use and ecological and wildlife circumstances [11], it is also dependent on communities’ willingness to host turbines [12]. Factors that can affect acceptance are, among others, the landscape changes, shadow flickers and noise wind turbines can cause in their vicinity [13]. Better knowledge on how these different factors affect local communities could enable counter measures to be designed and wind turbines acceptance to be improved [14]. Ki, et al. [15], for instance, showed that farm layout designs that make wind turbines better integrated into the surrounding landscapes could help alleviating the perceived annoyance of wind turbine noise. Similarly, annoyance from shadow flickers is correlated with wind turbine aesthetics, further highlighting the importance of the design and siting of wind projects [16].
As the energy transition proceeds and the deployment of renewable energy technologies increases, opposition to low-carbon energy infrastructure has become more widespread and its study remains as relevant (if not more) as before [17]. Thus, local communities may be unfavorable to utility-scale solar and wind development projects (both land-based and offshore) [12,17]. A complicating factor is that renewable energy resources are often immobile, meaning that energy generators need to be placed where the “fuel” is (e.g., in the sunniest locations), leaving little room for flexibility to accommodate contention [17].
The social dynamics leading to the social acceptance of low-carbon technologies remain insufficiently studied but could help explain why governments’ engagements (such as the nationally determined contributions) often fall short of the targeted emission reductions [17]. For instance, prior investigations into social acceptance of wind projects focus on case studies of a few wind farms, general attitudes or support for wind energy and wind projects or development practices [12,18], but few studies have attempted to relate local renewable energy contention to exogenous factors such as population density or the visual amenity of landscapes [12]. Current siting models, such as the Renewable Energy Potential model (reV) [19], are also limited in their representation of the social aspects that can affect the development of renewable energy technologies (e.g., in the context of wind energy, only accounting for setbacks but not acceptance).
Focusing on wind power, as more land-based wind turbines are built across the US to reach its decarbonization goals, social acceptance may become more acute. For example, under a 100% clean electricity by 2035 scenario, about 1 TW of land-based wind would be deployed, taking about 5% of the contiguous US land (although 98% of that area would be available for agriculture or other uses), with a significant portion of available land used in many eastern and midwestern states (e.g., 13% in Illinois) [20]. Overall, the number of wind turbine installations needs to grow by one order of magnitude and about six times faster than the fastest installation rate the US has seen so far [20]. Thus, while the total land requirement remains low, the sheer number and pace of new wind turbines that need to be installed are bound to cause some contention, especially in regions with constrained land availability.
In summary, the rapid deployment of land-based wind can contribute to a sustainable energy sector, but it will almost certainly be disruptive for the electricity system. As a sociotechnical system, the grid’s technical and nontechnical aspects will see fundamental changes, not the smallest of them being a change in landscapes. Bessette and Mills [12] showed that several factors might affect the social acceptance of wind, including the amenity of landscapes. Because both the level of contention and wind resources vary across space, it is crucial to plan wind siting in areas that maximize power generation while minimizing contention risks (which can lead to delays or project cancellations). Several optimization techniques have been proposed to solve wind siting problems. However, none have integrated contention risks and the potential delays they could cause [21,22]. Thus, the present study aims at closing this research gap—finding optimal wind sites while accounting for contention risks—through the completion of the following two objectives:
- Propose a methodology that accounts for the trade-off between contention risks and renewable energy resources (such as wind speed and solar irradiance) during siting decisions.
- Develop a proof-of-concept that applies the methodology to a case study of wind siting in Illinois.
While the case study presented in this article is about wind siting, our intent is to develop an approach that can be easily be applied to siting problems for other clean energy technologies.
2. Materials and Methods
In order to find renewable energy sites that minimize contention risks while maximizing power generation, we propose using one possible approach: reinforcement learning (RL). Compared to other approaches such as mixed integer linear programming, RL can provide efficient and optimal decision-making in the face of complex nonlinear dynamics. In this section, we first introduce the approach and then describe the case study and the proof-of-concept model.
2.1. Modeling Approach—Multiagent Reinforcement Learning in a Geographic Environment
The aim of RL is to find the best course of action (the policy) to reach a desired outcome. In RL, one or multiple software agents interact(s) with an unknown environment and learn(s) (on a trial-and-error basis) which sequences of actions enable them to reach their objectives [23]. To do so, RL algorithms provide a reward (or a punishment), , for a given action, that an agent takes when being in a particular state, (Figure 1). States describe “where” the agent is in the environment while actions “move” the agent from one state to another. The environment defines all possible states and actions an agent can access and the rewards/punishments the agent receives. By exploring the environment, agents collect experience and knowledge about the best action to perform, situation-by-situation, in order to maximize the aggregated reward [23]. For example, a software agent learning to play tic-tac-toe through an RL algorithm would associate the action (where to play its next move) taken in a specific state (which moves have been played by both players) with a specific reward. By playing enough games, the agent will learn the best move sequences.
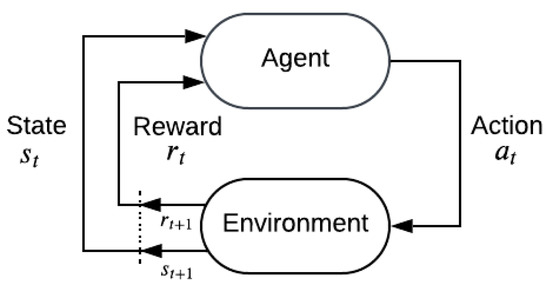
Figure 1.
Working principle of reinforcement learning.
RL can provide optimal decision-making in many challenging tasks with complex nonlinear dynamics and where sequential decisions lead to delayed benefits [23]. For example, RL can be used to study the self-organizing dynamics of social segregation [24,25], the allocation of health resources [26,27] or water management [28]. Several RL algorithms exist, such as Monte Carlo, Bayesian or deep Q-network based. One of the simplest and most popular algorithms is Q-learning. The simplicity of and the numerous articles detailing the approach are the reasons why this algorithm was chosen over other options. In Q-learning, a Q-table records the value of each state–action pair, . The Bellman equation is used to update Q-values as the agent explores the environment:
where the new Q-value associated with the state, , and action, , (, in the Q table is a function of the old Q-value for that state–action pair, , the learning rate, , the discount rate, , the reward, , associated with the action, , and the maximum expected future reward when being in the state, , after taking the action, , . Therefore, in the Bellman equation, the updated Q-value accounts for both the immediate reward associated with the action, (), and the maximum expected value that can be obtained from the subsequent state (due to action ), .
When training the RL algorithm, agents take actions as constrained by the environment (e.g., in the tic-tac-toe example, until one player wins or until the board is full) and record the Q-values associated with the state–action pairs they have visited in the Q-table. One such sequence constitutes an episode. The training process involves many episodes, enabling agents to explore all the possible state–action pairs and learn the associated rewards. At the beginning of the training process, a significant share of the actions taken by the agents is random, allowing for the exploration of the environment. As the training process continues, agents can make more optimal decisions as they have acquired enough information about the environment. At the end of this exploration–exploitation training process, the RL algorithm can find optimal solutions to the problem (e.g., win or tie in our tic-tac-toe example).
We propose using reinforcement learning to maximize power generation while minimizing contention risks for land-based wind siting decisions. In this exercise, agents learn to optimally place wind turbines in a spatially constrained environment through a Q-learning algorithm. Other approaches, such as mixed integer linear programming or meta-heuristics (e.g., genetic algorithms) could be applied. However, RL can more readily deal with complex nonlinear dynamics and explicitly represent the heterogeneity and decisions of the agent(s), which may provide more insights into the problem. We study siting occurring in Illinois—where wind power already supplies 10% of the electricity [29]—from 2022 to 2035.
2.2. Case Study—Wind Siting in Illinois in the 2022–2035 Period
2.2.1. Input Data Used to Set up the Environment
First, the environment from which agents will gain knowledge and act must be defined. We use the US wind turbine database (USWTDB) to define the number of turbines installed annually in Illinois and their characteristics [30]. The slope of a simple linear interpolation of the cumulative number of turbines as a function of time is determined from the data in the USWTDB and used to compute the number of new turbines installed each year. Similarly, the increase in turbines’ rotor diameter over the years—which will affect the power generated from the turbines—is determined from the linear interpolation of the historical data in the USWTDB.
Next, as we are interested in minimizing contention risks, we use a simplified version of the linear regression model from Bessette and Mills [12] to compute contention scores in each county of Illinois. According to this simplified model, the contention risk () is a function of the state, , the function of the farm (hobby or production-oriented, ), the natural amenity of the land () and the communities’ political orientation ():
For this proof-of-concept, random draws from normal distributions are used to assign variable values in each county (except for the Illinois state variable, which is set as “True” (i.e., (1)) for all counties). The probability distribution parameters, the intercept, , and the regression coefficients (, , and ) are directly taken from Bessette and Mills [12].
In addition to the contention layer, the environment needs to account for the spatial heterogeneity of wind resources. Once again, a simplified approach is used for this proof-of-concept. Rather than using actual wind resource data, we use random draws from a normal distribution to assign each county’s average wind speed (at 80 m). The probability distribution parameters—specific to Illinois—are roughly deduced from the WINDExchange website [31]. Alternatively, the National Renewable Energy Laboratory (NREL) wind integration national dataset toolkit could be used [32].
Finally, we set a land use constraint as part of the environment. Only 5% of each county’s total area is assumed to be available for new wind turbines (although this assumption could be removed if using datasets such as the ones provided by reV [19]). Moreover, each wind turbine is assumed to take half a square kilometer of land [20,33,34]. Thus, the environment within which agents evolve comprises three layers: the contention risk, wind resources and available land. Besides the available land—which decreases as new wind turbines are installed over the years—the wind resources and contention risks are assumed to stay constant over time.
2.2.2. Overview of the Agents
In this case study, agents represent new wind plant projects (encompassing several wind turbines) that need to be sited in a given year. Thus, the set of actions is composed of all Illinois counties and the set of states consists of each year in the 2022–2035 period. The size of the Q-table used in the Q-learning algorithm is, therefore, 14 × 102, and is shared by all agents. The contention risk layer (comprising scores between 0 and 10) defines agents’ probability of facing a 1-year delay when making a siting decision. If they face such delay, agents simply make a new siting decision the following year (and thus have the opportunity to choose a county with fewer contention risks).
The reward function—which will crucially guide agents into making optimal decisions—is defined according to Equation (3):
is the reward associated with the state–action pair, , is the amount of power at the chosen site during a year (county ) and, thus, depends on the wind resources layer, is the level of contention risk at the site (which depends on the contention risk layer) and is the percentage of available land for wind turbines that is already occupied by wind turbines (in other words the remaining land available for new wind turbines). In addition to agents being delayed, a state–action pair leading to such delay (when a random draw is inferior to the contention risk) is penalized so that, during the training, agents learn to avoid such state–action pairs.
2.2.3. Reinforcement Learning Training
The training of the RL algorithm follows simple conventions. The model is trained with 10,000 episodes (one episode being the installation of new wind turbines in Illinois by the agents during the 2022–2035 period). During the first half of the training (for 5000 episodes), agents both explore and exploit the environment. The share of exploration (random siting decisions) is set to 50% at the beginning of the training and gradually decreases to 0% when episode 5000 is reached. Thus, during this first part of the training, agents learn which siting decisions (pairs of state–action) are rewarded and which are penalized and the outcomes are recorded in the Q-table. In the second phase of the training (exploitation), agents choose the pairs of state–action that maximize the aggregated reward (sequence of with the highest Q-value). Therefore, at the end of the training, agents should have learned the optimal policy (i.e., the series of behaviors that leads to the optimum)—or at least a “better than random” one—to reach their objective of minimizing contention risks while maximizing power generation. The trained model is available on the following GitHub repository (https://github.com/jwalzberg/WindAcceptanceModel, (accessed on 20 June 23)).
Figure 2 shows the evolution of the total power generation, rewards and delays during the training of the RL algorithm. The figure shows that power generation and rewards increase sharply during the first phase of the training (until episode 5000) and less so during the second phase. Conversely, delays decrease faster during the first training phase than the second. Overall, training the algorithm roughly doubles the average power generation and reward values and halves average delays compared to random siting decisions. The high variability in values is partly due to the stochasticity of the model: the number of turbines per wind plant project and rotor diameters is drawn from normal distributions, with parameters taken from the USWTDB and interpolation of its data (see Section 2.2.1); delays also depend on random draws.
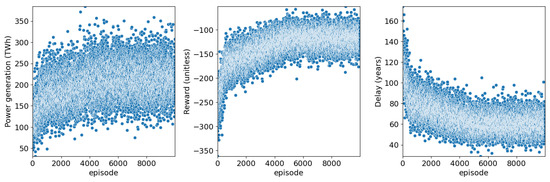
Figure 2.
Power generation, total rewards and delays as a function of training episodes (n = 10,000).
3. Results and Discussion
3.1. Optimizing Wind Siting Decisions in Illinois during the 2022–2035 Period
To demonstrate the benefits of our approach, we compare two scenarios. In the first scenario, optimized wind turbine siting decisions are made using the trained RL algorithm (not allowing for any exploration of the environment, only exploitation). In the second scenario, the locations of the wind turbines are determined randomly (i.e., the agents do not use the Q-table but random draws to make their decisions).
Figure 3 shows the power generated and delays due to contention during the 2022–2035 period in the two scenarios defined above. During the 2022–2035 period, optimized siting decreases delays by 49 ± 7% and increases power generation by 106 ± 63% compared to the random siting scenario. Moreover, as more and more wind turbines are installed, the benefits of optimized siting decisions increase. For instance, in 2028, the optimized scenario provides for an additional 59 TWh and avoids 26 years of delays compared to the random scenario; whereas in 2035, 103 additional TWh are generated and 63 years of delays are avoided when comparing the two scenarios. Figure 3 illustrates how the trained RL algorithm can lead to better wind siting decisions. Finally, the variability in results (shaded area in Figure 3) stems from the stochastic nature of the model, as the number of turbines per wind plant project and rotor diameters is drawn from normal distributions.
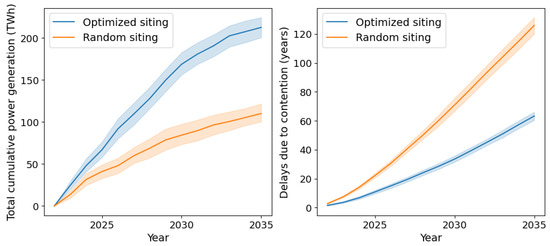
Figure 3.
Power generation and delays when wind turbine siting decisions are random (random siting) or optimized according to the trained RL model (optimized siting) in Illinois for the 2020–2035 period. Shaded areas represent the 95% confidence interval (n = 30).
When using the trained RL model to site wind turbines, counties with a higher risk of contention (e.g., Coles, Jasper, or Will counties) are mostly avoided—regardless of their wind resource potentials—which reduces delays (Figure 4). Thus, few turbines are installed in counties with high contention. In the random siting scenario, few turbines are installed in counties with high contention as well since projects are rejected, which prompts delays and new random siting attempts. However, agents still randomly try those locations, which explains the more significant delays and lower power generation in this scenario (Figure 3 and Figure 4). Overall, no turbines are installed in sites with contention risks above 7.3 (out of 10) in the optimized scenario, whereas only sites with contention risks above 9.8 (out of 10) contain no wind turbines in the random scenario.
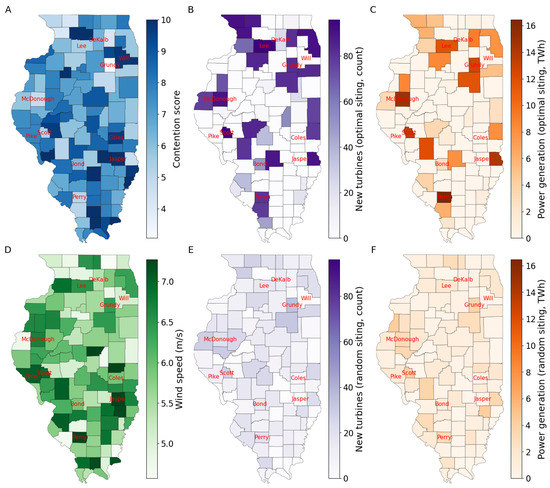
Figure 4.
Contention risks (A), wind resources (D) and siting according to the trained (B,C) and nontrained (E,F) RL model measured by the number of turbines and power generation across Illinois. For the number of turbines and power generation, values are cumulative for the 2022–2035 period with an average of 30 replicates. The contention risks and wind resources are assumed static during the 2022–2035 period.
Figure 4 also reveals that sites with low contention and high wind resources are preferred in the optimized scenario. For instance, Grundy County, with an average wind speed of 6.4 m/s (at 80 m) and a contention risk of 3.1, sees 82 turbines installed in the 2022–2035 period. As another example, 80 wind turbines are installed in Perry County during the 2022–2035 period, where the average wind speed is 7.3 m/s and the contention risk is 5.1. On the contrary, Pike County, which has high wind resources (average wind speed of 7.1 m/s) but high contention risks (6.6), sees only 36 turbines installed during the same period. Finally, sites with moderate contention risks and wind resources (e.g., DeKalb or Bond counties) become more viable options as land availability becomes scarce in other, more beneficial counties (Figure 5).
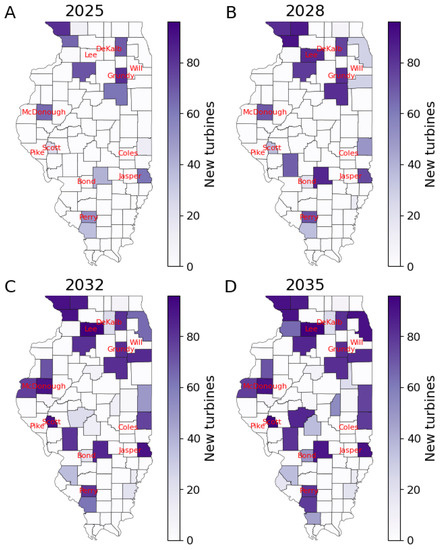
Figure 5.
Selection of new wind turbine siting in Illinois over time in the optimized scenario (values are cumulative for the 2020–2035 period) for 2025 (A), 2028 (B), 2032 (C), and 2035 (D).
Figure 4 also presents the results for the random siting scenario (panels E and F). In the random scenario, sites with high contention are sometimes chosen, but that increases the risk of delays—forcing agents to choose (still randomly) another location in the following year. Sites with low contention and high or moderate wind resources are sometimes selected due to luck. For instance, 34 and 28 wind turbines are installed in Grundy County and Scott County, respectively. However, the number of installed turbines for those two counties is still 65% lower, on average, than in the optimized scenario. Moreover, sites with low contention and low wind resources are, on average, chosen more often than when the trained RL model is used, leading to suboptimal power generation.
Finally, Figure 5 illustrates how the trained algorithm selects wind turbine sites during the 2022–2035 period. The figure confirms that counties with low contention and high wind resources are chosen early on (e.g., Grundy, Perry, Lee and McDonough counties). Later, as land becomes scarcer in the most beneficial counties, more turbines are installed in sites with more moderate wind resources and low contention risks. Interestingly, although the installation rate in moderate resource and contention areas speeds up at the end, a few wind turbines are still installed in these areas during the early years of the 2022–2035 period. Two reasons explain this behavior. First, the crowding penalty increases gradually for the most beneficial states (of the state–action pairs), which can cause the reward to cross a threshold in later years, making those states (i.e., counties in this case study) suddenly less rewarding than others with moderate wind resources or contention risks. Second, the Bellman equation accounts for both the immediate reward associated with an action and the maximum expected value that can be obtained from the subsequent action. Thus, agents can anticipate that the crowding penalty will increase and choose sites with a lower immediate reward but a more beneficial outcome in the end.
3.2. Discussion
Opposition to low-carbon energy infrastructure may become more widespread as the energy transition unfolds. Renewable energy technologies need to be placed where the “fuel” is (e.g., in the sunniest locations), and as a result may compete with other land uses that local communities may favor (e.g., conserving the visual amenity of landscapes). While transforming the electric system to integrate more renewable energy resources is crucial to mitigate climate change, doing so at an accelerated pace represent a challenging disruption [35]. Thus, it is crucial to account for potential contention risks that could delay the energy transition when planning new renewable energy projects.
We developed a proof-of-concept approach using RL that optimizes resource quality and social acceptance criteria for renewable energy siting and demonstrated that it can be used to maximize wind power generation while minimizing contention risks (and associated delays). The case study (with all its simplifying assumptions) illustrates that contention risks and, therefore, wind acceptance could impose severe delays in wind plant projects, reducing the amount of wind power generated in Illinois during the 2022–2035 period (Figure 3). Thus, factoring in contention could help avoid the riskiest locations (counties in our case study), avoiding unnecessary delays (Figure 4). Furthermore, because it accounts for the values of immediate and future actions, Q-learning is an efficient approach to optimizing decision-making in a complex and dynamic environment. Figure 5 demonstrates this insight as new wind turbines are installed in counties with moderate contention and wind resources, even as land is still available in more beneficial counties. However, this case study is limited by the modeling of the environment, as the contention risks and wind resources layers are rudimentary. Thus, future work could replace these rudimentary layers with empirical data (e.g., on wind speeds). Overall, while the results presented in this article only demonstrate the proof-of-concept, further refinement of the model assumptions and input data could resolve this caveat.
The approach that we use to define the environment for the RL model could help inform the development of a social acceptance layer for current renewable energy siting models. For instance, such a social acceptance layer could be added to the NREL reV model [19]. The linear regression model from Bessette and Mills [12] that our approach relies on could be used to compute contention scores across the entire contiguous US (using the data identified by the authors), with the caveat that most regression coefficients for the state variable would be missing and that the modeling would be based on a small nonrepresentative sample (US Midwest states). Alternatively, a similar but extended survey and modeling work to the Bessette and Mills [12] empirical study (e.g., to encompass the entire contiguous US and more explanatory variables, as suggested by the authors) could be used to calculate more accurate contention scores and improve our RL model. More accurate and extended contention results could then be used to build the additional social layer in reV.
The approach developed in this proof-of-concept could easily be applied to siting problems for other clean energy technologies. While the environment (e.g., less land availability constraints for solar photovoltaic energy [20]) and the number of agents and their characteristics may change, the basic principles of the approach would remain the same. However, several improvements could be made within this approach.
First, while RL is guaranteed to find an optimal policy (i.e., the series of behaviors that leads to the optimum) with enough training episodes, the case study presented here has not attempted to find that optimal policy, simply a “better than random” one. This caveat is due to the use of probability distribution to draw the number of turbines per wind plant project and rotor diameters and to represent the likelihood of facing a delay. While it makes the study more realistic (since we cannot precisely predict what the characteristics and delays will be for each specific wind plant project), it also makes finding the optimal policy more difficult. Thus, future improvements of the approach would need to define a robust methodology to measure the “degree of optimality” reached with a given number of training episodes for a particular case. Moreover, the optimal policy could be compared to another scenario than a random siting one, possibly yielding more insights into the approach value.
Second, many constraints have not been included in the model’s environment. Clean energy siting decisions should also account for constraints due to other land uses, such as land protected by national parks and urban centers and, for land-based wind, setbacks (i.e., the minimum distance a wind turbine may be located from a residence). For example, the different spatial layers from reV—which account for such constraints—[19] could be used to build the agents’ environment. These spatial layers could also be made dynamic. Climate change could alter the future spatial variability of wind or solar resources and as demography and culture evolve, contention risks could also change. The visual amenities of landscapes could lose their appeal, causing a wider acceptance of wind turbines. In addition to improving the characterization of the natural amenity layer, an approach such as the one developed by Alphan [36] could help to better understand and predict the impact of a changing landscape on wind acceptance. RL also relies on a vast amount of data; data which are not always available, lack quality or resolution or are simply outdated. Therefore, the approach presented here is limited by the amount of data that is available.
Given the limitations identified above, one could argue that pure common sense alone could yield similar results to our model more simply. However, we see at least two advantages to our method. First, as already mentioned when presenting Figure 4, the Bellman equation accounts for the immediate reward associated with an action and the maximum expected value obtained from the subsequent action (i.e., falling under the dynamic programming paradigm). Although not impossible, accounting for future rewards with pure common sense might be challenging. Second, while the problem described in our paper is relatively simple, with only two possibly conflicting objectives to satisfy (maximizing power generation while minimizing contention), other model iterations could account for more of those possibly conflicting situations. For instance, the model could be trained such that wind siting maximizes power generation and benefits disadvantaged communities and minimizes contention and adverse ecological impacts (e.g., on bats). Such multiobjective optimization can be difficult to achieve with pure common sense.
Overall, this proof-of-concept demonstrates that nontechnical challenges hindering disruptive technologies’ sustainability contributions can be assessed and tackled with quantitative methods. Our approach could complement qualitative studies and community engagement to understand better and resolve possible conflicts [10,37]. As coastal states contemplate more and more wind offshore projects, an exciting avenue for future research could be to apply our methodology to an offshore case study. Opposition to offshore wind has recently made the news [38]. Research has shown that the acceptance of offshore wind turbines can be affected by their negative visual impacts on marine landscapes [39]. Thus, by modifying some of the datasets (e.g., the natural amenity scale by datasets better representing marine landscapes), our approach could be applied to offshore wind siting. Similar to land-based wind, community engagement should complement this quantitative work [40].
4. Conclusions
As the need for a just and equitable energy transition accelerates, disruptive clean energy technologies will inevitably create some pushback. Such pushback can delay the transition, putting at risk the attainment of climate change mitigation targets. Thus, the decision-makers implementing this transition will need to use convergence research, bridging humanities, arts and social sciences with engineering and fundamental sciences to avoid as much as possible nontechnical delays. We believe the novel approach we propose in this article could contribute to such convergence research.
Author Contributions
Conceptualization, J.W. and A.E.; Methodology, J.W.; Formal analysis, J.W.; Writing—original draft, J.W.; Writing—review & editing, A.E.; Funding acquisition, A.E. All authors have read and agreed to the published version of the manuscript.
Funding
There is no specific funding for this work.
Institutional Review Board Statement
Not applicable.
Informed Consent Statement
Not applicable.
Data Availability Statement
Model and data are available on the following GitHub repository: https://github.com/jwalzberg/WindAcceptanceModel (accessed on 20 June 2023).
Acknowledgments
This work was authored by the National Renewable Energy Laboratory, operated by Alliance for Sustainable Energy, LLC, for the US Department of Energy (DOE) under Contract No. DE-AC36-08GO28308. The views expressed in the article do not necessarily represent the views of the DOE or the US Government. The US Government retains and the publisher, by accepting the article for publication, acknowledges that the US Government retains a nonexclusive, paid-up, irrevocable, worldwide license to publish or reproduce the published form of this work, or allow others to do so, for US Government purposes. The authors wish to thank Emily Newes and Eric Lantz and the anonymous reviewers for their support and feedback on the draft version of this article. Julien Walzberg also wishes to thank Mohamed Cheriet for sparking his interest in reinforcement learning.
Conflicts of Interest
The authors declare no conflict of interest.
References
- Scientific American. How the Senate Climate Bill Will Boost Clean Energy. Available online: https://www.scientificamerican.com/article/how-the-senate-climate-bill-will-boost-clean-energy/ (accessed on 20 June 2023).
- Eisenberg, D.A.; Park, J.; Seager, T.P. Sociotechnical Network Analysis for Power Grid Resilience in South Korea. Complexity 2017, 2017, 14. [Google Scholar] [CrossRef]
- Wainstein, M.E.; Bumpus, A.G. Business models as drivers of the low carbon power system transition: A multi-level perspective. J. Clean. Prod. 2016, 126, 572–585. [Google Scholar] [CrossRef]
- Johnstone, P.; Rogge, K.S.; Kivimaa, P.; Fratini, C.F.; Primmer, E.; Stirling, A. Waves of disruption in clean energy transitions: Sociotechnical dimensions of system disruption in Germany and the United Kingdom. Energy Res. Soc. Sci. 2020, 59, 101287. [Google Scholar] [CrossRef]
- Taeihagh, A.; Ramesh, M.; Howlett, M. Assessing the regulatory challenges of emerging disruptive technologies. Regul. Gov. 2021, 15, 1009–1019. [Google Scholar] [CrossRef]
- Radu, L.-D. Disruptive Technologies in Smart Cities: A Survey on Current Trends and Challenges. Smart Cities 2020, 3, 1022–1038. [Google Scholar] [CrossRef]
- Sinsel, S.R.; Riemke, R.L.; Hoffmann, V.H. Challenges and solution technologies for the integration of variable renewable energy sources—A review. Renew. Energy 2020, 145, 2271–2285. [Google Scholar] [CrossRef]
- Nazaripouya, H. Integration and Control of Distributed Renewable Energy Resources. Clean Technol. 2022, 4, 149–152. [Google Scholar] [CrossRef]
- Seetharaman; Moorthy, K.; Patwa, N.; Saravanan; Gupta, Y. Breaking barriers in deployment of renewable energy. Heliyon 2019, 5, e01166. [Google Scholar] [CrossRef]
- Batel, S. Research on the social acceptance of renewable energy technologies: Past, present and future. Energy Res. Soc. Sci. 2020, 68, 101544. [Google Scholar] [CrossRef]
- Mai, T.; Lopez, A.; Mowers, M.; Lantz, E. Interactions of wind energy project siting, wind resource potential, and the evolution of the U.S. power system. Energy 2021, 223, 119998. [Google Scholar] [CrossRef]
- Bessette, D.L.; Mills, S.B. Farmers vs. lakers: Agriculture, amenity, and community in predicting opposition to United States wind energy development. Energy Res. Soc. Sci. 2021, 72, 101873. [Google Scholar] [CrossRef]
- Müller, F.J.Y.; Leschinger, V.; Hübner, G.; Pohl, J. Understanding subjective and situational factors of wind turbine noise annoyance. Energy Policy 2023, 173, 113361. [Google Scholar] [CrossRef]
- Gaßner, L.; Blumendeller, E.; Müller, F.J.Y.; Wigger, M.; Rettenmeier, A.; Cheng, P.W.; Hübner, G.; Ritter, J.; Pohl, J. Joint analysis of resident complaints, meteorological, acoustic, and ground motion data to establish a robust annoyance evaluation of wind turbine emissions. Renew. Energy 2022, 188, 1072–1093. [Google Scholar] [CrossRef]
- Ki, J.; Yun, S.-J.; Kim, W.-C.; Oh, S.; Ha, J.; Hwangbo, E.; Lee, H.; Shin, S.; Yoon, S.; Youn, H. Local residents’ attitudes about wind farms and associated noise annoyance in South Korea. Energy Policy 2022, 163, 112847. [Google Scholar] [CrossRef]
- Haac, R.; Darlow, R.; Kaliski, K.; Rand, J.; Hoen, B. In the shadow of wind energy: Predicting community exposure and annoyance to wind turbine shadow flicker in the United States. Energy Res. Soc. Sci. 2022, 87, 102471. [Google Scholar] [CrossRef]
- Sovacool, B.K.; Hess, D.J.; Cantoni, R.; Lee, D.; Claire Brisbois, M.; Jakob Walnum, H.; Freng Dale, R.; Johnsen Rygg, B.; Korsnes, M.; Goswami, A.; et al. Conflicted transitions: Exploring the actors, tactics, and outcomes of social opposition against energy infrastructure. Glob. Environ. Chang. 2022, 73, 102473. [Google Scholar] [CrossRef]
- Hoen, B.; Firestone, J.; Rand, J.; Elliot, D.; Hübner, G.; Pohl, J.; Wiser, R.; Lantz, E.; Haac, T.R.; Kaliski, K. Attitudes of U.S. Wind Turbine Neighbors: Analysis of a Nationwide Survey. Energy Policy 2019, 134, 110981. [Google Scholar] [CrossRef]
- Maclaurin, G.; Grue, N.; Lopez, A.; Heimiller, D.; Rossol, M.; Buster, G.; Williams, T. The Renewable Energy Potential (reV) Model: A Geospatial Platform for Technical Potential and Supply Curve Modeling; National Renewable Energy Laboratory: Golden, CO, USA, 2019.
- Denholm, P.; Brown, P.; Cole, W.; Mai, T.; Sergi, B.; Brown, M.; Jadun, P.; Ho, J.; Mayernik, J.; McMillan, C.; et al. Examining Supply-Side Options to Achieve 100% Clean Electricity by 2035; National Renewable Energy Laboratory: Golden, CO, USA, 2022.
- Stanley, A.P.J.; Roberts, O.; Lopez, A.; Williams, T.; Barker, A. Turbine scale and siting considerations in wind plant layout optimization and implications for capacity density. Energy Rep. 2022, 8, 3507–3525. [Google Scholar] [CrossRef]
- Serrano González, J.; Burgos Payán, M.; Santos, J.M.R.; González-Longatt, F. A review and recent developments in the optimal wind-turbine micro-siting problem. Renew. Sustain. Energy Rev. 2014, 30, 133–144. [Google Scholar] [CrossRef]
- Naeem, M.; Rizvi, S.T.H.; Coronato, A. A Gentle Introduction to Reinforcement Learning and its Application in Different Fields. IEEE Access 2020, 8, 209320–209344. [Google Scholar] [CrossRef]
- Sert, E.; Bar-Yam, Y.; Morales, A.J. Segregation dynamics with reinforcement learning and agent based modeling. Sci. Rep. 2020, 10, 11771. [Google Scholar] [CrossRef] [PubMed]
- Jäger, G. Replacing Rules by Neural Networks A Framework for Agent-Based Modelling. Big Data Cogn. Comput. 2019, 3, 51. [Google Scholar] [CrossRef]
- Zong, K.; Luo, C. Reinforcement learning based framework for COVID-19 resource allocation. Comput. Ind. Eng. 2022, 167, 107960. [Google Scholar] [CrossRef] [PubMed]
- Trad, F.; Falou, S.E. Towards Using Deep Reinforcement Learning for Better COVID-19 Vaccine Distribution Strategies. In Proceedings of the 2022 7th International Conference on Data Science and Machine Learning Applications (CDMA), Riyadh, Saudi Arabia, 1–3 March 2022; pp. 7–12. [Google Scholar]
- Hung, F.; Son, K.; Yang, Y.C.E. Investigating uncertainties in human adaptation and their impacts on water scarcity in the Colorado river Basin, United States. J. Hydrol. 2022, 612, 128015. [Google Scholar] [CrossRef]
- Eia. Profile Analysis—Illinois. Available online: https://www.eia.gov/state/analysis.php?sid=IL (accessed on 23 June 2023).
- Hoen, B.D.; Diffendorfer, J.; Rand, J.; Kramer, L.; Garrity, C.; Hunt, H. United states wind turbine database. In US Geological Survey, American Wind Energy Association, and Lawrence Berkeley National Laboratory Data Release: USWTDB; 2018; Volume 1. Available online: https://eerscmap.usgs.gov/uswtdb/ (accessed on 20 June 2023).
- WINDExchange. Illinois 80-Meter Wind Resource Map. Available online: https://windexchange.energy.gov/maps-data/37 (accessed on 18 January 2022).
- Draxl, C.; Clifton, A.; Hodge, B.-M.; McCaa, J. The Wind Integration National Dataset (WIND) Toolkit. Appl. Energy 2015, 151, 355–366. [Google Scholar] [CrossRef]
- Gaughan, R. How Much Land Is Needed for Wind Turbines? Available online: https://sciencing.com/much-land-needed-wind-turbines-12304634.html (accessed on 18 January 2022).
- Denholm, P.; Hand, M.; Jackson, M.; Ong, S. Land Use Requirements of Modern Wind Power Plants in the United States; National Renewable Energy Laboratory: Golden, CO, USA, 2009.
- IRENA. Global Energy Transformation: A Roadmap to 2050; IRENA: Abu Dhabi, United Arab Emirates, 2018. [Google Scholar]
- Alphan, H. Modelling potential visibility of wind turbines: A geospatial approach for planning and impact mitigation. Renew. Sustain. Energy Rev. 2021, 152, 111675. [Google Scholar] [CrossRef]
- Kitzing, L.; Jensen, M.K.; Telsnig, T.; Lantz, E. Multifaceted drivers for onshore wind energy repowering and their implications for energy transition. Nat. Energy 2020, 5, 1012–1021. [Google Scholar] [CrossRef]
- Joselow, M. ‘We don’t want it’: Why Florida Republicans oppose offshore wind. Wash. Post 2023. Available online: https://www.washingtonpost.com/politics/2023/03/31/we-dont-want-it-why-florida-republicans-oppose-offshore-wind/ (accessed on 20 June 2023).
- Dalton, T.; Weir, M.; Calianos, A.; D’Aversa, N.; Livermore, J. Recreational boaters’ preferences for boating trips associated with offshore wind farms in US waters. Mar. Policy 2020, 122, 104216. [Google Scholar] [CrossRef]
- Firestone, J.; Hirt, C.; Bidwell, D.; Gardner, M.; Dwyer, J. Faring well in offshore wind power siting? Trust, engagement and process fairness in the United States. Energy Res. Soc. Sci. 2020, 62, 101393. [Google Scholar] [CrossRef]


Disclaimer/Publisher’s Note: The statements, opinions and data contained in all publications are solely those of the individual author(s) and contributor(s) and not of MDPI and/or the editor(s). MDPI and/or the editor(s) disclaim responsibility for any injury to people or property resulting from any ideas, methods, instructions or products referred to in the content. |
© 2023 by the authors. Licensee MDPI, Basel, Switzerland. This article is an open access article distributed under the terms and conditions of the Creative Commons Attribution (CC BY) license (https://creativecommons.org/licenses/by/4.0/).