Article

Research on Influencing Factors of Residential Building Carbon Emissions and Carbon Peak: A Case of Henan Province in China

1
College of Tourism, Xinyang Normal University, Xinyang 464000, China
2
Graduate School, Sehan University, Yeongam-gun 31746, Republic of Korea
3
College of Architecture and Civil Engineering, Xinyang Normal University, Xinyang 464000, China
4
Social Sciences Division, Xinyang Normal University, Xinyang 464000, China
*
Authors to whom correspondence should be addressed.
Sustainability 2023, 15(13), 10243; https://doi.org/10.3390/su151310243
Submission received: 10 May 2023 / Revised: 12 June 2023 / Accepted: 20 June 2023 / Published: 28 June 2023

Abstract

:
Buildings are considered to have significant emission reduction potential. Residential building carbon emissions, as the most significant type of building-related carbon emissions, represent a crucial factor in achieving both carbon peak and carbon neutrality targets for China. Based on carbon emission data from Henan Province, a large province located in central China, between 2010 and 2020, this study employed the Kaya-LMDI decomposition method to analyze seven driving factors of carbon emission evolution, encompassing energy, population, and income, and assessed the historical reduction in CO2 emissions from residential buildings. Then, by integrating Kaya identity static analysis with Monte Carlo dynamic simulation, various scenarios were established to infer the future evolution trend, peak time, and potential for carbon emission reduction in residential buildings. The analysis results are as follows: (1) The carbon emissions of residential buildings in Henan exhibited a rising trend from 2010 to 2020, albeit with a decelerating growth rate. (2) Per capita household disposable income is the main driving factor for the increase in carbon emissions, but the household housing purchase index inhibits most of the growth of carbon emissions for the residential buildings in Henan, with the total carbon emission reduction of residential buildings reaches 106.42 million tons of CO2 during the research period. (3) During the period from 2020 to 2050, residential buildings in Henan Province will exhibit an “inverted U-shaped” trend in carbon emissions under the three static scenarios. The base scenario predicts that carbon emissions will reach their peak of 131.66 million tons in 2036, while the low-carbon scenario forecasts a peak of 998.8 million tons in 2030 and the high-carbon scenario projects a peak of 138.65 million tonnes in 2041. (4) Under the dynamic simulation scenario, it is anticipated that residential buildings in Henan Province will reach their carbon peak in 2036 ± 3 years, with a corresponding carbon emission of 155.34 million tons. This study can serve as a valuable reference for the future development of low-carbon pathways within the building sector.

1. Introduction

Global warming poses a long-term threat to the survival and development of mankind. Research has shown that the current global average temperature is 1 °C higher than that before the industrial revolution. The global average temperature is predicted to increase to 1.5 °C between 2030 and 2052 compared to that before the industrial revolution [1]. The situation of future climate change is still severe, and it has become a global consensus to address climate challenges jointly. To achieve significant and sustained reductions in emissions and ensure a livable and sustainable future for all, rapid and comprehensive transformations across all industries and systems are imperative, as proposed by the Intergovernmental Panel on Climate Change (IPCC). The international community’s commitment to carbon emission reduction has been intensifying. As one of the world’s big economies, China shoulders significant responsibilities and tasks for environmental protection and carbon reduction, while developing at a rapid pace. In recent years, China’s government has attached great importance to carbon emission reduction, promulgating a series of standard specifications and issuing relevant work guidance schemes [2,3,4]. In the Paris Agreement, China has committed to achieving a peak in CO2 emissions around 2030 and striving for an early peak. China has a vast territory, and the concentration of carbon emissions at the provincial and municipal levels is relatively high. Therefore, it is an effective way to reach the peak before 2030 by implementing the peaking policy according to local conditions at the regional level and promoting some areas to reach the peak first [5,6]. At present, carbon emissions in the field of residential buildings occupy about one-fifth of China [7]. Moreover, the construction sector has great potential for energy conservation and emission reduction, and the cost of emission reduction is relatively low [8]. Emission reduction of buildings will significantly contribute to the achievement of the overall goal of emission reduction. In consequence, it is of great research significance to scientifically predict the time of carbon peak and carbon emissions and reasonably set the total carbon emission target of residential buildings so as to better achieve the carbon emission peak target in 2030.
Henan Province, situated in the central part of China, is a developing region with a population density of approximately 595 individuals per square kilometer and a permanent resident count of 98.72 million. It ranks third in terms of population size in China and has one of the highest carbon dioxide emission rates from its residential buildings. [9]. Reasonable and accurate measurement of carbon emissions from residential buildings in Henan and research on the factors influencing building carbon emissions are important for formulating effective emission reduction measures for residential buildings and can provide important references for Henan to achieve the provincial carbon emission reduction targets. To deeply analyze the existing emission reduction capacity of residential buildings and predict the future carbon emissions of residential buildings, this study puts forward the following urgent issues to provide a reference basis for the Henan government and other similar parts of the world to precisely introduce policies related to building energy saving and emission reduction. (1) How to identify the potential for carbon reduction in residential buildings in Henan Province; and (2) how to plan the future path of peaking carbon emissions for residential buildings in Henan Province.
To solve the abovementioned problems, the energy balance sheet splitting method was adopted in this paper. Based on the relevant data in the energy balance sheet of Henan Province, we split the various energy consumed by residential buildings and calculated the carbon emission factor of energy. Residential buildings were divided into rural and urban residential buildings. The historical data of carbon emissions from residential buildings in Henan were measured, and the influencing factors of carbon emissions were analyzed for the two types of residential buildings. The Kaya-LMDI decomposition method was used to reveal the contribution of each influencing factor to the growth of carbon emission intensity in Henan within a specific period from the perspective of household size, and the historical carbon emission reduction of residential buildings in Henan was evaluated.
The Kaya model is a classic extension of the IPAT model, originally proposed by Japanese scholar Yoichi Kaya [10]. This model establishes links between economic development, population growth, policy implementation, and carbon dioxide emissions resulting from human activities. It analyzes the relationship between regional carbon emissions and various factors such as energy consumption structure, emission intensity of different energy sources, energy utilization efficiency, economic development, and human activities, which is recommended by IPCC to analyze the change characteristics and influencing factors of carbon dioxide emissions or greenhouse gas emissions [11,12]. The Logarithmic Mean Divisia Index Decomposition (LMDI) method is a widely used form of the classic Divisia Index Decomposition Analysis [13,14] within the index decomposition methodology. It was initially proposed by Ang B W, a distinguished scholar from Singapore [15,16]. The LMDI decomposition method is highly practical and easily implemented, with no residual values remaining after the decomposition process to ensure unique results. Additionally, it guarantees homology across different operational decomposition methods [17,18,19]. After comparing and analyzing various index decomposition methods, Ang B W concludes that the Kaya-LMDI model, which characterizes carbon emissions based on the Kaya identity, is an excellent method for decomposing and analyzing factors influencing carbon emissions [20].
Peng et al. [21] analyzed the proportion of carbon emissions from China’s construction industry and related sectors in the country’s total social carbon emissions, revealing that the construction industry accounted for 16%. A Kaya model-based study focusing on various types of public buildings/municipalities indicated that public buildings contributed to 8% of China’s overall energy consumption. However, relying solely on the Kaya model for detecting changes in carbon emissions poses challenges in accurately determining their actual impact on total emissions and fails to account for variations in economic and social trends. Qi et al. [22] conducted a calculation of carbon emissions from both producer and consumer perspectives, while also analyzing the decision-making process behind inter-provincial net carbon emission transfers. Additionally, the LMDI method was employed to decompose the factors influencing the province’s net carbon emissions into technology, structure, input–output, and scale effects. However, utilizing solely the LMDI model still presents certain limitations in elasticity analysis. Ma et al. [23] first proposed a bottom–up approach for measuring the values of commercial buildings in China based on decomposing the extended Kaya identity via the LMDI method. Subsequently, a comparative analysis of the contribution rate elasticity of drivers, assessed by both the LMDI method and ridge regression, effectively examines the robustness of China’s commercial building measurement model. In addition, Lu et al. [24] utilized the decomposition of Kaya identity and mixed LMDI to comprehensively analyze the factors influencing building energy consumption growth throughout its full life cycle from 2007 to 2015. Therefore, the Kaya-LMDI analyzes the influencing factors of carbon emissions from three dimensions: population, energy use intensity, and social affluence. It can accurately identify the main factors affecting changes in carbon emissions.
The existing reports have laid a solid methodological foundation for a comprehensive and systematic understanding of the status of carbon emissions from buildings and for further research. There are still some shortcomings in the current research on carbon emissions from residential buildings in China. First, most of the research on building carbon emissions focuses on the national level. However, China has a vast territory, and the buildings in each place have their own characteristics. The research conclusions at the national level are not fully suitable for learning at the provincial and municipal levels, and a detailed and systematic analysis at the provincial level is lacking. Second, the data sources of building energy consumption calculation models are different, resulting in large differences in calculation results. Third, there is a lack of analysis of carbon emission peaking scenarios for residential buildings under the influence of uncertainty.
Therefore, this study aimed to evaluate the potential for carbon emission reduction in the building sector of Henan Province by analyzing historical data on carbon emissions from residential buildings and identifying factors that influence carbon emission intensity. With consideration given to the impact of energy consumption intensity, population, energy emission coefficient, per capita GDP, urbanization level, and tertiary industry, a novel Kaya-LMDI model was formulated based on the Kaya identity. Additionally, Monte Carlo simulation was introduced into the scenario analysis method. A “static setting + dynamic simulation” model was built to predict the trajectory and corresponding peak state of carbon emissions from residential buildings in Henan between 2020 and 2050 under the influence of uncertainty, thereby compensating for the inadequacies of previous research.

2. Data Sources and Research Methodology

2.1. Source of Data

The energy consumption data involved in this study are obtained from the Henan Energy Balance Sheet and Henan Energy Statistical Yearbook in China Energy Statistical Yearbook 2010–2020 [25]. The demographic and economic data involved are from the China Statistical Yearbook 2010–2020 [26].

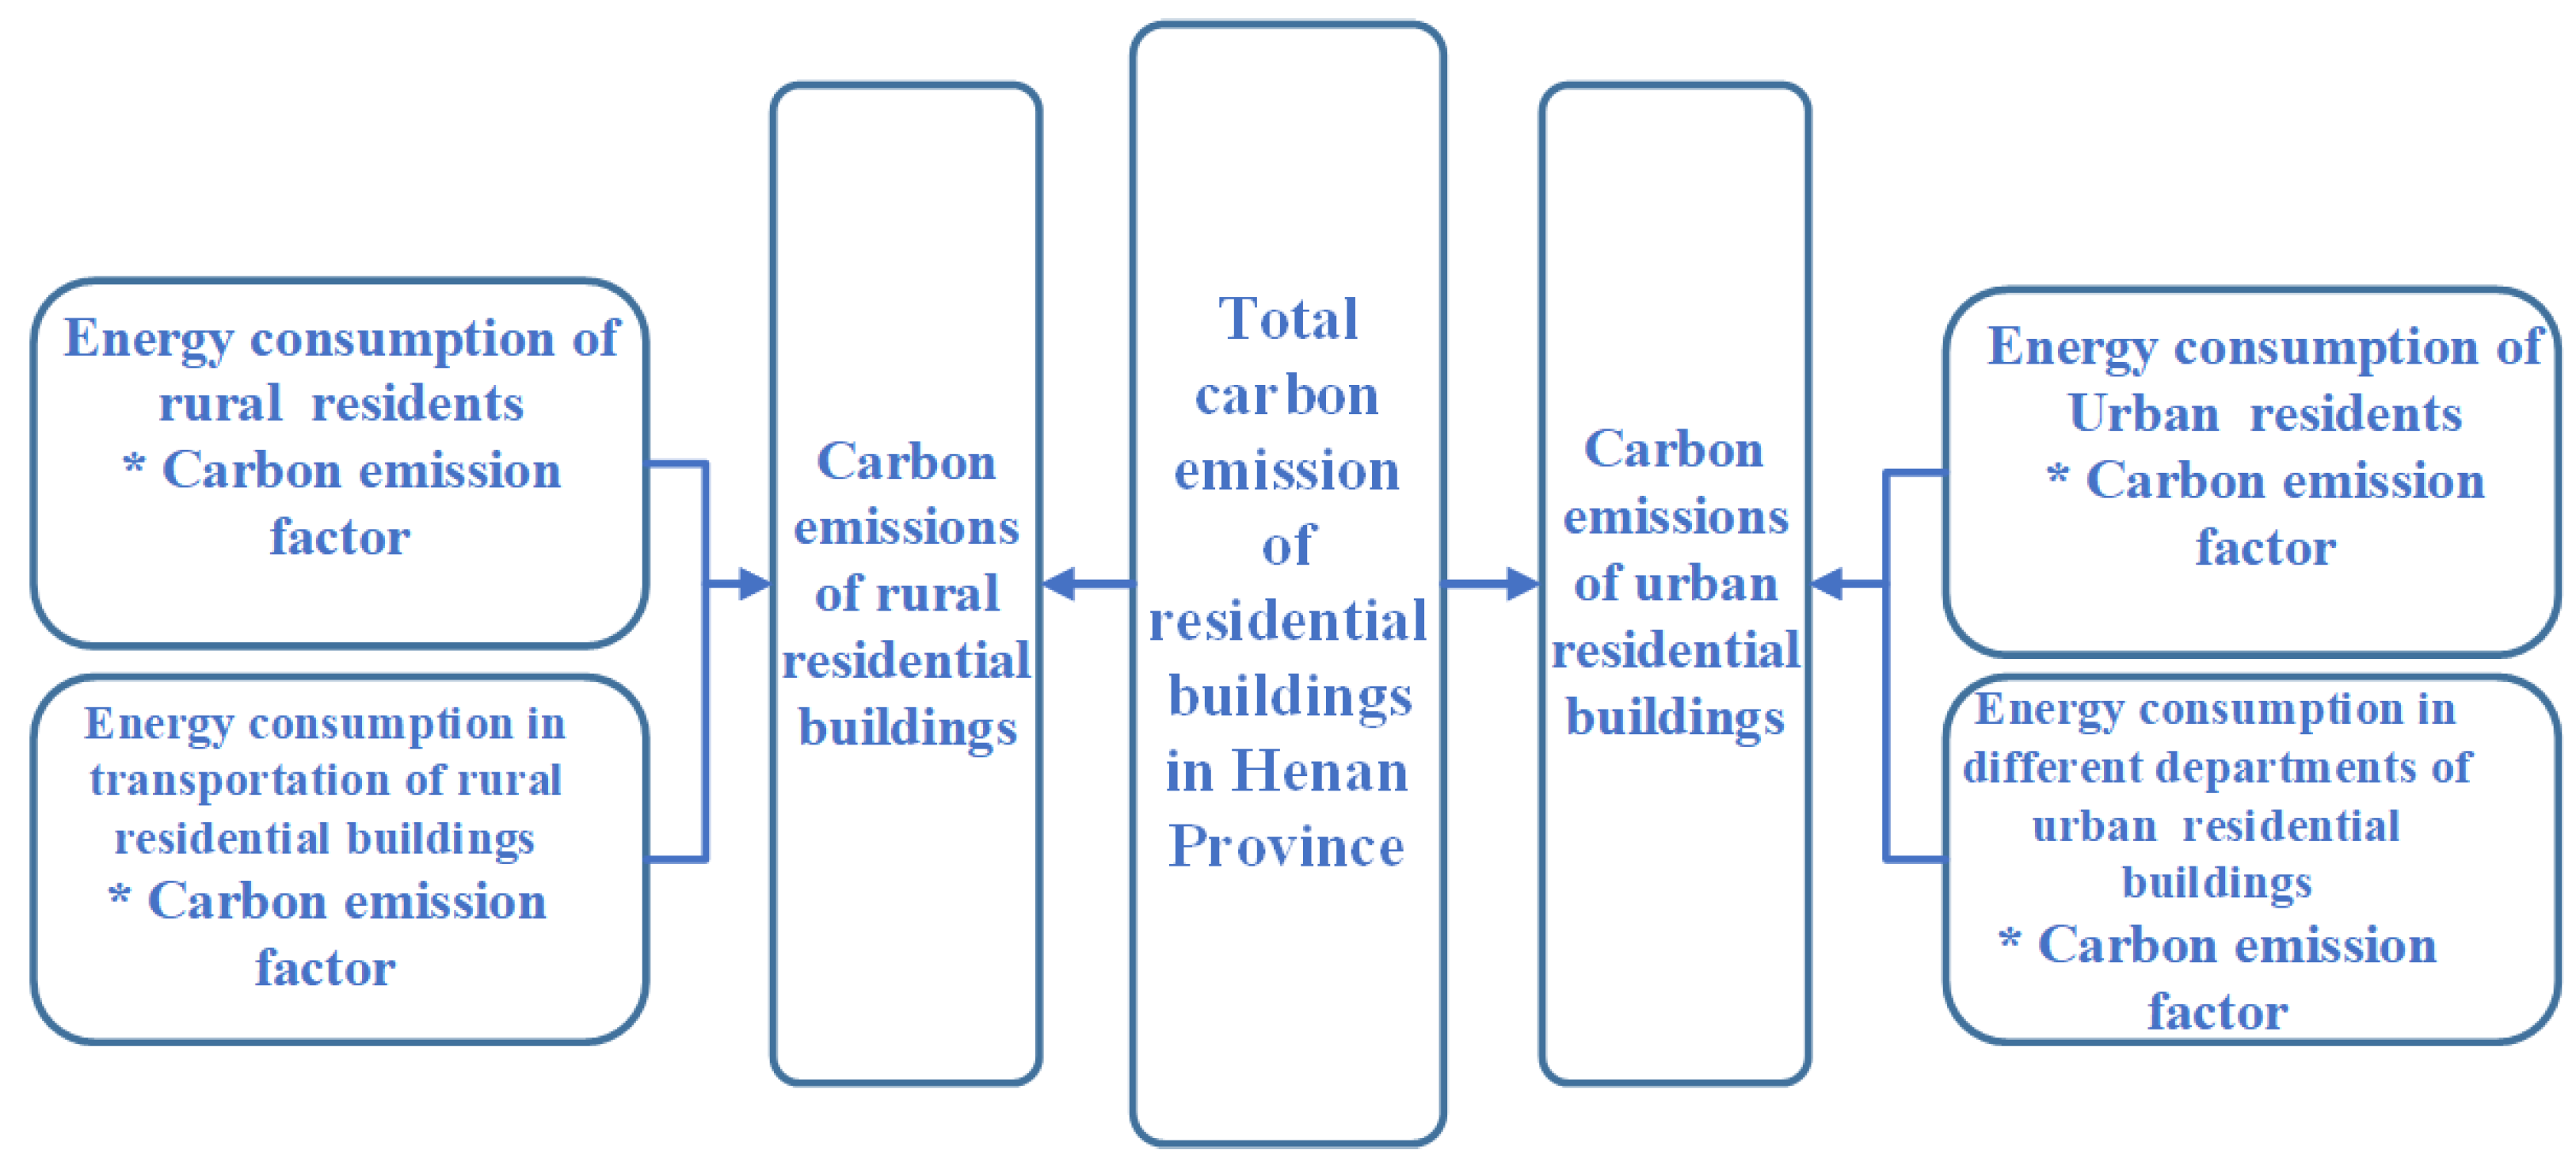
2.2. Carbon Emission Accounting Methods

At the macro level, accounting methods for carbon emissions in the operational phase of existing buildings can be broadly divided into top-down and bottom-up. A representative top-down approach is the statistical data-splitting method. Its core involves reprocessing and summarizing data from various departments involved in building energy use, as derived from the physical Energy Balance Sheet. This enables accurate determination of energy consumption and emission data for buildings. The data acquisition and calculation process of this method is relatively simple, and the source is authoritative [27]. In this study, the Energy Balance Sheet splitting model (Figure 1) and emission factor method, which are developed from the statistical data splitting method, are used to measure carbon emissions in the operational phase of residential buildings in Henan.
The calculation equation for carbon emissions of residential buildings is [13]:
C = C u + C r = E u · k t + E r · k t
where C is the total carbon emissions for residential buildings, which can be divided into carbon emissions from rural residential buildings (Cr) and urban residential buildings (Cu), and kt is the comprehensive carbon emission factor of urban buildings. The equation for calculating carbon emissions from rural residential buildings is
C r = E r k t
E r = E r l T E r
where Erl is the basic energy consumption of rural residential buildings. Moreover, TE denotes the deduction of the transportation energy consumption, and the formula lists the following:
T E = 0.95 · ( I E g + C E g + P E g ) + 0.35 · ( I E d + C E d + P E d ) + 0.95 · L E d + L E g + A E g
and, TEr is the transportation energy consumption included in the basic energy consumption of rural residential buildings.
where, IEg—gasoline consumed by industry (including construction);
CEg—gasoline for commercial consumption;
PEg—gasoline for public service consumption;
IEd—diesel for industrial (including construction) consumption;
CEd—diesel for commercial consumption;
PEd—diesel consumed by public services;
LEd—diesel consumed by residential life;
LEg—gasoline for residential consumption;
AEg—gasoline for agricultural consumption.
The integrated carbon emission factor Kt for residential buildings was calculated as
K t = α t i β t i γ t i
where αti—converted coal coefficient of energy i;
βti—carbon emission factor of energy i;
γti—share of energy i in the total energy consumption of the building.
The equation for calculating carbon emissions from rural residential buildings is
C u = E u k t
The equation for calculating carbon emissions from urban residential buildings is
E u = E u l T E u + E H · P H u
where Eul is the basic energy consumption of urban residential buildings; TEu is the transportation energy consumption included in the basic energy consumption of urban residential buildings; and EH is the heating correction. The corrected heating value was calculated as follows:
E H = E H N h B E
where, EHN indicates the centralized heating energy consumption in Henan Province; hBE is the heat consumption in the base amount of building energy consumption. PHu is the heating adjustment coefficient, and the expression is
P H u = H u H c + H u
where Hc denotes heat consumption of public buildings; and Hu denotes heat consumption of urban residential buildings.

2.3. Data Processing

The energy balance sheet presents data on the energy consumption of each industry. In the China Energy Statistics Yearbook, the energy balance sheet does not show information on building energy consumption. The sectors of end-use energy consumption in the energy balance sheet have been divided into seven categories: (1) agriculture, forestry, animal husbandry, and fishery; (2) industry; (3) construction; (4) transportation, storage, and postal services; (5) wholesale, retail, accommodation, and catering; (6) other; and (7) residential consumption. In the splitting method of the energy balance sheet, (5) wholesale, retail, accommodation, and catering, (6) other, and (7) residential consumption are used as the base values for the calculation [28]. The building energy consumption is calculated by deducting the traffic energy consumption, correcting the heating energy consumption, and then adding the building energy consumption of other energy sectors. In the actual calculations, building energy consumption in industry and construction is not calculated because their proportion is low and on a decreasing trend [29]. Since residential buildings cover a large number of energy types and are inconvenient to measure, the energy consumption in this paper is converted into standard coal for calculation.

2.4. Calculation Results

After calculation, the carbon emission of residential buildings in Henan Province from 2010 to 2020 was obtained, as shown in Figure 2. The carbon emission factors of residential buildings in Henan Province are shown in Table 1. Both rural residential buildings and urban residential buildings show an increasing trend of carbon emissions. In 2020, the total carbon emission of residential buildings in Henan Province reached 102.67 million tons, of which urban carbon emission reached 68.21 million tons, and rural carbon emission reached 34.46 million tons. From 2010 to 2020, the average annual increase in carbon emission of residential buildings in Henan Province was 6.69%, and that of urban residential buildings was 1.13 times higher than that of rural residential buildings. Compared with that in 2010, the carbon emission of urban and rural residential buildings increased by 51.81% and 48.78%, respectively. In 2014–2015, the increase rate became slower, but the carbon emission still maintained the overall trend of rapid growth. It is expected that the carbon emission of residential buildings in Henan Province will continue to grow. Although the carbon emission displayed a growing trend, the growth rate significantly slowed down in 2016–2020.

3. Evaluation of Historical Reductions in CO2 Emissions from Residential Buildings

3.1. The Kaya Identity

The main modeling methods to identify the factors influencing carbon emissions are the IPAT series of identification models, exponential decomposition analysis, and structural decomposition analysis [30]. Based on the IPAT model approach, the Kaya identity was proposed by Yoichi Kaya [31]. It decomposes the driving factors of carbon emissions into the population, GDP per capita, energy intensity, and CO2 emissions per unit of energy consumption and has become the mainstream model for analyzing the driving factors. In this study, the average household carbon emissions of residential buildings were selected to characterize the carbon emission intensity of residential buildings. Then, the average household carbon emissions were decomposed using the Kaya identity [32]:
C h = C H = P H F H P r P H I P I P 1 P r E F C E = P h R i d e K
where Ch denotes average household carbon emissions of residential buildings; H denotes the total number of households; P denotes the total population; F represents the total residential building area; Pr denotes the selling price per unit area of housing; I denotes the total disposable income of residents; E indicates the total energy consumption of residential buildings; Ph denotes the average household size; R denotes the housing price to income ratio; i denotes the per capita household income; d denotes the home purchase index; e denotes the energy consumption per unit floor area of residential buildings; K represents the comprehensive carbon emission factor of residential buildings.

3.2. LMDI Decomposition Method

LMDI has the advantages of independent analysis paths, no residuals, excellent processing of zero values, and simplicity. It is widely used in the decomposition studies of energy consumption and carbon emission factors in various countries, regions, and fields [33]. Based on the influencing factors obtained by the Kaya identity, this paper used the LMDI decomposition method to explore the factors that mitigate the carbon emission intensity of residential buildings in Henan Province. The contribution level of each factor to the change in carbon emission intensity was also investigated. In this study, the factor decomposition of Equation (10) was based on the additive form of the LMDI decomposition method. Its decomposition results in the time interval [0, T] can be expressed by Equation (11) [33]:
Δ C h 0 T = C h T C h 0 = Δ P h + Δ R + Δ i + Δ d + Δ e + Δ K
Each variable at the right end of Equation (11) can be further expressed in Equation (12) to reflect the contribution of each influencing factor to the average household carbon emissions of residential buildings. In this study, the average household size was used as an example for explanation:
Δ P h = C T C 0 ln C T ln C 0 · ln ( P h T P h i 0 )

3.3. Analysis of Kaya-LMDI Decomposition Results

The Kaya-LMDI model employed is a grey prediction model, which means that some information is known while the rest remains uncertain. The historical carbon emission data in this study are considered known information, whereas the future carbon emission predicted by the model falls under uncertain information. The changes in carbon emission intensity of residential buildings in Henan Province (average household carbon emission of residential buildings) were divided into into three stages: 2010–2013, 2013–2016, and 2016–2020. The Kaya-LMDI decomposition method was used to decompose the factors influencing the carbon emission intensity of residential buildings in these three stages, and the decomposition results are shown in Table 2.
The contributions of household per capita disposable income to the growth of carbon emission intensity in the three stages are 36.36%, 33.96%, and 33.39%, which is the most important factor driving the increase of carbon emission intensity of residential buildings in Henan Province. With the increasing per capita disposable income of households, residents have developed a higher demand for quality of life. The use of energy-consuming household appliances, such as refrigerators and water heaters, makes household disposable income per capita a significant factor driving the carbon intensity of residential buildings. Furthermore, energy consumption per unit area also drives the growth of carbon intensity. In contrast, the home purchase index contributes −55.06%, −44.90%, and −44.48% to the growth of carbon emission intensity in the three stages. Therefore, it is the most important factor in mitigating the increase in carbon emission intensity. The home purchase index had a higher dampening effect on the growth of carbon emission intensity in 2013–2016 than in the other two stages. This result is related to the high growth rate of housing prices during 2013–2016 and the decrease in housing purchasing power, which led to a decrease in housing area per capita. In addition, as the cost of living increases, the average household size in Henan Province decreases, inhibiting the growth of carbon emission intensity of residential buildings. It is worth noting that since 2017, the contribution of the integrated carbon emission factor to the carbon emission intensity of buildings has changed from positive to negative values. It indicates that the energy consumption structure of residential buildings in Henan Province has changed, shifting toward low energy consumption.

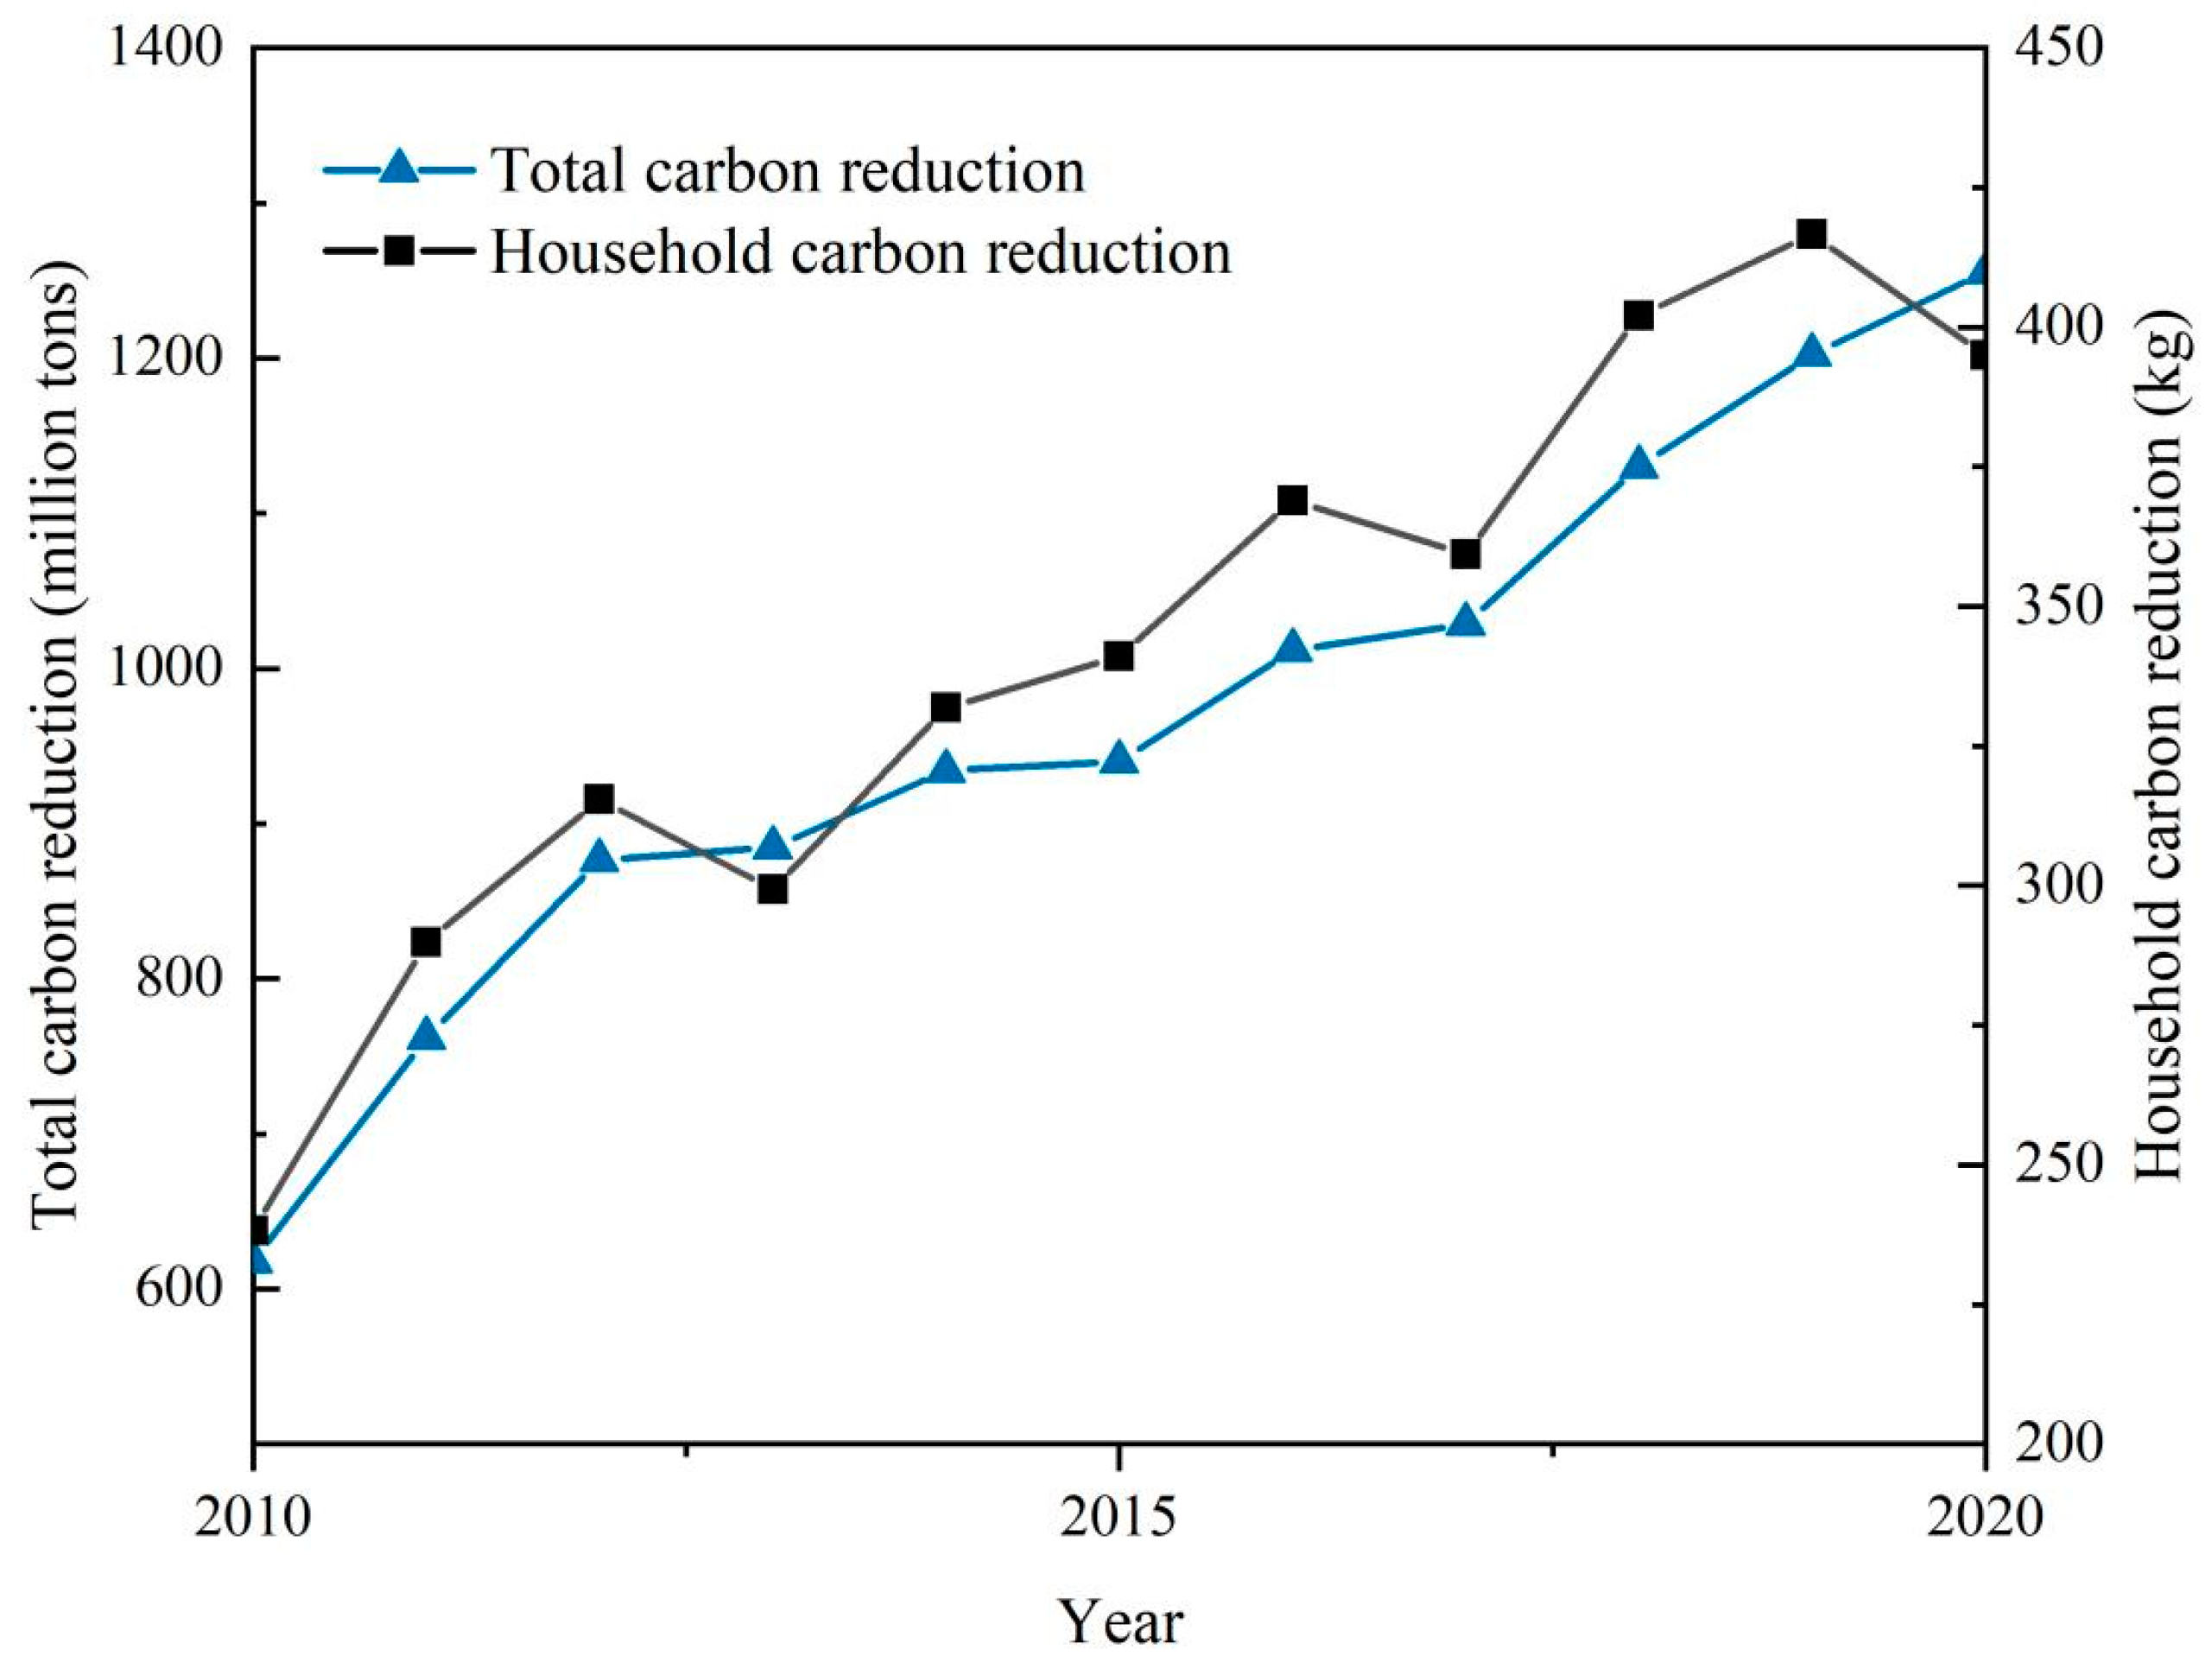
3.4. Historical Carbon Emission Reduction and Reduction Degree of Residential Buildings

Calculating and analyzing the historical carbon emission reduction is meaningful for predicting the trend of carbon emission of residential buildings in Henan Province. Therefore, the total historical carbon emission reduction and the reduction degree in the time interval [0, T] can be expressed by Equations (13) and (14) [34]:
C M 0 T = H 0 T ( Δ C h x 0 T )
C M int e n s i t y 0 T = ( Δ C h x 0 T )
where C M 0 T denotes historical carbon emission reduction of residential buildings; C M int e n s i t y 0 T denotes the reduction degree of carbon emission; Δ C h x 0 T ( Δ P h , Δ R , Δ i , Δ d , Δ B , Δ T , Δ K ) , Δ C h x 0 T < 0 .
In order to reach the goal of peak carbon dioxide emissions and identify the potential of carbon emission reduction of residential buildings in Henan Province, this paper evaluates the total carbon emission reduction and reduction degree (average household carbon emission reduction) based on the data obtained for 2010 to 2020 using the Kaya-LMDI model. The results are shown in Figure 3. According to total carbon emission reduction and average household carbon emission reduction, 106.43 million tons of CO2 are reduced from residential buildings in Henan Province from 2011 to 2020 (Table 2). As shown in Figure 3, both total carbon emission reduction and the average household carbon emission reduction show a stepped growth during the research period. The average household carbon emission reduction reaches a peak of 416.59 kg CO2/household in 2019, while the total carbon emission reduction still maintains an increasing trend year by year and is expected to grow continuously. On this basis, Henan Province has a long way to go in reducing the carbon emissions of residential buildings.

4. Simulation of Peak Carbon Emissions from Residential Buildings

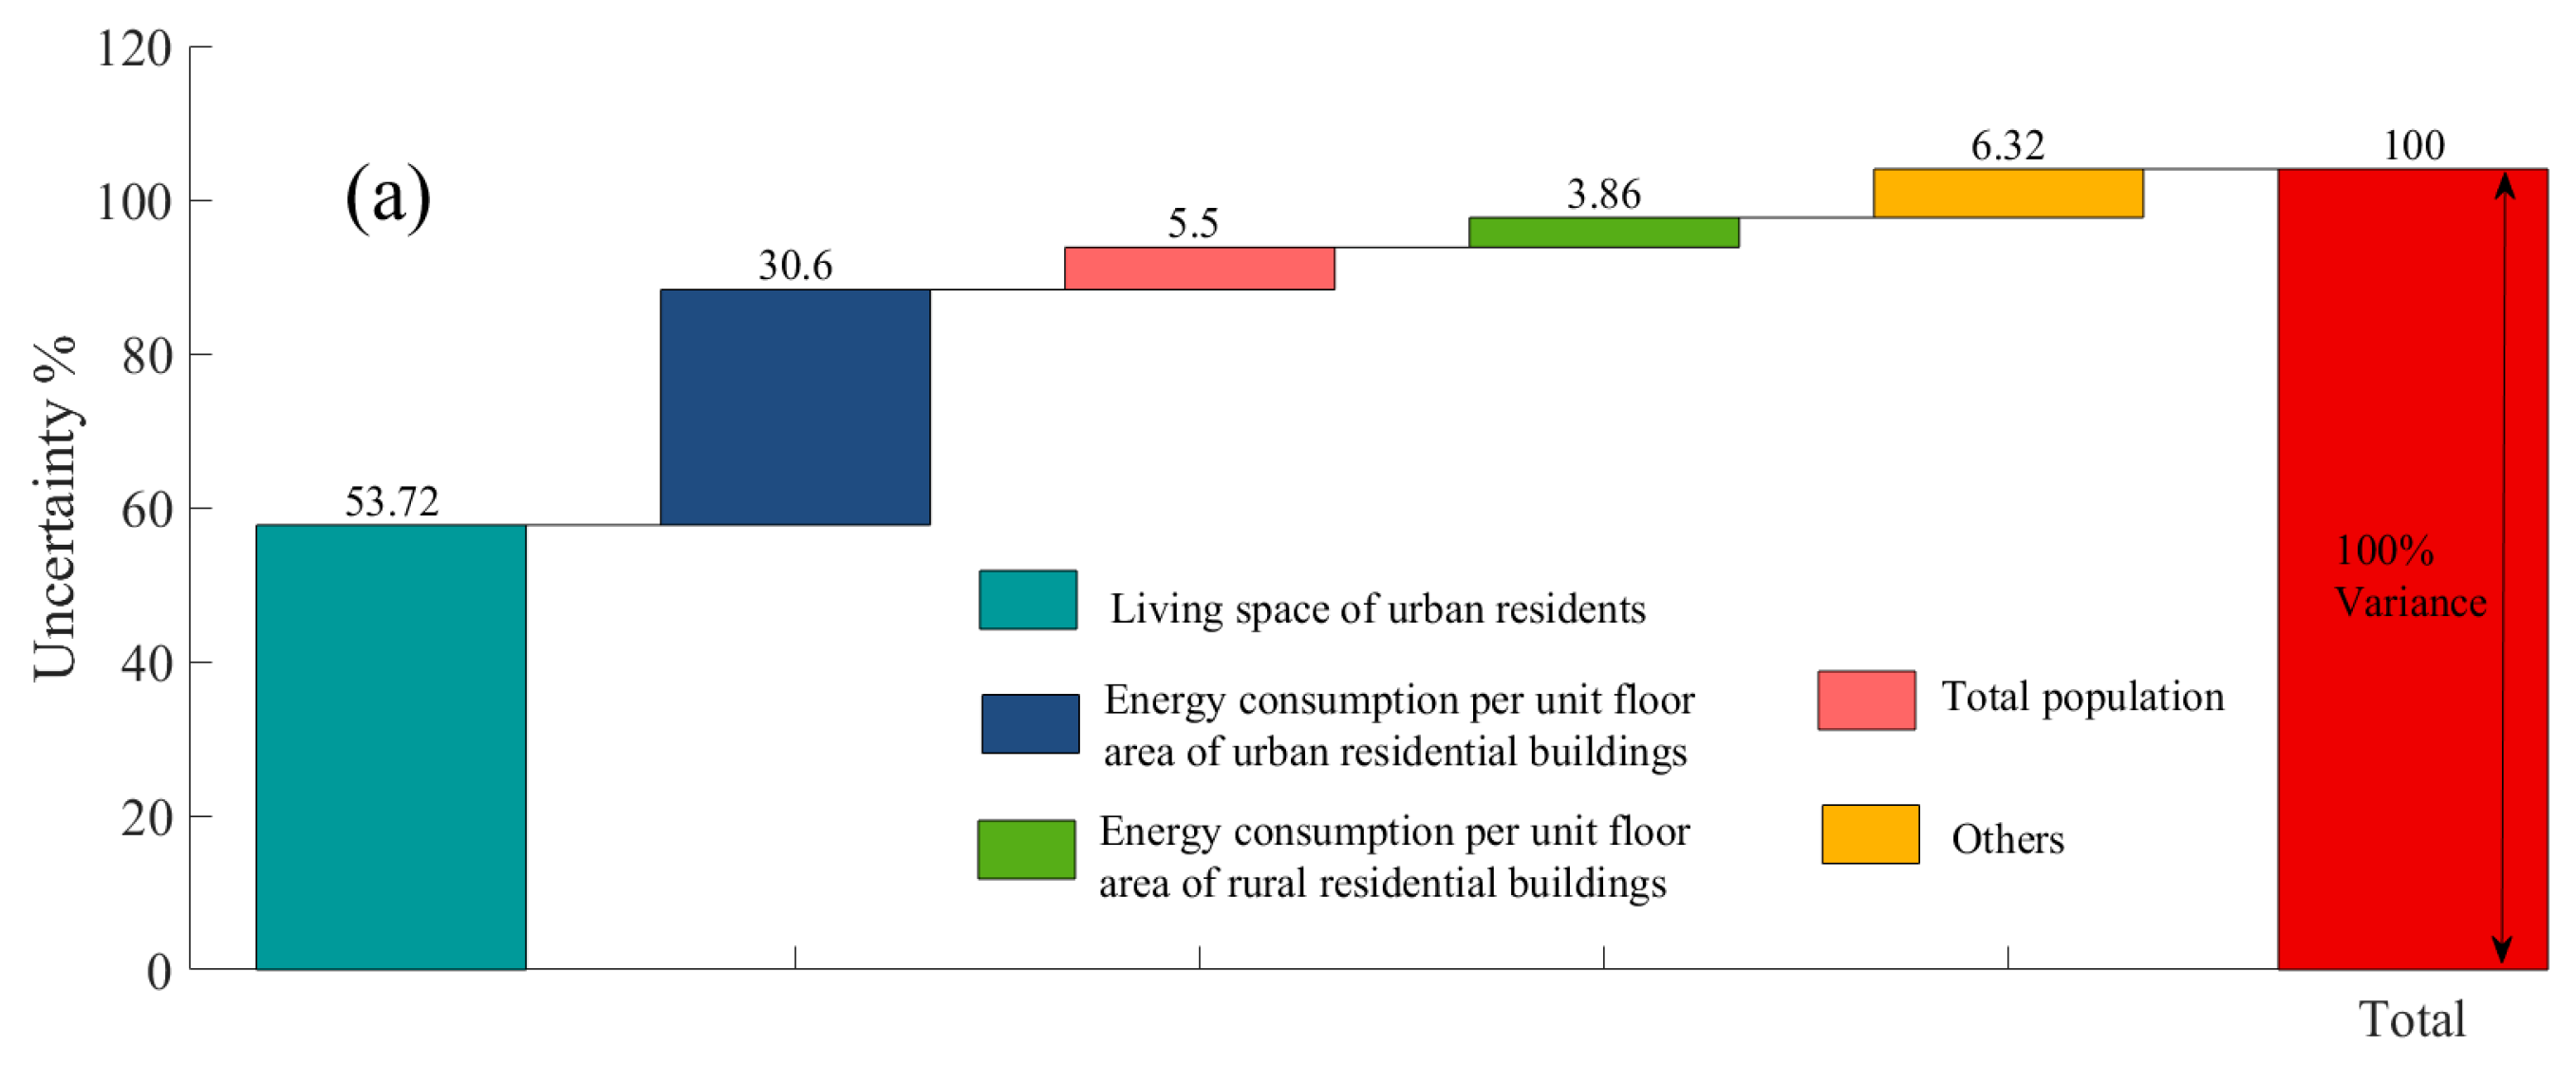
4.1. Static Scenario Analysis

The static scenario analysis method can construct different static scenarios based on the development trends of variables. After combining various uncertainty elements, this method can also predict and analyze the evolutionary trends of the research object under different circumstances [35]. In the above section, the relationship between the total carbon emissions of residential buildings and their influencing factors was established through the Kaya identity. On this basis, the scenario analysis was conducted to predict each influencing factor, thus predicting the future carbon emission potential. Currently, it is difficult to accurately predict the future trends of economic variables such as per capita household income and the ratio of housing price to income. The economic forecasts with insufficient reliability could affect the true feedback of economic variables in the Kaya identity for total carbon emissions of residential buildings [36]. Focusing on the non-economic core contributory factors of the total carbon emission from residential buildings, this study divided the residential building total carbon emissions in Henan Province into urban and rural residential buildings total carbon emissions and constructed their respective Kaya identities as follows [36]:
C u = P · U · E u F u · F u P · U · C u E u = P · U · e u · f u · K u
where C u denotes the total carbon emissions from urban residential buildings, P indicates the population, U denotes the urbanization rate, E u denotes the total energy consumption of urban residential buildings, F u denotes the total floor area of urban residential buildings, e u denotes the energy consumption per unit area of urban residential buildings, f u denotes the floor area per capita of urban residential buildings, and K u indicates the comprehensive carbon emission factor of urban residential buildings.
C r = P · ( 1 U ) · E r F r · F r P · ( 1 U ) · C r E r = P · ( 1 U ) · e r · f r · K r = P · U r · e r · f r · K r
where C r denotes the total carbon emissions from rural residential buildings, E r denotes the total energy consumption of rural residential buildings, F r denotes the total floor area of rural residential buildings, e r denotes the energy consumption per unit area of rural residential buildings, f r denotes the floor area per capita of rural residential buildings, K r indicates the comprehensive carbon emission factor of rural residential buildings, and U r denotes the percentage of the rural population.
Thus, the Kaya identity for the total carbon emissions from residential buildings in Henan Province can be written as Equation (17).
C = i C i = i P · U i · e i · f i · K i
Based on the Kaya identity established in Equation (10), a prediction model for the total carbon emissions from residential buildings in Henan Province was constructed in this study. Meanwhile, this study also took 2020 as the baseline year and constructed three static scenarios for the residential building carbon emissions in Henan Province from 2020 to 2050: the baseline, low-carbon, and high-carbon scenarios. The specific methods are as follows. Firstly, the values of each variable in 2030 and 2050 were set based on relevant research literature (Table 3). Secondly, the relevant data for the intermediate years were interpolated based on polynomial fitting. The carbon emissions from residential buildings in Henan Province under different static scenarios can be predicted by bringing the obtained parameters for each year into the total carbon emission prediction model for residential buildings [36].
Based on the base value settings above, the evolution trend of residential building carbon emissions in Henan Province under the low-carbon, baseline, and high-carbon scenarios can be obtained as shown below.
The following can be observed in Figure 4. From 2020 to 2050, the carbon emissions in all three static scenarios show inverted U-shaped trends. In the baseline scenario, the residential building carbon emission in Henan Province peaks in 2036 at 131.66 million tons, indicating that it is difficult for Henan Province to reach peak residential building carbon emissions in 2030 under the current state. In the low-carbon scenario, the residential building carbon emission in Henan Province peaks in 2030 at 99.88 million tons. In the high-carbon scenario, the residential building carbon emission in Henan Province peaks in 2041 at 138.65 million tons. Compared to the baseline scenario, the peak carbon emission in the high-carbon scenario is delayed by 6 years, and the carbon emission reaches 1.169 times that of the baseline scenario. Compared with the baseline scenario, the emission in the low-carbon scenario peaks 6 years earlier and reaches only 0.842 times that in the baseline scenario.

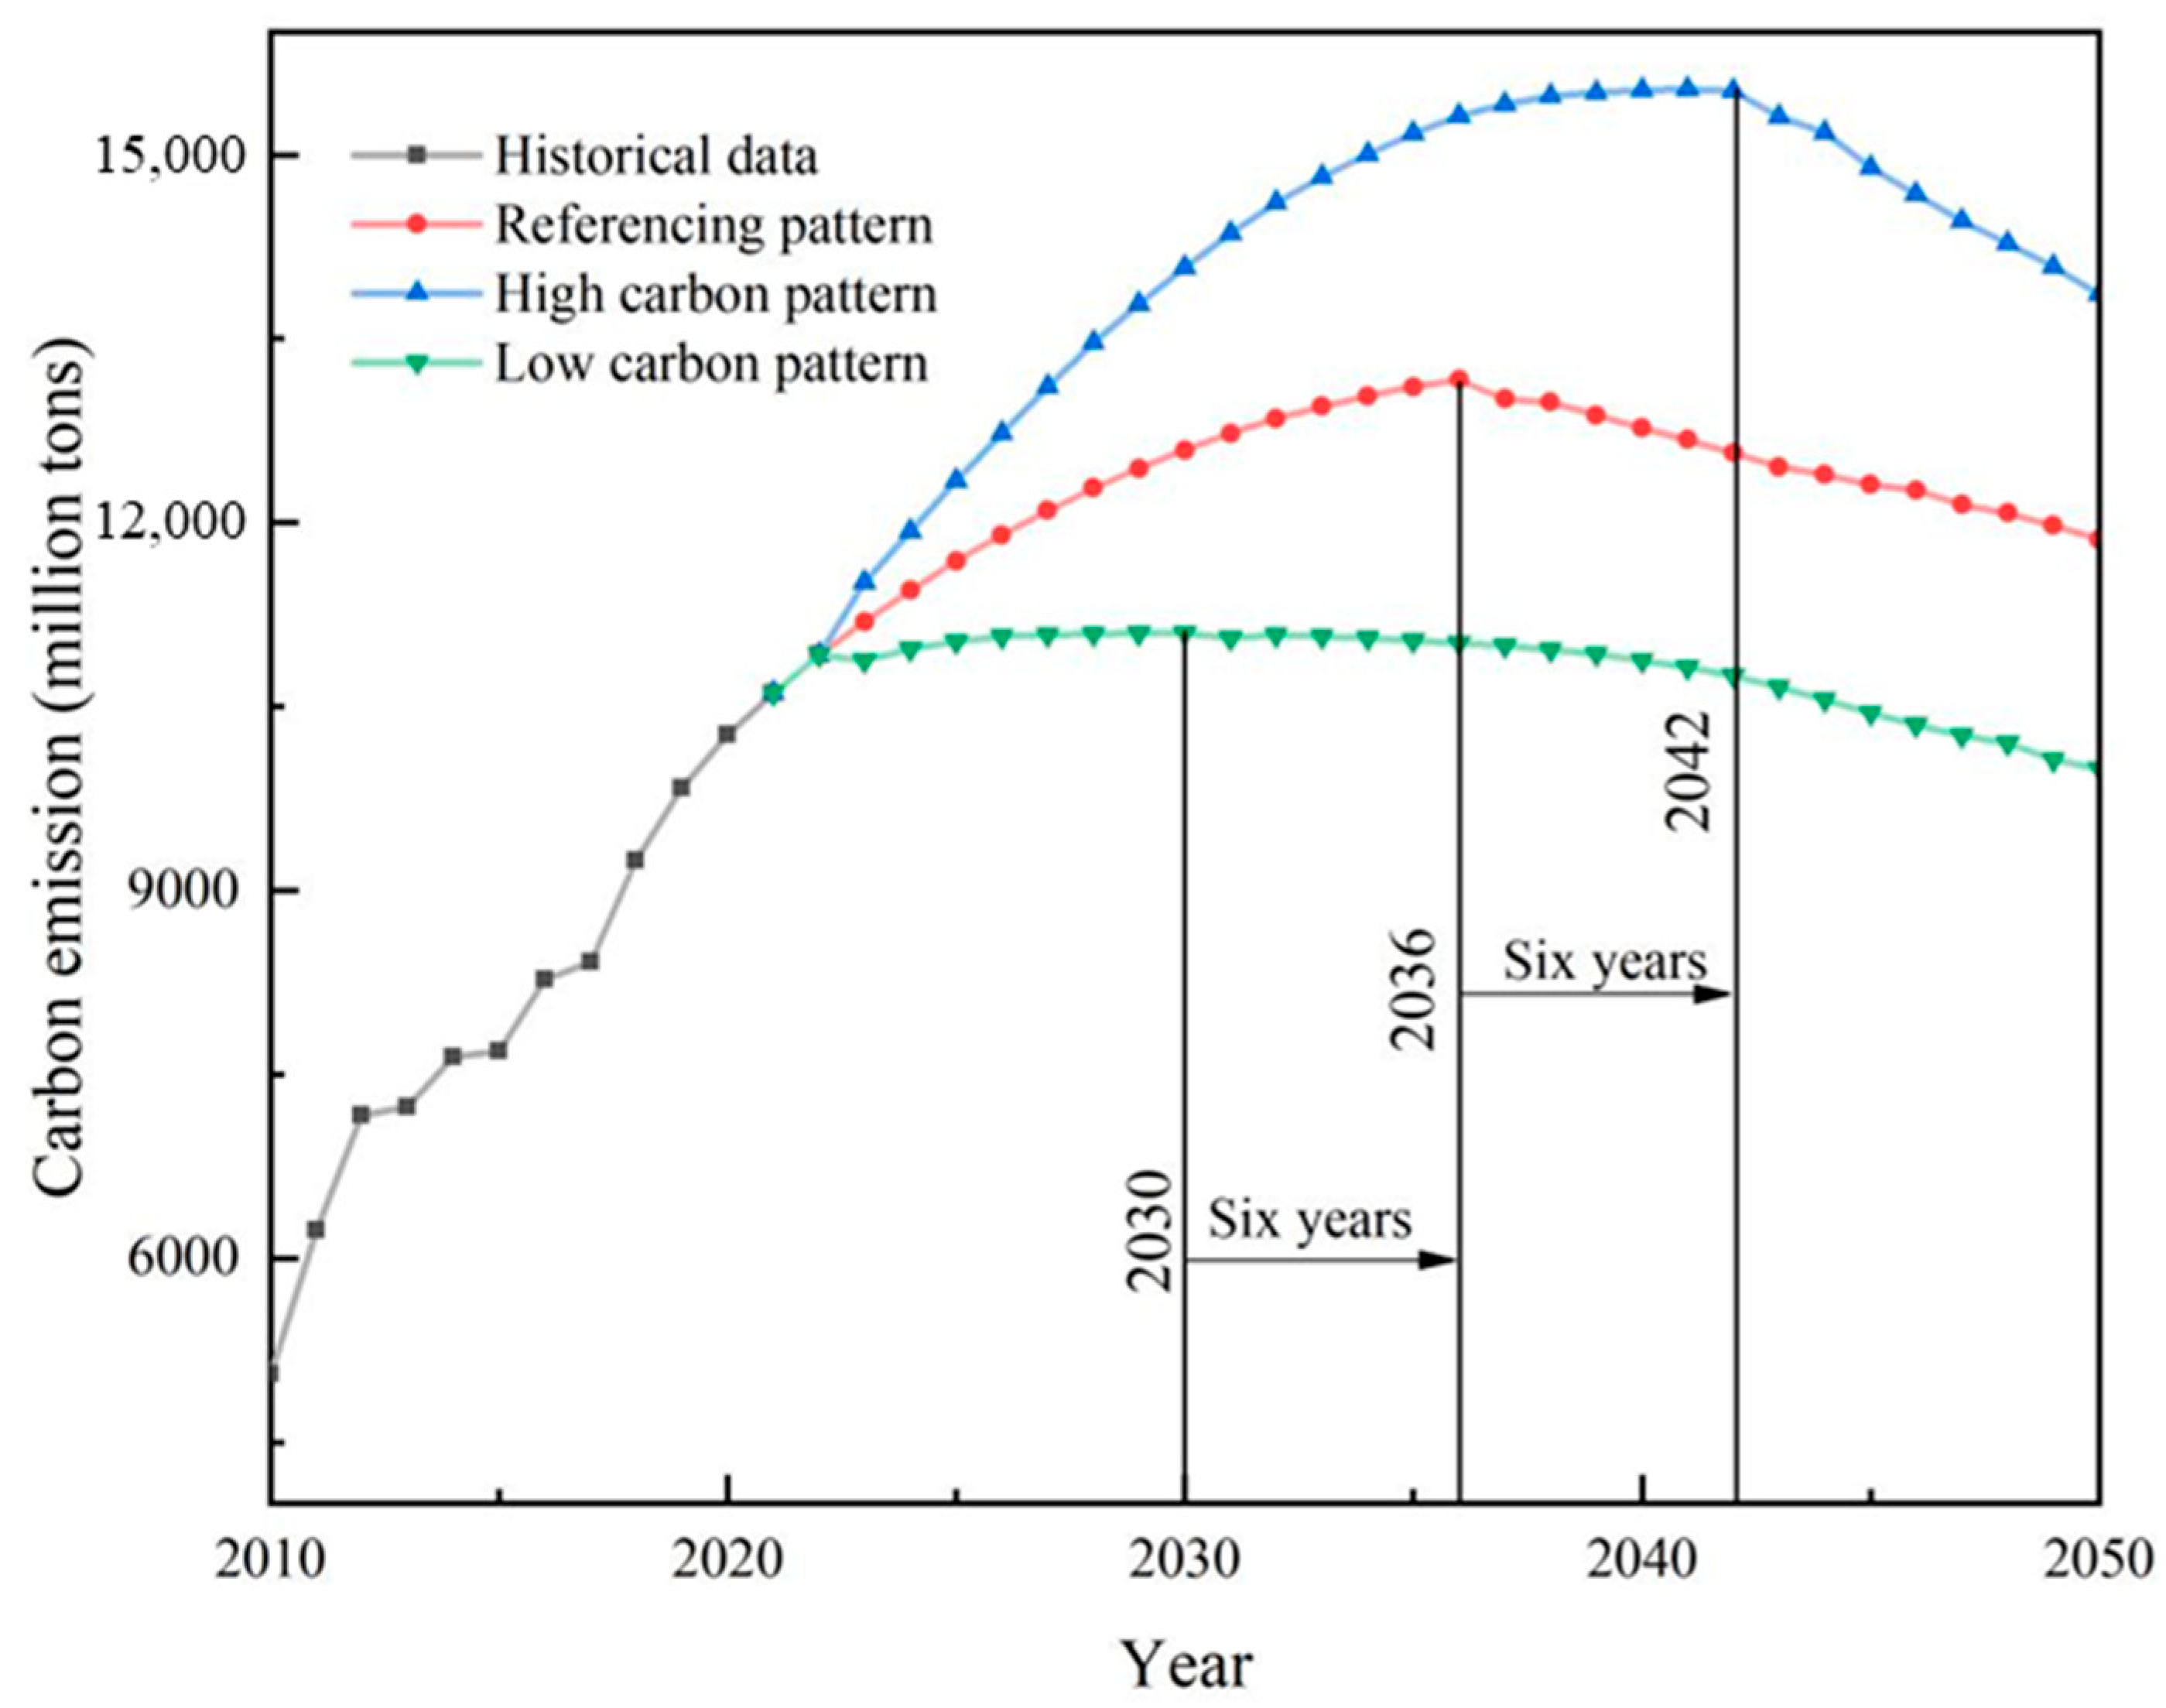
4.2. Dynamic Scenario Analysis for Peak Residential Building Carbon Emissions

Although static scenario analysis can reveal the different trends of the variables under different socioeconomic development scenarios and energy-environment policy scenarios [46,47], it could prove difficult to fully consider the uncertain future changes in each variable. As a classical risk analysis method, Monte Carlo simulation can be comprehensively and flexibly applied to the analysis of uncertain events [48]. Therefore, this study introduced Monte Carlo simulation on the basis of scenario analysis and constructed dynamic scenario analysis models of residential building carbon emissions in Henan Province. In turn, we obtained the time, amount, and the related probability distribution of peak emissions from residential buildings in Henan Province under different scenarios, with a view to accurately controlling the emission reduction path for residential buildings in Henan Province. Using Equation (18) [49], the static scenario variables of the prediction model for total carbon emissions from residential buildings in Henan Province were converted to the corresponding dynamic scenario variables.
y D T = y S T · ( 1 + ω y · T 2019 2050 2019 ) , ω y ~ N ( 0 , σ )
where y D T denotes the dynamic scenario variables of year T, y S T denotes the static scenario variables of year T, and ω y denotes the random parameters of each variable.
In this paper, the random parameters of each variable in the dynamic scenario analysis model for residential building carbon emissions in Henan Province were set at the 95% confidence interval (Table 4) so that the variables vary within an interval of ±2 σ , which covers the minimum and maximum values of the variables for each year in the static low-carbon and high-carbon scenarios [50].
Based on the dynamic scenario analysis model of residential building carbon emissions in Henan Province, three hundred thousand Monte Carlo simulations were conducted on the residential building carbon emission data under the baseline scenario using MATLAB, and the distribution intervals for the time and amount of peak carbon emission from residential buildings in Henan Province were obtained (Figure 5). The sensitivity analysis on the uncertainties of peak emission time and amount was carried out.
Figure 5 illustrates that the residential building carbon emissions in Henan Province reach their peak of 155.34 million tCO2 in 2036, falling within the standard deviation (95% confidence interval). These findings are consistent with those obtained from static scenario analysis, albeit with minor discrepancies. This justifies the dynamic scenario analysis model constructed in this paper. According to the dynamic simulation analysis, the possibility of achieving peak carbon emissions from residential buildings in Henan Province by 2030 is only 5.2509%, indicating that it is difficult to achieve peak carbon emissions from residential buildings in Henan Province by 2030 under the current state.
According to the calculation of historical carbon emissions from residential buildings in Henan Province, the contribution of urban residential buildings to the total residential building carbon emissions is much larger than that of rural residential buildings. Some conclusions can be drawn through qualitative sensitivity analysis. According to Figure 6, the urban per capita floor area contributes most significantly to the uncertainty of the time and amount of peak residential building emissions in Henan Province, which is consistent with the conclusion of historical data calculations that its contributions are 53.72% and 53.38%, respectively.
Thus, urban per capita floor area is the most important factor affecting the uncertainty of peak emission time and amount, and controlling it can effectively accelerate the progress to reach peak residential building carbon emission in Henan Province [51]. In the meantime, the contributions of urban energy consumption per unit area to the time and amount of peak emission are 30.6% and 30.64%. This result further confirms the great influence of urban residential buildings on the time and amount of peak residential building carbon emissions in Henan Province. Thus, urban residential buildings should be the focus of the government’s efforts to reduce carbon emissions from buildings.

5. Discussion and Innovations

5.1. Discussion

At present, China has put forward five goals: “building a green, low-carbon, and circular economic system, promoting sustainable development by improving energy efficiency, increasing the share of non-fossil fuel consumption, reducing carbon dioxide emissions, and enhancing ecosystem carbon sequestration capacity”. Under the existing policy environment, this research shows that carbon emissions during the use stage of urban residential buildings in Henan Province will continue to increase. This will not only increase the pressure on improving the ecological environment but also make Henan Province face significant emission reduction pressure. Therefore, based on the research conclusions, the following suggestions are proposed:
(1) Restrict high consumption and advocate a green and low-carbon lifestyle consumption concept. Take corresponding restrictive measures for high consumers, such as imposing more taxes on them. In addition, we will comprehensively improve the energy efficiency of new buildings and vigorously develop green buildings, especially the construction of renewable energy buildings. Also, improve the energy efficiency level of existing buildings. Combining the renovation of old urban residential areas and the construction of green communities, we will promote the energy-saving and green transformation of existing buildings;
(2) Vigorously study energy-saving and emission-reduction technologies to improve the rate of technological progress and transform it into productivity so as to improve energy efficiency and reduce energy intensity And, at the same time, promote the application of green energy and technology. Additionally, we can enhance the promotion of renewable energy in new buildings and vigorously promote the application of renewable energy buildings such as solar photovoltaic systems and air source heat pump hot water systems and gradually eliminate industries with high energy consumption and pollution, and promote the development of high-tech industries.
(3) The Henan Provincial Department of Housing and Urban Rural Development should introduce corresponding regulations on the building area of houses, setting a threshold for houses of different sizes. At the same time, the housing construction department should advocate the construction of affordable housing and reasonably control the proportion of large family houses. In addition, reasonable control of the average urban population can be achieved by encouraging people to shift their employment or living places to rural areas, thereby achieving the goal of dispersing the average urban population;
(4) The energy structure of the region is relatively stable, and it is necessary to adjust the energy structure. We should actively develop clean energy power generation, and further research and develop the use of clean energy such as solar energy, hydropower, and bioenergy, geothermal energy so as to increase the proportion of non-carbon energy in energy consumption and reduce the proportion of carbon-rich energy in energy consumption. In addition, the region has a strong external dependence on coal and oil supply, and it is necessary to develop new technologies to accelerate the transformation of energy types. For example, by leveraging the advantages of the plain terrain in the region, we can promote low-carbon construction power supply through the deep development of wind power generation and optimization of coal power development.

5.2. Innovations

Changes in carbon emissions of residential buildings in Henan were analyzed from social, economic, and technological aspects in this study. The Kaya-LMDI decomposition method was used to analyze the contribution of various influencing factors to the growth of carbon emission intensity within a specific period and evaluate the historical carbon emission reduction of residential buildings in Henan. The innovation of this paper lies in the following:
(1) Monte Carlo simulation was combined with the scenario analysis method. A “static setting + dynamic simulation” model was built to predict the trajectory, corresponding peak value, peak time interval distribution, and key influencing factors of carbon emissions from residential buildings in Henan;
(2) The carbon emission reduction target of Henan Province was combined to systematically evaluate the carbon emission of residential buildings in this region, and the carbon emission reduction method path was studied. Centered on building carbon peaking, comprehensive research was conducted on carbon emission accounting, analysis of factors influencing carbon intensity, and prediction of carbon peaking paths. This study can enrich the theoretical knowledge system and empirical research methods on the influencing factors and peak simulation of residential building carbon emissions.

6. Conclusions

This study selected residential buildings in Henan Province as the research object of the time and amount of peak carbon emission and calculated the carbon emission amount and carbon emission intensity in the last decade using the statistical yearbook splitting method. The driving factors of carbon emission changes were analyzed using the Kaya-LMDI decomposition method, and the future residential building carbon emissions and carbon emission peaks in Henan Province were predicted under static and dynamic simulations with the set parameters. The specific findings of the study are as follows.
(1) Based on the calculations with the statistical yearbook splitting method, the carbon emissions from residential buildings in Henan Province showed an increasing trend from 2010 to 2020, and the growth rate of carbon emissions from rural residential buildings was gradually decreasing. It can be predicted that the total carbon emission from residential buildings in Henan Province will continue to grow in the coming period. Considering the calculation of the comprehensive carbon emission factor, it is speculated to be related to the restructuring of energy consumption in rural residential buildings [52];
(2) Based on the obtained carbon emission data for each year from 2010 to 2020, the total carbon emission reduction and carbon emission reduction intensity each year (carbon emission reduction per household) from residential buildings in Henan Province were evaluated using the Kaya-LMDI decomposition model. Between 2010 and 2020, a total of 106.43 million tons of CO2 was reduced from residential buildings in Henan Province. In the 2010 to 2020 study period, the total residential building carbon emission reduction and the per household carbon emission reduction of Henan Province had similarly increasing trends. The per-household building carbon reduction peaked at 416.59 kgCO2/household in 2019. In contrast, the total carbon emission reduction from buildings still maintained a year-by-year increasing trend and was expected to continue growing. Thus, Henan Province has great potential for residential building carbon emission reduction;
(3) The path-to-peak carbon emissions from residential buildings in Henan Province was analyzed. The residential building carbon emission trajectory in Henan Province between 2020 and 2050 was predicted using the “static setting + dynamic simulation” extrapolation model. From 2020 to 2050, the carbon emissions in all three static scenarios showed inverted U-shaped trends. In the baseline scenario of static simulation, the residential building carbon emission in Henan Province peaked in 2036 at 131.66 million tons. In the low-carbon scenario, the residential building carbon emission in Henan Province peaked in 2030 at 99.88 million tons. In the high-carbon scenario, the residential building carbon emission in Henan Province peaked in 2041 at 138.65 million tons. In the dynamic simulation scenario, it was expected that the residential building carbon emissions in Henan Province would peak in 2036 at 155.34 million tons. The simulation results indicated that it was difficult to achieve peak carbon emissions from residential buildings in Henan Province by 2030 under the current state. Considering the residential building carbon emissions in Henan Province during the study period, we concluded that the progress of urban residential building carbon emission reduction in Henan Province was slow. The government should focus on controlling urban residential building energy consumption and per capita floor space to accelerate the progress of reaching peak carbon emissions from residential buildings in Henan Province.
In conclusion, this study investigated the trajectory of carbon emissions from residential buildings in Henan Province under the “two-carbon” target. This study has greatly enriched the theoretical knowledge system and empirical research methods of the influencing factors of carbon emission change in the building sector and peak simulation prediction and provided a research reference for the assessment of historical CO2 emission reduction and the scenario analysis of carbon emission peak. However, the basic emission data and the framework of the peaking model need to be further expanded and improved. First of all, the quantitative analysis in this study was based on building carbon emission data from the Energy Statistical Yearbook. However, the decomposition of energy consumption and emissions (heating, cooling, lighting, etc.) at building terminals was been included. In the future, expanding data collection and accounting of building terminal energy use and emissions is imperative so as to evaluate the historical emission reduction level of terminal energy use carbon emissions. Secondly, this study simplified the carbon emission model of residential buildings based on the Kaya identity and subsequently simulated their future development trajectory and corresponding peak state of carbon emissions. In future studies, it is recommended to expand the existing emission model parameters, particularly with regard to a series of economic factors that affect building carbon emissions, in order to reliably and reasonably predict future development trends.

Author Contributions

Methodology, X.Y.; writing—original draft preparation, Y.S.; writing—review and editing, Y.L.; funding acquisition, M.L. All authors have read and agreed to the published version of the manuscript.

Funding

This research was funded by the National Social Science Foundation of China (Grant NO. 21CGL024), the Nanhu Scholars Program for Young Scholars of XYNU.

Institutional Review Board Statement

The study did not involve humans.

Informed Consent Statement

Not applicable.

Data Availability Statement

Not applicable.

Conflicts of Interest

The authors declare no conflict of interest.

References

  1. Nkemelang, T.; New, M.; Zaroug, M. Temperature and precipitation extremes under current, 1.5 °C and 2.0 °C global warming above pre-industrial levels over Botswana, and implications for climate change vulnerability. Environ. Res. Lett. 2018, 13, 065016. [Google Scholar] [CrossRef] [Green Version]
  2. Li, F.; Liu, J.; Liu, W.; Liao, S. Spatiotemporal dynamics analysis of carbon emissions from nighttime light data in Beijing-Tianjin-Hebei counties. J. Xinyang Norm. Univ. (Nat. Sci. Ed.) 2021, 34, 230–236. [Google Scholar]
  3. Li, X.; Zhao, X. An empirical analysis on the impact of air pollution on green transportation consumption. J. Xinyang Norm. Univ. (Nat. Sci. Ed.) 2022, 35, 591–596. [Google Scholar]
  4. Wang, G.; Liao, M.; Jiang, J. Research on agricultural carbon emissions and regional carbon emissions reduction strategies in China. Sustainability 2020, 12, 2627. [Google Scholar] [CrossRef] [Green Version]
  5. Wang, Y.; Yao, G.; Zuo, Y.; Wu, Q. Implications of global carbon governance for corporate carbon emissions reduction. Front. Environ. Sci. 2023, 11, 1071658. [Google Scholar] [CrossRef]
  6. Xiao, M.; Peng, X. Decomposition of carbon emission influencing factors and research on emission reduction performance of energy consumption in China. Front. Environ. Sci. 2022, 10, 1096650. [Google Scholar] [CrossRef]
  7. Huo, T.; Li, X.; Cai, W.; Zuo, J.; Jia, F.; Wei, H. Exploring the impact of urbanization on urban building carbon emissions in China: Evidence from a provincial panel data model. Sustain. Cities Soc. 2020, 56, 102068. [Google Scholar] [CrossRef]
  8. Huo, T.; Tang, M.; Cai, W.; Ren, H.; Liu, B.; Hu, X. Provincial total-factor energy efficiency considering floor space under construction: An empirical analysis of China’s construction industry. J. Clean. Prod. 2020, 244, 118749. [Google Scholar] [CrossRef]
  9. Xiao, D.; Niu, H.; Guo, J.; Zhao, S.; Fan, L. Carbon Storage Change Analysis and Emission Reduction Suggestions under Land Use Transition: A Case Study of Henan Province, China. Int. J. Environ. Res. Public Health 2021, 18, 1844. [Google Scholar] [CrossRef]
  10. Kaya, Y. Impact of Carbon Dioxide Emission Control on GNP Growth: Interpretation of Proposed Scenarios; Intergovernmental Panel on Climate Change/Response Strategies Working Group: Geneva, Switzerland, 1990. [Google Scholar]
  11. Kavgic, M.; Mavrogianni, A.; Mumovic, D.; Summerfield, A.; Stevanovic, Z.; Djurovic-Petrovic, M. A review of bottom-up building stock models for energy consumption in the residential sector. Build. Environ. 2010, 45, 1683–1697. [Google Scholar] [CrossRef]
  12. Fankhauser, S.; Tol, R.S. The social costs of climate change: The IPCC second a ssessment report and beyond. Mitig. Adapt. Strateg. Glob. Chang. 1997, 1, 385–403. [Google Scholar] [CrossRef] [Green Version]
  13. Boyd, G.; Mcdonald, J.F.; Ross, M.; Hanson, D. Separating the changing composition of US manufacturing production from energy efficiency improvements: A Divisia index approach. Energy J. 1987, 8, 77–96. [Google Scholar] [CrossRef]
  14. Swan, L.G.; Ugursal, V.I. Modeling of end-use energy consumption in the residential sector: A review of modeling techniques. Renew. Sustain. Energy Rev. 2009, 13, 1819–1835. [Google Scholar] [CrossRef]
  15. Ang, B.W.; Choi, K.H. Decomposition of Aggregate Energy and Gas Emission Inten sities for Industry: A refined Divisia index method. Energy J. 1997, 18, 59–73. [Google Scholar] [CrossRef]
  16. Guo, S.; Liu, G.; Liu, S. Driving factors of NOX emission reduction in China’s power industry: Based on LMDI decomposition model. Environ. Sci. Pollut. Res. 2023, 30, 51042–51060. [Google Scholar] [CrossRef]
  17. Li, H.; Zheng, Y.; Gong, G.; Guo, H. A simulation study on peak carbon emission of public buildings: In the case of henan province China. Sustainability 2023, 15, 8638. [Google Scholar] [CrossRef]
  18. Liu, M.; Yang, X.; Wen, J.; Wang, H.; Feng, Y.; Lu, J.; Chen, H.; Wu, J.; Wang, J. Drivers of China’s carbon dioxide emissions: Based on the combination model of structural decomposition analysis and input-output subsystem method. Environ. Impact Assess. Rev. 2023, 100, 107043. [Google Scholar] [CrossRef]
  19. Ali, U.; Shamsi, M.H.; Hoare, C.; Mangina, E.; O’Donnell, J. Review of urban building energy modeling (UBEM) approaches, methods and tools using qualitative and quantitative analysis. Energy Build. 2021, 246, 111073. [Google Scholar] [CrossRef]
  20. Ang, B.W. LMDI decomposition approach: A guide for implementation. Energy Policy 2015, 86, 233–238. [Google Scholar] [CrossRef]
  21. Peng, C.; Wei, Q.; Wei, W. Decarbonization path of China’s public building sector from bottom to top. Carbon Neutrality 2022, 1, 39. [Google Scholar] [CrossRef]
  22. Qi, Y.; Rao, G.; Zha, L.; Chen, L.; Niu, Y. Carbon Transfer Decision Model Based on LMDI Method. Comput. Intell. Neurosci. 2022, 3970880, 3970880. [Google Scholar] [CrossRef] [PubMed]
  23. Ma, M.; Cai, W.; Cai, W. Carbon abatement in China’s commercial building sector: A bottom-up measurement model based on Kaya-LMDI methods. Energy 2018, 165, 350–368. [Google Scholar] [CrossRef]
  24. Lu, Y.; Cui, P.; Li, D. Which activities contribute most to building energy consumption in China? A hybrid LMDI decomposition analysis from year 2007 to 2015. Energy Build. 2018, 165, 259–269. [Google Scholar] [CrossRef]
  25. Henan Statistical Bureau. In China Energy Statistical Yearbook 2010–2020; China Statistics Press: Beijing, China, 2020.
  26. National Bureau of Statistics of China. In China Statistical Yearbook 2010–2020; China Statistics Press: Beijing, China, 2020.
  27. Chen, h.; Bi, L. Study on spatio-temporal changes and driving factors of carbon emissions at the building operation stage: A case study of China. Build. Environ. 2022, 219, 109147. [Google Scholar] [CrossRef]
  28. Huo, T.; Ren, H.; Zhang, X.; Cai, W.; Feng, W.; Zhou, N.; Wang, X. China’s energy consumption in the building sector: A Statistical Yearbook-Energy Balance Sheet based splitting method. J. Clean. Prod. 2018, 185, 665–679. [Google Scholar] [CrossRef]
  29. Zhou, X.; Huang, Z.; Bronte, S.; Wang, H.; Zhou, G.; Liu, Y. High-resolution estimation of building energy consumption at the city level. Energy 2023, 275, 127476. [Google Scholar] [CrossRef]
  30. Wang, P.; Wu, P.; Song, Y.; Keith, H.; Zhong, Y. A novel spatio-temporally stratified heterogeneity model for identifying factors influencing carbon emissions. Energy Build. 2023, 280, 112714. [Google Scholar] [CrossRef]
  31. Wakazono, Y.; Kato, T.; Hayakawa, N.; Suzuoki, Y.; Kaya, Y. Feasibility assessment of efficient, environmentally benign and economic heat combinat by cascade use of waste energy in industries. IEEJ Trans. Power Energy 1999, 119, 1026–1034. [Google Scholar] [CrossRef] [Green Version]
  32. Ma, M.; Ma, X.; Cai, W. Carbon roadmap of residential building sector in China: Historical mitigation and prospective peak. Appl. Energy 2020, 273, 115247. [Google Scholar] [CrossRef]
  33. Wen, L.; Li, Z. Provincial-level industrial CO2 emission drivers and emission reduction strategies in China: Combining two-layer LMDI method with spectral clustering. Sci. Total Environ. 2020, 700, 134374. [Google Scholar] [CrossRef]
  34. Lou, Y.; Ye, Y.; Yang, Y.; Wang, Z. Long-term carbon emission reduction potential of building retrofits with dynamically changing electricity emission factors. Build. Environ. 2022, 210, 108683. [Google Scholar] [CrossRef]
  35. Postma, T.; Liebl, F. How to improve scenario analysis as a strategic management tool? Technol. Forecast. Soc. Chang. 2005, 72, 161–173. [Google Scholar] [CrossRef]
  36. Ma, M.; Cai, W. What drives the carbon mitigation in Chinese commercial building sector? Evidence from decomposing an extended Kaya identity. Sci. Total Environ. 2018, 634, 884–899. [Google Scholar] [CrossRef]
  37. National Bureau of Statistics of China. In China Population & Employment Statistics Yearbook 2010–2020; China Statistics Press: Beijing, China, 2020.
  38. Huo, J.; Zhang, X.; Zhang, Z.; Chen, Y. Research on population development in ethnic minority areas in the context of China’s population strategy adjustment. Sustainability 2020, 12, 8021. [Google Scholar] [CrossRef]
  39. Fan, Y.; Liu, Q.; Huang, X.; Li, M.; He, B.; Guo, W.; Wang, Y. Study on the characteristics of China’s population spatial Pattern and influencing factors based on mobile phone signaling data. J. Xinyang Norm. Univ. (Nat. Sci. Ed.) 2022, 35, 584–590. [Google Scholar]
  40. Xu, G.; Li, J.; Peter, M.S.; Yang, H.; Chang, H. Rural financial development and achieving an agricultural carbon emissions peak: An empirical analysis of Henan Province, China. Environ. Dev. Sustain. 2022, 24, 12936–12962. [Google Scholar] [CrossRef]
  41. Zhang, P.; He, J.; Hong, X.; Zhang, W.; Qin, C.; Pang, B.; Li, Y.; Liu, Y. Regional-level carbon emissions modelling and scenario analysis: A STIRPAT case study in Henan Province, China. Sustainability 2017, 9, 2342. [Google Scholar] [CrossRef] [Green Version]
  42. Huang, Y.; Gao, J.; Zhang, Y.; Zhang, X. Comprehensive poverty types in typical agricultural areas and their spatial evolution. J. Xinyang Norm. Univ. (Nat. Sci. Ed.) 2022, 35, 446–452. [Google Scholar]
  43. Chen, H.; Du, Q.; Huo, T.; Liu, P.; Cai, W.; Liu, B. Spatiotemporal patterns and driving mechanism of carbon emissions in China’s urban residential building sector. Energy 2023, 15, 126102. [Google Scholar] [CrossRef]
  44. Zhang, X.; Zhang, X. Comparison and sensitivity analysis of embodied carbon emissions and costs associated with rural house construction in China to identify sustainable structural forms. J. Clean. Prod. 2021, 293, 126190. [Google Scholar] [CrossRef]
  45. Luo, G.; Tomas, B.; Zeng, S. Per capita CO2 emission inequality of China’s urban and rural residential energy consumption: A Kaya-Theil decomposition. J. Environ. Manag. 2023, 331, 117265. [Google Scholar] [CrossRef] [PubMed]
  46. Moncef, K. Evaluation of energy performance of dynamic overhang systems for US residential buildings. Energy Build. 2021, 234, 110699. [Google Scholar]
  47. Su, B.; Huang, J.; Thomas, F.; Wang, Y.; Zbigniew, W.; Kundzewicz, Z.; Sun, H.; Wang, A.; Zeng, X.; Wang, G.; et al. Drought losses in China might double between the 1.5 °C and 2.0 °C warming. Proc. Natl. Acad. Sci. USA 2018, 115, 10600–10605. [Google Scholar] [CrossRef] [PubMed] [Green Version]
  48. Kim, Y. Monte Carlo vs. Fuzzy Monte Carlo Simulation for Uncertainty and Global Sensitivity Analysis. Sustainability 2017, 9, 539. [Google Scholar] [CrossRef] [Green Version]
  49. Zhou, G.; Wu, M.; Tai, Y. Spatio-temporal pattern analysis of coupling and coordination between rural development and urbanization from the perspective of rural revitalization—A case study of Henan Province. J. Xinyang Norm. Univ. (Nat. Sci. Ed.) 2021, 34, 68–75. [Google Scholar]
  50. Ye, X.; Chuai, X. Have rural settlement changes harmed ecosystem carbon in China. Geography 2023, 153, 102917. [Google Scholar] [CrossRef]
  51. Wang, F.; Wu, M.; Zheng, W. What are the impacts of the carbon peaking and carbon neutrality target constraints on China’s economy? Environ. Impact Assess. 2023, 101, 107107. [Google Scholar] [CrossRef]
  52. Ma, L.; Zhang, X.; Li, D.; Müslüm, A.; Çağatay, Y.; Li, Q.; Zhang, S.; Jiang, W. Influence of sunspace on energy consumption of rural residential buildings. Sol. Energy 2020, 211, 336–344. [Google Scholar] [CrossRef]
Figure 1. The energy balance sheet splitting model for residential buildings.
Sustainability 15 10243 g001
Figure 2. Carbon emissions of residential buildings and carbon emission intensity in Henan Province (2010–2020).
Sustainability 15 10243 g002
Figure 3. Total carbon emission reduction and average household carbon emission reduction in Henan Province (2010–2020).
Sustainability 15 10243 g003
Figure 4. Predicted residential building carbon emissions in Henan Province from 2020 to 2050 under different scenarios.
Sustainability 15 10243 g004
Figure 5. (a) Time and (b) amount of peak carbon emissions for the residential building carbon emission in Henan Province.
Sustainability 15 10243 g005
Figure 6. Uncertainty (a) amount and (b) time of peak carbon emissions for the residential building carbon emission in Henan Province.
Sustainability 15 10243 g006aSustainability 15 10243 g006b
Table 1. Comprehensive carbon emission factors for building energy consumption of Henan Province (2010–2020).
Year20102011201220132014201520162017201820192020
Urban area1.81031.75871.73001.63481.64711.61281.80621.71091.79391.83471.8516
Rural area1.14901.20061.27511.27411.35851.42161.70101.67201.64011.55961.4888
Table 2. Contribution of influencing factors to the change of carbon emissions in each stage.
Influencing FactorsThe Change Rate of Carbon EmissionHousehold SizePer Capita IncomeEnergy Consumption Per Unit Area of BuildingsCarbon Emission FactorsHouse Price to Income RatioHome Purchase Index
2010–201311.23%6%36.36%2.23%5%28.70%−55.06%
2013–20165.88%12%33.96%−1.23%6.70%10.27%−44.90%
2016–20206.53%−1.22%33.39%2.74%−4.31%20.41%−44.48%
Table 3. The setting of model parameters for carbon emissions from residential buildings in Henan Province under static scenarios.
ParametersLow Carbon ScenarioBaseline ScenarioHigh Carbon ScenarioReferences
Year203020502030205020302050
Population(×104 people)11,53011,12011,53011,12011,53011,120[37,38,39,40]
Urbanization rate (%)67.47870807283[41,42]
Carbon emission factor of urban residential buildings1.80231.75461.82311.78521.83251.8014[43]
Carbon emission factor of rural residential buildings1.38421.36211.40251.3841.41241.4016[44]
Energy consumption per unit area of urban residential buildings (kgce/m2)11.06259.513710.28798.84779.56778.4053[44]
Energy consumption per unit area of rural residential buildings (kgce/m2)9.14497.86658.50487.31587.90956.95[44]
Urban residential building floor area per capita (m2/person)45.2646.4247.5849.1748.5850.2[44,45]
Rural residential building floor area per capita (m2/person)56.259.3459.2762.3560.5263.66[45]
Table 4. Random parameter settings for each variable of the dynamic scenario analysis model.
VariablesUnitDistribution Pattern of Random Parameters
Population×104 peopleN (0, 0.005)
Urbanization rate%N (0, 0.02)
Comprehensive carbon emission factors of urban residential buildingstCO2/tceN (0, 0.01)
Comprehensive carbon emission factors of rural residential buildingstCO2/tceN (0, 0.01)
Energy consumption per unit area of urban residential buildingskgce/m2N (0, 0.02)
Energy consumption per unit area of rural residential buildingskgce/m2N (0, 0.02)
Urban residential building floor area per capitam2/personN (0, 0.03)
Rural residential building floor area per capitam2/personN (0, 0.03)
Disclaimer/Publisher’s Note: The statements, opinions and data contained in all publications are solely those of the individual author(s) and contributor(s) and not of MDPI and/or the editor(s). MDPI and/or the editor(s) disclaim responsibility for any injury to people or property resulting from any ideas, methods, instructions or products referred to in the content.

