1. Introduction
Current global efforts have not made adequate progress on women’s financial inclusion (FI), especially digital FI. Women are less likely than men to hold accounts, avail credit, or access insurance facilities owing to barriers to accessing services from formal financial intermediaries (Demirguc-Kunt et al., 2015, 2018) [
1,
2] and lack of identification documents, mobile phones, digital skills, financial capability, and appropriate financial products (GPFI, 2020) [
3]. Therefore, women are more vulnerable than men and face numerous hurdles in access to essential resources such as education, healthcare, and tangible assets (Kabeer, 2009) [
4]. As a result, economic development is not as robust and inclusive (Corrado and Corrado, 2017; Dabla-Norris et al., 2015) [
5,
6] as desired for the sustainable development of a society. Such exclusion in turn reduces their empowerment, freedom, and decision-making power in the household and society (Corrado and Corrado, 2017) [
5]. Under the sustainable development goals (SDG), gender empowerment is considered a necessary means to achieve gender equality (SDG 5). Therefore, universal financial inclusion is important for realizing inclusive economic growth and welfare (Johnston and Murdoch, 2008) [
7].
Financial inclusion is a multi-stage process and its levels can be defined as having a bank account, regular use of the account, ease in making payments, and affordability of financial service access (Demirguc-Kunt et al., 2015) [
2]. In the modern era, financial services are increasingly reliant on digital infrastructure, and digitization of these services through computer programs and other technology, known as fintech, has made them more accessible to a much wider range of communities and groups than ever before. In the context of empowering women financially, leveraging digital infrastructure is of paramount importance. Women often have limited mobility owing to societal and familial constraints, and fintech services can provide them greater control over their financial resources. Improving access to credit through digital services can also allow women to become entrepreneurs and economically empowered to start and run businesses, which in turn can aid in their development and overall empowerment.
Sustainable development depends on gender equality and sustainable development goal 5 specifically emphasizes that. The issue of closing the economic gender gap goes beyond simple social justice. It propels advancement as well. A recent Gallup-International Labour Organisation (ILO) study found that if the economic gender gap were to narrow by 25%, the world GDP might rise by
$5.3 trillion by 2025. To reduce the economic gender gap and promote sustainable development, specific actions must be taken to improve women’s financial inclusion and empowerment (Tellez, 2018) [
8]. Quantifying the gender gap between men and women in several spheres has been attempted through the use of certain indices, viz., the Gender Development Index (GDI) (United Nations Development Programme, 2018) [
9], Gender Inequality Index (GII), and the Gender Empowerment Measure (GEM) (Government of India, 2009) [
10]. The Gender Development Index, computed by the United Nations Development Program, captures gaps in human development between men and women in health, knowledge and living standards. It is the ratio of the HDI of women to the HDI of men, computed separately for a country. The UNDP also computed the Gender Inequality Index and measures gender inequalities in reproductive health, empowerment, and economic status. The higher the GII, the greater the inequality.
These indices are well-known and accepted measurements of gender inequality. However, the link between these indices and gender-based financial inclusion indices is not adequately captured in the extant literature. Even though one can expect a relationship between these two sets of measures on average, a cross-country study will reveal the differences in the achievement of digital financial inclusion for otherwise similarly developed nations in terms of gender. As, in the modern era, financial services are increasingly reliant on digital infrastructure, such an exercise is expected to provide policy suggestions for different countries.
From the existing literature one finds that starting from Sarma (2008) [
11], a few recent studies such as Fanta and Makina (2019) [
12], Van et al., (2021) [
13], Nagpal et al., (2020) [
14], and Tram et al., (2021) [
15] have measured financial inclusion for various countries in the world. However, a limited number of studies (Asongu and Odhiambo, 2018; Morsy, 2020; Delechat et al., 2018) [
16,
17,
18] have attempted to measure gender-based financial inclusion at the cross-country level.
The core research agenda of the paper is to construct an index of gender-based FI (G
FII) (comprised of 2 components: conventional financial service usage index (
CFI) and digital financial service usage index (
DFI)), examine their link to GDI and the GII (though based on simple correlations, not a causality exercise), and then identify the drivers of financial inclusion (i.e., G
FII) in particular focusing on the digital aspect. We calculate indices for different countries for 2011, 2014, 2017, and 2021 using the Global Findex database (see Demirgüç-Kunt et al., 2018) [
1]. It helps us to investigate the performance of different countries over the years in ensuring the financial inclusion of women and how digital services are penetrating over the years. To construct the gender-based financial inclusion indices the paper considers a number of indicators that reflect usage of financial services. We construct the indices for men and women separately and using the standard method adopted for the gender development index of UNDP, a ratio of the two is arrived at for different countries. Finally, the paper investigates the drivers of gender-based financial inclusion focusing in particular on the digital index.
For a theoretical underpinning, this paper considers the technology acceptance model (TAM) (Davis, 1989) [
19], which highlights two important factors that induce one to use technology such as digital technology. These two factors are the perceived ease of use and perceived usefulness of adopting technology. Ease of use of a digital financial service depends on infrastructure such as bank branches, ATMs, etc. On the other hand, the perceived usefulness depends on the level of education, regular earnings of women through labour market participation, and so on. Various extensions of the TAM model have been formulated in the literature which suggest that the above two factors are influenced by other external factors too (Venkatesh and Morris 2000 [
20]; Saravanabhavan and Rajeev 2023) [
21]. Some of these external factors one can consider are women’s life expectancy at birth, mean years of schooling, per capita income, the share of seats in parliament, and labour force participation rate.
The theoretical relation between FI and other related macro variables such as GDP and inequality has been studied by Banerjee and Newman (1993) [
22] and Ghatak and Jiang (2002) [
23]. However, there are no gender-specific theoretical studies on financial inclusion.
We use advanced econometric techniques such as the instrumental variable regression model for this task. Finally, relevant policy suggestions are put forth for the improvement of fintech-based financial inclusion for women in different countries around the world.
To construct the G
FII we use the Principal Component Analysis (PCA) in which weights are endogenous estimates through specific model assumptions (Elsherif, 2019; Sha’ban et al., 2020; Tram et al., 2021) [
15,
24,
25]. This is better than the approach, where the weights assigned to each dimension are selected in an ad hoc manner (e.g., Sethi and Sethy, 2019; Huang and Zhang, 2020) [
26,
27]. Therefore, the use of the PCA method provides more robust results.
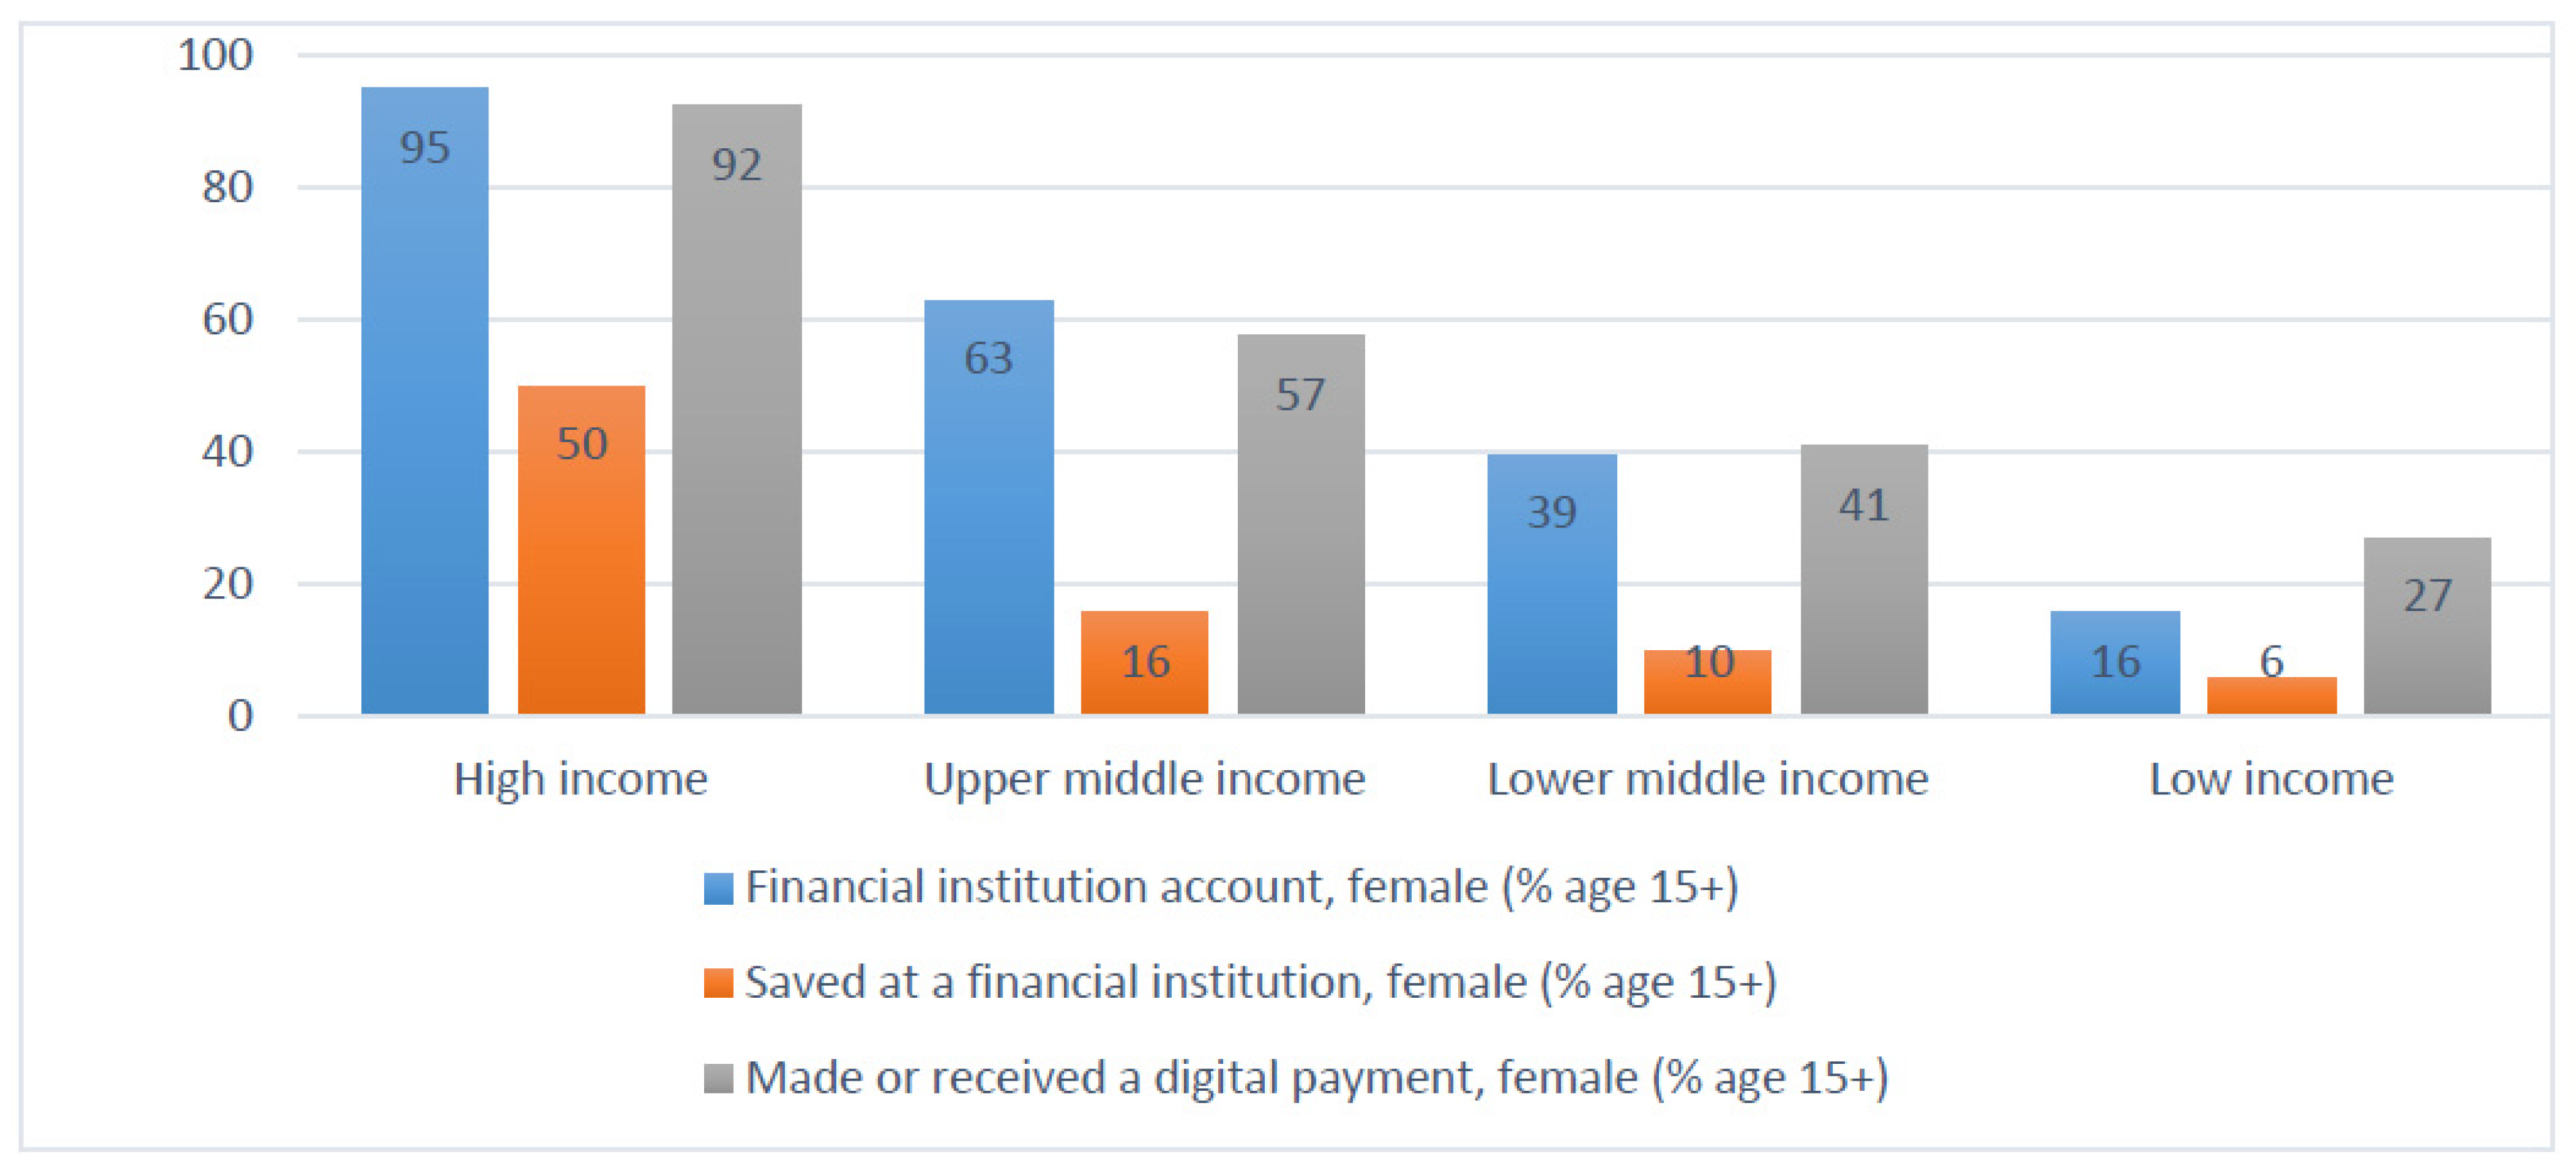
Before constructing the indices, we first look at the levels of financial service usage by women using the Global Findex database (Demirgüç-Kunt et al., 2018) [
1]. Our analysis showed that female participation in the financial system varies with the income level of a country. For instance, 92% of women made or received digital payments in high-income countries, while it was only about 27% in low-income countries (
Figure 1) in 2021. However, one phenomenon amongst the lower middle- and low-income countries is worth noting. In both these categories, the percentage of women having a bank account in a formal bank is lower than the percentage of women using digital platforms for financial transactions. This shows that in low-income countries, the digital channels of financial transactions have relatively greater importance than conventional modes. This may be due to a lack of adequate brick and mortar infrastructure or a higher level of societal restrictions faced by women. However, within the low-income nations too, there are significant variations. For example, among these countries, the percentage of women that had saved at a financial institution was about 11% in Mali, whereas it was as low as 0.13% in Afghanistan in the same period. Therefore, given the varied experiences of countries, the measurement of the gender-based financial inclusion index across nations is a worthwhile exercise.
It is also vital to know whether countries are improving in position in terms of the adoption of technologies for financial access, or not, along with their overall development process.
Our work can be applied to ascertain country-level GFII as well as digital financial inclusion of the female population (DFIF), to understand a country’s positions in different years. Different countries can focus on the important determinants considered in this study for improving their rank concerning GFII and in particular DFIF. Finally, our study could be used to derive policies for empowering women through financial inclusion through digital platforms for inclusive development.
The structure of the paper is as follows: the next section provides an overview of the literature on financial inclusion and the construction of indices to measure it. We examine studies that have looked at disparities in financial access between men and women. It is found that most studies do not use or construct any comprehensive measure (index). We bridge this research gap in
Section 3 by creating appropriate indices using the World Bank data.
Section 4 uses the index of gender-based financial inclusion to build an econometric model to assess the impact of country-level factors on women’s financial inclusion, focusing on questions such as whether lower national gender development leads to lower financial inclusion and if so, which components are influential. Finally, conclusions and policy implications are made in
Section 5.
3. Measurement of GFII and DFIF
3.1. Data Sources and Research Models
3.1.1. Data
We use the Global Findex Database to measure the overall financial inclusion index for women for the years 2011, 2014, 2017, and 2021. Based on gender-wise availability of data, we consider eight indicators for the measurement of G
FII (see
Figure 2). Though to arrive at a comprehensive set of indices for gender-based financial inclusion we intended to consider all countries across the globe we observe that the data are available for only 109 countries. This compelled us to confine ourselves to 109 countries for our study. The construction of a gender-based FI index focusing on digital technology for all countries of the world helps us to compare and contrast countries with different levels of gender development with their digital financial inclusiveness.
3.1.2. Approach towards Constructing GFII and DFIF
In the literature, one observes that the FI index is often constructed using the indicators of financial infrastructure, such as the number of bank branches. However, when we consider the financial inclusion of vulnerable sections such as women, having infrastructure does not necessarily imply that women access financial services through the present infrastructure. Keeping this important aspect in mind, we have considered only those indicators for constructing indices that reveal the actual usage of financial services.
Therefore, we have constructed two indices: digital access and conventional method-based access through, say, brick-and-mortar branches of banks. These two indices viz.,
DFI and
CFI, are indeed usage-based indices. We combine these indices to arrive at the overall FI index (
FII). These indices are constructed for males and females separately as in the case of UNDP’s gender development index, and then based on them, we arrived at the G
FII.
Figure 2 presents the methodological flowchart.
As mentioned, we consider the PCA method for the measurement of FI. Based on the PCA, we calculate the appropriate weights and postulate that the latent variable is linearly determined as follows:
where
is the Overall Financial Inclusion Index for country
i;
and
are the relative weights of the two sub-indices;
is the variation due to error.
DFI and
CFI are computed as follows:
Indicators used to compute these two sub-indices are presented in
Table 1. These indicators are chosen based on a review of the literature and the availability of gender-specific data from FINDEX. For example, in the literature, Morsy (2020) [
17] considered variables such as respondents with an account at a financial institution, using their accounts at a formal financial institution for business purposes, credit card ownership, and debit card ownership to measure financial inclusion.
It is important to note that we calculate the
FII for males and females separately by considering the indicators for males and females as shown in
Table 1, and arriving at
DFI and
CFI indices gender-wise.
3.2. PCA Methodology
Principal component analysis (PCA) as a pattern recognition technique helps us to identify and determine which parameter among variables is more crucial than others. Instead of being subjective in our weight selection, PCA enables us to justifiably weigh the variables based on their variability.
The FII is computed by estimating a two-stage PCA:
- -
The first stage of PCA: Estimation of the two sub-indices: DFI and CFI and the parameters (α and β) in the system of Equations (2) and (3). We estimate them using the principal components as linear functions of the independent variables. These two sub-indices are computed for males and females separately.
- -
The second stage of PCA: By considering the same procedure as in the first stage, we estimate the weights of the two sub-indices and combine them we arrive at the FII index for males and females separately.
To present the computation procedure of G
FII we now introduce the notations
and
that represent overall
FII for male and female, respectively, for country
i.
Based on data availability, we have calculated for the years 2011, 2014, 2017 and 2021, separately.
3.3. Estimated FII Index for Women
Table 2 presents the descriptive statistics of the indicators used to measure the
FII for the year 2021. Descriptive statistics for the other three years, i.e., 2011, 2014, and 2017 are not presented here due to space constraints.
To ensure that the scale on which the indicators are measured is consistent, we normalize the indicators for each index before applying the PCA factoring by using the following formula;
Data after normalization takes values from 0 to 1, where 0 indicates the lowest level of financial inclusion, and 1 indicates the highest level.
3.3.1. First-Stage PCA Results
Before performing PCA analysis, we evaluated and ensured the validity of the data. Validity refers to the closeness of the measured values. We measure the validity using the Kaiser-Meyer-Olkin (KMO) index and Bartlett’s test of sphericity. We used STATA version 14 (Stata Corp, College Station, TX, USA) to perform the KMO test and Bartlett’s test of sphericity and, in both cases, found that PCA is appropriate for the analysis. The relevant statistics can be found in
Appendix A Table A2.
To find the weights to estimate Equations (2) and (3), we have estimated eigenvalues displayed in
Table 3 using the PCA technique. Based on Kaiser (1960) [
58], we consider eigenvalues greater than 1 for the principal components analysis.
Table 3 shows the eigenvalues of the principal components for both sub-indices for males and females separately for 2021. Except for the first principal component (comp1 of both sub-indices), none has an eigenvalue greater than 1. Therefore, the first components are considered for analysis. The weights obtained from the PCA analysis are assigned to the first principal component of each sub-index. The estimations are consistent for the years 2011, 2014 and 2017 (see
Appendix A Table A3,
Table A4 and
Table A5).
Table 4 displays the weights obtained from the information in the principal components and the corresponding eigenvalues. For the
DFI sub-index, X1 (owns a credit card) and X2 (owns a debit card) have higher weights than other indicators for males and females. On the other hand, for the
CFI sub-index, X7 (saved at a financial institution) has higher weights than X6 (financial institution account) and X8 (borrowed from a formal financial institution) though the difference is minimal. Similarly, we present results for 2011, 2014, and 2017 in
Appendix A Table A6,
Table A7 and
Table A8).
Table 4 also shows that only X4 (mobile money account) is largely unexplained, as for about 55 countries out of 109 countries, this data is not available.
3.3.2. Second Stage PCA Results
In the second stage, by carrying out the same procedure as in the first stage, we apply the PCA method to the two sub-indices (
DFI and
CFI) to calculate their weights in the overall
FII.
Table 3 shows the results of principal components estimates for
FII. The results show that only the first component has an eigenvalue greater than 1 for males and females. Therefore, only the first component is considered for analysis. The KMO results in
Appendix A Table A2 show that PCA analysis is relatively suitable. Similar to the method in the first stage, we also calculated weights for both dimensions, which are presented in
Table 4. Considering values of weights, we find that two sub-indices are equally important for explaining the level of financial inclusion. Similarly, we estimate the overall
FII for males and females separately for 2011, 2014, 2017, and 2021 for different countries in the world. Finally, following the estimation procedure explained in Equation 4, we calculate the G
FII.
3.4. Ranking of Countries Based on Different Indices
Considering DFIF, we observe that Canada, Hong Kong SAR, the United States, Israel, New Zealand, Republic of Korea, Austria, Japan, the United Kingdom, and Finland assume the top 10 positions. On the other hand, Afghanistan, Pakistan, Iraq, Sierra Leone, Guinea, Lebanon, Tanzania, Benin, Burkina Faso, and Zimbabwe are in the bottom ten positions. We also found that countries like Thailand, Sri Lanka, India, South Africa, and Malaysia rank better in CFI but lower in DFI for women.
Appendix A Table A9 presents the rank of the countries according to the estimated values of G
FII for women. Rank 1 indicates that the country is the best in terms of financial inclusion for women, and subsequently, larger ranks indicate a lower level of financial inclusion for women. The
Table A9 shows that in 2021, the top 10 countries with the highest financial inclusion for women (as per G
FII index) in the sample are Canada, Hong Kong, the United States, Australia, New Zealand, Israel, the United Kingdom, Germany, Ireland, and Japan. It is important to note that these are all high-income countries. The ten countries with the lowest financial inclusions for females in the sample are Ecuador, Afghanistan, Pakistan, Iraq, Lebanon, Guinea, Tanzania, Leone, Sierra, Gabon, and Benin. Interestingly, some of the countries that belong to the high or upper-middle-income group but still have relatively lower G
FII include Ecuador, Iraq, the United Arab Emirates, Greece, and Saudi Arabia.
Subsequent computation of Spearman’s rank correlation to understand the association over the years reveals that the coefficient between the ranking of countries in 2011 and 2014 is 0.9427, which is statistically significant at a 1% level. The rank correlation between 2014 and 2017 is 0.9446, which is also statistically significant at the 1% level. The rank correlation between 2017 and 2021 is 0.9436 at a 1% level of significance. This indicates that the rankings of countries do not vary much over the years.
To understand the changes in ranking in different years with regard to the use of financial technology, we calculate the differences in the ranking of countries from 2011 to 2021. Positive differences indicate that the country has improved in terms of higher financial inclusion for females from 2017 to 2021, while negative differences indicate worsened conditions. Among the 39 high-income countries, Italy, Uruguay, Chile, Hong Kong, Japan, Israel, Spain Germany, the United States, and Poland have the highest positive differences between rankings. On the other hand, Saudi Arabia, Sweden, Slovenia, Netherlands, Croatia, the United Arab Emirates, Lithuania, Denmark, Belgium, and Malta show the highest negative differences. Among 8 low-income countries, Mali, Uganda, and Togo show the highest positive differences, whereas Malawi, Sierra Leone, Burkina Faso, and Afghanistan confirm the highest negative differences. Among 31 lower-middle-income countries, Tajikistan, India, Senegal, and Ukraine show the highest improvement, whereas Zimbabwe, Tanzania, Zambia, and the Philippines experience the lowest improvement. Among 31 upper-middle-income countries, Bosnia and Herzegovina, Kazakhstan, Venezuela, Moldova, Russian Federation, China, and Bulgaria show the best enhancement. Costa Rica, Ecuador, Kosovo, Mauritius, and the Dominican Republic experienced the lowest enhancement in female financial inclusion.
Finally, among 109 countries, Bosnia and Herzegovina, Italy, Kazakhstan, Venezuela, Mali, Tajikistan, Uruguay, and India show the highest improvement. In contrast, Costa Rica, Ecuador, Zimbabwe, Tanzania, Saudi Arabia, and Malawi show the lowest improvement in financial inclusion for females. On the other hand, Australia, Canada, Portugal, Brazil, and Malaysia do not show any ranking change from 2014 to 2021.
The construction of DFIF and GFII and the ranking of countries provides useful insights into gender deprivation in terms of financial access. It is interesting to examine whether a lack of gender development in terms of education, income, or ability to participate in socio-political programmes contributes towards such exclusion. It led us to scrutinize how our GFII is related to the already established gender development index (GDI) and gender inequality index (GII) of the respective countries.
3.5. Region-Wise Analysis of DFIF and GFII
After country-wise ranking, we assess the region-wise changing pattern of
DFIF and G
FII from 2017 to 2021. A simple average is computed by using the respective indices of countries of a region to arrive at the corresponding region-specific index (
Table 5).
Table 5 shows that the most developed regions including Europe, North America, and Oceania performed well in
DFIF and G
FII. On the other hand, Africa, Central America, and South America performed the worst in both indices. Interestingly Asia performs better than these regions including the Middle East. Some regions improved their scores between 2017 and 2021 (namely, Africa, Asia, and South America) in
DFIF over G
FII. On the other hand, Central America and the Middle East regressed (in ranking) between the same periods and hence need special attention from policymakers.
Looking in particular at the Asian region, it is clear that East Asia (including Japan, China, and South Korea) is the best performing, while West Asia (including Afghanistan, Iran, and Iraq, among others) is the worst as of the 2021 data in
Table 6. In terms of the overall index (G
FII) improvements, were observed in East Asia and South Asia while the other regions fared worse in 2021 than in 2017. Digital indices, however, show improvements in many of the sub-regions of Asia.
3.6. Relationship between DFIF and GFII
After observing different trends between DFIF and GFII over the years it is of interest to examine whether there is any correlation between DFIF and GFII. As DFIF is used to construct GFII it may not be appropriate to compute a usual correlation coefficient between these two measures. As we have used the PCA method for index creation and the principal components as such are less interpretable, we use the actual data on digital FI to ascertain its increasing role in the financial inclusion of women.
We consider that it may be more apt to calculate the rank correlation between countries for different years based on these two indices. Our computation reveals that the rank correlation between the two indices is as high as 0.95 (or 0.98 or 0.99 or 0.99) for 2011 (or 2014 or 2017 or 2021). These rank correlation coefficients over the years have also been statistically significant at a 1% level. This indicates that if the rank of a country based on DFIF is higher the same country also ranks high in terms of GFII. This concludes that a gender-based digital financial index is important in improving the overall financial inclusion for women.
Moreover,
Figure 3 demonstrates that the various components of
DFIF are on the rise. Women’s ownership of credit cards, for instance, increased from 17.5% in 2011 to 20.9% in 2021. During the same period, the number of women who “made or received a digital payment” climbed by roughly 17%. A 25% increase in the percentage of women who “borrowed any money from a formal financial institution or through a mobile money account” is also estimated for 2021. Female account ownership of mobile money increased from 2.6% in 2014 to 11% in 2021. The rising trend shows that female financial inclusion digitally is rising gradually, and this has a big impact on financial inclusion for women as a whole.
3.7. DFIF and GFII Indices Related to GDI or GII?
Figure 4 depicts the association between the Gender Inequality Index (GII, higher figures imply greater inequality) and the estimated G
FII Index. A negative relationship between the two indices reveals that higher gender inequality is associated with greater financial exclusion for women. The correlation coefficient between these indicators is −0.85, and it is statistically significant (at a 1% level). However, from the developing countries’ perspective, China and the Russian Federation show a much better position than Brazil and India. Therefore, the correlation seems to vary among and within the different groups of countries separated by income. On the other hand, higher gender inequality correlated with the greater exclusion of the digital financial inclusion index too.
Furthermore, as expected, a positive relationship is revealed between the GDI and estimated G
FII in
Figure 5. It implies that higher achievement in the basic dimensions of human development for women promotes higher financial inclusions for them. The graph shows that both G
FII and
DFIF almost coincide. If we compare similar graphs for the year 2017 (graphs not shown due to space constraints) another interesting feature can be noted. Namely, the differences between the two curves based on G
FII and
DFIF have reduced in 2021 compared to 2017 (against both GDI and GII). This quantitatively establishes that over time usage of digital financial services is dominating for countries across the globe. The correlation coefficient between these two indicators is 0.53, which is statistically significant at a 1% level. The results show that the GII components (comprising reproductive health, political, and labour market participation and a higher level of education) have more compatible relations than the GDI components (comprising longevity of life, basic education, and income per capita) with the financial inclusion of women. We observe in
Figure 5 that similar levels of GDI values in countries are associated with significantly different levels of financial inclusion for women. It indicates that women’s empowerment in terms of political and labour market participation and higher education levels make a significant difference in achieving women’s financial inclusion. On the other hand, a higher GDI indicates a higher inclusion in
DFIF.
As a next step, we move to a more disaggregated analysis to see whether all components of gender development play a significant role in enhancing FI. Secondly, we ask whether infrastructure is an important variable to determine GFII. To investigate this, we employ a panel data regression model to understand the impact of different country-level development factors on women’s financial inclusion.
5. Conclusions and Policy Implications
This paper measures financial inclusion for women at the cross-country level for 2011, 2014, 2017, and 2021 by using the World Bank’s Global Findex database. A gender-based FI measure (GFII) based on the digital financial service usage Index (DFI) and conventional financial service usage Index (CFI) has been constructed for this purpose by employing principal component analysis. Eight indicators were identified to be incorporated, namely, credit card ownership, debit card ownership, owning a mobile money account, borrowing any money from a formal financial institution or using a mobile money account, making or receiving a digital payment, owning a financial institution account, saving at a financial institution, and borrowing from a formal financial institution. To check the strength of our calculated index, we estimated the correlation between GFII and the existing measures of gender development or deprivation: GDI and GII, and the constructed indices were found to be adequately correlated. Our analysis further reveals the names of countries that are progressing, and the countries that are regressing in financial inclusion. Finally, the determinants of GFII have been identified using a static panel data model.
Thus, the contribution of the paper is manyfold. It fills a gap in the literature by constructing a comprehensive gender-based FI index focusing in particular on digital access, for all countries across the globe for which data are available. The paper uses a data-driven rigorous method of selecting weights to arrive at the index. This helps us to compare different nations and identify the lagging regions. Interestingly we find that not all economically developed nations are performing well in terms of FI of the women population. Some countries with better gender development are also seen to lag in terms of providing access to finance for the women population. More importantly, the paper identifies the factors that can help improve FI for women thereby deriving policy implications. These findings are delineated in this section.
The estimated values of GFII show that developed countries such as Canada, Hong Kong, the United States, Australia, New Zealand, Israel, the United Kingdom, and Germany are ranked high in terms of the inclusion of women in the financial system in 2021. On the contrary, developing countries such as Ecuador, Afghanistan, Pakistan, Iraq, Lebanon, Guinea, and Tanzania are ranked very low. Among the high-income countries, Italy, Uruguay, Chile, Hong Kong, and Japan show higher progress in financial inclusion of women. In contrast, Saudi Arabia, Sweden, Slovenia, Netherlands, Croatia, and the United Arab Emirates show slow progress from 2011 to 2021. During the same period, Bosnia and Herzegovina, Italy, Kazakhstan, Venezuela, Mali, Tajikistan, Uruguay, and India showed the most remarkable improvement among all countries included in the analysis. Costa Rica, Ecuador, Zimbabwe, Tanzania, and Saudi Arabia show the lowest achievement in a similar comparison.
A strong negative correlation was observed between GFII and GII (−0.85), which shows that higher gender inequality is associated with lower financial inclusion for women. Similarly, the observed positive association between GFII and GDI indicates that higher realization in the basic dimensions of human development for females shows an association with higher financial inclusion for women.
Significantly, the results show that the GII components have more compatible relations than the GDI components with women’s financial inclusion. We observe that similar levels of GDI values for countries are associated with significantly different levels of financial inclusion for women. It indicates that women’s empowerment in terms of political and labour market participation and higher education levels make a significant difference in achieving women’s financial inclusion.
Among the countries that are better placed in terms of gender inequality (GII ≤ 0.1), it can be observed that there is considerable variation in achievements in the digital sphere of financial inclusion. While Canada (DFIF = 4.22), Japan (DFIF = 3.22), and New Zealand (DFIF = 3.21) had very high levels of digital financial inclusion among women, others such as Portugal (DFIF = 1.12), Croatia (DFIF = 1.07) and The United Arab Emirates (DFIF = 0.55) still have a lot of ground to cover in improving the reach of digital financial services. Although these countries have made strides in removing inequality for women in certain areas, it is clear that they need to focus on also empowering women through digital financial inclusion. On the other hand, countries that have high levels of gender inequality (GII ≥ 0.5) all have similarly low levels of digital financial inclusion for women. Typically, the digital financial inclusion index for these countries ranges between −1 and −2. Significant variations in digital FI for women can, however, also be observed among middle-performing countries. For example, Thailand and Ecuador have similar GII values (0.333 and 0.362), but Thailand’s DFIF is 0.32 while Ecuador falls far behind with a DFIF of −2.27. Perhaps when improving the status of women in the path of development, policymakers in different countries pay markedly different levels of attention to the role of digital financial services, even though this is a powerful tool to empower women and improve their economic participation and conditions. There exists the potential for countries at similar stages of development to learn from each other in this regard.
Finally, the estimated Feasible Generalized Least Squares (FGLS) and IV-2SLS panel data models indicate that female life expectancy at birth, mean years of schooling for females, gross national income per capita for females, the share of seats in parliament for females, female labour force participation rate, number of commercial bank branches per 100,000 adults, and number of ATMs per 100,000 adults are important factors for improvement in female financial inclusion.
As far as policies are concerned, we suggest that low and lower-middle-income countries must take prioritised measures to make their financial system more inclusive for women. Programmes should be put in place to enhance the financial literacy of women for the usage of the internet, credit cards, mobile phones for digital payment, and internet-based access to financial institutions. Recent data shows that 48 percent of women are using the internet globally, compared to 58 percent of men. This scenario is markedly different for developed countries as compared to developing countries.
Interestingly, some countries that belong to the high or upper-middle-income group but still have relatively lower GFII include Saudi Arabia, the United Arab Emirates, Lithuania, Denmark, Costa Rica, Ecuador, Kosovo, Mauritius, and the Dominican Republic. Given that GII is closely related to women’s financial inclusion, it is necessary to pay attention to women’s higher level of education and political and labour market participation in these countries.
Our study suggests that India is one of the countries progressing towards a higher level of financial inclusion for women. The Pradhan Mantri Jan Dhan Yojana is a massive financial inclusion programme in India that was introduced by the government on 15 August 2014. Under this scheme, 15 million bank accounts were opened on the inauguration day. Such a dedicated programme is undoubtedly responsible for India’s success in ensuring higher financial inclusion for women. It can be a lesson for other developing countries such as Zimbabwe, Tanzania, Zambia, and the Philippines that are not progressing well, to ensure better financial inclusion for women. Our study identifies countries that need attention in this respect by highlighting their past and current position in terms of GFII. We also found that countries like Thailand, Sri Lanka, India, South Africa, and Malaysia rank better in CFI but lower in DFI for females. Given the mobility restrictions women face, these countries may pay attention to the digital financial inclusion of women which is at par with their performance in conventional mode-based inclusion.
Now, the world is moving towards the dominance of digital technologies in financial services. Especially, after the COVID-19 pandemic, a large increase in digital payments spurred financial inclusion. It is evidenced that the use of conventional financial factors is now suppressed by the use of digital financial factors. For example, the use of a ‘female financial institution account’ increased by about 5% from 2017 to 2021. At the same time, the indicator ‘borrowed any money from a formal financial institution or using a mobile money account for females’ increased by about 25% compared to 29% for males during the same period. This expansion opened up new economic opportunities, reduced the gender disparity in account ownership, and strengthened household resilience to better handle financial shocks. Therefore, to boost the financial inclusion of women, greater efforts should be aimed at enhancing access to digital financial services, digital education, and so on.
Though this study is at a macro level we also note that within a country there can be differences in the use of digital financial services across different income groups. For example, Findex data for 2021 for India reveals that while only 3.61 percent of people belonging to the lowest quantile have access to mobile money this percentage is as high as 30 percent for the richest quantile. Thus, there is a need to pay special attention to intra-country disparity and the bottom layer of society. The poorer section without access to the formal sector may depend on the informal money lenders who provide them with finances. Though such facilities from the informal sector may help the poor to get funds, they often come at unfavourable terms and conditions making their situation worse. As the poor are often unable to access the formal banking sector due to a lack of finances, many countries have provided the opportunity to open zero-balance accounts. Many African countries have also provided the opportunity to access digital platforms for financial services through small traders who deal with smaller amounts of money. Such initiatives help people with a low resource base to access formal financial services.
Finally, our analysis suggests that to enhance financial inclusion for women, a holistic gender development approach that includes higher educational attainment, per capita income, labour force participation, and political participation is essential. The better financial infrastructure in terms of a higher number of bank branches and more importantly better availability of ATMs further aids women to accessing financial services. These initiatives will help to achieve sustainable development of a country.
Our result on fintech is similar to the findings of several other studies. For instance, Yeyouomo et al. (2023) [
63] find that fintechs mitigate the gender gap in access to and usage of financial services, which narrows the financial inclusion gender gap. Saima et al. (2022) [
67] argued that there is no moderating effect of gender on the effects of perceived usability, perceived trustworthiness, and loyalty satisfaction while examining the role of gender diversity in fintech. On the other hand, Alkhwaldi et al. (2022) [
68] made the case that legislators and providers of fintech services need to grasp the extremely low rate of fintech usage that is now in place.
Finally, several other indicators also may impact women’s financial inclusion some of which we have not considered due to lack of data. For example, the biggest obstacle to account ownership for both men and women is a lack of available funds which may get captured through income inequality between men and women. Though we have considered gender-wise (aggregate) per capita income, income inequality data based on gender is not found across countries. Similarly, governance-related variables including corruption may also influence financial inclusion which this study has not taken due to a lack of gender-specific data and also due to the multicollinearity problem. The latter may arise as these governance deficiencies will impact women’s education, income, etc. which are already considered in the paper. Future studies can take some of these aspects to look at financial exclusion for women.
A recent study finds that the quality of governance is crucial in eliminating the trade-off and enhancing the interaction between financial inclusion (FI) and financial stability (FS) (Saha and Dutta, 2022) [
69]. Ji (2020) [
70] found that both across states of the U.S. and across international borders, higher degrees of religiosity are inversely correlated with the use and adoption of formal financial services. Once gender-specific data are available on these variables, such as the quality of governance, quality of democracy, and religious beliefs the empirical results can be updated and form the future research topic.


