Assessment of Land Cover Changes and Climate Variability Effects on Catchment Hydrology Using a Physically Distributed Model
Abstract
:1. Introduction
2. Materials and Methods
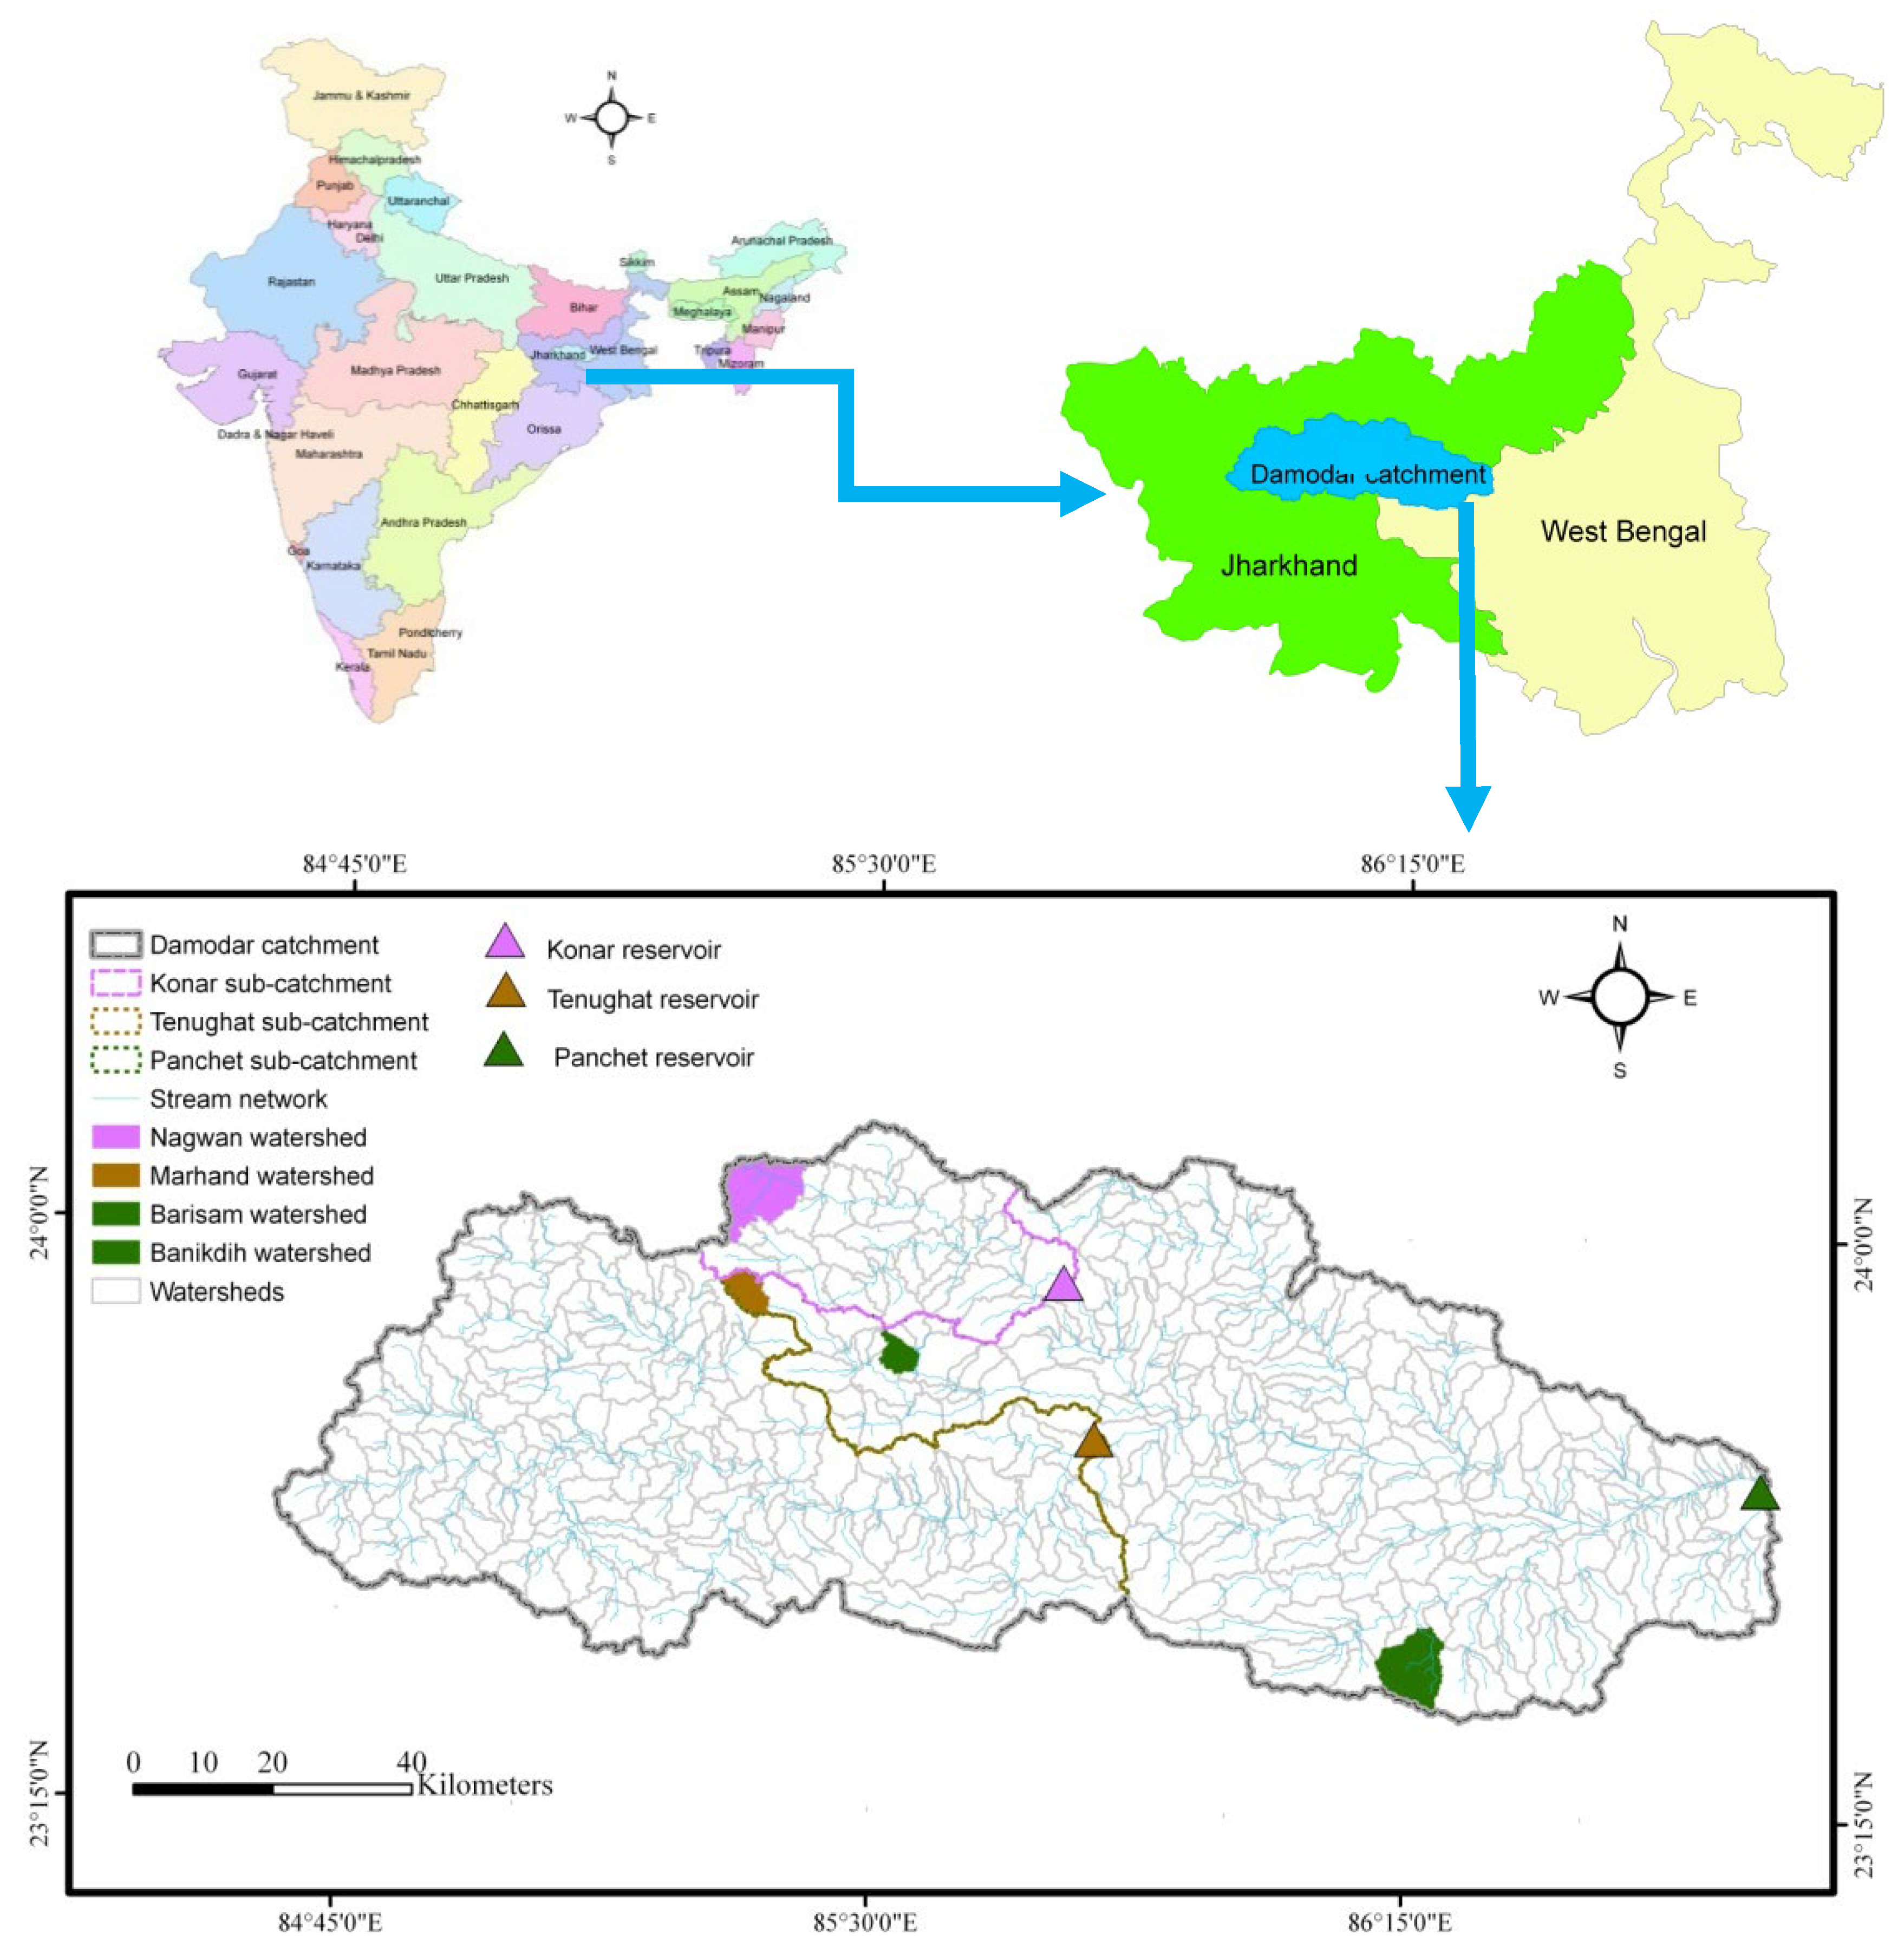
2.1. Study Area: Damodar Catchment
2.2. Data Sets and Sources
2.3. Distributed Hydrologic Modeling: SWAT Model
2.4. Model Calibration, Up-Scaling of Calibrated Parameter and Validation
2.5. Trend Analysis of Historical Meteorology Data
2.6. Impact of LULC Change and Climate Variability on Damodar Catchment
3. Results and Discussion
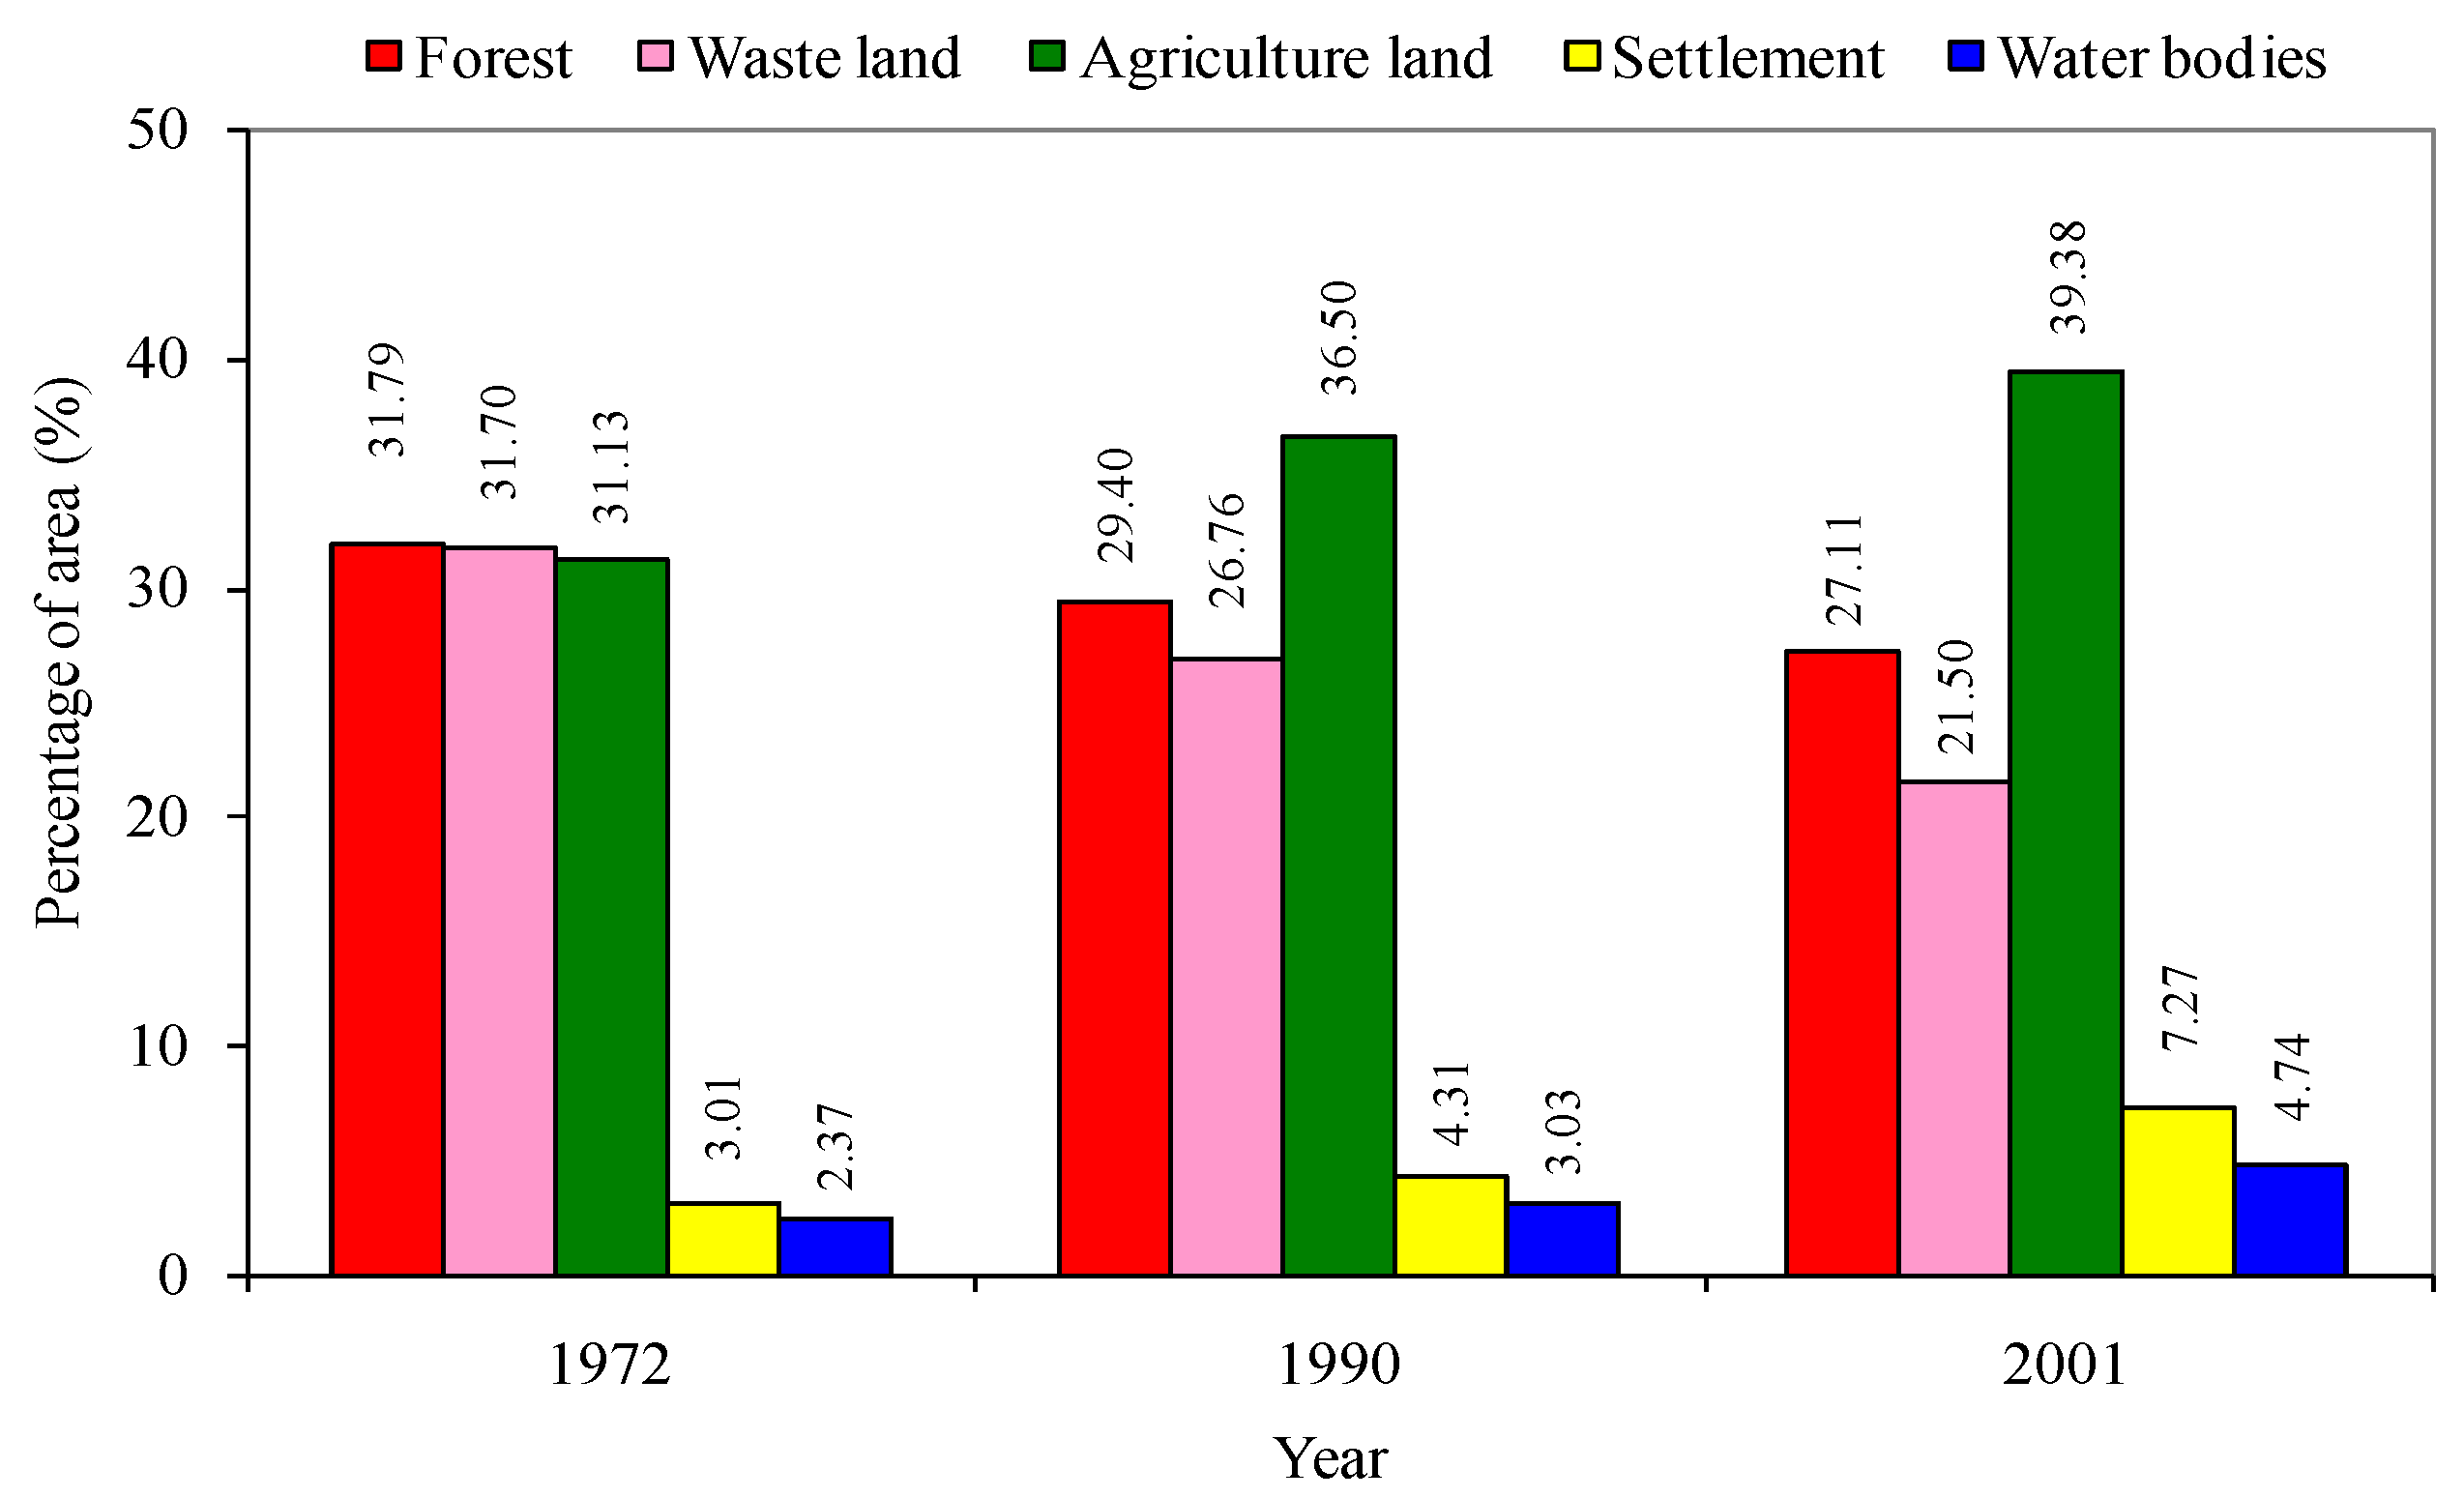
3.1. Land Use/Land Cover Classification
3.2. Calibration and Validation of SWAT Model
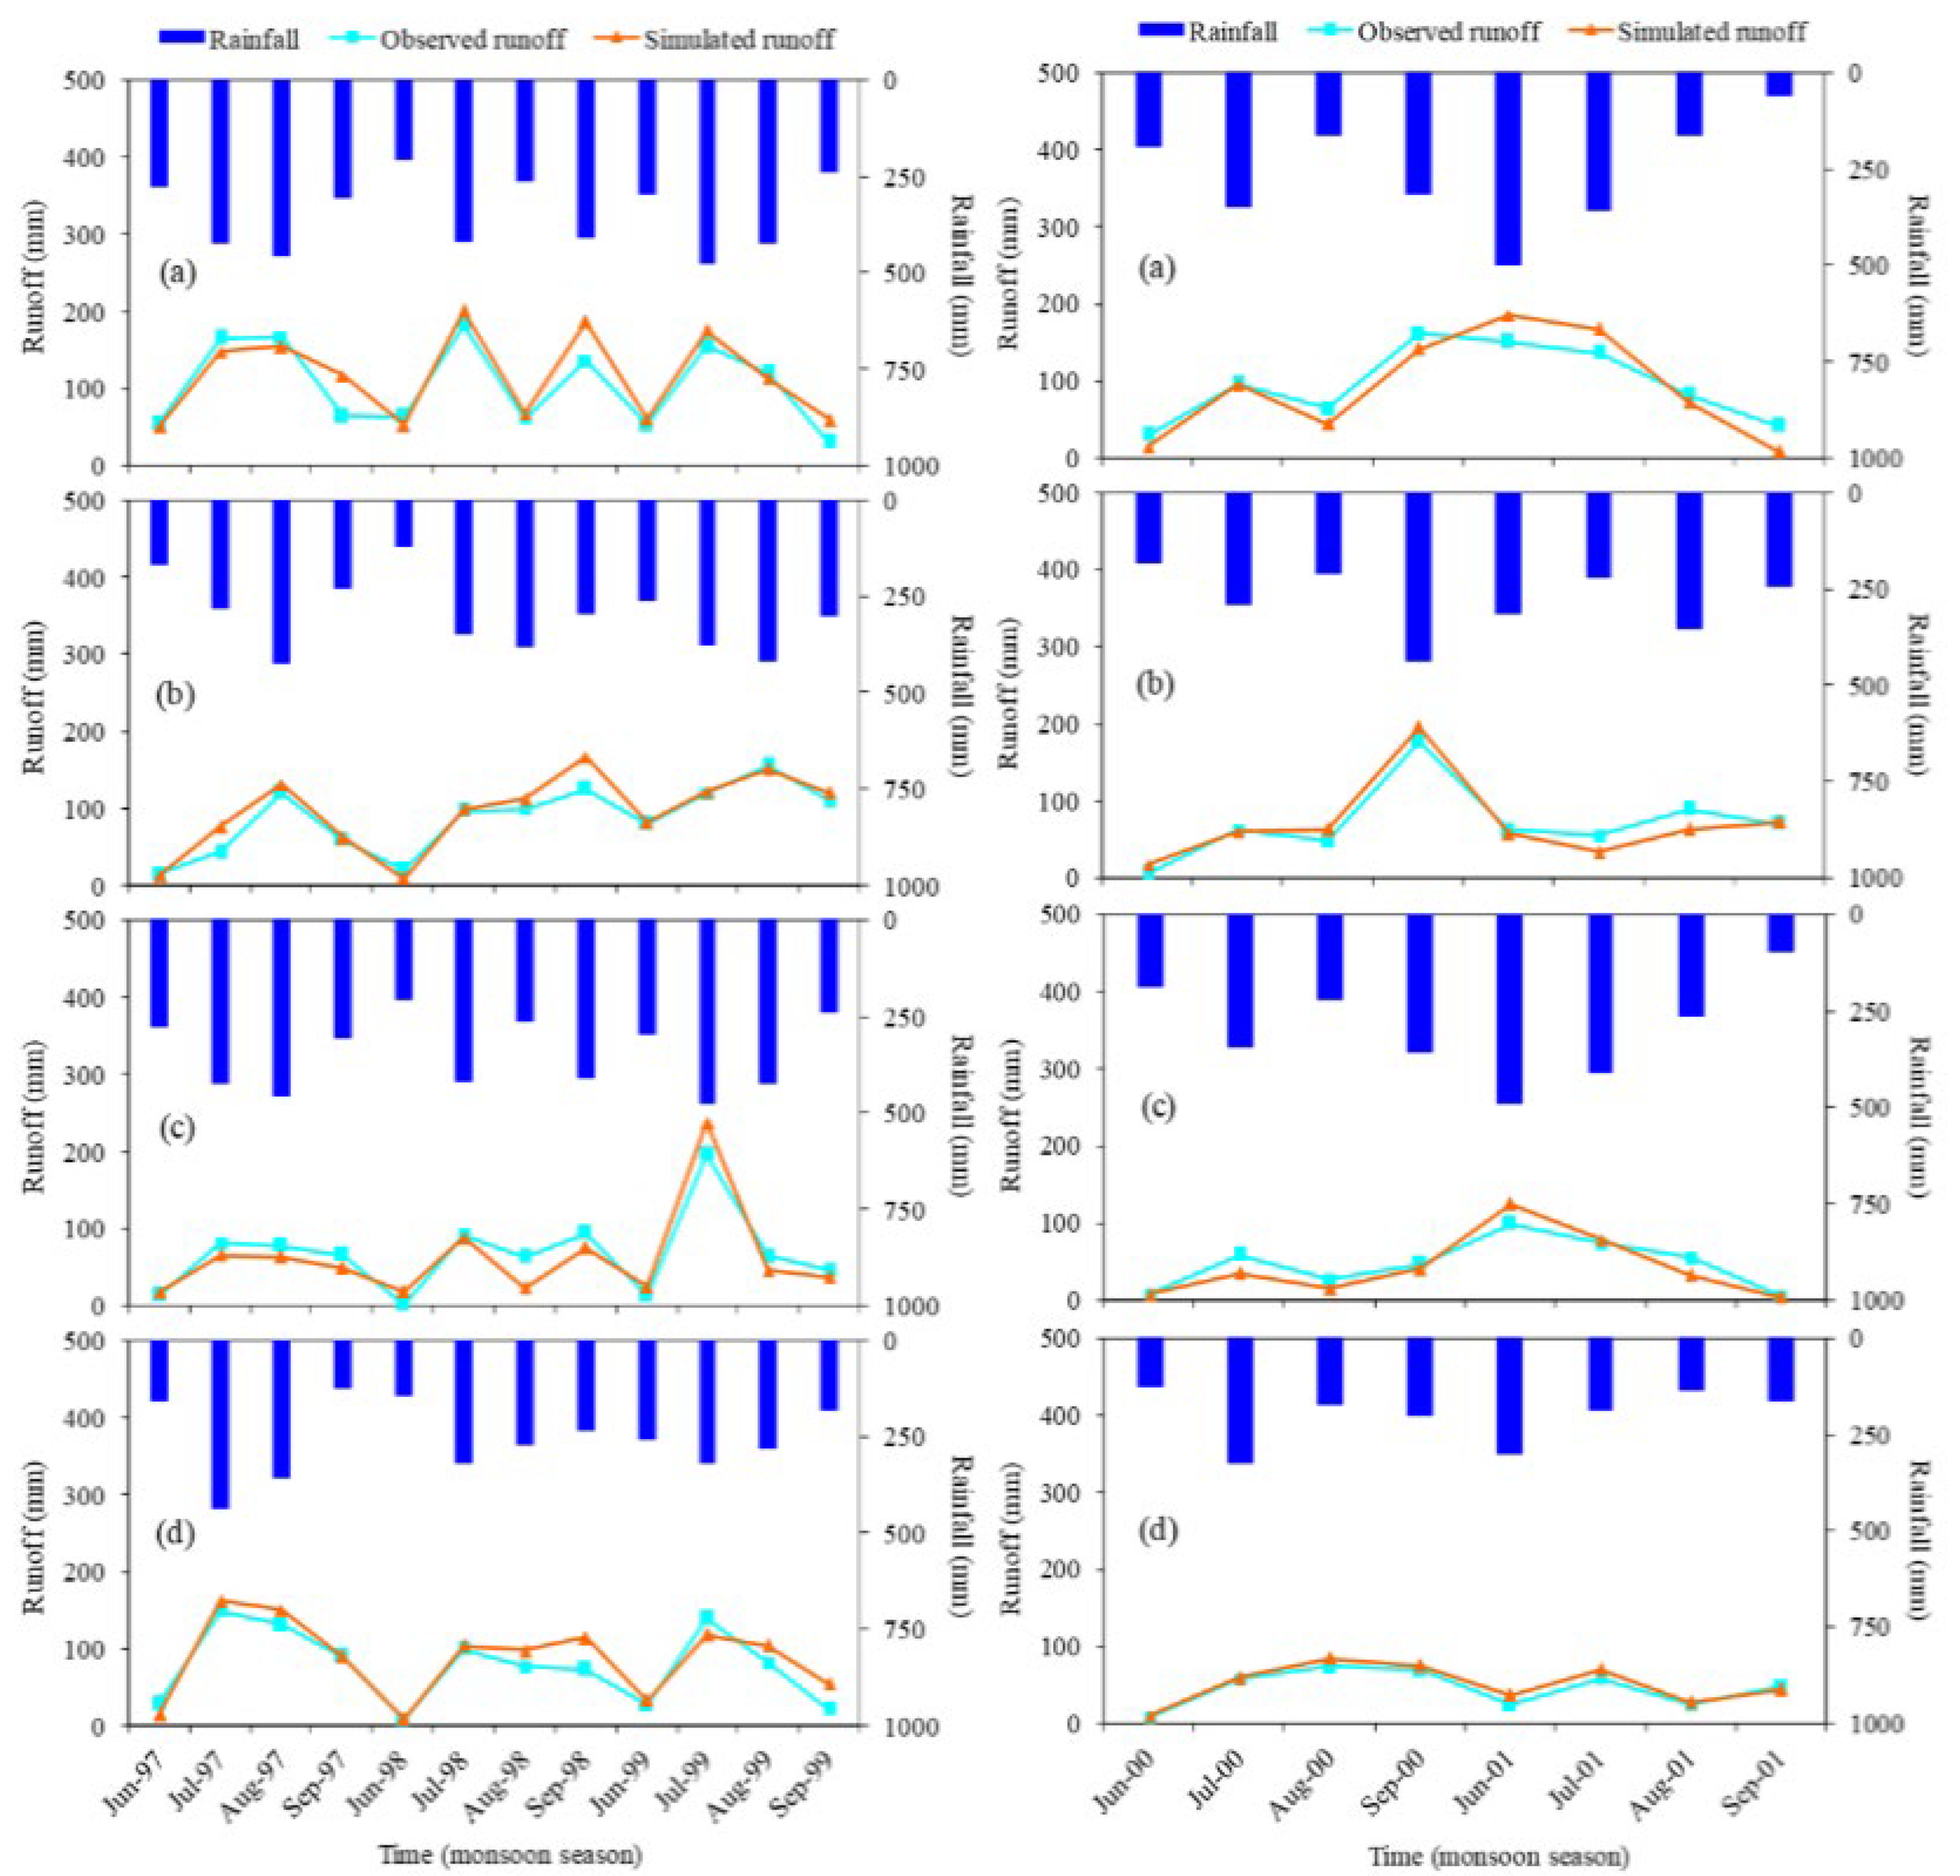
3.3. Runoff: Calibration and Validation
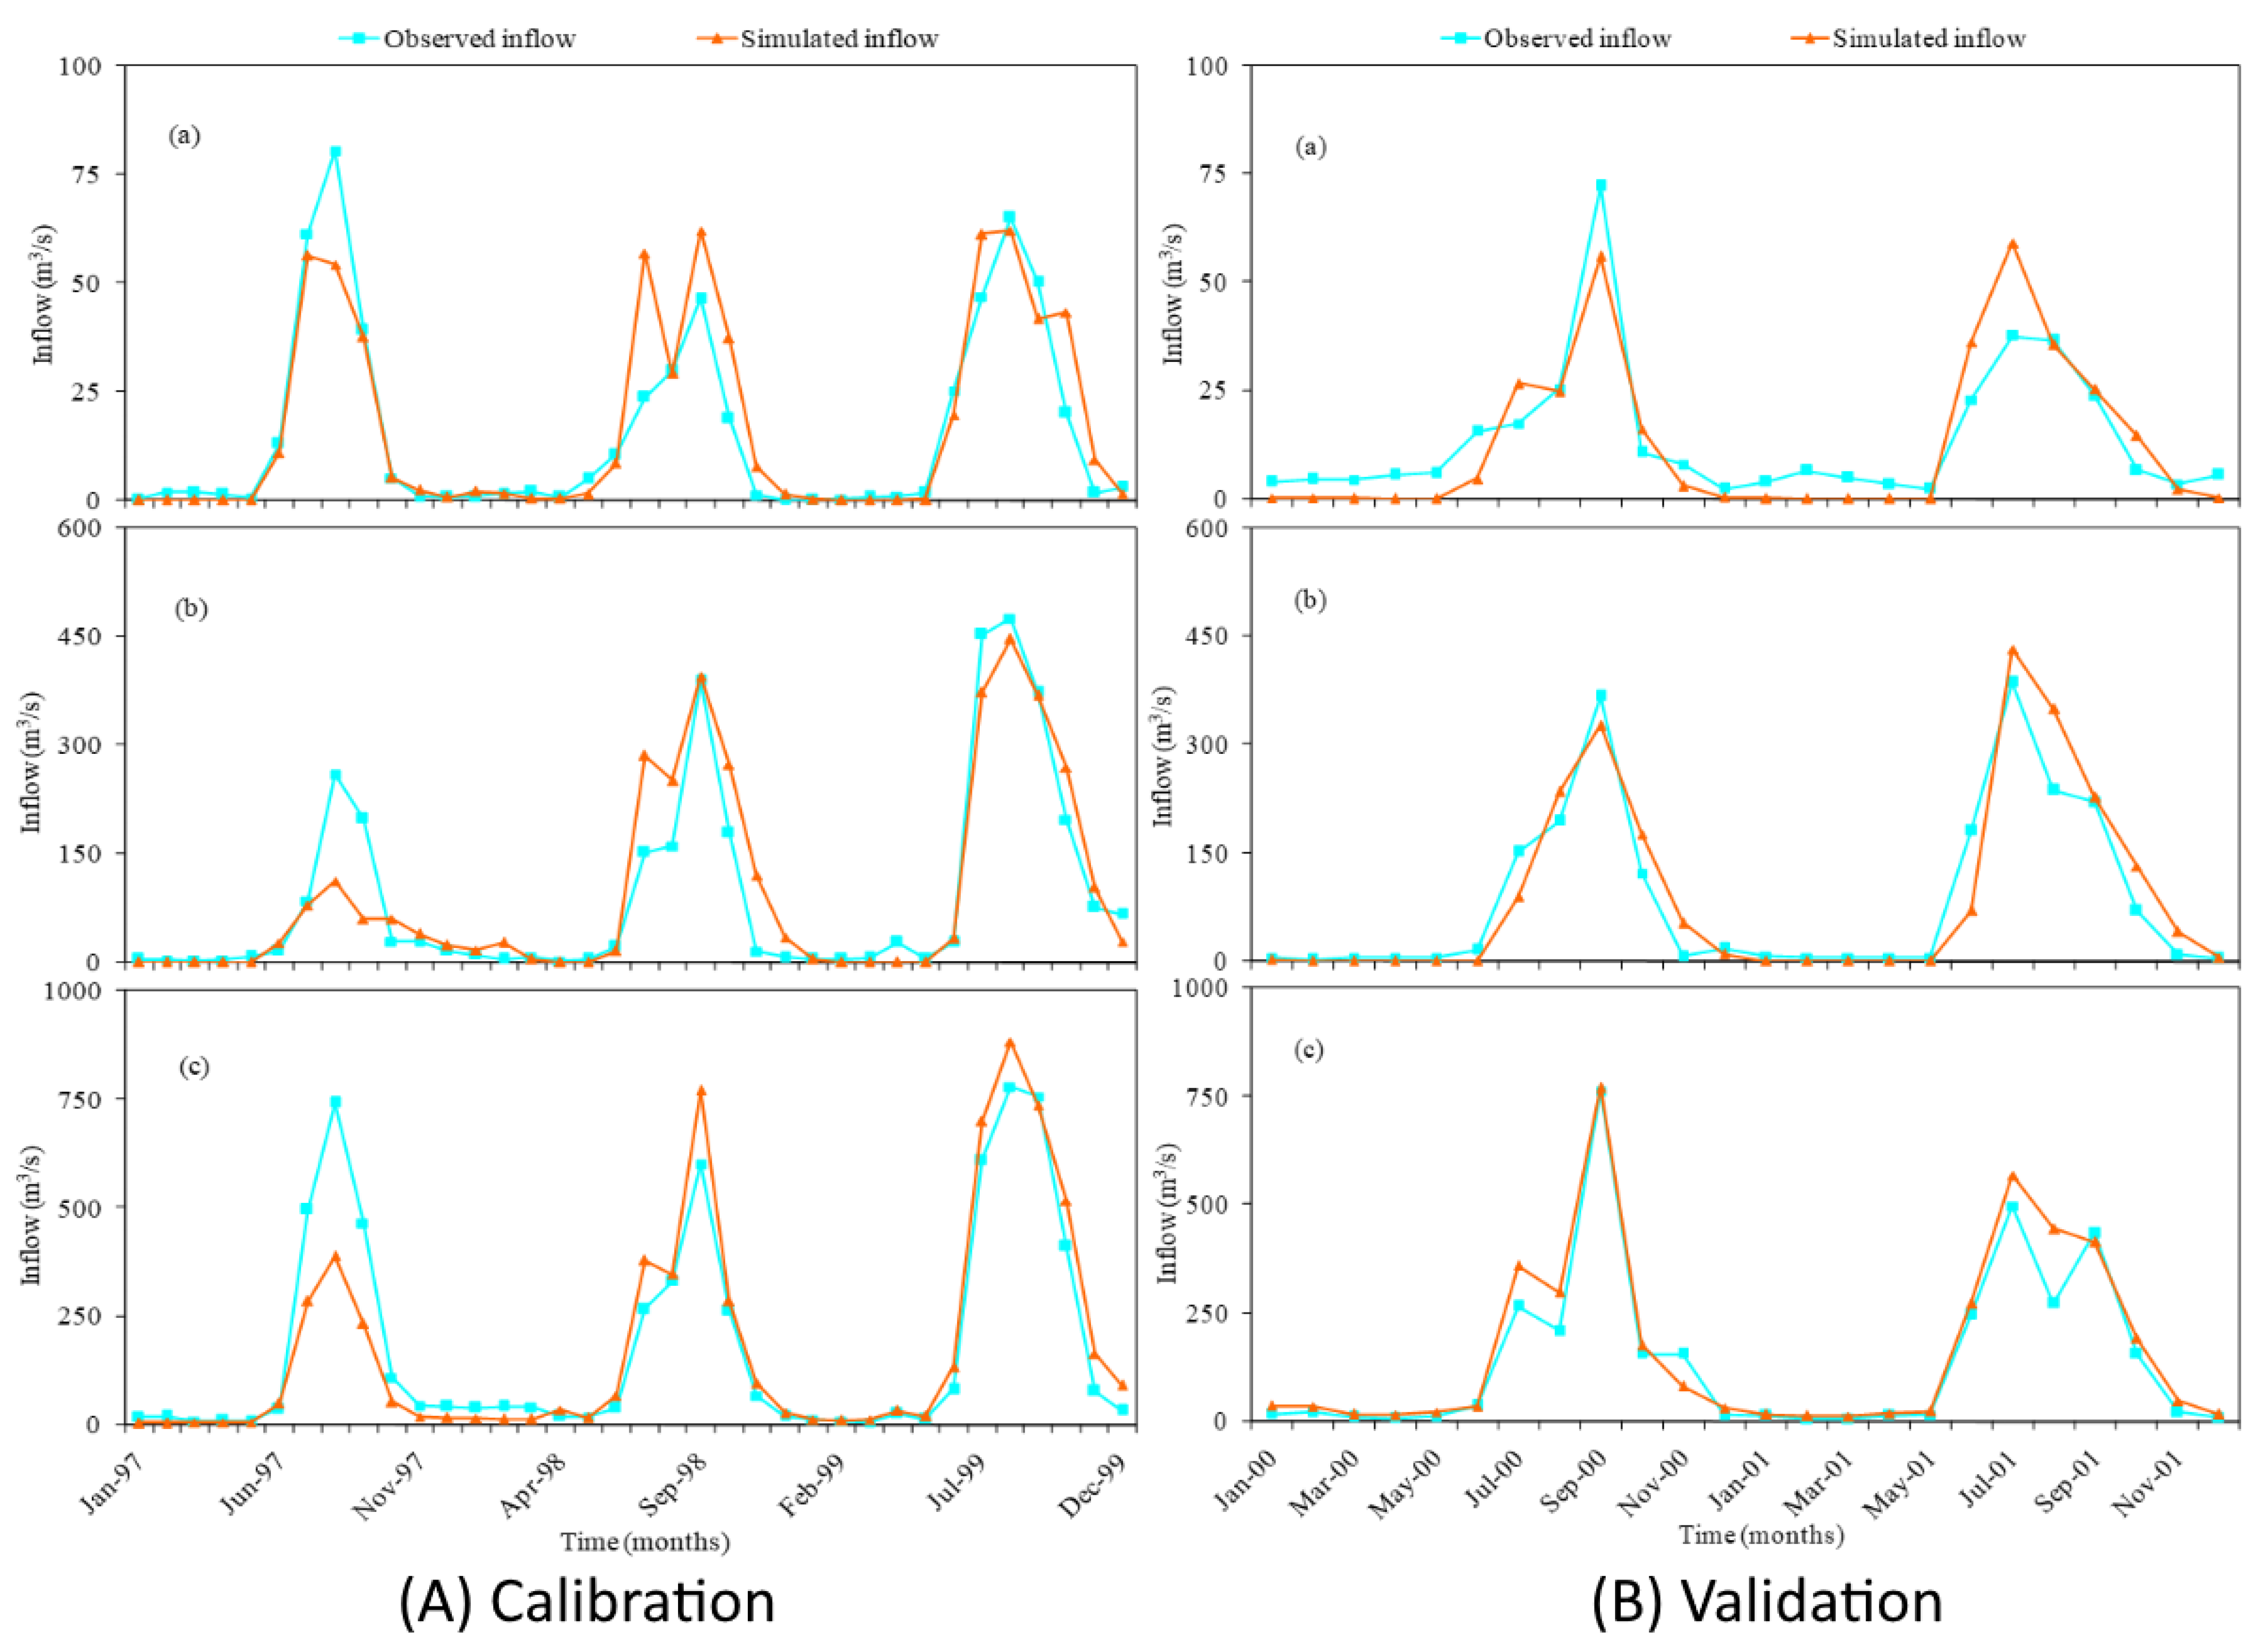
3.4. Reservoir Inflow: Calibration and Validation
3.5. Climate Variability: Trend Analysis of Temporal Variability
3.6. Historical Changes in Water Availability: Reservoir Inflow
4. Conclusions
Author Contributions
Funding
Institutional Review Board Statement
Informed Consent Statement
Data Availability Statement
Acknowledgments
Conflicts of Interest
References
- Tang, Z.; Engel, B.A.; Pijanowski, B.C.; Lim, K.J. Forecasting land use change and its environmental impact at a watershed scale. J. Environ. Manag. 2005, 76, 35–45. [Google Scholar] [CrossRef] [PubMed]
- Kumar, S.; Mishra, A. Specific Erosion Area Identification using HRU Approach for Effective Sedimentation Control in a River Basin. Water Resour. Manag. 2015, 29, 1749–1756. [Google Scholar] [CrossRef]
- Kumar, P.S.; Praveen, T.V.; Prasad, M.A.; Rao, P.S. Identification of Critical Erosion Prone Areas and Computation of Sediment Yield Using Remote Sensing and GIS: A Case Study on Sarada River Basin. J. Inst. Eng. Ser. A 2018, 99, 719–728. [Google Scholar] [CrossRef]
- Yadav, A.; Penke, S. Multi-objective genetic algorithm optimization of artificial neural network for estimating suspended sediment yield in Mahanadi River basin, India. Int. J. River Basin Manag. 2020, 18, 1–21. [Google Scholar] [CrossRef]
- Im, S.; Kim, H.; Kim, C. Assessing the impacts of land use changes on watershed hydrology using MIKE SHE. Environ. Geol. 2009, 57, 231–239. [Google Scholar] [CrossRef]
- Yang, M.; Xu, J.; Yin, D.; He, S.; Zhu, S.; Li, S. Modified Multi–Source Water Supply Module of the SWAT–WARM Model to Simulate Water Resource Responses under Strong Human Activities in the Tang–Bai River Basin. Sustainability 2022, 14, 15016. [Google Scholar] [CrossRef]
- Githui, F.; Mutu, F.; Bauwens, W. Estimating the impacts of land-cover change on runoff using the soil and water assessment tool (SWAT): Case study of Nzoia catchment, Kenya. Hydrol. Sci. J. 2009, 54, 899–908. [Google Scholar] [CrossRef]
- Kashaigili, J.J. Impacts of land-use and land-cover changes on flow regimes of the Usangu wetland and the Great Ruaha River, Tanzania. Phys. Chem. Earth 2008, 33, 640–647. [Google Scholar] [CrossRef]
- Wan, R.; Yang, G. Influence of land/cover change on storm runoff-A case study of Xitiaoxi River Basin in upstream of Taihu Lake Watershed. Chin. Geogr. Sci. 2007, 17, 349–356. [Google Scholar] [CrossRef]
- Teixeira, A.M.; Soares-Filho, B.S.; Freitas, S.R.; Metzger, J.P. Modeling landscape dynamics in an Atlantic Rainforest region. Implic. Conserv. For. Ecol. Manag. 2009, 257, 1219–1230. [Google Scholar] [CrossRef]
- Mango, L.M.; Melesse, A.M.; McClain, M.E.; Gann, D.; Setegn, S.G. Land use and climate change impacts on the hydrology of the upper Mara River Basin, Kenya: Results of a modeling study to support better resource management. Hydrol. Earth Syst. Sci. 2011, 15, 2245–2258. [Google Scholar] [CrossRef] [Green Version]
- Bishop, P.L.; Hively, W.D.; Stedinger, J.R.; Rafferty, M.R.; Lojpersberger, J.L.; Bloomfield, J. A multivariate analysis of paired watershed data to evaluate agricultural best management practice effects on stream water phosphorus. J. Environ. Qual. 2005, 34, 1087–1101. [Google Scholar] [CrossRef]
- Ghaffari, G.; Keesstra, S.; Ghodousi, J.; Ahmadi, H. SWAT-simulated hydrological impact of land-use change in the Zanjanrood Basin, Northwest Iran. Hydrol. Process. 2010, 24, 892–903. [Google Scholar] [CrossRef]
- Fenicia, F.; Savenije, H.H.G.; Avdeeva, Y. Anomaly in the rainfall-runoff behavior of the Meuse catchment. Climate, land use, or land use management. Hydrol. Earth Syst. Sci. Discuss. 2008, 5, 1787–1819. [Google Scholar]
- Agarwal, S.; Patil, J.P.; Goyal, V.C.; Singh, A. Assessment of Water Supply–Demand Using Water Evaluation and Planning (WEAP) Model for Ur River Watershed, Madhya Pradesh, India. J. Inst. Eng. Ser. A 2019, 100, 21–32. [Google Scholar] [CrossRef]
- Bathurst, J.C.; Ewen, J.; Parkin, G.; O’Connell, P.E.; Cooper, J.D. Validation of catchment models for predicting land-use and climate change impacts, Blind validation for internal and outlet responses. J. Hydrol. 2004, 287, 74–94. [Google Scholar] [CrossRef]
- Li, K.Y.; Coe, M.T.; Ramankutty, N. Investigation of hydrological variability in West Africa using land surface models. J. Clim. 2005, 18, 3173–3188. [Google Scholar] [CrossRef]
- Reshma, T.; Reddy, K.V.P.D.; Agilan, V. Parameters Optimization using Fuzzy Rule Based Multi-Objective Genetic Algorithm for an Event Based Rainfall-Runoff Model. Water Resour. Manag. 2018, 32, 1501–1516. [Google Scholar] [CrossRef]
- Patil, N.S.; Nataraja, M. Effect of land use land cover changes on runoff using hydrological model: A case study in Hiranyakeshi watershed. Model. Earth Syst. Environ. 2020, 6, 2345–2357. [Google Scholar] [CrossRef]
- Twine, T.E.; Kucharik, C.J.; Foley, J.A. Effects of land cover change on the energy and water balance of the Mississippi River basin. J. Hydrometeorol. 2004, 5, 640–655. [Google Scholar] [CrossRef]
- Yuan, F.; Sawaya, K.E.; Loeffelholz, B.C.; Bauer, M.E. Land cover classification and change analysis of the Twin Cities (Minnesota) Metropolitan Area by multitemporal Landsat remote sensing. Remote Sens. Environ. 2005, 98, 317–328. [Google Scholar] [CrossRef]
- Munoth, P.; Goyal, R. Hydromorphological analysis of Upper Tapi River Sub-basin, India, using QSWAT model. Model. Earth Syst. Environ. 2020, 6, 2111–2127. [Google Scholar] [CrossRef]
- Kepner, W.G.; Semmens, D.J.; Bassett, S.D.; Mouat, D.A.; Goodrich, D.C. Scenario analysis for the San Pedro River, analyzing hydrological consequences of a future environment. Environ. Monit. Assess. 2004, 94, 115–127. [Google Scholar] [CrossRef]
- Ma, X.; Xu, J.; Luo, Y.; Aggarwal, S.P.; Li, J. Response of hydrological processes to land-cover and climate changes in Kejie watershed, south-west China. Hydrol. Process. 2009, 23, 1179–1191. [Google Scholar] [CrossRef]
- Zhang, Y.; Arthington, A.H.; Bunn, S.E.; Mackay, S.; Xia, J.; Kennard, M. Classification of Flow Regimes for Environmental Flow Assessment in Regulated Rivers: The Huai River Basin, China. River Res. Appl. 2011, 28, 989–1005. [Google Scholar] [CrossRef]
- Ahiablame, L.; Sheshukov, A.Y.; Mosase, E.; Hong, J. Modelling the impacts of grassland to cropland conversion on river flow regimes in Skunk Creek watershed, Upper Midwest United States. River Resear. Appl. 2019, 35, 1454–1465. [Google Scholar] [CrossRef]
- Palamuleni, L.G.; Ndomba, P.M.; Annegarn, H.J. Evaluating land cover change and its impact on hydrological regime in Upper Shire River catchment, Malawi. Reg. Environ. Chang. 2011, 11, 845–855. [Google Scholar] [CrossRef]
- Nie, W.; Yuan, Y.; Kepner, W.; Nash, M.S.; Jackson, M.; Erickson, C. Assessing impacts of Landuse and Landcover changes on hydrology for the upper San Pedro watershed. J. Hydrol. 2011, 407, 105–114. [Google Scholar] [CrossRef]
- Yan, B.; Fang, N.F.; Zhang, P.C.; Shi, Z.H. Impacts of land use change on watershed streamflow and sediment yield: An assessment using hydrologic modelling and partial least squares regression. J. Hydrol. 2013, 484, 26–37. [Google Scholar] [CrossRef]
- Narsimlu, B.; Gosain, A.K.; Chahar, B.R. Assessment of Future Climate Change Impacts on Water Resources of Upper Sind River Basin, India Using SWAT Model. Water Resour. Manag. 2013, 27, 3647–3662. [Google Scholar] [CrossRef]
- Qi, S.; Bao, W.; Shi, P.; Yu, Z.; Li, P.; Zhang, B.; Jing, P. Evaluation of runoff responses to land use changes and land cover changes in the upper Huaihe river basin, China. J. Hydrol. Eng. 2012, 17, 800–806. [Google Scholar]
- Arnold, J.G.; Srinivasan, R.; Muttiah, R.S.; Williams, J.R. Large area hydrologic modeling and assessment, part I: Model development. JAWRA 1998, 34, 73–89. [Google Scholar] [CrossRef]
- Neitsch, S.L.; Arnold, J.G.; Kiniry, J.R.; Williams, J.R. Soil and Water Assessment Tool Theoretical Documentation; Texas Water Resources Institute: College Station, TX, USA, 2005. [Google Scholar]
- ASCE. Criteria for evaluation of watershed models. J. Irrig. Drain. Eng. 1993, 119, 429–442. [Google Scholar]
- Fu, G.; Charles, S.P.; Yu, J.; Liu, C. Decadal climatic variability, trends and future scenarios for the North China Plain. J. Clim. 2009, 22, 2111–2123. [Google Scholar] [CrossRef]
- Moriasi, D.N.; Arnold, J.G.; Van Liew, M.W.; Bingner, R.L.; Harmel, R.D.; Veith, T.L. Model evaluation guidelines for systematic quantification of accuracy in watershed simulation. Trans. ASABE 2007, 50, 885–900. [Google Scholar] [CrossRef]


| Model Parameter | Prescribed Range | Barisam | Banikdih | Mahrand | Nagwan | |
|---|---|---|---|---|---|---|
| Minimum | Maximum | |||||
| OV_N | 0.01 | 30 | 0.15 | 0.07 | 0.20 | 0.10 |
| CH_N1 | 0.01 | 30 | 0.15 | 0.21 | 0.18 | 0.09 |
| CH_K1 | 0 | 300 | 2.15 | 6.70 | 2.50 | 2.00 |
| CH_N2 | 0.01 | 0.3 | 0.15 | 0.19 | 0.01 | 0.04 |
| CH_K2 | 0 | 300 | 1.00 | 1.00 | 1.00 | 3.00 |
| SURLAG | 0 | 10 | 1.00 | 1.00 | 1.00 | 1.00 |
| CN2 | 35 | 98 | 49–79 | 73–81 | 48–67 | 49–67 |
| ALPHA_BF | 0 | 1 | 0.5 | 0.5 | 0.5 | 0.5 |
| CH_EROD | 0 | 1 | 0.5 | 0.5 | 0.5 | 0.5 |
| CH_COV | 0 | 1 | 0.5 | 0.5 | 0.5 | 0.5 |
| SPCON | 0 | 0.01 | 0.009 | 0.009 | 0.009 | 0.009 |
| SPEXP | 1 | 2 | 1.13 | 1.13 | 1.13 | 1.13 |
| USLE_P | 0 | 1 | 0.8 | 0.6 | 0.8 | 0.6 |
| ALPHA_GW | 0 | 1 | 0.3 | 0.3 | 0.3 | 0.3 |
| EPCO | 0 | 1 | 0.6 | 0.6 | 0.6 | 0.6 |
| ESCO | 0 | 1 | 0.5 | 0.5 | 0.5 | 0.5 |
| Statistical Parameters | Barisam | Banikdih | Mahrand | Nagwan | Konar | Tenughat | Panchet | |||||||
|---|---|---|---|---|---|---|---|---|---|---|---|---|---|---|
| Cali. | Vali. | Cali. | Vali. | Cali. | Vali. | Cali. | Vali. | Cali. | Vali. | Cali. | Vali. | Cali. | Vali. | |
| R2 | 0.83 | 0.93 | 0.91 | 0.91 | 0.89 | 0.87 | 0.87 | 0.95 | 0.82 | 0.81 | 0.85 | 0.89 | 0.86 | 0.96 |
| NSE | 0.77 | 0.76 | 0.84 | 0.88 | 0.82 | 0.74 | 0.80 | 0.87 | 0.80 | 0.76 | 0.84 | 0.87 | 0.86 | 0.93 |
| RMSE (mm) | 25.30 | 23.06 | 16.83 | 15.50 | 20.76 | 15.52 | 20.36 | 7.60 | 9.73 | 7.84 | 54.09 | 43.16 | 93.90 | 50.95 |
| PBIAS (%) | 10.87 | −4.21 | 9.63 | −1.01 | −7.64 | −9.76 | 13.65 | 12.33 | 9.42 | −8.21 | 4.03 | 5.74 | −1.79 | 16.77 |
| Grid | Annual Rainfall | Mean Annual Maximum Temperature | Mean Annual Minimum Temperature | ||||||
|---|---|---|---|---|---|---|---|---|---|
| Β | Z | p | β | Z | p | Β | Z | p | |
| DVC1 | −0.666 | −0.095 | 0.009 | 1.008 | −0.011 | −1.635 | |||
| DVC2 | −2.140 | −0.422 | 0.002 | 0.300 | 0.000 | 0.027 | |||
| DVC3 | 3.184 | 0.640 | −0.009 | −0.953 | 0.015 | 2.724 | ** | ||
| DVC4 | −5.866 | −1.430 | 0.000 | 0.014 | −0.010 | −1.376 | |||
| DVC5 | 12.298 | 1.321 | −0.007 | −0.477 | 0.016 | 3.337 | ** | ||
| Month | DVC1 | DVC2 | DVC3 | DVC4 | DVC5 | ||||||||||
|---|---|---|---|---|---|---|---|---|---|---|---|---|---|---|---|
| β | Z | p | Β | Z | p | β | Z | p | β | Z | p | β | Z | p | |
| Jan | −0.190 | −0.913 | −0.108 | −0.599 | −0.094 | −0.627 | −0.056 | −0.899 | −0.214 | −2.384 | ** | ||||
| Feb | −0.375 | −1.403 | −0.122 | −0.504 | −0.133 | −0.395 | −0.010 | −0.286 | −0.058 | −1.389 | |||||
| Mar | 0.024 | 0.313 | −0.048 | −0.232 | 0.000 | −0.054 | 0.000 | −0.354 | 0.000 | −0.272 | |||||
| Apr | −0.265 | −1.131 | −0.217 | −0.804 | −0.002 | −0.014 | −0.035 | −0.490 | −0.035 | −0.899 | |||||
| May | 0.033 | 0.068 | −0.271 | −0.449 | 0.274 | 0.313 | −0.185 | −0.504 | 0.395 | 0.586 | |||||
| Jun | 1.750 | 1.240 | 2.976 | 1.566 | 2.205 | 1.267 | −0.295 | −0.150 | 4.488 | 2.193 | ** | ||||
| Jul | −0.303 | −0.204 | −1.925 | −1.212 | 0.666 | 0.395 | −2.190 | −0.940 | 1.906 | 0.804 | |||||
| Aug | 0.034 | 0.027 | −1.613 | −0.776 | 0.432 | 0.327 | −1.779 | −0.885 | 3.406 | 1.321 | |||||
| Sep | −0.400 | −0.286 | −2.013 | −0.994 | −0.058 | −0.068 | −0.993 | −0.667 | 1.252 | 0.313 | |||||
| Oct | 0.710 | 0.722 | 0.215 | 0.232 | 0.917 | 0.804 | −1.343 | −1.471 | 1.098 | 0.558 | |||||
| Nov | 0.000 | −0.504 | 0.000 | 0.204 | 0.000 | −0.817 | 0.000 | 0.000 | 0.000 | −1.240 | |||||
| Dec | 0.000 | 0.368 | 0.000 | 0.463 | 0.000 | 0.640 | 0.000 | −0.368 | 0.000 | −0.708 | |||||
| Month | DVC1 | DVC2 | DVC3 | DVC4 | DVC5 | ||||||||||
|---|---|---|---|---|---|---|---|---|---|---|---|---|---|---|---|
| β | Z | p | Β | Z | p | β | Z | p | β | Z | p | β | Z | p | |
| Jan | −0.011 | −0.776 | −0.022 | −1.226 | −0.041 | −2.574 | ** | −0.027 | −1.526 | −0.040 | −2.520 | ** | |||
| Feb | 0.029 | 1.158 | 0.014 | 0.599 | −0.005 | −0.218 | 0.123 | 0.586 | −0.005 | −0.150 | |||||
| Mar | 0.011 | 0.463 | 0.001 | 0.095 | −0.140 | −0.504 | 0.006 | 0.327 | −0.009 | −0.422 | |||||
| Apr | −0.006 | −0.286 | −0.022 | −0.940 | −0.040 | −1.471 | −0.016 | −0.640 | −0.035 | −1.253 | |||||
| May | −0.001 | −0.027 | −0.013 | −0.354 | −0.022 | −0.695 | −0.008 | −0.422 | −0.012 | −0.272 | |||||
| Jun | −0.002 | −0.014 | −0.002 | −0.054 | 0.006 | 0.163 | −0.004 | −0.095 | 0.008 | 0.150 | |||||
| Jul | 0.028 | 1.716 | * | 0.024 | 1.580 | 0.018 | 1.376 | 0.027 | 1.675 | * | 0.026 | 1.812 | * | ||
| Aug | 0.008 | 0.940 | 0.012 | 1.335 | 0.012 | 1.226 | 0.012 | 1.526 | 0.012 | 1.376 | |||||
| Sep | 0.010 | 1.090 | 0.007 | 0.667 | 0.001 | 0.041 | 0.010 | 0.994 | 0.005 | 0.477 | |||||
| Oct | −0.010 | −0.667 | −0.016 | −1.062 | −0.030 | −1.716 | * | −0.013 | −0.926 | −0.020 | −1.131 | ||||
| Nov | 0.027 | 1.839 | * | 0.017 | 1.321 | −0.003 | −0.027 | 0.009 | 0.763 | 0.006 | 0.531 | ||||
| Dec | 0.018 | 1.294 | 0.007 | 0.640 | −0.011 | −0.831 | 0.004 | 0.272 | −0.011 | −0.872 | |||||
| Month | DVC1 | DVC2 | DVC3 | DVC4 | DVC5 | ||||||||||
|---|---|---|---|---|---|---|---|---|---|---|---|---|---|---|---|
| Β | Z | p | Β | Z | p | β | Z | p | β | Z | p | β | Z | p | |
| Jan | −0.027 | −1.090 | −0.021 | −1.035 | −0.011 | −0.436 | −0.023 | −1.566 | −0.014 | −0.667 | |||||
| Feb | 0.006 | 0.313 | 0.012 | 1.035 | 0.029 | 2.207 | ** | 0.011 | 0.708 | 0.034 | 2.820 | ** | |||
| Mar | −0.006 | −0.436 | 0.011 | 0.981 | 0.024 | 1.839 | * | 0.007 | 0.449 | 0.031 | 2.193 | ** | |||
| Apr | −0.020 | −1.171 | −0.004 | −0.259 | −0.003 | −0.191 | −0.172 | −1.062 | 0.003 | 0.136 | |||||
| May | −0.019 | −1.076 | −0.006 | −0.204 | 0.009 | 0.368 | −0.016 | −0.981 | 0.018 | 1.144 | |||||
| Jun | −0.025 | −1.539 | −0.007 | −0.667 | 0.007 | 0.749 | −0.017 | −1.389 | 0.009 | 1.226 | |||||
| Jul | −0.005 | −0.586 | 0.007 | 0.831 | 0.021 | 2.452 | ** | 0.001 | 0.054 | 0.025 | 2.765 | ** | |||
| Aug | −0.008 | −0.994 | 0.009 | 1.512 | 0.024 | 3.242 | ** | −0.005 | −0.681 | 0.026 | 3.201 | ** | |||
| Sep | −0.008 | −1.158 | 0.006 | 0.899 | 0.015 | 2.329 | ** | −0.007 | −0.722 | 0.020 | 2.438 | ** | |||
| Oct | −0.013 | −0.940 | −0.002 | −0.150 | 0.013 | 0.953 | −0.013 | −0.885 | 0.016 | 1.103 | |||||
| Nov | −0.019 | −0.872 | −0.008 | −0.259 | 0.014 | 0.558 | −0.016 | −0.967 | 0.012 | 0.627 | |||||
| Dec | −0.009 | −0.477 | 0.002 | 0.041 | 0.021 | 1.430 | −0.001 | −0.082 | 0.022 | 1.648 | * | ||||
| Scenarios | Land Use | Climate | Measured Inflow (m3/s) | Simulated Inflow (m3/s) | Change in Inflow (m3/s) | Change (%) |
|---|---|---|---|---|---|---|
| T1 | 1972 | 1971–1980 | 153.22 | 154.56 | - | - |
| T2 | 1990 | 1971–1980 | - | 157.60 | 3.04 | 1.97 |
| T3 | 2001 | 1971–1980 | - | 158.38 | 3.82 | 2.47 |
| T4 | 1972 | 1981–1990 | - | 161.55 | 6.99 | 4.52 |
| T5 | 1990 | 1981–1990 | 158.54 | 162.57 | 8.01 | 5.18 |
| T6 | 2001 | 1981–1990 | - | 163.07 | 8.51 | 5.51 |
| T7 | 1972 | 1991–2000 | - | 193.55 | 38.99 | 25.23 |
| T8 | 1990 | 1991–2000 | - | 194.27 | 39.71 | 25.69 |
| T9 | 2001 | 1991–2000 | 191.69 | 195.00 | 40.44 | 26.16 |
Disclaimer/Publisher’s Note: The statements, opinions and data contained in all publications are solely those of the individual author(s) and contributor(s) and not of MDPI and/or the editor(s). MDPI and/or the editor(s) disclaim responsibility for any injury to people or property resulting from any ideas, methods, instructions or products referred to in the content. |
© 2023 by the authors. Licensee MDPI, Basel, Switzerland. This article is an open access article distributed under the terms and conditions of the Creative Commons Attribution (CC BY) license (https://creativecommons.org/licenses/by/4.0/).
Share and Cite
Kumar, S.; Mishra, A.; Singh, U.K. Assessment of Land Cover Changes and Climate Variability Effects on Catchment Hydrology Using a Physically Distributed Model. Sustainability 2023, 15, 10304. https://doi.org/10.3390/su151310304
Kumar S, Mishra A, Singh UK. Assessment of Land Cover Changes and Climate Variability Effects on Catchment Hydrology Using a Physically Distributed Model. Sustainability. 2023; 15(13):10304. https://doi.org/10.3390/su151310304
Chicago/Turabian StyleKumar, Sanjeet, Ashok Mishra, and Umesh Kumar Singh. 2023. "Assessment of Land Cover Changes and Climate Variability Effects on Catchment Hydrology Using a Physically Distributed Model" Sustainability 15, no. 13: 10304. https://doi.org/10.3390/su151310304
APA StyleKumar, S., Mishra, A., & Singh, U. K. (2023). Assessment of Land Cover Changes and Climate Variability Effects on Catchment Hydrology Using a Physically Distributed Model. Sustainability, 15(13), 10304. https://doi.org/10.3390/su151310304


